Call-up number: HT372-174550/001/CY
POR Registration Number: POR 112-17
Contract date: 2018-03-05
Report date: March 2018
Research firm: Environics Research
Contract Value: $19,955.80 (HST included)
For more information on this report, please contact Hc.cpab.por.rop.dgcap.sc@canada.ca
Ce rapport est aussi disponible en français.
Environics included questions on a national online omnibus study on behalf of Health Canada. This project aimed to determine, through testing with a graphic online interface, the proportion of Canadians who are able to identify, from the packaging, foods that are high in sodium, sugar and saturated fat. These baseline indicators will be used to assess future nutrition labelling and education. The target audience of this research is the general population of Canadian adults (aged 18 and older).
This report provides the results from interviews with 2,000 Canadians, conducted between March 16 and March 23, 2018. The survey data was weighted by region, gender and age to match Canadian census data.
In this report, results are expressed as percentages unless otherwise noted. Results may not add to 100% due to rounding or multiple responses.
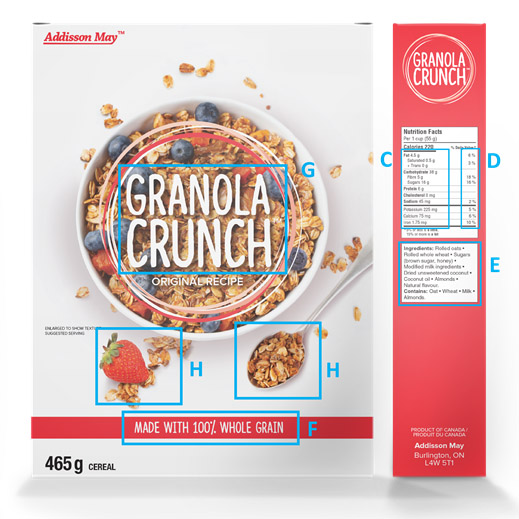
Product A (Correct Answer):
In this image of a cereal box, the nutritional facts indicate that per 1 cup (55g) of cereal, there is 16g of sugar. This is considered to be high in sugar because it is 16% of a person's daily value.
Product B (Incorrect Answer):
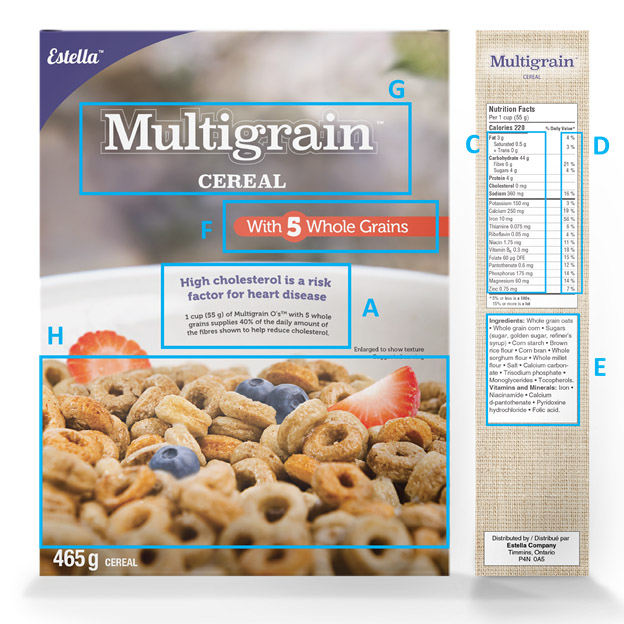
In this image of a cereal box, the nutritional facts indicate that per 1 cup (55g) of cereal, there is 4g of sugar. This is considered to be low in sugar because it is 4% of a person's daily value.
Overview of the results:
Which cereal is high in sugar? Base: All respondents (n=2,000)
More than eight in ten respondents (82%) correctly identified that Product A was the product that was considered high in sugar.
Median decision time: 44 seconds
Correct: 45 seconds
Incorrect: 43 seconds
| Length of time | Overall Proportion | Correct | Incorrect |
|---|---|---|---|
| 0-20 seconds | 15% | 13% | 23% |
| 21-40 seconds | 29% | 30% | 25% |
| 41-60 second | 23% | 24% | 19% |
| 1-2 minutes | 23% | 24% | 23% |
| 2+ minutes | 9% | 9% | 10% |
Question: What information on the cereal package did you use to make your decision? Please select the information you used (select all that apply).
Result: Three quarters of people who successfully identified the cereal high in sugar (Product A) used the nutrient amount in the Nutrition Facts Table (NFT):
| Information Used | Percentage |
|---|---|
| C: Nutrient amount in NFT | 73% |
| D: % Daily value | 48% |
| E: List of ingredients | 8% |
| G: Brand name | 4% |
| F: Marketing claim | 2% |
| H: Food image | 2% |
| Other | 1% |
| Did not use nutrition label info | 3% |
Respondents who incorrectly identified Product B as high in sugar using the following information to make their decision:
| Information Used | Percentage |
|---|---|
| C: Nutrient amount in NFT | 47% |
| D: % Daily value | 47% |
| E: List of ingredients | 18% |
| H: Food image | 10% |
| G: Brand name | 5% |
| A: Health claim | 4% |
| F: Marketing claim | 3% |
| Other | 1% |
| Did not use nutrition label info | 7% |
Product A (Incorrect Answer):
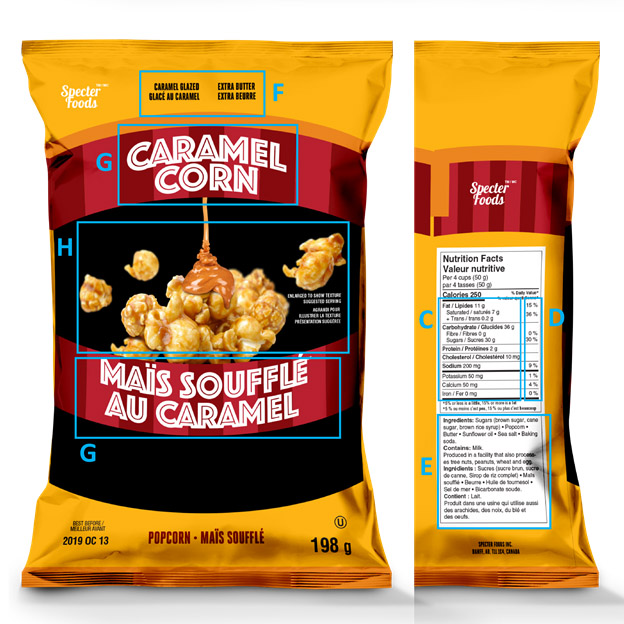
In this image of a bag of popcorn, the nutritional facts indicate that per 4 cups (50g) of popcorn, there is 200mg of sodium. This is considered to be low in sodium because it is 9% of a person's daily value.
Product B (Correct Answer):
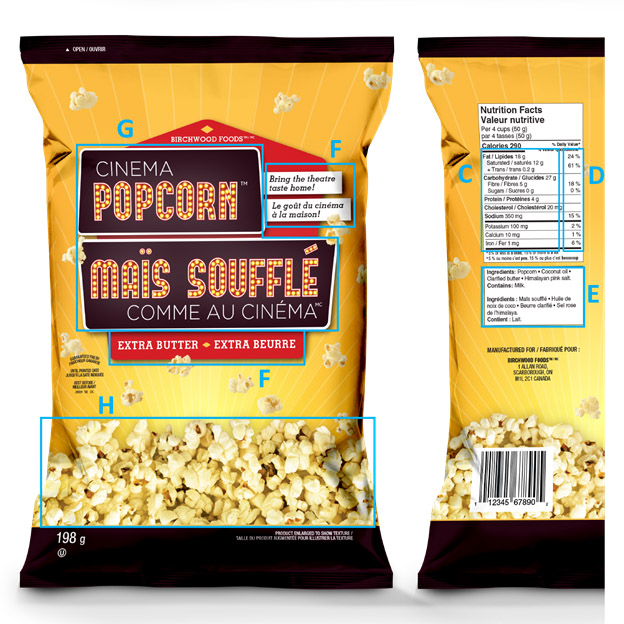
In this image of a bag of popcorn, the nutritional facts indicate that per 4 cups (50g) of popcorn, there is 350mg of sodium. This is considered to be high in sodium because it is 15% of a person's daily value.
Overview of the results:
Which popcorn is high in sodium? Base: All respondents (n=2,000)
Almost nine in ten respondents (88%) correctly identified the popcorn that was high in sodium (Product B).
Median decision time: 35 seconds
Correct: 36 seconds
Incorrect: 20 seconds
| Length of time | Overall Proportion | Correct | Incorrect |
|---|---|---|---|
| 0-20 seconds | 21% | 16% | 50% |
| 21-40 seconds | 37% | 40% | 17% |
| 41-60 second | 20% | 21% | 11% |
| 1-2 minutes | 16% | 17% | 14% |
| 2+ minutes | 6% | 6% | 8% |
Question: What information on the popcorn package did you use to make your decision? Please select the information you used (select all that apply).
Result: People who successfully identified the popcorn high in sodium (Product B) used the nutrient amount and the % daily value in the NFT to make their decision.
| Information Used | Percentage |
|---|---|
| C: Nutrient amount in NFT | 69% |
| D: % Daily value | 52% |
| E: List of ingredients | 6% |
| F: Marketing claim | 4% |
| G: Brand name | 3% |
| H: Food image | 1% |
| Other | 1% |
| Did not use nutrition label info | 3% |
Respondents who incorrectly identified Product A as high in sodium using the following information to make their decision:
| Information Used | Percentage |
|---|---|
| C: Nutrient amount in NFT | 44% |
| D: % Daily value | 39% |
| G: Brand name | 14% |
| H: Food image | 13% |
| E: List of ingredients | 8% |
| F: Marketing claim | 4% |
| Other | 0% |
| Did not use nutrition label info | 11% |
Product A (Correct Answer):

In this image of yogurt, the nutritional facts indicate that per 3/4 cups (175g) of yogurt, there is 5g of saturated fat. This is considered to be high in saturated fat because it is 27% of a person's daily value.
Product B (Incorrect Answer):
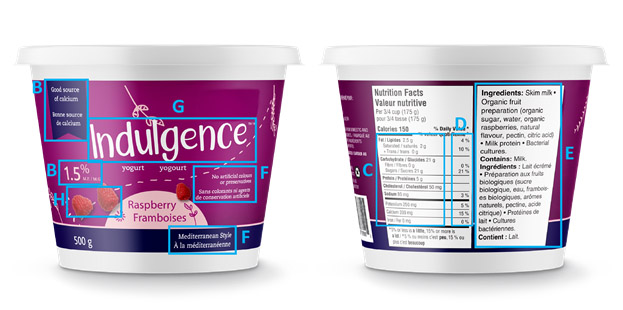
In this image of yogurt, the nutritional facts indicate that per 3/4 cups (175g) of yogurt, there is 2g of saturated fat. This is considered to be low in saturated fat because it is 10% of a person's daily value.
Overview of the results:
Which yogurt is high in saturated fat? Base: All respondents (n=2,000)
More than eight in ten respondents (84%) correctly identified the yogurt high in saturated fat.
Median decision time: 36 seconds
Correct: 37 seconds
Incorrect: 23 seconds
| Length of time | Overall Proportion | Correct | Incorrect |
|---|---|---|---|
| 0-20 seconds | 21% | 17% | 45% |
| 21-40 seconds | 36% | 39% | 23% |
| 41-60 second | 20% | 21% | 12% |
| 1-2 minutes | 16% | 16% | 14% |
| 2+ minutes | 7% | 7% | 7% |
Question: What information on the yogurt container did you use to make your decision? Please select the information you used (select all that apply)
Result: Those who correctly identified the yogurt high in saturated fat (Product A) used the nutrient amount in the NFT much more often than those who did not identify it correctly.
Respondents who correctly identified Product A as high in saturated fat reported using the following information to make their decision:
| Information Used | Percentage |
|---|---|
| C: Nutrient amount in NFT | 76% |
| D: % Daily value | 42% |
| B: Nutrient content claim | 7% |
| E: List of ingredients | 4% |
| G: Brand name | 3% |
| F: Marketing claim | 2% |
| H: Food image | 1% |
| Other | 0% |
| Did not use nutrition label info | 2% |
Respondents who incorrectly identified Product B as high in saturated fat reported using the following information to make their decision:
| Information Used | Percentage |
|---|---|
| D: % Daily value | 45% |
| C: Nutrient amount in NFT | 36% |
| G: Brand name | 13% |
| E: List of ingredients | 10% |
| B: Nutrient content claim | 8% |
| H: Food image | 5% |
| F: Marketing claim | 4% |
| Other | 1% |
| Did not use nutrition label info | 14% |
When shown two comparable products within a food category, the majority of Canadians were able to correctly identify the product high in the nutrient in question.
Those who identified the correct product were more likely to use the nutrient amount in the NFT and the % daily value than those who could not.
The determination of whether a product was high in a nutrient was based on a comparison between two specific products. The study did not measure whether Canadians could identify a product which is high in a given nutrient outside of the context of that comparison.
Survey respondents were drawn from a panel of individuals who have agreed to participate in online surveys. The data have been weighted to reflect the demographic composition of adult Canadians. Because the sample is based on those who initially self-selected for participation in the panel, no estimates of sampling error can be calculated and the results cannot be described as statistically projectable to the target population.
The sample design for this survey did not control for varying health literacy levels of the participants.