Marketing to Kids – Baseline Survey and Focus Groups on Recall of Food and Beverage Marketing – Final report
HC POR – 108-18
Prepared for Health Canada
For more information on this report, please email HC.cpab.por-rop.dgcap.SC@canada.ca
Supplier name: The Strategic Counsel
Contract #: HT372-184037/001/CY
Contract Award Date: January 18, 2019
Delivery Date: May 10, 2019
Contract Value: $99,343.95
Ce rapport est aussi disponible en français.
Marketing to Kids – Baseline Survey and Focus Groups on Recall of Food and Beverage Marketing
Final Report
Prepared for: Health Canada
Supplier Name: The Strategic Counsel
May 2019
This public opinion research report presents the results of an online survey conducted by The Strategic Counsel on behalf of Health Canada. The research study was conducted with 3,000 Canadian parents in March 2019.
Cette publication est aussi disponible en français sous le titre: La publicité destinée aux enfants : enquête de référence et groupes de discussion sur le souvenir de la publicité d'aliments et de boissons
This publication may be reproduced for non-commercial purposes only. Prior written permission must be obtained from Health Canada. For more information on this report, please contact Health Canada at: HC.cpab.por-rop.dgcap.SC@canada.ca or at:
Communications Branch and Public Affairs Branch
Health Canada
1576 Jeanne Mance Building
200 Eglantine Driveway
Ottawa, ON K1A 0K9
Catalogue Number:
H164-283/2019E-PDF
International Standard Book Number (ISBN):
978-0-660-31720-5
Related publications (registration number: POR # 108-18):
Catalogue Number: H164-283/2019F-PDF (Final Report, French)
ISBN: 978-0-660-31721-2
© Her Majesty the Queen in Right of Canada, as represented by the Minister of Health Canada 2019
Table of Contents
- Executive Summary
- Overview of Methodology
- Key Findings
- Conclusions
- Detailed Findings: Quantitative Research
- Respondent Profile
- Gender
- Age of Parent
- Age and Number of Children
- Size of Household
- Marital Status
- Employment Status
- Parent's Role in Household
- Frequency Child Accompanies Parent Grocery Shopping
- Food Skills and Eating Habits
- Food Preparation
- Eating Habits
- Familiarity with Canada's Food Guide
- Concern about Food and Beverage Marketing to Children
- Concern about Frequency of Child's/Children's Exposure
- General Attitudes about Food & Beverage Advertising to Children
- Exposure of Children and Parents to Food and Beverage Marketing
- Media Habits of Children
- Brand Recognition
- Extent of Influence of Various Media
- Exposure to Food & Beverage Marketing within the Last 30 Days
- Participation in Activities Sponsored by Food and Beverage Companies
- Purchase of Branded Items and Other Interactions with Food & Beverage Companies
- Extent and Impact of Pester Power
- Frequency of Child Pestering and Response by Parents
- Purchases in Response to Child's Request
- Perceived Impact of Food & Beverage Marketing on Child
- Respondent Profile
- Detailed Findings: Qualitative Research
- Overview of Focus Groups
- Concerns about Food and Beverage Marketing to Children
- Degree and Nature of Concern
- Perceived Vulnerability of Children Relative to Others
- Age at Which Children Begin to Become More Attuned to Marketing
- Views on Food and Beverage Marketing Tactics Aimed at Children
- Food and Beverage Categories Perceived to Market More Directly to Children
- Dominant Marketing Tactics
- Brand and Packaging Elements That Attract Children's Attention
- Logos
- Product Packaging
- Movie Concession Items
- The Impact of Grocery Store Displays
- Grocery Shopping Habits
- Regular Store Displays
- Seasonal Store Displays
- Screen Time and Other Relevant Feedback
- Detailed Methodology
- Quantitative Component
- Sample Design
- Pre-test
- Response Rates/Completion Rates
- Indices and New Variables
- Respondent Profile – Additional Details
- Qualitative Component
- Quantitative Component
- Appendix A – Surveys (English and French)
- Appendix B – Recruiting Scripts (English and French)
- Appendix C – Moderator's Guides (English and French)
I. Executive Summary
Evidence shows that, during their formative years, children are highly susceptible to marketing efforts. Research also shows that lifelong dietary habits are established during the early childhood years and that, despite many parents' interest and efforts in developing healthy eating habits, children (especially those over age six) wield a considerable amount of influence and purchasing power. In the food and beverage sector, aggressive marketing of products that are high in salt, fat, or sugar has been identified as a major contributor to trends showing an increase in the rate of overweight and obesity among Canadian children.
This research study was designed to provide Health Canada with further insights on the issue of food and beverage marketing to children from the perspective of both parents and children, by assessing:
- Children's and parents' awareness of advertising, including whether parents think their children have seen advertisements for certain foods, and if so, where and for which categories of foods.
- Children's interest in and desire for advertised foods, based on parents' response to questions about the extent and nature of requests for certain foods made by their children, otherwise known as Pester Power.1
- How parents respond to food requests (action), particularly whether their food purchasing is influenced by children's requests for certain foods, and if so, for what foods.
- Parents' concern over advertising of certain foods and whether the level of concern is trending up or down.
A. Overview of Methodology
A two-phased approach was implemented to address the above-noted research objectives, utilizing both quantitative and qualitative methodologies. In the first phase, an online survey was conducted among parents in households where at least one children was between the ages of 2 and 12 years. The survey was in field between March 8th and 20th, 2019 yielding a total sample of 3,000 respondents. Following completion of the survey, a series of eight focus groups were held, four in Toronto and four in Montreal (in French), on April 27, 2019. In each center, two focus groups were held with parents while, simultaneously, two focus groups were also held with children. The groups with children were segmented by age and grade level (6-8 years and 9-12 years). These discussions provided an opportunity to further explore and elaborate on the survey. Results from the survey are reported on in Section II, while the qualitative findings are covered in Section III.
Additional details on the methodology can be found in Section IV.
B. Key Findings
Parents are concerned about food and beverage marketing to children, but feel somewhat powerless in an era of hyper commercialization and heavy consumerism, and in the face of ubiquitous marketing to children, many of whom are online at an early age.
- Most parents (67%) are at least modestly, if not strongly, concerned about their child's exposure to food and beverage marketing (48% somewhat concerned; 19% very concerned). Similar numbers agree that their children are exposed to too much food and beverage advertising (65%) and specifically that much of the advertising is focused on products that are unhealthy for children.
- While parents feel a sense of responsibility to protect their children, they also find it challenging. 65% say it's difficult for parents to monitor and control the food and beverage advertising to which their children are exposed and 53% agree that advertising of foods and beverages makes it more difficult for parents to raise healthy children. In focus groups, the majority of parents, including those who initially exhibited less concern about this issue, felt overwhelmed and challenged by the pervasive nature of marketing. Many simply don't know what they can do to mitigate or counter its impact on their children.
Some parents are also of the view that, relative to when they were growing up, marketing aimed at children today is more pervasive but also more subtle. This is a reflection of the increasingly integrated marketing communications strategies utilized by food and beverage companies. The embedded nature of the marketing (i.e., tie-ins or promotions with movies and online games, product placements, etc.) makes it 'feel' less invasive or intrusive. It is seen as a more natural and accepted extension of the child's activity.
- In focus groups parents commented that they believe their children are less exposed to what they describe as 'random' marketing than they were at the same age. What has changed is how and what children are viewing. Specifically, children today are not 'appointment viewing' in the same way that their parents were and, as a result, their view is that they are not bombarded with unrelated or irrelevant advertising and marketing.
- Parents do, however, acknowledge that exposure is more pervasive online. But, the advertising is typically accepted as integral to the activity the child is undertaking online. While parents believe their children are vulnerable, their comments also suggest a sense of helplessness and perhaps some degree of desensitization (both parents and children) to the current volume and impact of marketing.
- At the same time, after completing the survey or participating in a 90-minute discussion on the topic, we did note an uptick in expressed concern as parents become more aware of the many, mostly non-traditional, ways in which food and beverage companies now market their products to children.
Parents believe that children are highly 'brand aware,' and particularly so for specific brands within the fast-food, cookie and cereal categories.
- Parents say their children are readily able to identify many brands across various food and beverage categories. Survey responses show that recognition rates do vary across categories – highest for McDonald's, but also reasonably strong for products such as Oreo cookies, Cheerios and Froot Loops. Brand recognition within the candy/chocolates category is much lower, although some products (Kit Kat, Smarties and Kinder Eggs) do stand out.
- In focus groups, we noted stronger evidence of widespread brand recognition beginning at an early age. Most parents said their children were familiar with many of the brands tested in the groups, and children themselves confirmed this.
Brand awareness appears to begin at a young age, and develops rapidly.
- While older children are more likely to be familiar with a wider array of brands across categories, parents of younger children also indicate they demonstrate fairly high levels of brand awareness.
- Survey findings indicate that many children have access to many devices which would increase their exposure, in particular to online marketing. Access to devices such as iPads, tablets, video game consoles, portable music devices and cell phones with data plans tends to be higher in households with older children, aged 7 to 12. However, in some cases, a quarter of households with children aged 2 to 6 only also indicated their children had access to a number of these devices.
Parents are of the view that children are attracted to a combination of elements in terms of logo and package design, particularly anthropomorphic characters, play elements, playful font style, and colourful design.
- Cartoon-style characters with anthropomorphic features, playful aspects (i.e., something on the packaging which suggests playful ways in which the product can be consumed such as dipping crackers, etc.), and colourful package design. Each of these elements works effectively on its own, but they are most powerful when applied in combination.
- Animated characters incorporating attributes associated with youthfulness, more so than human figures. Characters or imagery reflecting an older demographic (Aunt Jemima or Paul Newman) are automatically viewed as targeting an adult audience.
- Expressive characters, exuding a friendly, welcoming style or tone (i.e., wide eyes, bright smiles).
- A bright colour palette, typically employing a range of primary colours (red, yellow and blue) and in particular, use of rainbow colouring signals quite clearly to children that the product is intended for them.
- Packaging which illustrates the product itself and gives them a sense of what it might taste like (i.e., a half-eaten cookie). While other design elements might be lacking on these packages, children are understandably drawn to products that look delicious and illustrate recognizable ingredients which they associate with a pleasurable or fun eating experience (i.e., chocolate, marshmallow filling, etc.).
Parents feel that their children are highly susceptible to many of the standard marketing tactics employed by food and beverage companies, including collectibles, tie-ins and promotional activities associated with movies and child-specific menu items.
- Any type of packaging which in itself incorporates a play element or some type of collectible toy, as is often the case in beverage and popcorn containers at movie concessions as well as in many fast-food outlets, has strong appeal among children.
- Tie-ins with movies and certain movie characters are highly effective marketing tools. Collectibles in particular are keenly desired by children and acknowledged by both parents and children alike as an important part of the movie experience.
Children are exposed to food and beverage advertising across a wide range of media – traditional, in-location, and online – although the format varies to some extent by the age of the child.
- TV and in-store exposure are the most prevalent ways in which children are exposed to food and beverage marketing, according to their parents, along with fast-food or take-out restaurants.
- The power of the Internet, particularly YouTube, as a marketing channel is also quite evident. Although falling outside the top 5 marketing tactics identified by respondents to the survey, the influence of online activity, and YouTube specifically, was evident in comments by both parents and children in focus groups. In the survey, a slightly higher percentage of parents identified YouTube as having a great deal or a lot of influence on their children when it comes to food and beverage marketing compared to the proportion citing the Internet in general (46% versus 38% respectively), although there is likely a bit of overlap between these two categories. The impact of YouTube was also clear from results on a question about children's media habits. Even in households with children aged 2 to 6 years only, almost one-third of parents indicated that their children were spending at least one hour a day on YouTube. This percentage increases in households with children spanning the younger and older age groups (38%) and is higher still for those households with children in the older age group, aged 7 to 12 only (46%).
- In general, parents with older children only in their household are more likely to report exposure of their children to food and beverage marketing via the Internet, movie theatres, vending machines, social media, radio and online games, compared to those in households with younger children only.
In general, parents are somewhat reluctant to admit that food and beverage advertising affects the choices of products they buy, although it is evident from this study that a high degree of Pester Power is in play. This links to the earlier finding that parents are unsure of exactly what they can do to minimize or counter aggressive marketing tactics.
- Ultimately, parents see themselves as the final arbiter of what their children eat. While many parents (79%) agree that advertising by the food and beverage industry affects the choices or requests that children make, vastly fewer (58%) agree that it influences what parents buy. This 21-point gap suggests that parents may be downplaying or understating the extent to which they do give in to children's requests for specific foods and beverages based on marketing to which they have been exposed.
- This phenomenon was more clearly evident in the focus groups where parents stressed their role as 'gatekeepers,' but also clearly identified logos, foods and product packaging which their children would readily recognize and which they acknowledged having purchased, often under some pressure.
Consistent with other research on this topic, respondents from Quebec were less likely to express concerns about the exposure of their children to food and beverage marketing.
- The province of Quebec has had legislation in place since the early 1980s to protect children from advertising. Under Quebec law companies are not permitted to advertise to children under age 13. Data from this survey shows the legislation has had some impact in that Francophone parents are generally less concerned about food and beverage marketing to their children and indicate their children are less exposed to it. Over 40 percent of Francophone respondents fall into the 'low exposure' category.
- Similarly, Pester Power is felt less by Francophone parents who were less likely to say their children requested products and, even when they did, these parents were less likely to purchase them.
- At the same time, the one area where they do feel their children are more exposed is via in-store displays. This makes sense given the efforts to restrict TV advertising do not extend to restrictions on packaging or to other marketing tools and tactics which are becoming more effectively utilized by companies and increasingly integrated into their marketing strategies.
C. Conclusions
Combined, the survey results and findings from the focus groups underscore wide and pervasive exposure of children in the 2 to 12 age range to food and beverage marketing. While TV remains a key channel, children are also exposed via in-store displays and product packaging, in addition to a plethora of online marketing techniques which may appear as pop-ups but are often now increasingly central to or indistinguishable from the online activities in which the children are engaged.
As a result, while parents express some concern about this issue, and more so once they have completed a survey or participated in a two-hour discussion on the topic, they lack a strong sense of agency to address the issue. In some respects they also feel that their own food and beverage preferences, and purchasing patterns, may be contributing to increased brand recognition and affinity by their children.
Survey results show clear evidence of Pester Power and the extent to which parents acquiesce, although they do their utmost to make wise choices when it comes to their children's diets. In many respects, parents feel quite helpless against the tide of advertising and marketing. And, many parents who express some concern are unsure what can be done to adequately address this issue.
MORE INFORMATION
Supplier Name: The Strategic Counsel
PWGSC Contract Number: HT372-184037/001/CY
Contract Award Date: 2019-01-18
Contract Budget: $99,343.95
To obtain more information on this study, please e-mail HC.cpab.por-rop.dgcap.SC@canada.ca
Statement of Political Neutrality
I hereby certify as a Senior Officer of The Strategic Counsel that the deliverables fully comply with the Government of Canada political neutrality requirements outlined in the Communications Policy of the Government of Canada and Procedures for Planning and Contracting Public Opinion Research. Specifically, the deliverables do not include information on electoral voting intentions, political party preferences, standings with the electorate or ratings of the performance of a political party or its leaders.
Signed: ___________________________________
Donna Nixon, Partner
II. Detailed Findings: Quantitative Research
A. Respondent Profile
For the quantitative phase of this research, a non-probability sampling approach was undertaken to gather the opinions of parents with children between the ages of 2 to 12 years old. Because the survey was intended to target a more narrowly defined sub-group of the general population, no hard quotas (outside of region) were set for this study (i.e., age, gender, educational attainment). We aimed to get a reasonable cross-section of respondents by age, gender and educational attainment and monitored these variables throughout the period this survey was in field.
In order to interpret the findings within the report, the profile information below offers a snapshot of the parents who participated in the survey in terms of standard demographics (such as gender, age, marital status, employment status and household composition) and other key analytical variables (such as the number and age of children, the parents role within the household, and frequency of grocery shopping).
1. Gender
The final sample comprised a relatively equal split of men (47%) and women (53%). Less than 1% of respondent's identified as a member of the LGBTQ community.
Q1. Please indicate your gender.
| Male | Female | Age 18-34 |
Age 35-44 |
Age 45+ |
Only have children 2 to 6 |
Only have children 7 to 12 |
Have both | ||
|---|---|---|---|---|---|---|---|---|---|
| n= | 3000 | 1412 | 1578 | 622 | 1482 | 896 | 798 | 1497 | 704 |
| % | % | % | % | % | % | % | % | % | |
| Male | 47 | 100 | - | 25 | 46 | 65 | 43 | 50 | 46 |
| Female | 53 | - | 100 | 74 | 54 | 35 | 57 | 50 | 53 |
| Non-binary, LGBTQ | <1 | - | - | 1 | <1 | <1 | <1 | <1 | <1 |
Looking at gender and age of a parent, it's interesting to note that a larger proportion of men were 45 years of age or older (65%) whereas a larger proportion of women were between the age of 18 and 34 (74%). Age and gender differences described throughout this report reflect the skew to older men and younger women in the final sample.
2. Age of Parent
Not surprisingly, when it comes to age, almost half of parents surveyed (49%) were between the ages of 35 and 44. A smaller, but still significant, proportion of respondents belong to Generation X, age 45-54 (26%). Young parents (aged 18-34) account for one-in-five (20%) respondents within the overall sample.
Q2. What is your age?
| TOTAL | Male | Female | Age 18-34 |
Age 35-44 |
Age 45+ |
Only have children 2 to 6 |
Only have children 7 to 12 |
Have both | |
|---|---|---|---|---|---|---|---|---|---|
| n= | 3000 | 1412 | 1578 | 622 | 1482 | 896 | 798 | 1497 | 704 |
| % | % | % | % | % | % | % | % | % | |
| 18-24 | 1 | 1 | 2 | 7 | - | - | 4 | <1 | 1 |
| 25-34 | 19 | 10 | 27 | 93 | - | - | 38 | 6 | 26 |
| 35-44 | 49 | 48 | 51 | - | 100 | - | 48 | 45 | 61 |
| 45-54 | 26 | 35 | 18 | - | - | 87 | 9 | 41 | 11 |
| 55-64 | 4 | 6 | 2 | - | - | 12 | 1 | 6 | 1 |
| 65 or older | <1 | 1 | - | - | - | 1 | <1 | 1 | - |
3. Age and Number of Children
Overall, the age of children is quite evenly distributed. Each individual age, between 2 and 12 years old, makes up between 12-18% of the total sample. However, there is a slight skew towards children aged 7-12 (73%) versus children aged 2-6 (50%) in the overall sample.
In terms of the number of children aged 2 to 12 in each household, the vast majority of parents surveyed (89%) report having either one (49%) or two (40%). Only one-in-ten (12%) parents report having 3 or more children.
Throughout the report, the findings suggest that the age of children (younger versus older) has an influence on many parents attitudes and behaviours, including but not limited to the use of Canada's Food Guide, whether children accompany their parents to the grocery store, parents concerns around particular aspects of food and beverage marketing as well as where and what types of food/beverages they are exposed to in advertising.
Q2. Please indicate how many children you are responsible for who are between the 2 and 12 years of age. [Multi-mention]
| TOTAL | Male | Female | Age 18-34 |
Age 35-44 |
Age 45+ |
Only have children 2 to 6 |
Only have children 7 to 12 |
Have both | |
|---|---|---|---|---|---|---|---|---|---|
| n= | 3000 | 1412 | 1578 | 622 | 1482 | 896 | 798 | 1497 | 704 |
| % | % | % | % | % | % | % | % | % | |
| AGE OF CHILD | |||||||||
| NET – CHILDREN 2-6 YEARS OLD | 50 | 48 | 52 | 84 | 55 | 19 | 100 | - | 100 |
| 2 years old | 12 | 9 | 14 | 26 | 11 | 3 | 24 | - | 23 |
| 3 years old | 13 | 11 | 15 | 28 | 13 | 3 | 32 | - | 19 |
| 4 years old | 14 | 13 | 14 | 30 | 12 | 5 | 32 | - | 22 |
| 5 years old | 15 | 15 | 14 | 20 | 18 | 5 | 31 | - | 27 |
| 6 years old | 14 | 14 | 14 | 18 | 17 | 8 | 27 | - | 31 |
| NET- CHILDREN 7-12 YEARS OLD | 73 | 76 | 71 | 47 | 74 | 91 | - | 100 | 100 |
| 7 years old | 16 | 17 | 15 | 17 | 19 | 10 | - | 16 | 34 |
| 8 years old | 14 | 15 | 14 | 12 | 15 | 13 | - | 15 | 27 |
| 9 years old | 15 | 14 | 15 | 11 | 16 | 16 | - | 20 | 20 |
| 10 years old | 17 | 18 | 15 | 9 | 17 | 22 | - | 24 | 19 |
| 11 years old | 15 | 16 | 15 | 7 | 16 | 21 | - | 24 | 15 |
| 12 years old | 18 | 19 | 18 | 7 | 16 | 30 | - | 31 | 13 |
| NUMBER OF CHILDREN | |||||||||
| 1 child | 49 | 49 | 49 | 38 | 43 | 67 | 54 | 69 | - |
| 2 children | 40 | 41 | 39 | 43 | 45 | 28 | 41 | 28 | 62 |
| 3 children | 9 | 8 | 10 | 14 | 9 | 5 | 4 | 3 | 27 |
| 4 + | 3 | 3 | 3 | 5 | 3 | 1 | <1 | <1 | 11 |
When looking at age and number of children in combination, interestingly half of respondents (50%) only have older children (aged 7 to 12). Meanwhile, about one quarter (27%) have only young children (between the ages of 2 and 6) and another quarter (23%) have children that fit into both age categories.
Not unexpectedly, the children of younger parents (aged 18-34) are more likely to be in the younger age range, 2-6 years of age (84%, compared to 50% overall), whereas older parents tend to have children in the older age cohort, aged 7-12 (91%, compared to 73% overall).
4. Size of Household
In order to gain a better understanding of household demographics, respondents were asked about the number of people in their household and whether or not they had other children outside of the 2-12 age range.
Number in Household
The plurality of parents surveyed (45%) have a family of 4 residing in their household. Another one in five respondents report having either three (22%) or five (19%) people residing in their household. Only 5% or fewer are single parents.
Q7. Including yourself, how many people reside in your household?
| TOTAL | Male | Female | Age 18-34 |
Age 35-44 |
Age 45+ |
Only have children 2 to 6 |
Only have children 7 to 12 |
Have both | |
|---|---|---|---|---|---|---|---|---|---|
| n= | 3000 | 1412 | 1578 | 622 | 1482 | 896 | 798 | 1497 | 704 |
| % | % | % | % | % | % | % | % | % | |
| 2 | 5 | 2 | 6 | 4 | 4 | 5 | 4 | 7 | - |
| 3 | 22 | 22 | 21 | 17 | 21 | 27 | 26 | 28 | 4 |
| 4 | 45 | 50 | 42 | 44 | 47 | 44 | 51 | 44 | 42 |
| 5 | 19 | 18 | 21 | 23 | 19 | 17 | 14 | 16 | 33 |
| 6 or more | 9 | 8 | 10 | 12 | 8 | 7 | 5 | 5 | 20 |
| MEAN | 4 | 4 | 4 | 4 | 4 | 4 | 4 | 4 | 5 |
These findings are fairly consistent across key analytical variables.
Other Children
The majority of respondents (59%) report not having any other children younger than 2 or older than 12. Among parents with younger/older children, most have older teenagers (28% over the age of 12), while another one in six (16%) have a newborn or toddler under the age of 2.
Q6. Are you responsible for any other children, either younger than 2 of age or older than 12, who live with you?
| TOTAL | Male | Female | Age 18-34 |
Age 35-44 |
Age 45+ |
Only have children 2 to 6 |
Only have children 7 to 12 |
Have both | |
|---|---|---|---|---|---|---|---|---|---|
| n= | 3000 | 1412 | 1578 | 622 | 1482 | 896 | 798 | 1497 | 704 |
| % | % | % | % | % | % | % | % | % | |
| Net Yes | 41 | 41 | 42 | 47 | 36 | 47 | 40 | 47 | 31 |
| Yes, younger than 2 years of age | 16 | 13 | 18 | 40 | 13 | 4 | 33 | 5 | 17 |
| Yes, older than 12 years of age | 28 | 31 | 26 | 11 | 26 | 44 | 9 | 43 | 18 |
| No | 59 | 59 | 58 | 53 | 64 | 53 | 60 | 53 | 69 |
| Both <2 and >12 years | 2 | 2 | 2 | 4 | 2 | 1 | 2 | 2 | 4 |
Not unexpectedly, there is a correlation between the parent's ages, the age of their children who are between 2 and 12, and whether or not they have other children who are younger than 2 or older than 12. Notably:
- Younger parents are more likely to have other children under the age of 2, whereas older parents, over 45 years of age, are more likely to have additional children older than 12 years of age.
5. Marital Status
The vast majority of respondents report their marital status as married or in a common-law relationship (85%). Another one-in-seven (14%) identify as single - either divorced (7%), never married (6%) or widowed (1%).
Q37. What is your marital status?
| TOTAL | Male | Female | Age 18-34 |
Age 35-44 |
Age 45+ |
Only have children 2 to 6 |
Only have children 7 to 12 |
Have both | |
|---|---|---|---|---|---|---|---|---|---|
| n= | 3000 | 1412 | 1578 | 622 | 1482 | 896 | 798 | 1497 | 704 |
| % | % | % | % | % | % | % | % | % | |
| NET - Married or domestic partnership | 85 | 90 | 81 | 84 | 86 | 84 | 90 | 82 | 87 |
| NET - Single/Divorced/Separated | 14 | 9 | 17 | 14 | 13 | 14 | 9 | 17 | 12 |
| Single, never married | 6 | 4 | 8 | 11 | 6 | 3 | 6 | 6 | 7 |
| Divorced or separated | 7 | 5 | 8 | 3 | 7 | 10 | 3 | 10 | 4 |
| Widowed | 1 | 1 | 1 | 0 | 0 | 1 | 0 | 1 | 1 |
| Prefer not to answer | 1 | 1 | 1 | 1 | 1 | 1 | 1 | 2 | 1 |
6. Employment Status
A large proportion of parents surveyed (83%) are currently active in the workforce. While the majority are working full time (67%), some are working part time (10%) or are self-employed (7%). Only a small proportion are not working (14%) and this is primarily parents who are at home full-time with their children (9%).
Q36. Which of the following describes your current employment status?
| TOTAL | Male | Female | Age 18-34 |
Age 35-44 |
Age 45+ |
Only have children 2 to 6 |
Only have children 7 to 12 |
Have both | |
|---|---|---|---|---|---|---|---|---|---|
| n= | 3000 | 1412 | 1578 | 622 | 1482 | 896 | 798 | 1497 | 704 |
| % | % | % | % | % | % | % | % | % | |
| NET - Working | 83 | 93 | 75 | 72 | 86 | 87 | 81 | 87 | 79 |
| Working full-time, that is, 35 or more hours per week | 67 | 82 | 53 | 50 | 71 | 70 | 64 | 70 | 62 |
| Working part-time, that is, less than 35 hours per week | 10 | 3 | 16 | 14 | 10 | 7 | 10 | 9 | 10 |
| Self-employed | 7 | 8 | 7 | 8 | 5 | 10 | 8 | 7 | 6 |
| NET - Not working | 14 | 6 | 22 | 24 | 12 | 11 | 16 | 11 | 20 |
| Not in the workforce (i.e., Full-time homemaker, unemployed, not looking for work) | 9 | 2 | 16 | 17 | 9 | 5 | 11 | 6 | 13 |
| Unemployed, but looking for work | 3 | 2 | 3 | 5 | 2 | 2 | 2 | 2 | 4 |
| A student attending school full-time | 1 | 1 | 2 | 2 | 1 | 0 | 1 | 1 | 2 |
| Retired | 1 | 2 | 1 | 0 | 4 | 1 | 2 | ||
| Other | 1 | 1 | 2 | 2 | 1 | 1 | 1 | 1 | 1 |
| Prefer not to answer | 1 | 1 | 1 | 1 | 1 | 1 | 1 | 1 | 0 |
- Men are more likely to be working (93%) than women (75%). Women, who are not working, are more likely to be full time homemakers compared to men (16% versus 2%).
- Younger parents, aged 18-34, are less likely to be in the workforce (50%), compared to parents over the age of 35 (70-71%).
7. Parent's Role in Household
The survey collected data about the parent's responsibility among four specific food based roles including grocery shopping, meal planning, preparing family meals, and decision making when eating meals outside of the home. The chart below shows an aggregate of the findings from responses to each of these four household tasks. Details on how this index was created can be found in Section VI.
Generally speaking, most parents play an active role in their household overall. Three quarters of respondents (75%) report having a shared responsibility, while another one quarter say they hold the primary role in their household.
Q33. Which statement best describes your role in your household in each of the following areas?
| TOTAL | Male | Female | Age 18-34 |
Age 35-44 |
Age 45+ |
Only have children 2 to 6 |
Only have children 7 to 12 |
Have both | |
|---|---|---|---|---|---|---|---|---|---|
| n= | 3000 | 1412 | 1578 | 622 | 1482 | 896 | 798 | 1497 | 704 |
| % | % | % | % | % | % | % | % | % | |
| Shared | 75 | 85 | 66 | 72 | 74 | 78 | 76 | 73 | 76 |
| Primary | 25 | 14 | 34 | 28 | 26 | 21 | 24 | 26 | 23 |
| Not involved | 1 | 1 | <1 | <1 | <1 | 1 | <1 | 1 |
Of note, women are more likely to take on a primary role (34%) compared to men (14%).
A clear pattern emerges across four specific food based tasks. An almost even split, with about half of parents having the primary responsibility and the other half shared, is evident for tasks like shopping for groceries (52%, 43% respectively), planning and prepping meals and/or grocery lists (50%, 42%) and preparing meals (48%, 52%).
Looking at key demographics, women and younger parents aged 18-34 are more likely to have the primary responsibility for any of these tasks. Conversely, men and older parents over 45 years of age, are more likely to report having shared or no responsibility for these tasks.
| TOTAL | Male | Female | Age 18-34 |
Age 35-44 |
Age 45+ |
Only have children 2 to 6 |
Only have children 7 to 12 |
Have both | |
|---|---|---|---|---|---|---|---|---|---|
| n= | 3000 | 1412 | 1578 | 622 | 1482 | 896 | 798 | 1497 | 704 |
| % | % | % | % | % | % | % | % | % | |
| I have primary responsibility | 52 | 33 | 69 | 59 | 53 | 47 | 52 | 54 | 49 |
| I share responsibility | 43 | 59 | 30 | 38 | 43 | 47 | 45 | 41 | 47 |
| I don't usually do this | 4 | 8 | 1 | 3 | 4 | 6 | 4 | 5 | 4 |
| TOTAL | Male | Female | Age 18-34 |
Age 35-44 |
Age 45+ |
Only have children 2 to 6 |
Only have children 7 to 12 |
Have both | |
|---|---|---|---|---|---|---|---|---|---|
| n= | 3000 | 1412 | 1578 | 622 | 1482 | 896 | 798 | 1497 | 704 |
| % | % | % | % | % | % | % | % | % | |
| I have primary responsibility | 50 | 24 | 73 | 63 | 50 | 41 | 53 | 50 | 46 |
| I share responsibility | 42 | 60 | 26 | 34 | 43 | 47 | 41 | 41 | 45 |
| I don't usually do this | 8 | 15 | 1 | 4 | 7 | 12 | 6 | 8 | 9 |
| TOTAL | Male | Female | Age 18-34 |
Age 35-44 |
Age 45+ |
Only have children 2 to 6 |
Only have children 7 to 12 |
Have both | |
|---|---|---|---|---|---|---|---|---|---|
| n= | 3000 | 1412 | 1578 | 622 | 1482 | 896 | 798 | 1497 | 704 |
| % | % | % | % | % | % | % | % | % | |
| I have primary responsibility | 48 | 26 | 68 | 59 | 48 | 41 | 50 | 49 | 45 |
| I share responsibility | 42 | 56 | 29 | 35 | 42 | 46 | 41 | 41 | 45 |
| I don't usually do this | 10 | 18 | 3 | 6 | 10 | 13 | 9 | 10 | 10 |
Interestingly, this pattern shifts slightly when parents are deciding on where to go for meals eaten outside of the home, such as at a fast-food or sit-down restaurant. The majority of parents (65%) report having a shared responsibility for this decision, while just under one third say they primarily make the decision.
| TOTAL | Male | Female | Age 18-34 |
Age 35-44 |
Age 45+ |
Only have children 2 to 6 |
Only have children 7 to 12 |
Have both | |
|---|---|---|---|---|---|---|---|---|---|
| n= | 3000 | 1412 | 1578 | 622 | 1482 | 896 | 798 | 1497 | 704 |
| % | % | % | % | % | % | % | % | % | |
| I have primary responsibility | 32 | 24 | 40 | 36 | 32 | 30 | 32 | 34 | 30 |
| I share responsibility | 65 | 73 | 59 | 61 | 66 | 67 | 67 | 63 | 66 |
| I don't usually do this | 3 | 4 | 2 | 3 | 3 | 3 | 1 | 3 | 4 |
Again, women (40%) and younger parents (36%) are more likely to have the primary responsibility for this decision.
8. Frequency Child Accompanies Parent Grocery Shopping
Overall, children generally accompany parents when they are doing their grocery shopping. A slim majority of respondents (54%) say their child either 'frequently' or 'very frequently' accompanies them while grocery shopping. One third (33%) of parents say they are accompanied occasionally by their children at the grocery store.
Q26d. About how often does your child/do your children do each of the following – Go grocery shopping with you or another member of your household?
| TOTAL | Male | Female | Age 18-34 |
Age 35-44 |
Age 45+ |
Only have children 2 to 6 |
Only have children 7 to 12 |
Have both | |
|---|---|---|---|---|---|---|---|---|---|
| n= | 3000 | 1412 | 1578 | 622 | 1482 | 896 | 798 | 1497 | 704 |
| % | % | % | % | % | % | % | % | % | |
| Very frequently | 19 | 15 | 23 | 32 | 19 | 13 | 29 | 15 | 19 |
| Frequently | 34 | 36 | 33 | 34 | 36 | 32 | 36 | 32 | 36 |
| Occasionally | 33 | 35 | 31 | 26 | 34 | 37 | 28 | 36 | 33 |
| Rarely | 11 | 12 | 11 | 8 | 11 | 15 | 6 | 15 | 10 |
| Never | 2 | 2 | 2 | 1 | 2 | 3 | 1 | 2 | 2 |
| Very/frequently | 54 | 51 | 56 | 65 | 54 | 45 | 65 | 47 | 56 |
| Occasionally | 33 | 35 | 31 | 26 | 34 | 37 | 28 | 36 | 33 |
| Rarely/Never | 13 | 14 | 13 | 9 | 12 | 18 | 7 | 17 | 12 |
Younger parents (65%), with younger children (65%) and women (56%) are more likely to say that their child frequently accompanies them to the grocery store.
One in five parents in Quebec (18%) say they are 'rarely' or 'never' accompanied by their children to the grocery store.
B. Food Skills and Eating Habits
At the beginning of the survey, respondents were asked a series of questions to determine their food skills and their overall eating habits. The results suggest that respondents are generally well versed in preparing and cooking healthy meals for their household and have fairly good eating habits.
1. Food Preparation
As shown in the table below, the majority of parents (61%) use mostly whole basic foods to prepare the main meal of the day for their family, closely following the guidelines from Canada's Food Guide. Another one third (34%), report being slightly more lenient in their food preparation, reporting that their main meal consists of a mix of whole basic foods and easy to prepare foods. Only 5% of parents indicated that they primarily use easy to prepare foods (4%) or order take-out/delivery (1%).
Q9. When preparing the MAIN meal at home, which one of the following does your family do most often? By main meal we mean the meal of the day that requires the most preparation.
| TOTAL | Male | Female | Age 18-34 |
Age 35-44 |
Age 45+ |
Only have children 2 to 6 |
Only have children 7 to 12 |
Have both | |
|---|---|---|---|---|---|---|---|---|---|
| n= | 3000 | 1412 | 1578 | 622 | 1482 | 896 | 798 | 1497 | 704 |
| % | % | % | % | % | % | % | % | % | |
| We use mostly whole basic foods such as vegetables, fruits, pasta, legumes and meat | 61 | 62 | 61 | 58 | 61 | 63 | 61 | 61 | 61 |
| We use a mix of whole basic foods and easy to prepare foods | 34 | 33 | 35 | 34 | 34 | 33 | 32 | 34 | 34 |
| We use mostly easy to prepare foods such as frozen lasagna | 4 | 4 | 3 | 6 | 4 | 2 | 5 | 4 | 3 |
| We buy ready-to-eat food or order take-out or delivery | 1 | 1 | 1 | 1 | 1 | 1 | 1 | 1 | 1 |
There are some notable differences between sub-groups in terms of meal preparation.
- Those more likely to prepare a main meal with whole basic foods are those with excellent or very good eating habits (79%) and those who have a high level of cooking skill (65%). Comparatively, those with poorer eating habits and food skills are more likely to choose easy to prepare meals (9%) or take-out options (6%).
- Those who were not born in Canada (75%) and those who identify as Latin American (77%), Middle Eastern and African (70%), South Asian (73%) or East Asian (67%) are more likely to prepare their main meal using whole basic foods.
- When compared to other age cohorts, younger parents, aged 18-34, are more likely to practice limited food preparation, predominately ordering take-out/delivery or opting for easy to prepare meals (8%).
- The likelihood of cooking with whole basic foods increases with the number of people in a household. Those with four (62%), five (63%), or six or more (68%) people in a household are more likely to prepare healthy meals. Comparatively, households with two or three people are more likely to make easy to prepare foods (10%, 5% respectively) or order take-out/ delivery (5%, 2%).
In order to gauge respondent's competence to cook a meal from basic ingredients, respondents were asked to self-rate their cooking ability. The vast majority – just over eight-in-ten parents (81%) state that they can cook most dishes either on their own (38%), with a recipe (34%), or that they frequently prepare sophisticated dishes (10%).
Q10. Which one of the following best describes your ability to cook from basic ingredients?
| TOTAL | Male | Female | Age 18-34 |
Age 35-44 |
Age 45+ |
Only have children 2 to 6 |
Only have children 7 to 12 |
Have both | |
|---|---|---|---|---|---|---|---|---|---|
| n= | 3000 | 1412 | 1578 | 622 | 1482 | 896 | 798 | 1497 | 704 |
| % | % | % | % | % | % | % | % | % | |
| NET – SOPHISTICATED/MOST | 81 | 77 | 85 | 82 | 81 | 82 | 81 | 82 | 81 |
| I frequently prepare sophisticated dishes | 10 | 9 | 11 | 10 | 9 | 12 | 11 | 10 | 10 |
| I can prepare most dishes | 38 | 34 | 40 | 36 | 37 | 41 | 35 | 39 | 37 |
| I can cook most dishes if I have a recipe to follow | 34 | 33 | 34 | 37 | 35 | 29 | 36 | 33 | 34 |
| NET – SIMPLE COOKING TASKS | 17 | 21 | 14 | 17 | 18 | 17 | 18 | 17 | 17 |
| I can prepare simple meals, but nothing too complicated | 14 | 17 | 12 | 13 | 14 | 15 | 15 | 14 | 15 |
| I can do things such as boil an egg or cook a grilled cheese sandwich, but nothing more advanced | 3 | 4 | 2 | 4 | 3 | 2 | 3 | 3 | 3 |
| I don't know where to start when it comes to cooking | 1 | 2 | 1 | 1 | 2 | 2 | 1 | 1 | 2 |
Results are generally consistent across the key variables, however, women report having higher cooking expertise (85%), when compared to men (77%). Findings also vary by other standard demographics.
- Parents older than 55 years of age (90%) are more likely to exhibit higher cooking abilities, compared to those under 54 who are more likely to say that they can prepare simple meals.
- Those with higher educational attainment, such as a college diploma (83%) or university degree (82%), are more skilled in their food preparation indicating that they are able to cook most meals, including sophisticated dishes.
2. Eating Habits
As readers will note throughout the detailed findings of the report, positive eating habits have an influence on a variety of factors including how concerned parents are about their children's exposure to food and beverage marketing and the impact of Pester Power. With that in mind, respondents were asked to self-identify, on a scale of 'excellent' to 'poor', their current eating habits.
Overall, parents eating practices are generally healthy, with the majority (88%) stating that their habits are at least 'good'. However, only one third (36%) say their eating habits are 'very good' while 6% say 'excellent'. This suggests that many parents believe there is still room for improvement when it comes to eating properly.
Q8. In general, would you say that your eating habits are...?
| TOTAL | Male | Female | Age 18-34 |
Age 35-44 |
Age 45+ |
Only have children 2 to 6 |
Only have children 7 to 12 |
Have both | |
|---|---|---|---|---|---|---|---|---|---|
| n= | 3000 | 1412 | 1578 | 622 | 1482 | 896 | 798 | 1497 | 704 |
| % | % | % | % | % | % | % | % | % | |
| Excellent/Very good | 43 | 47 | 39 | 38 | 43 | 46 | 42 | 42 | 44 |
| Excellent | 6 | 7 | 6 | 6 | 6 | 6 | 7 | 6 | 6 |
| Very good | 36 | 40 | 33 | 32 | 36 | 40 | 35 | 37 | 38 |
| Good | 45 | 41 | 48 | 47 | 45 | 43 | 44 | 46 | 43 |
| Fair | 11 | 10 | 12 | 13 | 11 | 11 | 12 | 11 | 12 |
| Poor | 2 | 2 | 2 | 3 | 2 | 1 | 2 | 1 | 2 |
| Fair/Poor | 13 | 12 | 13 | 16 | 12 | 12 | 13 | 12 | 13 |
Upon review of key demographics, those more likely to self-report excellent or very good eating habits include:
- Respondents with higher socioeconomic status – university educated (52%) or an annual household income over $100K (48%)
- Men (47%, versus 39% of women)
- Older adults aged 45+ (46%), and more specifically adults over the age of 55 (55%)
Parents who report having fair or poor eating habits tend to be:
- Those with a lower socioeconomic status, who have attained high school or less education (20%) and are making less than $60K per year in household income (18%)
- Younger parents, aged 18-34 (16%)
Most parents are in the habit of purchasing food from take-out or fast-food restaurants at least once per month. Over three quarters (79%) say they purchase it routinely while just over half (54%) state that they purchase take-out/fast-food between 1-3 times per month. A quarter of parents (25%) frequently purchase fast food or take-out, at four or more times per month.
Q27. About how often do you purchase food or beverages at fast-food or take-out restaurants?
| TOTAL | Male | Female | Age 18-34 |
Age 35-44 |
Age 45+ |
Only have children 2 to 6 |
Only have children 7 to 12 |
Have both | |
|---|---|---|---|---|---|---|---|---|---|
| n= | 3000 | 1412 | 1578 | 622 | 1482 | 896 | 798 | 1497 | 704 |
| % | % | % | % | % | % | % | % | % | |
| NET Less than 1 x per month/Never | 21 | 19 | 23 | 19 | 22 | 21 | 21 | 20 | 23 |
| Never | 2 | 1 | 2 | 1 | 2 | 2 | 1 | 2 | 2 |
| Less than once a month | 19 | 17 | 21 | 17 | 20 | 19 | 20 | 18 | 21 |
| NET 1-3 X per month | 54 | 53 | 54 | 57 | 53 | 53 | 54 | 54 | 54 |
| Once a month | 22 | 21 | 23 | 25 | 21 | 20 | 23 | 21 | 23 |
| About 2 to 3 times a month | 32 | 32 | 32 | 31 | 32 | 32 | 32 | 33 | 31 |
| NET 4+ X per month | 25 | 28 | 23 | 25 | 25 | 27 | 24 | 27 | 24 |
| About once a week | 19 | 20 | 18 | 19 | 18 | 20 | 18 | 20 | 18 |
| Several times a week | 6 | 7 | 5 | 5 | 5 | 6 | 6 | 6 | 5 |
| Daily | 1 | 1 | <1 | <1 | 1 | <1 | 1 | <1 | 1 |
Interestingly, Francophones are less likely to order take-out compared to the rest of the parent population. Over a quarter (28%) say they only order take out less than once a month.
3. Familiarity with Canada's Food Guide
Respondents were asked about their familiarity with and use of Canada's Food Guide, both the old and new 2019 version. The responses to these questions provide contextual data which help us to understand the extent to which parents are at least aware of healthy eating habits and attempting to follow these practices.
Unprompted, less than half of parents (46%) say that they have used Canada's Food Guide, while the greatest proportion (54%) have not.
Q11. Have you ever used Canada's Food Guide?
| TOTAL | Male | Female | Age 18-34 |
Age 35-44 |
Age 45+ |
Only have children 2 to 6 |
Only have children 7 to 12 |
Have both | |
|---|---|---|---|---|---|---|---|---|---|
| n= | 3000 | 1412 | 1578 | 622 | 1482 | 896 | 798 | 1497 | 704 |
| % | % | % | % | % | % | % | % | % | |
| Yes | 46 | 37 | 54 | 56 | 46 | 40 | 49 | 46 | 44 |
| No | 54 | 63 | 46 | 44 | 54 | 60 | 51 | 54 | 56 |
Notably, those who are more likely to use the Guide are:
- Residents of the Atlantic region of Canada (66%)
- Younger parents, aged 18-34 (57%)
- Females (55%, versus 38% of men)
- Those who only have young children between the ages of 2-6 (50%)
- Those who were born in Canada (50%, versus 37% born outside of Canada)
In terms of attitudes towards food and beverage marketing and Pester Power, those who are more likely to use Canada's Food Guide are also more likely to be parents who:
- Frequently purchase products/brands requested by their children (53%)
- Are more concerned about their child's exposure to food and beverage marketing (52%)
- Agree that their children have been exposed to too much food and beverage marketing (51%)
- Believe that advertising influences parent's (50%) and children's choices (49%)
Those who reported using the guide, were then asked a follow up question to indicate which version they had used. Respondents were prompted with images (as per below) of the new Canada Food Guide (2019) and the old Canada Food Guide in order to assist with recall.
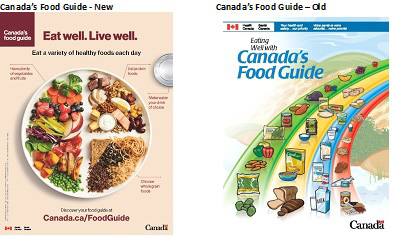
Text description: Figure 1. The pictures above depict the visual representations of Canada’s Food Guide. On the left is Canada’s Food Guide Snapshot released in 2019. The Snapshot provides a summary of Health Canada’s healthy eating recommendations and can be accessed online via a mobile friendly web application. On the right is the front cover of the previous version of Canada’s Food Guide which was released in 2007.
Among parents who report using Canada's Food Guide, over three quarters (77%) say they have used the old version. Women (80%) and those over 45 years of age (80%) were more likely to say they have used the old Guide.
Interestingly, one third of parents (33%) say they have used the new guide, released in 2019. Given that the newer version of Canada's Food Guide was launched two months prior to the fieldwork, it appears to have received good uptake from parents. Specifically among younger parents, between 18-34 years of age (40%) and parents who only have children between the ages of 2 and 6 (38%).
Q12. Please indicate which of the Guides you have used. [Multi-mention]
| TOTAL | Male | Female | Age 18-34 |
Age 35-44 |
Age 45+ |
Only have children 2 to 6 |
Only have children 7 to 12 |
Have both | |
|---|---|---|---|---|---|---|---|---|---|
| n= | 1404 | 534 | 863 | 353 | 685 | 366 | 396 | 694 | 313 |
| % | % | % | % | % | % | % | % | % | |
| The old Canada's Food Guide | 77 | 72 | 80 | 75 | 76 | 80 | 77 | 78 | 74 |
| The updated Canada's Food Guide, released in 2019 | 33 | 35 | 32 | 40 | 34 | 26 | 38 | 29 | 36 |
| I have used a different version of the Guide | 7 | 7 | 6 | 5 | 6 | 8 | 5 | 8 | 6 |
Parents primarily use Canada's Food Guide in order to assess how well (45%) and how much (39%) members of their household are eating. Approximately four-in-ten (38%) use it to plan meals or assist with grocery shopping.
Among those who have used the guide(s), a smaller but still significant proportion report using it to make healthy choices when eating outside of the home (29%), to choose foods for themselves (27%) or to manage their weight (22%). 6% state a variety of others uses for the Guide.
Q13. How have you used the Guide? [Multi-mention]
| TOTAL | Male | Female | Age 18-34 |
Age 35-44 |
Age 45+ |
Only have children 2 to 6 |
Only have children 7 to 12 |
Have both | |
|---|---|---|---|---|---|---|---|---|---|
| n= | 1389 | 528 | 854 | 350 | 677 | 362 | 390 | 688 | 310 |
| % | % | % | % | % | % | % | % | % | |
| To assess how well household members are eating | 45 | 47 | 43 | 43 | 44 | 47 | 43 | 46 | 42 |
| To determine how much household members need to eat every day | 39 | 33 | 42 | 41 | 40 | 35 | 37 | 39 | 39 |
| To plan meals or to help with grocery shopping | 38 | 39 | 37 | 42 | 37 | 36 | 39 | 36 | 42 |
| To help make healthy choices when eating away from home | 29 | 30 | 28 | 30 | 28 | 29 | 29 | 28 | 30 |
| To choose foods for myself | 27 | 29 | 26 | 30 | 31 | 19 | 29 | 26 | 29 |
| To manage my weight | 22 | 21 | 22 | 21 | 22 | 20 | 18 | 23 | 24 |
| Other | 6 | 4 | 7 | 5 | 6 | 7 | 5 | 6 | 7 |
Not unexpectedly, the use of the guide varies by subgroups. Of note:
- Women are more likely to use the guide to determine the amount of food each person should be eating daily (42%).
- Young parents, under 34 years of age, are more likely to use the guide to determine the amount needed for daily consumption (41%) and to choose food for themselves (30%).
C. Concern about Food and Beverage Marketing to Children
This section of questioning was intended to gauge the level of concern from parents about the frequency with which their child or children are exposed to food and beverage marketing, while also understanding which aspects of the marketing they find most concerning.
1. Concern about Frequency of Child's/Children's Exposure
As the table below highlights, the majority of parents (67%) are concerned about their child's exposure to food and beverage marketing, rating their concern as either somewhat concerned (48%) or very concerned (19%). Overall, one third of parents (33%) say they have little to no concern about such marketing.
Q14. How concerned are you about the frequency with which your child is/children are exposed to food and beverage marketing in Canada?
| TOTAL | Male | Female | Age 18-34 |
Age 35-44 |
Age 45+ |
Only have children 2 to 6 |
Only have children 7 to 12 |
Have both | |
|---|---|---|---|---|---|---|---|---|---|
| n= | 3000 | 1412 | 1578 | 622 | 1482 | 896 | 798 | 1497 | 704 |
| % | % | % | % | % | % | % | % | % | |
| NET CONCERNED | 67 | 66 | 67 | 67 | 66 | 68 | 67 | 66 | 68 |
| Very concerned | 19 | 19 | 19 | 20 | 18 | 20 | 20 | 18 | 20 |
| Somewhat concerned | 48 | 47 | 49 | 47 | 47 | 49 | 47 | 48 | 48 |
| Not very concerned | 29 | 29 | 29 | 30 | 30 | 26 | 29 | 29 | 28 |
| Not concerned at all | 4 | 5 | 4 | 4 | 4 | 5 | 4 | 5 | 4 |
| NET NOT CONCERNED | 33 | 34 | 33 | 33 | 34 | 32 | 33 | 34 | 32 |
Across the key analytical variables and standard demographics there are limited differences in terms of who is more/less concerned, with the exception of language. More Francophones are not concerned (45%) about the frequency in which their child or children are exposed to food and beverage marketing.
Concern also varies significantly across parent's food habits. Notably, those who have higher concern:
- Tend to make easy to prepare meals or order take-out for their main meal of the day (74%)
- Have used Canada's Food Guide (74%)
- Say their eating habits are very good or excellent (69%)
In an open-ended, unprompted question, respondents who said they were concerned about the frequency in which their child/children were exposed to food and beverage marketing were asked to identify their top reasons. Two main concerns dominate the responses. The first is that the advertising promotes food and beverage options that contribute to excess intakes of nutrients of concern to their children (59%), including foods that are high in sugar and fat with little nutritional value. Examples mentioned include pop, sugary drinks, and junk food such as snacks, chips, and candies. Additionally, over half of parents (52%) are concerned that food and beverage advertising provides misleading information to children, manipulating them and glamorizing said unhealthy food and beverages to be more appealing to children.
Q15. What particular aspects of food and beverage marketing to your child/children most concern you? [Open-end]
MENTIONS OF 3% OR HIGHER |
TOTAL | Male | Female | Age 18-34 |
Age 35-44 |
Age 45+ |
Only have children 2 to 6 |
Only have children 7 to 12 |
Have both |
|---|---|---|---|---|---|---|---|---|---|
| n= | 2002 | 930 | 1064 | 414 | 975 | 613 | 532 | 992 | 478 |
| % | % | % | % | % | % | % | % | % | |
| NET FOOD/BEVERAGES THAT MEET CERTAIN NUTRIENT CRITERIA | 59 | 58 | 60 | 59 | 59 | 60 | 59 | 61 | 55 |
| Amount of/high sugar | 22 | 22 | 22 | 18 | 24 | 21 | 22 | 23 | 21 |
| choices/foods/ options that meet certain nutrient criteria | 19 | 17 | 21 | 22 | 19 | 18 | 20 | 19 | 18 |
| Soft drinks/Pop/Sugary drinks | 11 | 12 | 10 | 8 | 11 | 13 | 10 | 12 | 10 |
| Snack/Chips and candies/Placed at child's eye level in grocery stores | 5 | 5 | 6 | 8 | 5 | 5 | 8 | 4 | 5 |
| Impact on their health in the future (i.e. obesity, diabetes) | 3 | 4 | 3 | 6 | 2 | 4 | 3 | 3 | 5 |
| Preservatives/Chemicals in food/Food colouring | 3 | 2 | 4 | 3 | 4 | 3 | 3 | 3 | 4 |
| Nutrition/Should follow the Canada Food Guide/Balanced diet | 3 | 2 | 4 | 4 | 3 | 3 | 4 | 4 | 2 |
| High fat | 3 | 3 | 3 | 2 | 4 | 3 | 4 | 3 | 2 |
| NET MISLEADING ADVERTISING | 52 | 51 | 53 | 47 | 52 | 55 | 50 | 52 | 55 |
| Commercials/Frequency of commercials directed at children/Manipulate kids/Video ads | 17 | 16 | 19 | 17 | 17 | 17 | 16 | 18 | 18 |
| Fast food advertising | 14 | 15 | 14 | 13 | 15 | 16 | 15 | 15 | 13 |
| Junk food, specifically that looks appealing or is marketed as healthy | 10 | 9 | 11 | 9 | 11 | 9 | 10 | 10 | 12 |
| Product packaging attracts child's attention/glamorizes | 10 | 8 | 11 | 11 | 10 | 9 | 11 | 10 | 9 |
| False advertising/Mislabeled/Not mentioning ingredients (i.e. sugar, salt) | 8 | 9 | 8 | 3 | 8 | 12 | 5 | 10 | 9 |
| NET OTHER | 15 | 17 | 14 | 20 | 14 | 14 | 15 | 14 | 17 |
| Quick meal/Simplicity of just going for fast food/Packaged food/Convenience/Frozen food | 8 | 8 | 8 | 9 | 7 | 8 | 7 | 8 | 8 |
Notably:
- Parents who only have children between the ages of 7-12 were more likely to report their concerns with regards to advertising which promotes food and beverage products that contribute to excess intakes of nutrients of concern.
- Parents over the age of 45 were more likely to have concerns about misleading advertising (55%), compared to other age cohorts.
- Francophones were more likely to have concerns that packaging glamorizes food and beverages that contribute to excess intakes of nutrients of concern to children (22%)
2. General Attitudes about Food & Beverage Advertising to Children
Respondents were taken through a series of agree/disagree statements to assess their views on various aspects of food and beverage marketing.
Exposure and Control of Food and Beverage Advertising
As reflected in the findings around exposure above, two thirds of parents surveyed (65%) feel that their children are overexposed to food and beverage advertising. A majority of parents (65%) also feel limited in their ability to monitor and control the food and beverage advertising their children see. As a result the large majority feel that it is important to safeguard their children from such advertising (69%).
Q16. Please indicate your level of agreement with the following statements.
| % STRONGLY/SOMEWHAT AGREE | TOTAL | Male | Female | Age 18-34 |
Age 35-44 |
Age 45+ |
Only have children 2 to 6 |
Only have children 7 to 12 |
Have both |
|---|---|---|---|---|---|---|---|---|---|
| n= | 3000 | 1412 | 1578 | 622 | 1482 | 896 | 798 | 1497 | 704 |
| % | % | % | % | % | % | % | % | % | |
| It is important for adults to protect children from food and beverage advertising. | 69 | 70 | 68 | 67 | 68 | 73 | 70 | 68 | 69 |
| Children are exposed to too much food and beverage advertising. | 65 | 63 | 67 | 64 | 64 | 67 | 62 | 67 | 64 |
| It's hard for parents to monitor and control the food and beverage advertising that their children are exposed to. | 65 | 64 | 66 | 63 | 62 | 70 | 61 | 67 | 64 |
- Women (67%) and those who only have children aged 7-12 (67%) are more likely to believe that their child/children are overexposed.
- Older parents, over 45 years of age, are more likely to find it important to protect their children from food and beverage advertising (73%) but that it's also difficult for them to monitor and control this (70%).
Advertising Promotes Certain Food/Beverage Products
Similar to parent's concerns about food and beverage marketing in the open-ended question above, the survey found that over three quarters of respondents (76%) believe food and beverage marketing to children primarily promotes products that are not healthy.
In terms of overall health, parents believe this advertising contributes to overweight and obesity among children, leading to other health issues in the long-term (69%). While parents feel this advertising may promote products that meet certain nutrient criteria and poor nutrition, they are more split as to whether it makes it more difficult to raise healthy children (53%).
Q16. Please indicate your level of agreement with the following statements.
| % STRONGLY/SOMEWHAT AGREE | TOTAL | Male | Female | Age 18-34 |
Age 35-44 |
Age 45+ |
Only have children 2 to 6 |
Only have children 7 to 12 |
Have both |
|---|---|---|---|---|---|---|---|---|---|
| n= | 3000 | 1412 | 1578 | 622 | 1482 | 896 | 798 | 1497 | 704 |
| % | % | % | % | % | % | % | % | % | |
| Food and beverage marketing directed at children is mostly for products that are not healthy. | 76 | 73 | 78 | 74 | 77 | 77 | 75 | 76 | 76 |
| Advertising of food and beverages contributes to overweight and obesity among children, and to health problems later in life. | 69 | 68 | 69 | 68 | 66 | 73 | 70 | 68 | 69 |
| Advertising of food and beverages makes it more difficult for parents to raise healthy children. | 53 | 53 | 53 | 54 | 51 | 56 | 53 | 53 | 54 |
- Women (78%) are more likely to believe that food and beverage marketing mostly promotes products that are not healthy.
- Older parents, aged 45 and older, are more likely to agree that this advertising contributes to child obesity and other health problems later in life (73%) and that it makes it more difficult to raise healthy children (56%).
- Francophones are less likely to agree with the statement that food and beverage advertising makes it more difficult to raise healthy children (42% - an 11 point gap from the average).
Influence on Requests and Purchases
Findings show that most parents believe that food and beverage advertising influences both their children's requests and ultimately their purchases. The vast majority of parents agree that advertising does affect the requests or choices children make (79%) while a smaller, but still significant portion of parents say that advertising also affects their purchasing decisions (58%).
Q16. Please indicate your level of agreement with the following statements.
| % STRONGLY/SOMEWHAT AGREE | TOTAL | Male | Female | Age 18-34 |
Age 35-44 |
Age 45+ |
Only have children 2 to 6 |
Only have children 7 to 12 |
Have both |
|---|---|---|---|---|---|---|---|---|---|
| n= | 3000 | 1412 | 1578 | 622 | 1482 | 896 | 798 | 1497 | 704 |
| % | % | % | % | % | % | % | % | % | |
| Food and beverage advertising affects the choices or requests that children make. | 79 | 78 | 80 | 78 | 78 | 82 | 78 | 80 | 79 |
| Food and beverage advertising to children influences what parents buy | 58 | 59 | 57 | 60 | 57 | 59 | 60 | 58 | 58 |
- Older parents (over 45 years of age) are more likely to say that advertising affects the choices and requests children make (82%).
- Francophones are less likely to agree that food and beverage marketing affects the requests children make (70%) or the purchases made by parents (42%).
D. Exposure of Children and Parents to Food and Beverage Marketing
This section examines, from the parent's perspective, how and to what extent children are exposed to and influenced by food and beverage advertising. In particular, we examine the various devices children have access to within the home, their general media habits and screen time. The survey also collected data on brand recognition and exposure to food and beverage marketing within the last 30 days, including the types of products to which they have been exposed as well as where or how they were exposed to them.
1. Media Habits of Children
Access to Various Devices
Children, regardless of their age, have access to a wide range of devices (just 4% do not have access to any). Many of these are shared family devices, but some are the child's own device. This is particularly the case for iPads or Tablets, especially among older children, aged 7 to 12. When considering 'net' overall access to devices (i.e., either as a shared family device or one that is the child's own device), children most commonly have access to the following: iPads or Tablets (net 81% access), video game consoles (66%), personal computers or laptops (65%), and Smart TVs (64%). It is much less common for children to have access to: a cell phone with a data plan (40%) or an iPod or other portable music device (38%).
As the tables below highlight, children are more likely to have shared access to many of these devices with other members of the household. Smart TVs and iPads or Tablets are commonly accessible regardless of the age of the child/children. But, perhaps not surprisingly, households with older children, aged 7-12, are more likely to indicate that their child has access, as a shared device, to a personal computer or laptop as well as to a video game console. Over half of those with children in the 7 to 12 age range (58% of those who only have children aged 7 to 12; 53% of those who have a mix of children from 2 to 6 and 7 to 12) say their children have access to a personal computer or laptop. This compares with just one-third (32%) of families who have a child or children who are aged 2 to 6 only (i.e., no children in the older 7 to 12 age group). A similar pattern is apparent with respect to access to video game consoles. Whereas, just under one-third (31%) of those with children in the younger age group only have shared access to a video game console, this proportion jumps to almost half or slightly more in households with children aged 7 to 12 only (46%) or with children spanning both age groups, 2 to 6 and 7 to 12 (52%).
Q28. Does your child/do any of your children have access to the following devices?
| TOTAL | Male | Female | Age 18-34 |
Age 35-44 |
Age 45+ |
Only have children 2 to 6 |
Only have children 7 to 12 |
Have both | |
|---|---|---|---|---|---|---|---|---|---|
| n= | 3000 | 1412 | 1578 | 622 | 1482 | 896 | 798 | 1497 | 704 |
| % | % | % | % | % | % | % | % | % | |
| Smart TV | 56 | 60 | 53 | 55 | 57 | 56 | 56 | 55 | 59 |
| Personal computer or laptop | 50 | 53 | 48 | 38 | 50 | 58 | 32 | 58 | 53 |
| iPad or Tablet | 44 | 45 | 44 | 46 | 46 | 40 | 52 | 39 | 47 |
| Video game console | 43 | 42 | 45 | 42 | 46 | 41 | 31 | 46 | 52 |
| Cell phone with a data plan | 24 | 25 | 24 | 27 | 24 | 23 | 26 | 23 | 24 |
| iPod or other portable music device | 17 | 18 | 16 | 18 | 16 | 18 | 16 | 17 | 19 |
While Smart TVs and personal computers or laptops tend to be shared family devices, it is more common that children have access to devices such as iPads or Tablets on their own. Just over two-in-five respondents (43%) say that their child or children have access to their own iPad or Tablet, and this varies both by the age of the parent and, relatedly, the age of the children.
Just over half of parents who have children in the 7 to 12 age range only say their child/children have their own access to an iPad or Tablet (53% vs. 25% among those with children in the 2 to 6 age range only). Between one-quarter and one-third of those parents also say their child/children have their own access to: a video game console (35% vs. 11%), an iPod or other portable music device (33% vs. 6%), a personal computer or laptop (27% vs. 7%), or a cell phone with a data plan (27% vs. 6%). The age of children in the household has little bearing on access to their own Smart TV. Very few have their own access to a Smart TV, ranging from just over one-in-ten (13%) among those households with children aged 7 to 12 only, to just under that (8%) in households with children aged 2 to 6 only. Notably, where there is a mix of children within the household from both the younger and older age groups, 2 to 6 and 7 to 12, access to their own devices tends to be somewhat more limited across the board, with the exception of iPads or Tablets. There may be several factors at play which would be worth exploring further: cost implications to purchasing each child their own device especially when there is more than one child in the household, how busy or active the family may be if they have several children within the 2 to 12 age range which could preclude making an investment in these devices for one or more children, and possibly parental concern when there are younger children in the household about exposure to and the use of these devices.
Younger parents, aged 18 to 34 are less likely to say their child or children have their own access to any of the devices, ranging from just under one-third (30%) for iPads or Tablets to about one-in-ten whose children have their own access to a Smart TV (10%), a cell phone with a data plan (10%) or a personal computer/laptop (9%). Older parents, especially those aged 45 and over, are more likely to say their children have their own access to virtually all of the devices they were asked about, but particularly iPads or Tablets (52%). Among this age group of parents, there was greater likelihood for children to have access to their own device, but it was much lower relative to the prevalence of iPads and Tablets, for example: video games consoles (33%), iPods or other portable music devices (30%), personal computers or laptops (28%) and cell phones with data plans (26%). Again, across the board, regardless of the age of parents, very few (about one-in-ten) say their children have their own access to a Smart TV.
Q28. Does your child/do any of your children have access to the following devices?
| TOTAL | Male | Female | Age 18-34 |
Age 35-44 |
Age 45+ |
Only have children 2 to 6 |
Only have children 7 to 12 |
Have both | |
|---|---|---|---|---|---|---|---|---|---|
| n= | 3000 | 1412 | 1578 | 622 | 1482 | 896 | 798 | 1497 | 704 |
| % | % | % | % | % | % | % | % | % | |
| iPad or Tablet | 43 | 44 | 41 | 30 | 42 | 52 | 25 | 53 | 40 |
| Video game console | 26 | 29 | 23 | 18 | 25 | 33 | 11 | 35 | 24 |
| iPod or other portable music device | 23 | 24 | 21 | 14 | 22 | 30 | 6 | 33 | 20 |
| Personal computer or laptop | 19 | 20 | 17 | 9 | 18 | 28 | 7 | 27 | 14 |
| Cell phone with a data plan | 18 | 20 | 16 | 10 | 17 | 26 | 6 | 27 | 13 |
| Smart TV | 11 | 12 | 10 | 10 | 11 | 12 | 8 | 13 | 10 |
Interestingly, access to devices does depend on household income. Parents with a higher annual income, over $100,000, are more likely to say that their child has access to a shared and/or their own individual device, compared to those making less than $60,000 per household per year.
Regionally, children's access to their own device is higher for those residing in the Atlantic Provinces and Ontario, with the exception of Smart TVs.
Respondents were offered an additional opportunity to identify other devices in the household that would allow their child or children to access the Internet. Relatively few (13%) responded to this question and, of these, there was a tendency to repeat devices that had been assessed in the earlier question (reported above) such as iPads and Tablets (36%), Smartphones (31%), and desktop or laptop computers (26%).
Q29. Are there any other devices in your home that your child/children use to access to the Internet? OPEN-END, MULTI-MENTION
| TOTAL | Male | Female | Age 18-34 |
Age 35-44 |
Age 45+ |
Only have children 2 to 6 |
Only have children 7 to 12 |
Have both | |
|---|---|---|---|---|---|---|---|---|---|
| n= | 379 | 171 | 206 | 81 | 191 | 108 | 95 | 184 | 100 |
| % | % | % | % | % | % | % | % | % | |
| Tablet/iPad | 36 | 33 | 38 | 47 | 34 | 31 | 47 | 29 | 37 |
| Smartphone/iPhone/Cellphone/Phone | 31 | 29 | 33 | 30 | 27 | 38 | 26 | 34 | 29 |
| Computer/Desktop/Laptop | 26 | 26 | 27 | 18 | 22 | 40 | 6 | 37 | 25 |
| TV/Smart TV/Apple TV | 9 | 6 | 11 | 14 | 6 | 10 | 9 | 7 | 12 |
| Other Gaming devices (e.g., PS3, PS4, educational games, Nintendo Switch) | 8 | 8 | 8 | 7 | 7 | 11 | 5 | 11 | 6 |
| Google home/Google Mini | 4 | 7 | 2 | 1 | 5 | 5 | 2 | 4 | 7 |
| Xbox | 4 | 4 | 4 | 4 | 4 | 3 | 2 | 3 | 7 |
| iPod | 2 | 2 | 2 | - | 2 | 4 | 1 | 4 | - |
| Alexa/Amazon Alexa | 2 | 2 | 2 | 1 | 2 | 3 | 1 | 4 | - |
| Leap/Leap pad/Leap frog | 2 | 1 | 2 | 1 | 3 | 1 | 6 | 1 | - |
| Android/Android box | 2 | 2 | 1 | 3 | 1 | 3 | 3 | 1 | |
| Echo/Amazon Echo | 2 | 2 | 1 | - | 2 | 2 | 1 | 2 | 1 |
| Roku | 1 | 1 | 1 | 1 | 2 | 1 | 1 | 2 | - |
| Book/Chromebook/MacBook | 1 | 2 | 1 | 1 | 2 | 1 | 2 | 2 | - |
| Wii | 1 | 1 | 1 | 3 | 1 | - | 1 | 1 | 1 |
| Radio/Smart radio | <1 | 1 | - | - | 1 | - | 1 | - | 1 |
| Other | 8 | 9 | 6 | 11 | 8 | 5 | 11 | 5 | 10 |
Media Usage/Screen Time
The majority of children are spending at least an hour a day on various devices. Just one percent (1%) of parents say their children do not spend any time on any of these devices, meaning that for the remainder (99%), their children are spending at least 15 minutes daily on various devices which could expose them to food and beverage marketing.
In terms of screen time, most hours are spent watching TV. Almost two-thirds of parents (63%) say their children are watching at least one hour a day, and one-quarter (25%) are watching two or more hours. Just under half of parents say their children spend an hour or more daily on a smartphone (48%), using a tablet (47%), playing games online (46%), or using a personal computer (43%). In each of these cases, a slight majority of respondents indicated that their children are spending an hour or less on these devices.
This is also the case with respect to daily time spent watching YouTube videos, listening to the radio or using an iPod or other portable music devices. Use of these devices is fairly modest with almost two-thirds or more of parents saying their children tend to use these devices for an hour or less each day. By comparison to time spent on other devices, significantly fewer parents said their children spend an hour or more on these devices (watching YouTube videos (37%), listening to the radio (35%) or using an iPod (20%).
Q30. On a daily basis, and excluding time spent at school, approximately how much time does your child/do your children spend doing each of the following?
| % None | % 30 minutes or less |
15 minutes or less | About 30 minutes | About an hour | About 2 hours | 3 hours or more | % 2 hours or more |
|
|---|---|---|---|---|---|---|---|---|
| Watching TV | 10 | 37 | 11 | 26 | 38 | 20 | 5 | 25 |
| Using a personal computer | 44 | 57 | 34 | 23 | 22 | 13 | 8 | 21 |
| Using a tablet | 24 | 53 | 25 | 28 | 28 | 13 | 6 | 19 |
| Using a smart phone | 48 | 52 | 25 | 27 | 30 | 12 | 6 | 18 |
| Playing games online | 40 | 54 | 25 | 29 | 28 | 13 | 5 | 18 |
| Watching YouTube videos | 16 | 64 | 39 | 25 | 21 | 10 | 5 | 16 |
| Listening to the radio | 46 | 65 | 36 | 29 | 23 | 8 | 4 | 12 |
| Using an iPod/portable music device | 62 | 80 | 54 | 26 | 12 | 5 | 3 | 8 |
(Percentages have been re-proportioned to exclude "none" responses)
Analysing media usage by device indicates some variability, depending on the device, by age of child/children. One exception is TV watching, where patterns appear to be similar regardless of the age of the parent or the child.
Regionally, those who have more access to devices (Atlantic region and Manitoba) also report higher amounts of media usage and screen time.
| TOTAL | Male | Female | Age 18-34 |
Age 35-44 |
Age 45+ |
Only have children 2 to 6 |
Only have children 7 to 12 |
Have both | |
|---|---|---|---|---|---|---|---|---|---|
| n= | 3000 | 1412 | 1578 | 622 | 1482 | 896 | 798 | 1497 | 704 |
| % | % | % | % | % | % | % | % | % | |
| NET 30 MINUTES OR LESS | 33 | 34 | 33 | 30 | 33 | 35 | 34 | 34 | 32 |
| 15 minutes or less | 10 | 9 | 10 | 9 | 10 | 10 | 9 | 10 | 9 |
| About 30 minutes | 24 | 24 | 23 | 21 | 24 | 25 | 24 | 24 | 23 |
| About an hour | 34 | 35 | 33 | 32 | 35 | 34 | 29 | 35 | 37 |
| About 2 hours | 18 | 18 | 18 | 21 | 18 | 15 | 21 | 17 | 16 |
| 3 hours or more | 5 | 3 | 7 | 8 | 4 | 3 | 6 | 4 | 7 |
| NET 2 HOURS OR MORE | 23 | 20 | 25 | 30 | 23 | 19 | 27 | 21 | 23 |
| None | 10 | 11 | 9 | 8 | 9 | 12 | 10 | 10 | 8 |
Not unexpectedly, the vast majority of parents with children who are aged 2 to 6 say their children don't use a personal computer or laptop at all (74%) while under a third (29%) of parents with children in the 7 to 12 age category and just under half (44%) of parents with children spanning both age groups say the same.
| TOTAL | Male | Female | Age 18-34 |
Age 35-44 |
Age 45+ |
Only have children 2 to 6 |
Only have children 7 to 12 |
Have both | |
|---|---|---|---|---|---|---|---|---|---|
| n= | 3000 | 1412 | 1578 | 622 | 1482 | 896 | 798 | 1497 | 704 |
| % | % | % | % | % | % | % | % | % | |
| NET 30 MINUTES OR LESS | 36 | 40 | 33 | 22 | 36 | 46 | 17 | 46 | 38 |
| 15 minutes or less | 20 | 21 | 18 | 12 | 21 | 23 | 10 | 24 | 21 |
| About 30 minutes | 16 | 18 | 14 | 10 | 15 | 23 | 7 | 21 | 17 |
| About an hour | 13 | 14 | 11 | 8 | 12 | 17 | 6 | 17 | 10 |
| About 2 hours | 5 | 5 | 5 | 4 | 4 | 6 | 2 | 6 | 4 |
| 3 hours or more | 2 | 2 | 2 | 1 | 2 | 2 | 1 | 2 | 3 |
| NET 2 HOURS OR MORE | 7 | 7 | 7 | 6 | 7 | 8 | 4 | 8 | 7 |
| None | 44 | 40 | 49 | 64 | 46 | 28 | 74 | 29 | 44 |
Time spent using a tablet differs only marginally depending on the age of children. While under one-third (27%) of those with children aged 2 to 6 only say their children spend one or more hours a day on a tablet, this jumps to just almost two in five for those with children aged 7 to 12 only (38%) or with a mix of children across both age groups (36%).
| TOTAL | Male | Female | Age 18-34 |
Age 35-44 |
Age 45+ |
Only have children 2 to 6 |
Only have children 7 to 12 |
Have both | |
|---|---|---|---|---|---|---|---|---|---|
| n= | 3000 | 1412 | 1578 | 622 | 1482 | 896 | 798 | 1497 | 704 |
| % | % | % | % | % | % | % | % | % | |
| NET 30 MINUTES OR LESS | 41 | 43 | 39 | 37 | 43 | 41 | 41 | 41 | 40 |
| 15 minutes or less | 19 | 20 | 18 | 18 | 20 | 18 | 22 | 18 | 16 |
| About 30 minutes | 22 | 23 | 21 | 19 | 23 | 23 | 20 | 23 | 23 |
| About an hour | 21 | 23 | 19 | 19 | 20 | 24 | 16 | 23 | 23 |
| About 2 hours | 10 | 10 | 10 | 8 | 10 | 11 | 8 | 11 | 9 |
| 3 hours or more | 4 | 3 | 5 | 5 | 3 | 4 | 3 | 4 | 4 |
| NET 2 HOURS OR MORE | 14 | 13 | 15 | 13 | 13 | 15 | 11 | 15 | 13 |
| None | 24 | 22 | 27 | 31 | 24 | 20 | 31 | 21 | 24 |
Smart phone usage varies minimally by age of the child, although a larger proportion of those with children aged 2 to 6 only say they don't spend any time on a smart phone (57%), compared to those with older children (42% with children aged 7 to 12 only, 49% for those with children in both age cohorts).
| TOTAL | Male | Female | Age 18-34 |
Age 35-44 |
Age 45+ |
Only have children 2 to 6 |
Only have children 7 to 12 |
Have both | |
|---|---|---|---|---|---|---|---|---|---|
| n= | 3000 | 1412 | 1578 | 622 | 1482 | 896 | 798 | 1497 | 704 |
| % | % | % | % | % | % | % | % | % | |
| NET 30 MINUTES OR LESS | 30 | 32 | 27 | 28 | 31 | 29 | 30 | 30 | 29 |
| 15 minutes or less | 18 | 19 | 17 | 15 | 20 | 17 | 18 | 18 | 18 |
| About 30 minutes | 12 | 13 | 11 | 12 | 11 | 12 | 12 | 12 | 11 |
| About an hour | 12 | 13 | 11 | 9 | 11 | 14 | 8 | 14 | 12 |
| About 2 hours | 7 | 7 | 7 | 6 | 6 | 9 | 4 | 9 | 6 |
| 3 hours or more | 4 | 3 | 5 | 5 | 4 | 4 | 2 | 5 | 5 |
| NET 2 HOURS OR MORE | 11 | 10 | 12 | 10 | 10 | 13 | 6 | 14 | 10 |
| None | 48 | 45 | 50 | 53 | 48 | 44 | 57 | 42 | 49 |
Playing games online clearly becomes a more common and more intensive activity among older children. While relatively few children between the ages of 2 and 6 are engaging in online gaming, for those with children aged 7 to 12, over two-thirds (39%) are spending an hour or more daily on this activity.
| TOTAL | Male | Female | Age 18-34 |
Age 35-44 |
Age 45+ |
Only have children 2 to 6 |
Only have children 7 to 12 |
Have both | |
|---|---|---|---|---|---|---|---|---|---|
| n= | 3000 | 1412 | 1578 | 622 | 1482 | 896 | 798 | 1497 | 704 |
| % | % | % | % | % | % | % | % | % | |
| NET 30 MINUTES OR LESS | 31 | 33 | 30 | 24 | 31 | 36 | 19 | 37 | 34 |
| 15 minutes or less | 15 | 17 | 13 | 13 | 15 | 17 | 11 | 16 | 17 |
| About 30 minutes | 16 | 16 | 16 | 11 | 16 | 19 | 8 | 20 | 17 |
| About an hour | 18 | 19 | 17 | 13 | 17 | 22 | 8 | 23 | 16 |
| About 2 hours | 7 | 7 | 8 | 5 | 7 | 10 | 2 | 11 | 5 |
| 3 hours or more | 4 | 3 | 4 | 3 | 4 | 4 | 1 | 5 | 5 |
| NET 2 HOURS OR MORE | 11 | 10 | 12 | 8 | 11 | 14 | 3 | 16 | 10 |
| None | 40 | 38 | 42 | 55 | 41 | 28 | 69 | 24 | 40 |
While many more children appear to be watching YouTube videos, as compared to using personal computers, playing games online or using a smart phone, time spent engaged in this activity tends to be more modest. The plurality of parents (44%) say their children spend 30 minutes or less on this activity and this is consistent across both age groups. However, we see a slight increase in time spent watching YouTube videos for those with children aged 7 to 12 in the household compared to those with children aged 2 to 6 only (for the latter group 31% spend an hour or more, compared to 46% for those with children aged 7 to 12 only).
| TOTAL | Male | Female | Age 18-34 |
Age 35-44 |
Age 45+ |
Only have children 2 to 6 |
Only have children 7 to 12 |
Have both | |
|---|---|---|---|---|---|---|---|---|---|
| n= | 3000 | 1412 | 1578 | 622 | 1482 | 896 | 798 | 1497 | 704 |
| % | % | % | % | % | % | % | % | % | |
| NET 30 MINUTES OR LESS | 44 | 47 | 42 | 43 | 44 | 46 | 45 | 44 | 46 |
| 15 minutes or less | 21 | 22 | 21 | 20 | 22 | 22 | 23 | 21 | 21 |
| About 30 minutes | 23 | 25 | 21 | 23 | 22 | 25 | 22 | 23 | 25 |
| About an hour | 24 | 24 | 23 | 20 | 24 | 25 | 16 | 28 | 24 |
| About 2 hours | 12 | 11 | 12 | 10 | 12 | 12 | 10 | 13 | 9 |
| 3 hours or more | 5 | 4 | 6 | 7 | 4 | 4 | 5 | 5 | 5 |
| NET 2 HOURS OR MORE | 16 | 15 | 17 | 17 | 16 | 17 | 15 | 18 | 14 |
| None | 16 | 13 | 18 | 20 | 16 | 11 | 24 | 11 | 16 |
Just under half of parents say their children spend no time listening to the radio and this number is quite consistent regardless of the age of the child/children. For those whose children do listen to the radio, again there is little variation in time spent doing this by age of the child/children and the plurality tend to spend 30 minutes or less daily.
| TOTAL | Male | Female | Age 18-34 |
Age 35-44 |
Age 45+ |
Only have children 2 to 6 |
Only have children 7 to 12 |
Have both | |
|---|---|---|---|---|---|---|---|---|---|
| n= | 3000 | 1412 | 1578 | 622 | 1482 | 896 | 798 | 1497 | 704 |
| % | % | % | % | % | % | % | % | % | |
| NET 30 MINUTES OR LESS | 43 | 42 | 43 | 43 | 42 | 44 | 41 | 43 | 44 |
| 15 minutes or less | 29 | 28 | 30 | 27 | 30 | 30 | 27 | 30 | 29 |
| About 30 minutes | 14 | 14 | 14 | 17 | 13 | 14 | 14 | 13 | 15 |
| About an hour | 7 | 5 | 8 | 8 | 6 | 6 | 6 | 7 | 6 |
| About 2 hours | 3 | 2 | 3 | 4 | 2 | 3 | 3 | 3 | 2 |
| 3 hours or more | 2 | 1 | 2 | 2 | 2 | 1 | 1 | 1 | 3 |
| NET 2 HOURS OR MORE | 4 | 3 | 5 | 6 | 4 | 4 | 4 | 4 | 5 |
| None | 46 | 49 | 44 | 43 | 48 | 46 | 49 | 46 | 45 |
Finally, as noted earlier, use of iPods or other portable music devices is minimal and, for those whose children do engage in this activity, the tendency is to spend 30 minutes or less doing so.
| TOTAL | Male | Female | Age 18-34 |
Age 35-44 |
Age 45+ |
Only have children 2 to 6 |
Only have children 7 to 12 |
Have both | |
|---|---|---|---|---|---|---|---|---|---|
| n= | 3000 | 1412 | 1578 | 622 | 1482 | 896 | 798 | 1497 | 704 |
| % | % | % | % | % | % | % | % | % | |
| NET 30 MINUTES OR LESS | 24 | 26 | 22 | 18 | 25 | 27 | 14 | 29 | 25 |
| 15 minutes or less | 15 | 16 | 13 | 10 | 15 | 17 | 8 | 17 | 16 |
| About 30 minutes | 9 | 10 | 9 | 9 | 9 | 10 | 6 | 12 | 9 |
| About an hour | 8 | 9 | 7 | 7 | 7 | 10 | 4 | 10 | 7 |
| About 2 hours | 4 | 4 | 4 | 4 | 3 | 5 | 3 | 5 | 3 |
| 3 hours or more | 2 | 2 | 2 | 2 | 2 | 2 | 1 | 2 | 2 |
| NET 2 HOURS OR MORE | 6 | 6 | 6 | 6 | 5 | 8 | 3 | 7 | 6 |
| None | 62 | 60 | 65 | 69 | 64 | 55 | 79 | 54 | 62 |
2. Brand Recognition
We wanted to understand the extent to which children recognize and, thus likely relate strongly to, brands in four specific categories: breakfast cereals, candy or chocolates, cookies, and fast-food or take-out restaurants. To assess this, we asked parents to name up to three brands in each of these categories that their children are familiar with.
Within the cereal category, Cheerios (34%) and Froot Loops (23%) were most often mentioned, followed by Rice Krispies (16%), Lucky Charms (13%) and Kellogg's, as a general brand (13%). A range of other cereal brands were mentioned by under 10 percent of parents. Results are consistent by age of child/children.
Q18. For each of the following categories, please indicate the top 3 brands with which your child is/children are familiar, by writing them in the space provided, OR select none?
BREAKFAST CEREALS (MENTIONS OF 3% OR HIGHER) |
TOTAL | Male | Female | Age 18-34 |
Age 35-44 |
Age 45+ |
Only have children 2 to 6 |
Only have children 7 to 12 |
Have both |
|---|---|---|---|---|---|---|---|---|---|
| n= | 3000 | 1412 | 1578 | 622 | 1482 | 896 | 798 | 1497 | 704 |
| % | % | % | % | % | % | % | % | % | |
| Cheerios (general) | 34 | 33 | 36 | 34 | 34 | 35 | 37 | 34 | 33 |
| Froot Loops | 23 | 21 | 24 | 28 | 22 | 21 | 21 | 22 | 26 |
| Rice Krispies | 16 | 15 | 17 | 11 | 16 | 20 | 12 | 19 | 15 |
| Lucky Charms | 13 | 11 | 16 | 18 | 14 | 9 | 13 | 12 | 16 |
| Kellogg`s | 13 | 12 | 15 | 13 | 13 | 13 | 11 | 15 | 12 |
| Frosted Flakes | 9 | 8 | 9 | 7 | 9 | 10 | 4 | 11 | 10 |
| Mini-Wheats | 7 | 7 | 7 | 6 | 7 | 7 | 5 | 8 | 6 |
| Corn Flakes | 7 | 8 | 6 | 7 | 6 | 8 | 4 | 8 | 8 |
| Cinnamon Toast Crunch | 6 | 4 | 7 | 5 | 6 | 5 | 4 | 6 | 6 |
| Quaker Oats/Quaker/Quaker Oatmeal | 5 | 4 | 5 | 4 | 5 | 5 | 4 | 5 | 5 |
| Shreddies | 4 | 5 | 4 | 3 | 4 | 5 | 5 | 4 | 4 |
| Post | 4 | 3 | 4 | 3 | 4 | 5 | 2 | 5 | 4 |
| Raisin Bran | 4 | 3 | 4 | 3 | 3 | 4 | 4 | 4 | 3 |
| General Mills | 3 | 2 | 4 | 3 | 3 | 4 | 1 | 5 | 3 |
| Captain Crunch | 3 | 4 | 3 | 3 | 3 | 3 | 3 | 3 | 3 |
| Cheerios - Honey Nut/Honey Nut Cheerios | 3 | 3 | 2 | 3 | 2 | 4 | 3 | 3 | 2 |
| Honeycomb | 3 | 3 | 3 | 3 | 3 | 3 | 2 | 3 | 3 |
| Corn Pops | 3 | 2 | 3 | 2 | 3 | 3 | 2 | 3 | 3 |
| None | 17 | 20 | 14 | 15 | 18 | 17 | 21 | 15 | 17 |
| DK/NA/REF | <1 | <1 | <1 | <1 | <1 | <1 | <1 | <1 | - |
Within the candy and chocolate category, it's interesting to note that a slightly higher proportion (24%) say their children don't recognize any brands in particular. This percentage is slightly higher for those with children aged 2 to 6 only (30%) compared to those with children aged 7 to 12 only (19%). Brands mentioned with higher frequency included: Kit Kat (17%), Smarties (14%), Kinder Surprise (14%), M&Ms (13%) and Hershey's (10%). Interestingly, recognition of Kinder Surprise is higher among those whose children are aged 2 to 6 only (20%), twice the number compared to those whose children are aged 7 to 12 only (10%). The reverse is true for brand recognition of other chocolate bars or chocolate products such as Kit Kat, Hershey's, Aero and Cadbury in which case almost twice as many with children aged 7 to 12 only identified these products compared with parents of children aged 2 to 6 only.
Q18. For each of the following categories, please indicate the top 3 brands with which your child is/children are familiar, by writing them in the space provided, OR select none?
CANDY OR CHOCOLATES (MENTIONS OF 3% OR HIGHER) |
TOTAL | Male | Female | Age 18-34 |
Age 35-44 |
Age 45+ |
Only have children 2 to 6 |
Only have children 7 to 12 |
Have both |
|---|---|---|---|---|---|---|---|---|---|
| n= | 3000 | 1412 | 1578 | 622 | 1482 | 896 | 798 | 1497 | 704 |
| % | % | % | % | % | % | % | % | % | |
| Kit Kat | 17 | 17 | 18 | 14 | 16 | 21 | 11 | 21 | 17 |
| Smarties | 14 | 13 | 16 | 16 | 15 | 12 | 19 | 12 | 15 |
| Kinder/Kinder Eggs/Kinder Surprise | 14 | 8 | 19 | 18 | 15 | 9 | 20 | 10 | 15 |
| M&M`S | 13 | 12 | 13 | 11 | 13 | 14 | 13 | 13 | 12 |
| Hershey`s | 10 | 9 | 10 | 10 | 10 | 10 | 6 | 12 | 9 |
| Aero | 9 | 8 | 10 | 7 | 9 | 10 | 6 | 11 | 9 |
| Cadbury | 9 | 7 | 11 | 8 | 10 | 8 | 5 | 11 | 9 |
| Nestle | 8 | 5 | 10 | 8 | 8 | 8 | 5 | 9 | 9 |
| Reese`s Peanut Butter Cups/Reese`s Pieces/Reese`s | 8 | 6 | 9 | 11 | 6 | 8 | 6 | 9 | 8 |
| Skittles | 7 | 7 | 7 | 8 | 6 | 8 | 5 | 8 | 7 |
| Lindt | 7 | 7 | 6 | 3 | 6 | 10 | 4 | 9 | 4 |
| Mars | 6 | 7 | 5 | 4 | 5 | 7 | 2 | 7 | 6 |
| Gummy Bears/Gummies | 3 | 3 | 3 | 2 | 3 | 3 | 3 | 3 | 4 |
| Caramilk | 3 | 3 | 3 | 3 | 3 | 2 | 1 | 4 | 3 |
| Twix | 3 | 3 | 2 | 2 | 3 | 3 | 2 | 3 | 2 |
| Snickers | 3 | 3 | 2 | 4 | 2 | 2 | 2 | 3 | 3 |
| Coffee Crisp | 3 | 3 | 2 | 1 | 2 | 5 | 1 | 4 | 1 |
| None | 24 | 29 | 20 | 26 | 24 | 22 | 30 | 19 | 27 |
| DK/NA/REF | <1 | - | <1 | - | - | <1 | - | <1 | - |
Similar to chocolate and candies, just over one-quarter (28%) of parents indicated their children would not recognize any cookie brands, although this is more the case for those with children aged 2 to 6 only (38%) than it is for those with children aged 7 to 12 only (23%) or with children that span both age groups (27%). Notably, while half (50%) of parents with children aged 7 to 12 mentioned Oreo cookies as a brand their children would recognize, brand recognition among those with children aged 2 to 6 only was lower (35%). Otherwise, there were few variations.
Q18. For each of the following categories, please indicate the top 3 brands with which your child is/children are familiar, by writing them in the space provided, OR select none?
COOKIES (MENTIONS OF 3% OR HIGHER) |
TOTAL | Male | Female | Age 18-34 |
Age 35-44 |
Age 45+ |
Only have children 2 to 6 |
Only have children 7 to 12 |
Have both |
|---|---|---|---|---|---|---|---|---|---|
| n= | 3000 | 1412 | 1578 | 622 | 1482 | 896 | 798 | 1497 | 704 |
| % | % | % | % | % | % | % | % | % | |
| Oreo | 46 | 43 | 49 | 44 | 46 | 47 | 35 | 50 | 50 |
| Chips Ahoy/Ahoy | 14 | 15 | 13 | 17 | 14 | 13 | 12 | 15 | 14 |
| Bear Paws | 10 | 7 | 12 | 9 | 10 | 10 | 8 | 10 | 10 |
| Christie | 7 | 5 | 9 | 6 | 7 | 8 | 5 | 8 | 7 |
| Dad`s | 7 | 6 | 7 | 6 | 6 | 7 | 4 | 8 | 6 |
| Dare | 5 | 5 | 5 | 3 | 5 | 7 | 2 | 7 | 6 |
| President`s Choice/PC | 5 | 5 | 5 | 3 | 5 | 6 | 3 | 6 | 4 |
| Chocolate Chip (cookie) | 4 | 3 | 6 | 5 | 4 | 4 | 3 | 4 | 5 |
| Mr. Christie | 4 | 3 | 4 | 3 | 4 | 3 | 2 | 4 | 5 |
| Store Brands/Generic (all) | 3 | 3 | 2 | 2 | 3 | 3 | 2 | 3 | 3 |
| Fudgee-O | 3 | 3 | 3 | 2 | 3 | 3 | 1 | 4 | 3 |
| None | 28 | 32 | 25 | 31 | 28 | 26 | 38 | 23 | 27 |
| DK/NA/REF | <1 | <1 | <1 | - | <1 | <1 | - | <1 | <1 |
Brand recognition of fast-food and take-out restaurants is high, with just one-in-ten (12%) respondents saying their children would not recognize any brands in this category. Moreover, even fewer of those whose children are aged 7 to 12 only (8%) say their children wouldn't recognize any brand, half as many compared to those with children aged 2 to 6 only (16%). Far and away, the most recognizable brand is McDonald's (77%) and this level of recognition is relatively consistent regardless of the age of children. Recognition of other brands drops off considerably: Subway (19%), A&W (19%), Tim Horton's (19%), Wendy's (18%) and Burger King (14%). Notably, and with the exception of Tim Horton's only, recognition of these 'secondary brands' tends to be higher among those with children aged 7 to 12, compared with those who have children in the younger age bracket (2 to 6 only).
Q18. For each of the following categories, please indicate the top 3 brands with which your child is/children are familiar, by writing them in the space provided, OR select none?
FAST FOOD OR TAKE-OUT RESTAURANTS (MENTIONS OF 2% OR HIGHER) |
TOTAL | Male | Female | Age 18-34 |
Age 35-44 |
Age 45+ |
Only have children 2 to 6 |
Only have children 7 to 12 |
Have both |
|---|---|---|---|---|---|---|---|---|---|
| n= | 3000 | 1412 | 1578 | 622 | 1482 | 896 | 798 | 1497 | 704 |
| % | % | % | % | % | % | % | % | % | |
| McDonald`s | 77 | 74 | 79 | 77 | 77 | 77 | 74 | 78 | 77 |
| Subway | 19 | 20 | 18 | 14 | 20 | 21 | 10 | 24 | 19 |
| A&W | 19 | 18 | 20 | 15 | 18 | 22 | 14 | 20 | 20 |
| Tim Hortons | 19 | 18 | 19 | 19 | 19 | 18 | 20 | 19 | 16 |
| Wendy`s | 18 | 18 | 19 | 16 | 19 | 19 | 13 | 21 | 18 |
| Burger King | 14 | 14 | 13 | 15 | 13 | 13 | 11 | 15 | 14 |
| KFC | 8 | 8 | 8 | 7 | 8 | 9 | 7 | 9 | 7 |
| Harvey`s | 7 | 7 | 6 | 3 | 7 | 9 | 3 | 8 | 7 |
| Dairy Queen (DQ) | 6 | 5 | 7 | 7 | 5 | 6 | 5 | 6 | 5 |
| Pizza Pizza | 3 | 3 | 3 | 2 | 3 | 4 | 2 | 3 | 4 |
| St-Hubert | 2 | 2 | 3 | 2 | 3 | 2 | 3 | 2 | 2 |
| Pizza Hut | 2 | 2 | 1 | 2 | 2 | 2 | 1 | 2 | 3 |
| None | 12 | 14 | 10 | 14 | 11 | 10 | 16 | 8 | 13 |
| DK/NA/REF | <1 | - | <1 | - | - | <1 | - | <1 | - |
3. Extent of Influence of Various Media
Parents feel that their children are fairly heavily influenced by food and beverage marketing across a range of media channels, most particularly from fast-food or take-out restaurants (61% say their children are influenced either a lot or a great deal), in-store displays (57%), TV (56%), product packaging (53%), and at supermarket check-outs (53%). A second tier of media has reasonably significant influence, with one-third to just under one-half of parents saying their children are influenced a lot or a great deal by industry advertising or promotions shown on YouTube videos (46%), vending machines (41%), the Internet in general (38%) and cinema/movie theatres (37%). Representing a third tier are advertising or promotional tools from other restaurants (30%), promotional fundraisers (27%), giveaways or samples, outdoor advertising, online games (26% each), social media (25%), sports events (23%) and celebrity endorsements (22%). Children's magazines (16%), radio (12%) and board games (10%) are viewed as less influential.
The results indicate that, according to their parents, older children are influenced more heavily by marketing via YouTube videos, vending machines, the Internet in general, cinema/movie theatres and online games. Notably, younger children are more influenced by food and beverage marketing that is shown on product packaging and at the supermarket check-out.
Compared to Anglophones, Francophones feel to a lesser extent that their child/children are influenced by food and beverage marketing across all forms of media, with one exception – in store displays (63%).
Q19. To what extent do you feel your child is/children are influenced by food and beverage marketing aimed at children via each of the following forms of media?
TOP 2 BOX (A GREAT DEAL/A LOT) |
TOTAL | Male | Female | Age 18-34 |
Age 35-44 |
Age 45+ |
Only have children 2 to 6 |
Only have children 7 to 12 |
Have both |
|---|---|---|---|---|---|---|---|---|---|
| n= | 3000 | 1412 | 1578 | 622 | 1482 | 896 | 798 | 1497 | 704 |
| % | % | % | % | % | % | % | % | % | |
| Fast-food or take-out restaurants | 61 | 60 | 62 | 62 | 60 | 61 | 55 | 63 | 64 |
| In-store displays | 57 | 53 | 60 | 62 | 57 | 53 | 59 | 54 | 61 |
| Television | 56 | 56 | 55 | 58 | 55 | 56 | 49 | 58 | 59 |
| Product packaging | 53 | 51 | 55 | 60 | 53 | 49 | 57 | 49 | 58 |
| Supermarket checkout | 53 | 47 | 59 | 60 | 53 | 49 | 58 | 49 | 56 |
| YouTube videos | 46 | 47 | 45 | 46 | 46 | 47 | 38 | 49 | 49 |
| Vending machines | 41 | 39 | 42 | 43 | 40 | 40 | 35 | 42 | 44 |
| Internet/online (general) | 38 | 40 | 36 | 36 | 37 | 41 | 31 | 42 | 37 |
| Cinema/movie theatres | 37 | 36 | 39 | 37 | 36 | 40 | 29 | 43 | 36 |
| Other restaurants | 30 | 28 | 31 | 33 | 29 | 29 | 24 | 31 | 32 |
| Promotional fundraisers for schools and community organizations | 27 | 27 | 27 | 30 | 26 | 28 | 25 | 28 | 30 |
| Giveaways, samples or special offers | 26 | 25 | 27 | 29 | 26 | 25 | 23 | 26 | 31 |
| Outdoor advertising (billboards, transit ads) | 26 | 25 | 27 | 32 | 25 | 25 | 26 | 24 | 30 |
| Online games (video games) | 26 | 27 | 25 | 23 | 25 | 30 | 18 | 30 | 26 |
| Social media (Twitter, Facebook, Snapchat) | 25 | 25 | 25 | 23 | 24 | 28 | 19 | 29 | 23 |
| Sports events/sponsorships | 23 | 24 | 22 | 23 | 21 | 26 | 18 | 26 | 23 |
| Celebrity endorsements | 22 | 23 | 20 | 21 | 20 | 24 | 17 | 25 | 20 |
| Children's magazines | 16 | 18 | 13 | 19 | 15 | 15 | 15 | 15 | 17 |
| Radio | 12 | 12 | 11 | 16 | 11 | 12 | 11 | 12 | 13 |
| Board games | 10 | 12 | 8 | 13 | 9 | 10 | 11 | 9 | 12 |
4. Exposure to Food & Beverage Marketing within the Last 30 Days
Parents' and children's exposure to food and beverage marketing across a range of product categories is, perhaps not surprisingly, very similar especially since many children accompany their parents when grocery shopping. Product packaging as well as supermarket check-outs are among the main ways in which parents say their children are influenced by industry marketing. Over four-in-five parents (86%) and their children (85%) have been exposed to food and beverage marketing within the last 30 days from a variety of sources.
Most frequently parents say they and their children have been exposed, within the last month, to marketing by fast-food and take-out restaurants (69%; 63% respectively), followed by marketing for potato chips, popcorn and other snacks (60%; 56%), candy and chocolate (59%; 58%), juice, soft drinks and sports drinks (59%; 55%), breakfast cereals (56% for both parents and children), and yogurt (54%; 49%). Just under half say they have been exposed to marketing for cakes and cookies (49%; 48%), cheese (49%; 41%), frozen pizza or pizza-type snacks (47%; 40%), frozen desserts (47%; 44%), and granola bars or other portable snacks (47%; 44%). Exposure to marketing for products such as compartment-based lunch kits is much lower for both parents and their children (27%; 28% respectively).
There are very few differences, although parents indicate that older children are more likely to have been exposed to marketing for potato chips, popcorn and other similar snacks (58% for those with children aged 7 to 12 only vs. 50% for those with children aged 2 to 6 only), juice, soft drinks or sports drinks (58% vs. 49%) and frozen pizza or pizza-type snacks (43% vs. 34%).
Q20. Thinking back over the last 30 days, to the best of your knowledge please indicate whether you and/or your child/children have been exposed to marketing for any of the following categories of products. Again, by marketing we mean advertising, promotions, packaging, displays, etc.?
'I HAVE BEEN EXPOSED WITHIN THE LAST 30 DAYS' |
TOTAL | Male | Female | Age 18-34 |
Age 35-44 |
Age 45+ |
Only have children 2 to 6 |
Only have children 7 to 12 |
Have both |
|---|---|---|---|---|---|---|---|---|---|
| n= | 3000 | 1412 | 1578 | 622 | 1482 | 896 | 798 | 1497 | 704 |
| % | % | % | % | % | % | % | % | % | |
| Fast-food or take-out restaurants | 69 | 70 | 68 | 69 | 69 | 69 | 70 | 69 | 68 |
| Potato chips, popcorn or other similar snacks | 60 | 62 | 59 | 60 | 61 | 60 | 60 | 60 | 61 |
| Candy and chocolate | 59 | 59 | 59 | 60 | 58 | 60 | 61 | 58 | 59 |
| Juice, soft drinks or sports drinks | 59 | 61 | 56 | 57 | 58 | 60 | 60 | 58 | 58 |
| Breakfast cereals | 56 | 57 | 55 | 56 | 55 | 57 | 55 | 55 | 58 |
| Yogurt | 54 | 55 | 53 | 52 | 54 | 55 | 57 | 53 | 54 |
| Cakes and cookies | 49 | 49 | 50 | 51 | 47 | 51 | 51 | 48 | 49 |
| Cheese | 49 | 51 | 47 | 47 | 49 | 51 | 50 | 49 | 48 |
| Frozen pizza or pizza-type snacks | 48 | 49 | 47 | 50 | 47 | 48 | 48 | 48 | 48 |
| Frozen desserts (ice cream, frozen yogurt, gelato) | 47 | 47 | 47 | 51 | 46 | 47 | 52 | 45 | 47 |
| Granola bars or similar portable snacks | 47 | 45 | 48 | 45 | 46 | 48 | 49 | 46 | 46 |
| Compartment-based lunch kits | 27 | 26 | 29 | 29 | 27 | 27 | 28 | 26 | 29 |
| I have not been exposed to marketing for any of these categories within the last 30 days | 14 | 12 | 15 | 14 | 14 | 14 | 14 | 14 | 14 |
| YES TO ANY | 86 | 88 | 85 | 86 | 86 | 86 | 86 | 86 | 86 |
| 'MY CHILD HAS/MY CHILDREN HAVE BEEN EXPOSED WITHIN THE LAST 30 DAYS' | TOTAL | Male | Female | Age 18-34 |
Age 35-44 |
Age 45+ |
Only have children 2 to 6 |
Only have children 7 to 12 |
Have both |
|---|---|---|---|---|---|---|---|---|---|
| n= | 3000 | 1412 | 1578 | 622 | 1482 | 896 | 798 | 1497 | 704 |
| % | % | % | % | % | % | % | % | % | |
| Fast-food or take-out restaurants | 63 | 63 | 63 | 60 | 63 | 65 | 60 | 65 | 64 |
| Candy and chocolate | 58 | 57 | 60 | 60 | 57 | 60 | 56 | 60 | 58 |
| Breakfast cereals | 56 | 56 | 55 | 56 | 55 | 57 | 52 | 56 | 59 |
| Potato chips, popcorn or other similar snacks | 56 | 55 | 56 | 52 | 54 | 60 | 50 | 58 | 55 |
| Juice, soft drinks or sports drinks | 55 | 56 | 53 | 51 | 53 | 59 | 49 | 58 | 54 |
| Yogurt | 49 | 49 | 49 | 49 | 48 | 49 | 51 | 48 | 48 |
| Cakes and cookies | 48 | 47 | 49 | 47 | 47 | 49 | 45 | 49 | 49 |
| Granola bars or similar portable snacks | 44 | 43 | 46 | 44 | 43 | 46 | 41 | 45 | 46 |
| Frozen desserts (ice cream, frozen yogurt, gelato) | 44 | 44 | 43 | 41 | 43 | 46 | 42 | 45 | 44 |
| Cheese | 41 | 41 | 40 | 41 | 40 | 42 | 40 | 42 | 39 |
| Frozen pizza or pizza-type snacks | 40 | 41 | 39 | 40 | 39 | 43 | 34 | 43 | 41 |
| Compartment-based lunch kits | 28 | 28 | 28 | 28 | 27 | 30 | 26 | 30 | 27 |
| My child/children has/have not been exposed to marketing for any of these categories within the last 30 days | 15 | 13 | 16 | 16 | 15 | 13 | 16 | 14 | 15 |
| YES TO ANY | 85 | 87 | 84 | 84 | 85 | 87 | 84 | 86 | 85 |
Notably, a higher proportion of Francophones, in Quebec, report lower exposure to food and beverage marketing. These parents are more likely to say that they, and their children have not been exposed to marketing for any of the above categories in the past 30 days (17% and 18% respectively).
The media and places where children have been exposed to these products generally aligns with the degree to which parents say their children are influenced by various forms of marketing utilized by food and beverage companies to advertise and promote their products, as outlined in an earlier section. Most say their children have seen or heard about the products on TV or in-store displays (62% each), supermarket check-outs (58%), and at fast-food or take-out restaurants (53%). Just under half say their children were exposed via product packaging (45%) and YouTube videos (44%). One-quarter to one-third cite vending machines (31%), the Internet (31%), movie theatres (27%) and outdoor advertising (26%). Exposure via social media, giveaways, radio, other types of restaurants, promotional fundraisers, sports events, celebrity endorsements, children's magazines and board games ranges from as little as three percent (3% for board games) to just over one-in-ten (16% for social media).
Again, exposure to specific types of marketing approaches does vary to some extent by the age of the child, with older children more likely than those in the younger age group to have been exposed to marketing of food and beverage products on TV, at vending machines, on the Internet, in movie theatres, via social media, on the radio, through online games and at sports events or sponsored sports activities.
Q21. Where would your child/children have seen or heard about any of these products?
| TOTAL | Male | Female | Age 18-34 |
Age 35-44 |
Age 45+ |
Only have children 2 to 6 |
Only have children 7 to 12 |
Have both | |
|---|---|---|---|---|---|---|---|---|---|
| n= | 2559 | 1223 | 1330 | 525 | 1257 | 777 | 670 | 1290 | 599 |
| % | % | % | % | % | % | % | % | % | |
| Television | 62 | 64 | 61 | 59 | 62 | 66 | 55 | 66 | 63 |
| In-store displays | 62 | 57 | 67 | 65 | 61 | 62 | 66 | 60 | 63 |
| Supermarket checkout | 58 | 53 | 62 | 58 | 57 | 58 | 60 | 56 | 59 |
| At a fast-food or take-out restaurant | 53 | 54 | 51 | 52 | 50 | 58 | 49 | 55 | 52 |
| Product packaging | 45 | 42 | 47 | 48 | 44 | 45 | 47 | 43 | 45 |
| YouTube videos | 44 | 45 | 43 | 42 | 45 | 45 | 41 | 46 | 44 |
| Vending machines | 31 | 33 | 30 | 30 | 31 | 34 | 27 | 34 | 31 |
| Internet/online (general) | 31 | 33 | 29 | 26 | 29 | 39 | 21 | 38 | 28 |
| Cinema/movie theatres | 27 | 27 | 27 | 20 | 26 | 33 | 18 | 33 | 24 |
| Outdoor advertising (billboards, transit ads) | 26 | 26 | 25 | 26 | 24 | 29 | 22 | 28 | 26 |
| Social media (Twitter, Facebook, Snapchat) | 16 | 17 | 15 | 12 | 14 | 21 | 9 | 22 | 11 |
| Giveaways, samples or special offers | 15 | 15 | 14 | 14 | 14 | 16 | 15 | 15 | 14 |
| Radio | 14 | 14 | 14 | 14 | 13 | 15 | 8 | 17 | 14 |
| At another restaurant | 14 | 15 | 12 | 15 | 13 | 14 | 12 | 14 | 14 |
| Online games (video games) | 14 | 14 | 13 | 12 | 12 | 17 | 8 | 17 | 11 |
| Promotional fundraisers for schools and community organizations | 13 | 13 | 14 | 11 | 14 | 15 | 11 | 15 | 13 |
| Sports events/sponsorships | 12 | 14 | 10 | 9 | 12 | 15 | 8 | 15 | 11 |
| Celebrity endorsements | 8 | 9 | 6 | 6 | 6 | 11 | 6 | 10 | 5 |
| Children's magazines | 7 | 7 | 6 | 8 | 6 | 8 | 7 | 7 | 6 |
| Board games | 3 | 3 | 2 | 3 | 3 | 2 | 4 | 2 | 3 |
| Other | 1 | 1 | 1 | 1 | 1 | 2 | 1 | 1 | 1 |
5. Participation in Activities Sponsored by Food and Beverage Companies
As the results suggest, relatively few parents say their children are exposed to food and beverage advertising via school fundraisers, community organizations or sponsored sports events/activities. This is not surprising given that most parents (53%) say their children have not participated in the types of activities that would have exposed them to this type of marketing. One-third of parents (34%) say their children have participated in regularly scheduled school lunches sponsored by a food and beverage company within the last two years; this is more common among those families with children aged 7-12 only (48%) versus those with children in the younger age group, aged 2-6 years (24%). Half as many say their children are involved in an organized sports team sponsored by a food and beverage company (17%) and very few are involved in a club or activity at school sponsored by a food or beverage company (9%).
Q31. Over the last two years has your child/have your children participated in any of the following?
| TOTAL | Male | Female | Age 18-34 |
Age 35-44 |
Age 45+ |
Only have children 2 to 6 |
Only have children 7 to 12 |
Have both | |
|---|---|---|---|---|---|---|---|---|---|
| n= | 3000 | 1412 | 1578 | 622 | 1482 | 896 | 798 | 1497 | 704 |
| % | % | % | % | % | % | % | % | % | |
| NET YES TO ANY | 47 | 48 | 47 | 46 | 48 | 47 | 39 | 48 | 55 |
| A regularly scheduled school lunch (i.e., pizza day or submarine sandwich day), sponsored by a food or beverage company | 34 | 34 | 35 | 32 | 34 | 37 | 24 | 37 | 42 |
| An organized sports team, sponsored by a food or beverage company | 17 | 18 | 16 | 18 | 17 | 15 | 16 | 17 | 19 |
| A club or activity at school, sponsored by a food or beverage company | 9 | 11 | 8 | 10 | 10 | 8 | 7 | 10 | 11 |
| None of the above | 53 | 52 | 53 | 54 | 52 | 53 | 61 | 52 | 45 |
- Seven in ten Quebec residents (71%) say their children are not likely to participate in any of the sponsored activities listed above.
6. Purchase of Branded Items and Other Interactions with Food & Beverage Companies
Another way of determining the impact of Pester Power is the extent of parents who have purchased promotional or branded items for their children featuring corporate logos and characters. Most (75%) of parents say their children have at least one or more of these promotional or branded items, most commonly toys or promotional items from fast-food restaurants (63%). These are much more common among families with children between the ages of 2 to 6 only (70%) or having a mix of children in both age groups (74%) than they are among those families with only children aged 7 to 12 (54%). Notably, women (65%) are more likely to have purchased branded toys or promotional items from fast-food restaurants as compared to men (60%), and this is also the case for younger parents (71% among parents aged 18 to 34 years) as compared to those who are older (54% among parents aged 45 and older).
Toys with a food or beverage company brand, logo or cartoon character are far less common (25% of parents say their children own one or more of these). This is more common among families with children spanning both the younger and older age groups (31%) as well as those with younger children only (27%), compared to those with children who are only in the older age group (21%). Far fewer say they have purchased branded clothing (15%), books (11%), play sets (10%), games (9%), or posters (7%) and these results do not vary significantly by the age of children in the family.
Q25. Please indicate whether your child has/children have any of the following?
| TOTAL | Male | Female | Age 18-34 |
Age 35-44 |
Age 45+ |
Only have children 2 to 6 |
Only have children 7 to 12 |
Have both | |
|---|---|---|---|---|---|---|---|---|---|
| n= | 3000 | 1412 | 1578 | 622 | 1482 | 896 | 798 | 1497 | 704 |
| % | % | % | % | % | % | % | % | % | |
| Toys or promotional items from fast-food restaurants | 63 | 60 | 65 | 71 | 66 | 53 | 70 | 54 | 74 |
| Toys with a food or beverage company brand, logo or cartoon character | 25 | 26 | 24 | 33 | 24 | 21 | 27 | 21 | 31 |
| Clothing featuring a food or beverage company brand, logo or character | 15 | 15 | 16 | 14 | 15 | 16 | 13 | 16 | 16 |
| Books featuring a food or beverage company brand, logo or character | 11 | 11 | 11 | 14 | 11 | 8 | 13 | 9 | 13 |
| Play sets featuring a food or beverage company brand, logo or character | 10 | 11 | 10 | 14 | 10 | 8 | 12 | 9 | 12 |
| Games sponsored by or featuring a food or beverage company brand, logo or character | 9 | 10 | 7 | 12 | 7 | 8 | 8 | 8 | 11 |
| Posters representing a food or beverage brand or cartoon character | 7 | 9 | 5 | 10 | 6 | 6 | 8 | 6 | 8 |
| My child/children does/do not have any of these items | 25 | 25 | 25 | 15 | 23 | 34 | 17 | 33 | 15 |
| YES TO ANY | 75 | 75 | 75 | 85 | 77 | 66 | 83 | 67 | 85 |
- The French population is more likely to state that their child/children does not have any of these items (32%).
Similar to the profiling information on household roles in Section II, the majority of parents (54%) take their children with them when grocery shopping. This is particularly the case for younger parents, aged 18 to 34 (65%) and declines among older parents (54% among those aged 35 to 44; 45% among those 45 years and older). Those with younger children only (45%) or with children who span both age groups (56%) are more likely to say they take their children grocery shopping, compared to those whose children are aged 7 to 12 (47%). This correlates with the relatively high number of parents who say their children, particularly younger children, are exposed to food and beverage advertising through in-store displays, the supermarket check-out, and product packaging, as reported above. Less than one-in-ten parents report that their children play video games (7%), enter contests (6%) or visit websites (6%) sponsored by food and beverage companies.
Q26. About how often does your child/do your children do each of the following?
| TOP 2 BOX - VERY FREQUENTLY/FREQUENTLY | TOTAL | Male | Female | Age 18-34 |
Age 35-44 |
Age 45+ |
Only have children 2 to 6 |
Only have children 7 to 12 |
Have both |
|---|---|---|---|---|---|---|---|---|---|
| n= | 3000 | 1412 | 1578 | 622 | 1482 | 896 | 798 | 1497 | 704 |
| % | % | % | % | % | % | % | % | % | |
| Go grocery shopping with you or another member of your household | 54 | 51 | 56 | 65 | 54 | 45 | 65 | 47 | 56 |
| Play video games sponsored by food and beverage companies | 7 | 7 | 6 | 8 | 7 | 5 | 5 | 7 | 9 |
| Enter contests sponsored by food and beverage companies | 6 | 6 | 6 | 10 | 6 | 4 | 7 | 6 | 7 |
| Visit websites of food and beverage companies | 6 | 6 | 5 | 9 | 5 | 4 | 5 | 5 | 7 |
E. Extent and Impact of Pester Power
Pester Power, or 'The Nag Factor' is a term used by marketers and those who have studied marketing approaches and their impact on children and youth in particular to describe the negative effects of children's influence on their parents' purchasing habits. Essentially, this phenomenon asserts that children have significant power in modern households to influence purchases although they do not have purchasing power themselves. As a result, Pester Power is an approach increasingly employed by marketing agencies and the marketing arms of companies to target the youngest demographic.
While in the previous section, results show that parents certainly feel their children are heavily exposed to marketing by food and beverage companies through a variety of means, in this section we specifically examine the extent to which parents feel under some pressure to purchase the food and beverage products their children request.
1. Frequency of Child Pestering and Response by Parents
Parents were asked outright to indicate how often their children make requests for specific food and beverage products. Almost one-third (31%) say this occurs frequently or very frequently. Almost half (48%) say this happens occasionally. Overall, nine-in-ten parents (90%) say their children request specific products and brands of foods and beverages at least occasionally, if not more often. This is evidence of fairly wide-spread pestering, although these results also suggest that parents may feel they are able to limit the impact given that most are subject to these types of requests on a fairly infrequent basis. It is also possible that parents may not feel they are being pestered until the child's requests or demands reach a certain level of intensity.
Notably, women (35%) are more likely than men (27%) to say this happens frequently or very frequently. This is also the case for younger parents, aged 18 to 34 (37%) who are more likely to say this is the case, compared to parents 35 and older (30%). Significant Pester Power appears to be slightly more of a factor in households with children spanning the younger and older age cohorts (36%) versus those with children aged 2 to 6 only (29%) or those with children in the 7 to 12 age group only (31%).
Q23. In general, how often would you say your child/children request(s) specific products or brands of foods and beverages, including fast-food or take-out restaurants?
| TOTAL | Male | Female | Age 18-34 |
Age 35-44 |
Age 45+ |
Only have children 2 to 6 |
Only have children 7 to 12 |
Have both | |
|---|---|---|---|---|---|---|---|---|---|
| n= | 3000 | 1412 | 1578 | 622 | 1482 | 896 | 798 | 1497 | 704 |
| % | % | % | % | % | % | % | % | % | |
| Very frequently | 6 | 4 | 8 | 8 | 6 | 5 | 5 | 5 | 9 |
| Frequently | 25 | 23 | 27 | 28 | 24 | 25 | 24 | 25 | 27 |
| Occasionally | 48 | 51 | 45 | 45 | 48 | 50 | 47 | 50 | 44 |
| Rarely | 11 | 13 | 10 | 7 | 13 | 12 | 11 | 11 | 10 |
| Very rarely | 8 | 8 | 9 | 9 | 9 | 7 | 10 | 7 | 8 |
| Never | 1 | 1 | 2 | 2 | 1 | 1 | 3 | 1 | 1 |
| Very/frequently | 31 | 27 | 35 | 37 | 30 | 30 | 29 | 31 | 36 |
| Occasionally/rarely | 59 | 64 | 55 | 52 | 60 | 62 | 59 | 61 | 54 |
| Very rarely/Never | 10 | 9 | 10 | 11 | 9 | 9 | 13 | 8 | 9 |
There are also key differences in terms of frequency at which Pester Power is reported, both regionally and across other demographics.
Those more likely to report children's requests with higher frequency (frequently or very frequently) include:
- Residents of Ontario (35%), BC/North (32%) and the Prairies (32%)
- Parents with lower socioeconomic status, including an educational attainment of high school or less (37%) and an annual household income below $60K
Those more likely to report children's requests with lower frequency (very rarely or never) include:
- Residents of Quebec (15%)
2. Purchases in Response to Child's Request
Pester Power is only in play to the extent that parents respond to children's requests.
When asked how frequently they purchase the products or brands their children have requested, just one-in-five (21%) say they do so either frequently or very frequently, but well over half (57%) say they acquiesce to children's requests at least occasionally. The findings are consistent by gender and age of parents as well as by the age of the children in the household.
Q24. And, in general, how often do you purchase products or brands requested by your child/children?
| TOTAL | Male | Female | Age 18-34 |
Age 35-44 |
Age 45+ |
Only have children 2 to 6 |
Only have children 7 to 12 |
Have both | |
|---|---|---|---|---|---|---|---|---|---|
| n= | 2962 | 1399 | 1554 | 607 | 1468 | 886 | 778 | 1488 | 697 |
| % | % | % | % | % | % | % | % | % | |
| Very frequently | 3 | 3 | 3 | 4 | 3 | 2 | 2 | 3 | 3 |
| Frequently | 18 | 17 | 18 | 17 | 18 | 19 | 16 | 19 | 18 |
| Occasionally | 57 | 58 | 56 | 56 | 56 | 59 | 56 | 58 | 55 |
| Rarely | 14 | 14 | 14 | 14 | 16 | 12 | 16 | 13 | 15 |
| Very rarely | 8 | 7 | 8 | 9 | 8 | 7 | 9 | 7 | 8 |
| Never | 0 | 0 | 1 | 1 | 0 | 1 | 0 | ||
| Very/frequently | 21 | 20 | 21 | 20 | 20 | 21 | 18 | 21 | 21 |
| Occasionally/rarely | 71 | 73 | 70 | 71 | 72 | 71 | 72 | 71 | 70 |
| Very rarely/Never | 8 | 7 | 9 | 9 | 8 | 8 | 10 | 7 | 8 |
There are limited differences in the response to pestering by region, with the exception of Quebec, whereby 11% state that they 'very rarely' or 'never' respond to these requests.
Interestingly, when asked what products parents have purchased within the last 30-day period specifically in response to a child's requests, the findings in the table below suggest that Pester Power is both active and effective across many Canadian households with children between the ages of 2 and 12. Nine-in-ten (91%) of parents have purchased at least one or more of the products listed.
A majority of parents say they have purchased breakfast cereals (52%) and potato chips (52%) within the last 30 days, on the request of their children. Just under half have purchased products such as yogurt (49%), fast-food or take-out food and candy/chocolate (48% each), juice or sports drinks (47%) and cheese (44%). Fewer, but still significant proportions, have purchased cakes and cookies (41%), granola bars or similar portable snacks (39%), frozen desserts (35%), and frozen pizza or pizza-type snacks (28%). In line with earlier results, purchase of compartment-based lunch kits on a child's request (12%) was a far less common occurrence, within the last 30 days.
Q22. Which of the following have you or another member of your household purchased in the last 30 days, specifically because your child/children requested it?
| TOTAL | Male | Female | Age 18-34 |
Age 35-44 |
Age 45+ |
Only have children 2 to 6 |
Only have children 7 to 12 |
Have both | |
|---|---|---|---|---|---|---|---|---|---|
| n= | 3000 | 1412 | 1578 | 622 | 1482 | 896 | 798 | 1497 | 704 |
| % | % | % | % | % | % | % | % | % | |
| Breakfast cereals | 52 | 53 | 52 | 55 | 53 | 50 | 51 | 51 | 57 |
| Potato chips | 52 | 51 | 53 | 48 | 53 | 53 | 47 | 56 | 48 |
| Yogurt | 49 | 49 | 49 | 51 | 50 | 45 | 54 | 46 | 49 |
| Food or beverages from fast-food or take-out restaurants | 48 | 48 | 49 | 50 | 47 | 50 | 47 | 50 | 46 |
| Candy and chocolate | 48 | 44 | 51 | 53 | 48 | 43 | 48 | 47 | 48 |
| Juice, soft drinks or sports drinks | 47 | 47 | 47 | 48 | 45 | 49 | 44 | 49 | 45 |
| Cheese | 44 | 43 | 44 | 45 | 43 | 43 | 44 | 44 | 43 |
| Cakes and cookies | 41 | 40 | 42 | 41 | 40 | 42 | 40 | 43 | 38 |
| Granola bars or similar portable snacks | 39 | 36 | 41 | 41 | 39 | 35 | 37 | 39 | 40 |
| Frozen desserts (ice cream, frozen yogurt, gelato) | 35 | 34 | 36 | 31 | 35 | 39 | 32 | 37 | 35 |
| Frozen pizza or pizza-type snacks | 28 | 28 | 28 | 29 | 27 | 29 | 28 | 28 | 29 |
| Compartment-based lunch kits | 12 | 12 | 11 | 14 | 10 | 12 | 10 | 11 | 14 |
| I haven't purchased any of these items as a result of my child/children requesting them | 9 | 8 | 9 | 9 | 8 | 9 | 9 | 8 | 9 |
| YES TO ANY | 91 | 92 | 91 | 91 | 92 | 91 | 91 | 92 | 91 |
Although previous findings suggest that residents of Quebec are somewhat less likely to experience pestering, those who do cite being pestered for dairy products such as yogurt (53%) or cheese (52%).
3. Perceived Impact of Food & Beverage Marketing on Child
Although parents seem to feel that they are able to manage pestering, their purchases within the last 30 days suggest that they are at least somewhat influenced by children's requests for specific foods and beverages. Moreover, results from earlier questions clearly indicate that many parents feel their children are widely exposed across multiple channels to food and beverage advertising. These findings, combined, underscore Pester Power at work in many households with children aged 2 to 12.
Moreover, a large percentage of parents feel their children's health has been adversely affected by food and beverage marketing. While most tend to feel the impact is relatively minimal (53% say 'a little' or 'some'), a small percentage say the impact is significant (15% say 'a lot' or 'a great deal'). Overall, then, over two-thirds of parents (68%) feel their children have been negatively affected at least in some small if not more significant way.
Q17. To what extent do you feel your own children's health has been negatively affected by food and beverage marketing?
| TOTAL | Male | Female | Age 18-34 |
Age 35-44 |
Age 45+ |
Only have children 2 to 6 |
Only have children 7 to 12 |
Have both | |
|---|---|---|---|---|---|---|---|---|---|
| n= | 3000 | 1412 | 1578 | 622 | 1482 | 896 | 798 | 1497 | 704 |
| % | % | % | % | % | % | % | % | % | |
| A great deal | 4 | 4 | 3 | 5 | 4 | 3 | 4 | 3 | 5 |
| A lot | 11 | 12 | 10 | 13 | 10 | 13 | 9 | 11 | 13 |
| Some | 31 | 31 | 31 | 33 | 29 | 33 | 32 | 32 | 29 |
| A little | 22 | 22 | 23 | 20 | 25 | 20 | 19 | 23 | 24 |
| Not much | 23 | 22 | 24 | 22 | 24 | 22 | 26 | 23 | 21 |
| Not at all | 8 | 9 | 8 | 9 | 8 | 8 | 10 | 8 | 8 |
| Great deal/a lot | 15 | 16 | 14 | 17 | 13 | 16 | 13 | 15 | 18 |
| Some/a little | 53 | 53 | 54 | 52 | 54 | 53 | 51 | 55 | 53 |
| Not much/Not at all | 32 | 31 | 32 | 30 | 33 | 31 | 36 | 30 | 29 |
- Of note, over two-in-five Francophones (42%) feel their children are not negatively affected.
The above question was posed to respondents at a fairly early stage in the survey to obtain parents' top-of-mind perceptions of the impact of food and beverage marketing on their children. After considering all the ways in which their children are exposed to food and beverage marketing as well as their children's media usage/screen time and their own purchase behaviours, we asked respondents a similar question towards the end of the survey.
The results show significant movement in perceptions of the impact of food and beverage marketing on children. Just over one-quarter (28%) say that they feel food and beverage marketing has 'a lot' or 'a great deal' of influence on their children's preferences for specific types of food and beverage items. Half (52%) say it has at least 'a little' or 'some.' Just one-in-five (19%) say food and beverage marketing has 'not much' or 'no' influence. The results are fairly consistent regardless of the gender or age of the parent as well as the age of the children.
Q32. To what extent do you feel that food and beverage marketing has an influence on your own child's/children's preferences for specific types of food and beverages?
| TOTAL | Male | Female | Age 18-34 |
Age 35-44 |
Age 45+ |
Only have children 2 to 6 |
Only have children 7 to 12 |
Have both | |
|---|---|---|---|---|---|---|---|---|---|
| n= | 3000 | 1412 | 1578 | 622 | 1482 | 896 | 798 | 1497 | 704 |
| % | % | % | % | % | % | % | % | % | |
| A great deal | 8 | 8 | 8 | 10 | 7 | 9 | 8 | 8 | 9 |
| A lot | 20 | 20 | 20 | 19 | 20 | 21 | 21 | 19 | 21 |
| Some | 36 | 36 | 36 | 37 | 36 | 35 | 33 | 36 | 39 |
| A little | 16 | 17 | 16 | 15 | 17 | 17 | 16 | 18 | 14 |
| Not much | 15 | 15 | 15 | 13 | 16 | 15 | 17 | 15 | 13 |
| None | 4 | 4 | 5 | 5 | 5 | 3 | 6 | 4 | 3 |
| Great deal/a lot | 28 | 28 | 29 | 29 | 27 | 30 | 29 | 28 | 30 |
| Some/a little | 52 | 54 | 51 | 53 | 53 | 52 | 48 | 54 | 53 |
| Not much/None | 19 | 19 | 20 | 18 | 20 | 18 | 23 | 19 | 16 |
III. Detailed Findings: Qualitative Research
A. Overview of Focus Groups
Following completion of the survey and analysis of the findings, a series of focus groups were held with parents and children in order to delve more deeply into the aspects of food and beverage marketing that attract children and signal to them that a product is 'intended' for them. The focus groups also provided an opportunity to elaborate on some of the findings from the survey with respect to parental concerns about food and beverage marking to children as well as the marketing tactics employed by the industry. More specifically, the discussions centered on understanding in a much more in-depth manner, from the perspective of both parents and the children themselves, the specific design features and elements of logos, product packaging, branded movie concession items and in-store displays that influence and impact children.
Parents and their children, between the ages of 6 and 12, were invited to attend a focus group. Separate 90-minute discussions were held with parents while, simultaneously, another 60-minute discussion was being facilitated with children. In total, eight groups were held – four with parents (two each in Toronto and Montreal) and four with children (2 each in Toronto and Montreal). Groups with children were segmented by age and grade level so that one group in each center was held among younger children aged 6 to 8 and another group was held with older children aged 9 to 12. More details on the methodology for this phase of the research can be found in Section IV.
B. Concerns about Food and Beverage Marketing to Children
Before launching into a more in-depth discussion on the aspects of food and beverage marketing that appeal to or are intended for children, participants to the groups with parents were asked about the extent to which they are concerned about marketing of these types of products to children. The intention of this line of questioning was to provide some illumination on the related survey results and to better understand how vulnerable parents feel their children are to marketing in general.
1. Degree and Nature of Concern
The survey suggests that parents are moderately concerned about food and beverage marketing to children – the majority of parents (77%) responded by saying they are either somewhat (48%) or not very concerned (29%) about the frequency with which their children are exposed to food and beverage marketing. About two-thirds (65%) agreed with the statement that children are exposed to too much food and beverage advertising. In focus groups, when asked at the outset of the discussion, the response was similar. Although parents of younger children (aged 6-8) expressed slightly more concern about marketing by food and beverage companies to children, overall this was not an issue that most thought much about or were necessarily intensely concerned about. Furthermore, many parents in the Montreal groups thought that such marketing provided them an opportunity for an educational moment with their kids. Along the same lines, some parents in the Toronto groups indicated that children today are more educated about healthy diets, eating habits and the environment -topics which are discussed in school – which has had the effect of heightening children's awareness of foods and beverages that are higher in sugar or have lower nutritional value, for example.
In fact, many parents are of the view that children today are not as exposed to food and beverage marketing in the same way that they were as children. This conclusion appears to be mostly based on parents' tendency to equate marketing with advertising. And, advertising tends to be a marketing tactic which is primarily associated with traditional media such as television and radio. A number of parents indicated that their children tend to watch much less TV than they did at the same age and, as a result, are not being 'saturated' or bombarded with miscellaneous advertising from a wide range of food and beverage companies.
"It was really saturated when I was a child … Lucky Charms commercials and Fruit Loops commercials … I find that my kids don't watch that type of TV anymore. They binge watch. They are on social media. I'm sure they get some type of ad pop-ups, but usually it's in relation to what they're doing."
From parents comments it appears that, although they are concerned about advertising online, it is perhaps less of an issue because the advertising is more directly linked to specific shows or activities they have elected to watch or participate in, as compared to traditional TV advertising. In this sense it is not viewed as random or uncontrolled. Parents' concerns about advertising on TV center around the fact that this medium exposes children to view "forced ads," while the ads they may see or hear online, while watching something on Netflix, YouTube or playing a game (i.e., Fortnite), are either more directly related to an activity and therefore are somewhat less concerning or can be skipped.
A number of parents made the point that children are highly exposed to advertising by take-out or fast-food chains, mostly because these outlets are so prevalent in urban centers and unavoidable in their day-to-day routine. Additionally, they say their children are drawn to the 'kids' menus' which are specially designed to attract children's attention. Other parents commented that their children are influenced more heavily by their peers – they notice what their friends are eating and drinking and then ask for the same products or brands. There is also a tendency to share more information via social media.
Elaborating on this issue, parents believe it would be challenging to restrict a child's exposure to marketing. "It's over-saturated, so it [advertising] doesn't pop out at you anymore." Parents of older children, in particular, feel that their children are fairly astute viewers and consumers. As one parent in Toronto indicated "these kids are just so media savvy. Even if they're forced to watch an ad they know how to skip it. In their education they learn media literacy … my son did a whole project on making a cereal ad … so they know what companies are trying to send them in terms of messaging." This leaves parents with some degree of reassurance that their children are able to recognize when they are being actively marketed to and how to minimize or avoid the extent to which they are influenced by branding and marketing efforts.
Notably, as parents continued the conversation a general consensus formed that online marketing is indeed quite pervasive and possibly as concerning as traditional TV advertising given the frequency of screen time for children. Although far from the majority view, one parent did raise a concern about the use of algorithms online that allow marketers to target products more directly to children who appear to show an interest based on their online usage patterns, and then this becomes something they request be added to the shopping list. However, some also feel that, as noted above, kids even at an early age become somewhat immune to the effects of advertising and marketing given the frequency with which they are exposed to it. Their perspective is that increased saturation may in fact reduce the impact of advertising and marketing, rather than have the opposite effect.
2. Perceived Vulnerability of Children Relative to Others
When asked whether their children are more or less vulnerable to food and beverage marketing compared to those in older age groups (teens and younger adults), the response was somewhat mixed. Some parents feel their children are less affected by marketing from food and beverage companies because "they are more focused on other things – toys and games." Others did agree that the impact of marketing is most felt at the time that children see a product in-store. As one parent commented "if they see a flashy box" then they are more likely to ask for it while out shopping.
3. Age at Which Children Begin to Become More Attuned to Marketing
Parents believe that, for the most part, children don't tend to recognize or be drawn to brands or logos until they are a bit older – in the 8-10 year age range – when they are able to make some of their own purchases and/or they become more influenced by peer pressure. That said, the point was raised that younger children may be influenced by older children in the household. Parents also readily admit that younger children, aged 5 or 6, are increasingly exposed to brands, and come to recognize them, as a result of their parents' purchasing patterns and consumer behavior. A number of parents acknowledged frequenting fast-food outlets, including Tim Horton's, Subway and Starbucks, and that as a result their children recognize these brands and specific menu items.
C. Views on Food and Beverage Marketing Tactics Aimed at Children
As discussions progressed, many parents were able to readily identify specific food and beverage products which appear to be more intentionally marketed to children. They also cited a range of marketing tactics, many of which go well beyond traditional advertising.
1. Food and Beverage Categories Perceived to Market More Directly to Children
Parents indicated that the most common products that tend to be marketed more directly to kids, within the broader food and beverage category, include:
- Cereals – this was viewed as the leading item by many parents, especially those with younger children
- Processed snacks
- Lunch compatible foods (i.e., food items that are easy to pack in a lunch such as cheese strings)
- Candy
- Pizza
- Yogurt – particularly drinkable yogurt products
- Juices and carbonated drinks
- Fast foods – McDonalds was specifically mentioned with play structures and Happy Meals being designed specifically to target children as well as joint marketing initiatives with movies (i.e., toys based on the movie)
As one parent indicated in reference to the co-marketing initiatives between fast-food companies and movie productions "it's not really even about the meal, it's about getting the toy." In the same vein, another parent cited children's interest in Kinder Eggs "it's not about the egg, it's the toy."
With respect to lunch compatible foods, one parent commented that "this is about their image … what they are going to eat in front of their friends at school" and, as such, children are particularly conscious of marketing campaigns within this sub-category.
Packaging of yogurt and particularly movie co-branding or themed package designs (i.e., princesses) was highlighted as one of the dominant products where marketing appears clearly aimed at children.
2. Dominant Marketing Tactics
Parents cited a slate of marketing tactics used by food and beverage companies specifically aimed at children. While there was some overlap between parents of younger and older children, there were also some notable differences.
Product packaging and in-store displays were among those tactics identified as having the most impact across both groups of parents (i.e. those with younger and older children). Similarly, parents in both groups mentioned celebrity endorsements as a common tactic. Co-marketing initiatives with movie products, while mentioned by both groups as a common marketing tactic used by the food and beverage industry, was cited by parents of older children as one of the more powerful and effective marketing tools. Notably, festivals and events as well as food/beverage samples were identified in both groups, but again are viewed as more effective means of influencing older children.
The range of tactics mentioned by parents is shown below and is separated according to the age of their children. The items which are bolded highlight those that were identified as the tactics that are most effective and have, according to parents, the most impact on their children.
| Parents of younger children identified… | Parents of older children identified… |
|---|---|
|
|
What is specifically notable about the above lists is the relative absence of traditional media as a key marketing tool or channel. Some parents with older children mentioned radio, billboards and flyers. For the most part, however, the key tactics identified focused on packaging, displays, co-branding or co-marketing initiatives, toys and collectibles, contests and give-aways, events (music/sports) and online marketing initiatives.
Brand and Packaging Elements That Attract Children's Attention
In order to better understand the elements of food and beverage marketing that attract and influence children, both parents and children groups were shown a series of images, which included logos and product packaging. Imagery was provided by Health Canada and was varied in nature to elicit a range of responses.
1. Logos
During the groups, both children and their parents were asked to view a series of logos with varying design elements such as colour and imagery. The intent of the exercise was to test the attractiveness and influence of logos when other context (packaging, advertisement) had been removed. The logos presented to the groups were from companies that produce food and beverage products as well as restaurants and fast food chains. An image of all logos shown in the groups is provided for reference below.
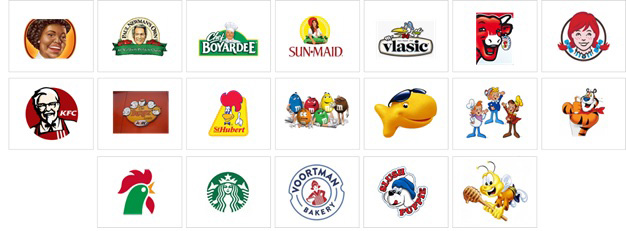
Text description: Figure 2. A grouping of 19 unique brand images. In order starting from the top left: Aunt Jemima, Paul Newmann’s Own, Chef Boyardee, Sun-maid, Vlasic, Laughing Cow, Wendy’s, Kentucky Fried Chicken, A&W, St-Hubert, M&M, Goldfish Crackers, Rice Krispies, Tony the Tiger, Corn Flakes, Starbucks, Voortman Bakery, Slush Puppie, and Honeynut Cheerios.
Intended Audience – Children versus Adults
Among all participants, there was a clear delineation as to which logos were intended for children and subsequently for adults. A summarized list of the categorization of logos identified in the groups is outlined below
| Children | Adults | Both |
|---|---|---|
| Laughing Cow | Aunt Jemima | Sun-Maid |
| Wendy's | Paul Newman's Own | Vlasic |
| Cheerios Honey Bee | Chef Boyardee | KFC Colonel |
| M&Ms | St Hubert | A&W |
| Goldfish | Corn Flakes Rooster | Voortman Bakery |
| Rice Krispies – Snap, Crackle, Pop | Starbucks | |
| Tony the Tiger | ||
| Slush Puppie |
Overall, there were two design elements within a logo that made them appear to be intended for children.
The first was that the logo included some sort of cartoon like character. For example, logos such as the Laughing Cow, Slush Puppie, M&Ms, Gold Fish, Snap Crackle Pop, Tony the Tiger and the Cheerios Honey Bee were all identified as selling products for children.
Interestingly, among the English groups children identified the KFC Colonel as selling products for children however, Paul Newman Own and Chef Boyardee logos were identified as intended for adults. When probed, children suggested that the KFC Colonel looked more like a cartoon whereas the image in the other two logos looked like "an old man". Similarly, while many children did not associate the Vlasic logo with products specifically for kids, many did say that bird shown on the logo looked "like it was something meant for kids."
The second design element that differentiated whether a logo was seen to sell products for children or adults was the use of colour. Unanimously, multiple, bright primary colours in a logo signaled that the company made something that would appeal to them. For example, some children commented that the Starbucks logo was for adults because it "only had two colors" or featured "a weird lady figure". Another participant commented that the Paul Newman's Own logo colouring was "boring". As per the list above, overall the logos that were identified as intended for children all tend to be more bright and colourful in nature against the comparative set.
While many initial responses were based upon children's previous experience with a brand, it was interesting to uncover insights from logos that children were less familiar with. For example, Voortman's Bakery was not familiar to most participants, however the word 'bakery' led them to believe that this company would make products for both adults and kids. Similarly, one children's group was unfamiliar with the Corn Flakes logo and the children believed that it looked like a chicken, which he/she associated being for adults.
Appeal to Children
In order to evaluate attractiveness of the logos, children participated an exercise in which they were asked to place a sticker on their top three favourite logos. The combination of results from this exercise across all groups suggest the following logos as most attractive to children:
- M&Ms - this was, by far, the leading choice across all children's groups
- Slush Puppie - also very well-liked by many children
- KFC
- Wendy's
- Cheerios Honey Bee
- Laughing Cow
- Snap Crackle Pop
- Tony the Tiger
Findings from this exercise suggest that, outside of previous experience with the brand/product, the items that make children feel a logo intended for them (cartoon characters and bright colours) are also the elements that result in attraction.
Notably, characters with animated expressions such as big smiles (i.e. Laughing Cow, Goldfish, Tony the Tiger) or a funny demeanor, such as on the M&M logo, were also very attractive to children. Children found these expressions relatable and specifically mentioned that they liked their smiles, big eyes, gestures, and the idea of the food being 'make believe'. In particular this was clear for the Slush Puppie logo, where children liked the fact that you could see the dog's tongue. One participant stated "the dog looks like he is eating something yummy".
Generally children were less attracted to logos that they considered to be 'boring', which include those with more dull colouring and logos that used real images particularly of people (older) and foods they find to be 'healthy'.
2. Product Packaging
Following the evaluation of the logos, both children and parents were shown a series of product packaging for cookies and crackers. Similar to the logos, the objective was to determine which aspects of the packaging suggested that a product was for children or for adults, but ultimately to identify the elements of packaging is considered to be appealing to children. The 22 images of product packages presented to all groups are provided below.
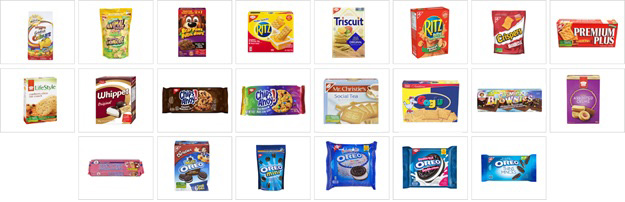
Text description: Figure 3. A grouping of 22 unique images of food packaging. From top left to right: Goldfish Crackers: Rainbow Edition, Animal Crackers, Bear Paws, Ritz Crackers n’ Cheese Dip, Triscuit Original Crackers, Ritz Bits Sandwiches, Crispers Barbeque, Premium Plus Salted Tops, Lifestyle Cookies, Whippet, Chips Ahoy: Triple Chocolate Chunks, Chips Ahoy Rainbow, Social Tea Biscuits, Goglu, Cosmic Brownies, Assorted Crème Cookies, Voortman Strawberry Wafers, Mini Oreo Cookies, Oreo Minis, Oreo Birthday Cake Cookies, Double Stuff Oreo Cookies, and Oreo Thins.
Intended Audience – Children versus Adults
Participants were shown the above images and asked to articulate as to whether the product was intended for children or adults. The cumulative results across groups are outlined in the chart below.
| Children | Adults | Both |
|---|---|---|
| Goldfish crackers | Triscuit | Mini-ritz peanut butter |
| Animal crackers | Crispers | Whippet |
| Bear Paws snack packs | Premium Plus | Chips Ahoy chunk |
| Ritz Handi Snacks | Lifestyle | Goglu |
| Chips Ahoy rainbow | Social Tea | Assorted Cream |
| Debbies Cosmic Brownies | Voortman wafer |
There is quite a clear distinction between the styles of packaging that participants say would appeal to children versus adults. The results of this exercise confirmed expectations that many of the packages that are intentionally targeted to children do resonate with them.
Similar to the findings from the logo exercise, packaging that includes an anthropomorphic character (i.e., Goldfish, Animal crackers, Bear Paws) and even more so if the product itself was animal shaped, indicated that this was intended for children. This was specifically apparent when probing around the Goglu crackers. While many were not familiar with the brand and thought the look of the crackers would suggest the product was for adults, they felt that because the packaging included a bird with a hat and glasses that the product would also be intended for children.
Packaging that included some sort of 'play' element was also seen as intended for children. For example, participants agreed that Ritz Handi snacks were for kids because they would like action of spreading the cheese onto the crackers.
Lastly, the colouring on a packaging, specifically rainbow colouring, suggested that a food product was one intended for children. A good example was when participants were probed around Chips Ahoy brand cookies. Participants were shown two different packages of Chips Ahoy – the chocolate chunk version with brown packaging and the rainbow version illustrated with various rainbow colours on the package (see images above). There was a clear perception across all groups that the Chips Ahoy chunk cookies were for adults, while the rainbow version were for children. Overall, cookie and cracker packaging that was seen to be intended for adults appeared to be much more neutral or 'bland'.
Other elements of packaging that suggested a product was for adults included the addition of other types of 'adult food' on the package such as cranberries or olives (Lifestyle) and coffee or tea (Social). Interestingly, for Lifestyle cookie packaging some children perceived the cookie to have nuts and given the restrictions in school systems around allergies, children immediately thought this was not intended for them. In the same vain, Crispers were also seen to be for adults because of the barbeque flavoring and some children suggested that "barbequing is for adults." Where packaging included elements related to children and adults, participants views were mixed and suggested the food item would be for both parties.
Appeal to Children
In order to gauge appeal to various packages, children were asked to select the top three cookies or crackers that they would like to try. The outcome from all groups is reflected in the list below.
- Whippet
- Cosmic Brownies
- Vortmaan Strawberry Wafers
- Chips Ahoy Rainbow
- Assorted Crème
The overarching takeaway from this exercise is that the elements that have the most impact on children include the following:
- Imagery of the product (cookie/cracker) itself shown on the package
- Rainbow colours and sprinkles
- Anthropomorphic or cartoon figures
- Large 'bubble' letters and fonts
- Imagery with dynamic movements
One of the most significant takeaways was that including an actual image of the food product itself had a major influence on whether the product would appeal to children. If the child could see what the cookie or cracker looked like, it allowed them to determine if they would like it, more so than packages without an image. While this was clearly stated for Cosmic brownies and Chips Ahoy rainbow examples, it was also seen in other more unexpected examples. In the English groups, a surprising finding was that almost all children said they would like to try the Whippet cookie. When probed, children mentioned that while the colours of the package were somewhat muted, the fact that they could see the cookie and it looked like it had chocolate and marshmallow, like a s'mores, was appealing. Similarly, the Assorted Crème cookie was of interest to children because they could clearly see the jelly filling in the middle of the cookie, which they believe would taste good.
Again, parents and children alike agreed that children generally are attracted to packaging that includes rainbow colours. Specifically, when the package showed rainbow sprinkles (i.e. Cosmic brownies, Chips Ahoy rainbow) this was very appealing. In some cases, older children (aged 9-11), articulated that the products with rainbow colouring appeared to look 'artificial'. Overall, there is a sense that while children may be attracted to rainbow colouring if it is seen as too artificial or unhealthy they may be turned away.
It was evident that large, bubble style fonts were also viewed as attractive to children. In particular the fonts on packages such as Cosmic Brownies, Oreo cookies and Bear Paws were cited.
Including dynamic imagery, such as an Oreo cookie dunking into milk, was of appeal to children. The fact that they could 'play' with the food appeared to make it more attractive to children. This was also echoed by the parent groups.
In order to further evaluate the effects of packaging elements, participants we're shown various versions of a highly popular brand of cookies - Oreos. The imagery featured mini Oreos, Oreo Thins, Double Stuf Oreos, and Birthday Cake Oreos and participants were asked to choose which products they were most interested in. While individual opinions varied, there was some clear findings across all groups. While many preferred the Double Stuf Oreos because they thought there would be more cream filling, others preferred the mini Oreos because they felt that they could eat more in terms of quantity. Many also said they preferred the Birthday Cake Oreos because they could see the sprinkles and the cake, which represented 'party' and 'fun' to them.
3. Movie Concession Items
The topic of movie concession items was raised only in the groups with parents. Parents were shown a selection of examples of movie concession products, primarily beverage containers and popcorn buckets, with varying levels of design elements and branding, from more generic to more heavily branded and ornamented. Some could be described as a collectible or as having higher or lower 'play' value. Most of the examples shown were intended to market a specific movie, some of which were rated PG while others were rated PG 13, and a number included a design feature that picked up on the movie theme. Others incorporated a specific character from the movie.
The items tested are shown below:
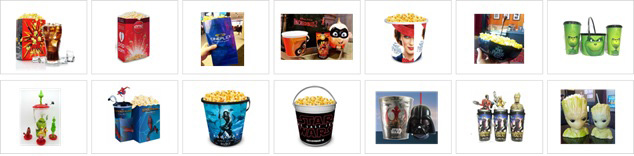
Text description: Figure 4. A grouping of 14 unique movie concession items and licensed movie concession packages.
Unanimously, parents felt that the items containing a link to the movie which the child was seeing and specifically those that incorporated an ornamental or collectable element (i.e., figurines or unique design) were those to which their children are primarily drawn to. Parents themselves felt these products enhance their children's enjoyment of the movie and, as a result, are generally happy to purchase them. At the same time, they also commented that these products have limited play or retention value. Many indicated their children do not continue to use them once they've finished watching the movie.
While many of the examples shown to parents were colourful, the containers that contain more static imagery (i.e., the movie title and/or a static image from the movie) were viewed as less popular among their children. The primary attraction is to containers that include interesting design features (i.e., containers shaped like the umbrella from Mary Poppins (item 6), or the characters from the Grinch (item 8), Star Wars (beverage container in item 12) and Guardians of the Galaxy (items 13 and 14)). These items were not only colourful, but were seen as have unique design features or elements that further immersed the child in the viewing experience. Having movie-themed beverage containers and popcorn buckets is seen as "a novelty," and as "part of the movie." "They're going out to see that movie, and it's [having the themed containers] part of seeing the movie." In many cases, parents themselves were also drawn to the themed containers and/or those that incorporated unique design features, characters and collectible elements. They also described them as "cool."
Overall, the containers with character designs were viewed as most appealing to their children, followed by those that were movie-branded. The more generic movie theater-branded containers were of significantly less interest to their children. The retention value also held some appeal with children, and with parents, who liked the fact that beverage containers in particular could be re-used. In this respect, these containers were felt to have some environmental benefit. Parents also mentioned that their children enjoyed re-using collectible containers as they associate fond memories of having seen the movie. Parents themselves recall doing the same when they were younger – as one parent commented: "I remember going to McDonald's and collecting the Dick Tracy watch." Thus, parents reflect back upon their experience and they can fully appreciate why their child would request these types of collectibles as well as the positive memories associated with them.
Parents had few concerns about whether the films shown on the packaging were appropriate for their children to see, even for those which were rated as PG-13. The commonly-held view was that 'parental guidance' suggests that children are not prohibited from seeing the movie (i.e., it is not absolutely restricted to those 13 and older) and that many parents would be attending the movie with their children, especially for those with younger children. As such, they had few qualms that the marketing tie-ins might be inappropriate for their children under age 13. In fact, some parents felt that the collateral associated with PG13-rated movies is often marketed to younger age groups and that those aged 13 and older would not find the collectibles as appealing. Additionally, some parents noted that the movie marketing tie-ins are so widespread, it is virtually impossible to escape them. As one parent commented "your kid is going to see these characters on pyjamas or other toys in Toys R Us, so …".
E. The Impact of Grocery Store Displays
At the outset of the discussion, parents identified grocery store displays as having a high impact on their children, specifically displays located at check-out counters, but also those situated throughout the store. Displays that included tasting samples were particularly effective and a number of parents cited the prevalent use of this technique at stores like Costco.
Responses to the survey also underscored the impact of in-store displays with over half (57%) of parents saying that their children are influenced a lot or a great deal by this type of marketing tactic, placing it among the top five most influential forms of media, according to parents. The supermarket check-out ranked 5th in the survey with just over half (53%) indicating this approach has some or a great deal of influence.
In focus groups, parents were asked specifically about the types of displays and the particular elements of these displays that attract children. As with logos, product packaging and movie concession items, examples of different types of in-store displays were shown to parents to stimulate their thinking on this topic. This topic was discussed with parents only. As such, the findings elaborated on below reflect the views of the four groups with parents undertaken in Toronto and Montreal.
The focus of discussions on this topic centered on three specific questions:
- Do grocery displays influence children's food desires?
- What types of displays are most appealing to children?
- What is it about them that makes them attractive to children?
1. Grocery Shopping Habits
Before probing on the effectiveness of in-store displays, we asked parents how they feel about shopping with their children. While very few indicated that they try to avoid it, because their child is pestering them, many were split between either preferring to grocery shop alone so they get it done faster or, in fact, enjoying the experience of choosing foods with their children.
When the children were asked specifically about going to the grocery store, many gave similar responses in that they typically participate in this activity with their parents. Interestingly, children were very vocal with most saying they do pester their parents to purchase specific products for them while shopping.
2. Regular Store Displays
Ten examples of various types of displays were shown to parents, as described on the list below. They included end of aisle displays, stand-alone displays, in-aisle displays and those which incorporated unique design features (i.e., displays in the shape of trucks) as well as contests.
Text description: Figure 5. A grouping of 10 unique food and beverage store displays.
While most parents felt that displays did have an impact, they also said that some types of displays are more effective than others at getting children's attention. The more effective displays incorporated the following elements or features:
- Bright
- Colourful
- Expansive, large, exaggerated types displays (i.e., oversize cardboard cut-outs)
- Placement in the store (i.e., in well-lit areas and in-aisle displays)
- Less angular shaped displays (i.e., those that are not "boxy" or necessarily symmetrical). As one parent commented, children are more drawn to softer, rounder display shapes that they tend to associate more with "fun"
- Displays containing play features (i.e., playground type elements)
Displays that are set-up so that children can easily grab packages ("Children wouldn't gravitate to a display of cases of coke … it's not something they can easily pick up. They can go grab a Kit Kat bar no problem.")
- Samples
Parents mentioned that in-aisle displays can be particularly effective, relative to end-of-aisle displays, because shoppers physically have to navigate around them increasing the likelihood that their children will notice and be drawn to the display. Displays at eye level or constructed so that children can touch display elements or product packaging are also very effective.
3. Seasonal Store Displays
Parents were asked specifically about the impact and appeal of seasonal displays. Overwhelmingly parents indicated that these types of displays had high appeal with their children as children understood they were available for a temporary period of time only. As parents commented, seasonal displays are "the best ones!" The time-limited nature of the display and product availability results in increased pressure and Pester Power from children. There is also a large 'anticipate' factor in play as children see signs of a specific holiday or event approaching and the marketing around that event builds a high level of anticipation and excitement.
Additional elements of seasonal displays that catch children's attention include:
- Lights
- Sounds
- Vibrant colours
- Interactive features (i.e., rotating snowman, animation boards) which encourage children to engage with the display and/or the products
As with any display, but particularly seasonal displays, children are drawn to something they can touch and play with. Parents also mentioned that seasonal displays are often placed close to the entrance or exit to the store, so "you can't miss it."
F. Screen Time and Other Relevant Feedback
To conclude the session, parents were asked a few final questions around online activities and those aisles in the grocery store that are most appealing to their children. On the latter point, parents indicated that their children are mainly drawn to the cereal and snack aisles as well as the check-out counter. The children groups echoed this finding, stating their favourite aisles were the chip, cookies, and cereal aisles.
To wrap up the group with children, participants were asked about the types of things they are watching on television or doing online. While many said they are doing both, they definitely suggested that they are online more, either watching YouTube videos or playing games. Unanimously, children mentioned that they do see advertising frequently on these platforms. While they stated a wide variety of product ads, the discussion did include food and beverages.
With respect to screen time, as parents indicated in the survey, many younger children in particular spend a great deal of time watching YouTube videos. They are especially interested in videos showing someone opening a package or a box – as an example, unwrapping Kinder Eggs to find out what the surprise is inside. There is clearly some entertainment value to this which appears to mask the marketing aspect.
Coming out of the session, parents of younger children commented that based on the discussion and very in-depth examination of various marketing tactics and tools employed by food and beverage marketing companies, they might now be somewhat more aware of what their children are requesting and why they might be requesting a particular product. But, for the most part, parents felt they were still in control of what gets put in the grocery cart. As such, while their children may be drawn to a product, they as parents will ultimately decide if it gets purchased. At the same time, parents recognized that the products that are targeted to them are often those they "shouldn't have" given lower nutritional value, for example.
IV. Detailed Methodology
This research study was undertaken using a combined quantitative-qualitative methodology as described below.
A. Quantitative Component
1. Sample Design
Respondents were selected through the use of a representative online panel. The data was collected using a non-probability sampling method, targeting parents with children aged 2-12 years old. The age of children was monitored throughout field, to ensure a good cross section for analysis on this key variable.
Hard quotas were set, as per the chart below, to ensure a good representation by region. A disproportionate sample design was employed on n=3000 to provide a minimum of n=200 completions in each of Manitoba and Saskatchewan*. Weighting was applied to the final, cleaned data to ensure that the sample was weighted back proportionate to the 2016 Census by region.
| REGION | % OF POPULATION | PROPORTIONATE SAMPLE | DISPROPORTIONATE SAMPLE |
|---|---|---|---|
| Atlantic | 7% NFLD 2% PEI <1% Halifax CMA 1% Balance NS 2% NB 2% |
210 | 250 |
| Quebec | 24% Montreal CMA 12% Balance QUE 12% |
720 | 600 |
| Ontario | 38% Ottawa CMA 3% Toronto CMA 18% Balance ON 17% |
1,140 | 1000 |
| Manitoba | 4% Winnipeg CMA 2% Balance MB 2% |
120 | 200* |
| Saskatchewan | 3% | 90 | 200* |
| Alberta | 11% Edmonton CMA 4% Calgary CMA 4% Balance AB 3% |
330 | 350 |
| British Columbia | 13% Vancouver CMA 7% Balance BC 6% |
390 | 400 |
| TOTAL | 100 | 3000 | 3000 |
No other hard quotes were set, however specific demographic variables were monitored throughout field, including:
- Gender of Parent - aim for a 40/60 male/female split
- Age of Parent
As a panel sample was used for this study, a margin of error does not apply.
2. Pre-test
As per Government of Canada Standards for Public Opinion Research, pre-testing was undertaken prior to launching the survey on March 8, 2019. The survey was pre-tested among n=27 respondents in a soft launch, 16 in English and 11 in French, prior to running live in order to obtain feedback with respect to length, ease of completion, and comprehension. Results from the pre-test were provided to Health Canada and did not result in any additional changes to the survey.
3. Response Rates/Completion Rates
A total of 10,898 invitations were sent, of which 3,005 respondents completed the survey. The overall response rate achieved for the online study is 28 percent and the completion rate is 92 percent.
The following outlines the calculations:
Response Rate = |
Interviews Started | Completion Rate = | Completes + Screen outs + Quota fulls |
| Respondents E-mailed | Total # of Click Ins | ||
| 28% = | 3098 | 92% = | (3005+1426+1301) |
| 10898 | 6240 |
4. Indices and New Variables
As part of the analytical approach for this study, The Strategic Counsel produced a set of indices and new variables to that are used as analytical tools throughout the report.
Q.20 – Exposure to Marketing (last 30 days)
- Parent
- High – checks 9-12 items
- Medium – checks 5-8 items
- Low – checks up to 4 items (or 'no exposure')
- Child
- High – checks 9-12 items
- Medium – checks 5-8 items
- Low – checks up to 4 items (or 'no exposure')
Q.26 – Frequency of Exposure to Food & Beverage Marketing
Points are assigned as follows, based on responses:
- Very frequently = 4
- Frequently = 3
- Occasionally = 2
- Rarely = 1
- Never = 0
Scores on Q.26 a-d could range from 0 (i.e., responded 'never' on all 4 activities) to 16 (i.e., responded 'very frequently' on all 4 activities).
- High Frequency – scores of 7-16
- Moderate Frequency – scores of 4-6
- Low Frequency – scores of 0-3
Q.28 – Connectivity
Points are assigned as follows, based on responses:
- Yes, own device – 2
- Yes, share/family device – 1
- No – 0
Scores on Q.28 a-f could range from 0-18 (maximum would be achieved if the respondent answered 'yes, own' and 'yes, shared' to each of the 6)
- High Connectivity – scores of 7-18
- Moderate Connectivity – scores of 4-6
- Low Connectivity – scores of 0-3
Q.30 – Screen Time/Media Usage
Assign points as follows, based on responses:
- None – 0
- 15 minutes or less – 1
- About 30 minutes – 2
- About an hour – 3
- About 2 hours – 4
- 3 hours or more – 5
Scores on Q.30 a-h could range from 0-40
- Heavy media usage – scores of 15-40
- Moderate media usage – scores of 9-14
- Low media usage – scores of 0-8
Q.31 – Participation in Sponsored Activities
- High participation – checks 2-3 items
- Medium participation – check 1 item
- Lower participation – checks 'none'
Q.33 – Parent's Role in Household
- Primary – checks as 'primary' on all 4 tasks (a-d)
- Shared – checks 'shared' on at least 1 of the 4 tasks
- Not involved – checks 'don't usually do this' on all 4 tasks
New Variables:
- Q.2 – Age of Child/Children
- Only children aged 2-6
- Only children aged 7-12
- Children in both age groups
- Q.20 – Exposure to Marketing
- Parent – Low/Medium/High
- Child – Low/Medium/High
- Q.22 – Purchased fast-food/take-out in last 30 days
- Purchased – checked item at Q.22
- Did not Purchase – did not check item at Q.22
- Q.26 – Frequency of Exposure to Food & Beverage Marketing
- High
- Moderate
- Low
- Q.28 – Connectivity
- High
- Moderate
- Low
- Q.30 – Screen Time/Media Usage
- Heavy
- Moderate
- Low
- Q.31 – Participation in Sponsored Activities
- High
- Low
- Q.33 – Parent's Role in Household
- Primary
- Shared
- Not involved
5. Respondent Profile – Additional Details
The results from the demographic questions, not outlined in Section II, can be found in the tables provided below. Statistical differences, on a question by question basis, across these demographics are highlighted in the report above, where applicable.
Q34. What is the highest level of formal education that you have completed?
| TOTAL | Male | Female | Age 18-34 |
Age 35-44 |
Age 45+ |
Only have children 2 to 6 |
Only have children 7 to 12 |
Have both | |
|---|---|---|---|---|---|---|---|---|---|
| n= | 3000 | 1412 | 1578 | 622 | 1482 | 896 | 798 | 1497 | 704 |
| % | % | % | % | % | % | % | % | % | |
| Some high school | 3 | 2 | 3 | 5 | 2 | 2 | 2 | 2 | 4 |
| High school diploma or equivalent | 12 | 10 | 15 | 21 | 11 | 9 | 13 | 11 | 14 |
| Registered Apprenticeship or other trades certificate or diploma | 6 | 6 | 6 | 7 | 5 | 6 | 6 | 6 | 5 |
| College, CEGEP, or other non-university certificate or diploma | 26 | 21 | 30 | 28 | 29 | 21 | 24 | 27 | 27 |
| University certificate or diploma below Bachelor's level | 7 | 6 | 7 | 8 | 6 | 7 | 7 | 7 | 7 |
| Bachelor's degree | 29 | 32 | 26 | 23 | 29 | 33 | 30 | 29 | 28 |
| Post graduate degree above bachelor's level | 16 | 21 | 12 | 7 | 17 | 22 | 17 | 17 | 13 |
| Prefer not to answer | 1 | 1 | 1 | 0 | 1 | 1 | 1 | 1 | 1 |
| HS or less | 15 | 13 | 18 | 27 | 13 | 11 | 15 | 14 | 19 |
| College/Trades | 32 | 27 | 36 | 35 | 34 | 26 | 30 | 33 | 33 |
| University | 52 | 59 | 45 | 37 | 52 | 61 | 54 | 53 | 48 |
Q35. Which of the following categories best describes you total household income in 2018? That is, the total income of all persons in your household combined, before taxes?
| TOTAL | Male | Female | Age 18-34 |
Age 35-44 |
Age 45+ |
Only have children 2 to 6 |
Only have children 7 to 12 |
Have both | |
|---|---|---|---|---|---|---|---|---|---|
| n= | 3000 | 1412 | 1578 | 622 | 1482 | 896 | 798 | 1497 | 704 |
| % | % | % | % | % | % | % | % | % | |
| Under $20,000 | 3 | 2 | 4 | 6 | 2 | 2 | 3 | 2 | 5 |
| $20,000 to just under $40,000 | 7 | 4 | 10 | 13 | 6 | 6 | 8 | 6 | 10 |
| $40,000 to just under $60,000 | 12 | 8 | 16 | 19 | 11 | 9 | 14 | 11 | 13 |
| $60,000 to just under $80,000 | 12 | 11 | 12 | 17 | 11 | 10 | 12 | 12 | 11 |
| $80,000 to just under $100,000 | 17 | 18 | 16 | 18 | 18 | 15 | 19 | 15 | 19 |
| $100,000 to just under $150,000 | 22 | 26 | 20 | 18 | 25 | 22 | 22 | 23 | 22 |
| $150,000 and above | 17 | 24 | 10 | 5 | 17 | 25 | 14 | 19 | 14 |
| Prefer not to answer | 10 | 8 | 12 | 5 | 10 | 13 | 9 | 13 | 6 |
| <$60K | 22 | 13 | 30 | 38 | 19 | 16 | 25 | 18 | 28 |
| $60K TO $100K | 29 | 29 | 28 | 35 | 29 | 24 | 30 | 27 | 31 |
| $100K+ | 39 | 50 | 30 | 23 | 42 | 46 | 36 | 42 | 36 |
Q38. Were you born in Canada?
| TOTAL | Male | Female | Age 18-34 |
Age 35-44 |
Age 45+ |
Only have children 2 to 6 |
Only have children 7 to 12 |
Have both | |
|---|---|---|---|---|---|---|---|---|---|
| n= | 3000 | 1412 | 1578 | 622 | 1482 | 896 | 798 | 1497 | 704 |
| % | % | % | % | % | % | % | % | % | |
| Yes | 77 | 73 | 81 | 87 | 77 | 71 | 77 | 78 | 77 |
| No | 22 | 26 | 18 | 13 | 22 | 28 | 23 | 22 | 22 |
| Prefer not to answer | 1 | 1 | 1 | 0 | 1 | 1 | 1 | 1 | 1 |
Q39. How many years have you lived in Canada?
| TOTAL | Male | Female | Age 18-34 |
Age 35-44 |
Age 45+ |
Only have children 2 to 6 |
Only have children 7 to 12 |
Have both | |
|---|---|---|---|---|---|---|---|---|---|
| n= | 682 | 382 | 296 | 83 | 340 | 258 | 185 | 337 | 160 |
| % | % | % | % | % | % | % | % | % | |
| Less than 5 years | 9 | 8 | 11 | 17 | 13 | 2 | 16 | 6 | 8 |
| 5-9 years | 21 | 22 | 20 | 34 | 22 | 15 | 24 | 16 | 29 |
| 10-19 years | 31 | 30 | 34 | 30 | 30 | 33 | 31 | 32 | 31 |
| 20-29 years | 18 | 18 | 18 | 13 | 17 | 20 | 14 | 21 | 16 |
| 30 or more years | 18 | 20 | 14 | 5 | 14 | 26 | 13 | 22 | 13 |
| Prefer not to answer | 3 | 3 | 3 | 1 | 3 | 2 | 2 | 3 | 4 |
| 10 years or more | 67 | 68 | 66 | 48 | 62 | 80 | 58 | 75 | 59 |
Q40. Thinking about your ethnic and cultural heritage, do you identify as...?
| TOTAL | Male | Female | Age 18-34 |
Age 35-44 |
Age 45+ |
Only have children 2 to 6 |
Only have children 7 to 12 |
Have both | |
|---|---|---|---|---|---|---|---|---|---|
| n= | 3000 | 1412 | 1578 | 622 | 1482 | 896 | 798 | 1497 | 704 |
| % | % | % | % | % | % | % | % | % | |
| Western European (UK, Spain, Portugal, France, Germany, Austria, Switzerland, etc.) | 42 | 42 | 41 | 39 | 41 | 46 | 39 | 44 | 40 |
| Eastern European (Poland, Hungary, Romania, Ukraine, Russia, etc.) | 11 | 11 | 11 | 12 | 11 | 11 | 11 | 11 | 12 |
| African | 3 | 3 | 2 | 2 | 3 | 2 | 3 | 2 | 3 |
| Middle Eastern (Israel, Syria, Jordan, Egypt, Iran, Iraq, etc.) | 3 | 3 | 2 | 3 | 3 | 2 | 4 | 2 | 3 |
| South Asian (India, Afghanistan, Pakistan, Sri Lanka, etc.) | 5 | 6 | 3 | 4 | 5 | 4 | 5 | 4 | 5 |
| Southeast Asian (Thailand, Vietnam, Singapore, the Philippines, Indonesia, Cambodia, etc.) | 3 | 3 | 3 | 3 | 3 | 3 | 3 | 3 | 3 |
| East Asian (China, Korea, Japan, Taiwan, etc.) | 7 | 9 | 6 | 4 | 7 | 10 | 8 | 7 | 6 |
| South/Central/Latin American | 3 | 3 | 2 | 2 | 3 | 3 | 3 | 2 | 3 |
| West Indian (Caribbean) | 2 | 2 | 2 | 3 | 2 | 2 | 3 | 1 | 2 |
| Other | 17 | 13 | 21 | 21 | 16 | 16 | 16 | 18 | 17 |
| NET DK/NA/NONE | 11 | 9 | 13 | 14 | 11 | 9 | 12 | 10 | 12 |
Q41. How would you best describe the area in which you reside?
| TOTAL | Male | Female | Age 18-34 |
Age 35-44 |
Age 45+ |
Only have children 2 to 6 |
Only have children 7 to 12 |
Have both | |
|---|---|---|---|---|---|---|---|---|---|
| n= | 3000 | 1412 | 1578 | 622 | 1482 | 896 | 798 | 1497 | 704 |
| % | % | % | % | % | % | % | % | % | |
| Remote | 2 | 2 | 2 | 3 | 2 | 2 | 2 | 2 | 2 |
| Rural | 20 | 15 | 25 | 25 | 20 | 16 | 19 | 20 | 23 |
| Urban | 41 | 44 | 39 | 38 | 41 | 43 | 43 | 41 | 41 |
| Suburban | 35 | 39 | 31 | 29 | 35 | 38 | 34 | 37 | 31 |
| Don't know/Prefer not to answer | 2 | 1 | 2 | 4 | 1 | 1 | 2 | 1 | 2 |
| NET REMOTE/RURAL | 22 | 17 | 27 | 28 | 22 | 18 | 21 | 21 | 25 |
| NET URBAN/SUBURBAN | 76 | 82 | 70 | 67 | 77 | 81 | 76 | 78 | 73 |
Q42. What is the size of the community in which you currently live?
| TOTAL | Male | Female | Age 18-34 |
Age 35-44 |
Age 45+ |
Only have children 2 to 6 |
Only have children 7 to 12 |
Have both | |
|---|---|---|---|---|---|---|---|---|---|
| n= | 3000 | 1412 | 1578 | 622 | 1482 | 896 | 798 | 1497 | 704 |
| % | % | % | % | % | % | % | % | % | |
| 1,000,000 or more people | 19 | 22 | 16 | 12 | 19 | 23 | 19 | 19 | 17 |
| 500,000-999,999 people | 11 | 12 | 10 | 11 | 11 | 12 | 11 | 11 | 12 |
| 100,000-499,999 people | 22 | 25 | 20 | 19 | 23 | 23 | 21 | 23 | 22 |
| 50,000-99,999 people | 10 | 10 | 10 | 12 | 10 | 10 | 13 | 10 | 8 |
| 10,000-49,999 people | 12 | 13 | 11 | 14 | 11 | 12 | 11 | 11 | 14 |
| 5,000-9,999 people | 6 | 5 | 7 | 8 | 7 | 4 | 7 | 6 | 6 |
| Under 5,000 people | 11 | 9 | 14 | 15 | 11 | 10 | 10 | 11 | 14 |
| Don't know/Prefer not to answer | 8 | 4 | 12 | 8 | 10 | 5 | 9 | 8 | 8 |
| <10,000 | 18 | 14 | 21 | 24 | 17 | 14 | 17 | 17 | 19 |
| 10,000-99,999 | 22 | 23 | 21 | 26 | 20 | 23 | 24 | 22 | 22 |
| 100,000-999,999 | 33 | 37 | 30 | 30 | 34 | 35 | 32 | 34 | 34 |
| 1M or more | 19 | 22 | 16 | 12 | 19 | 23 | 19 | 19 | 17 |
Q43. Language in which survey completed.
| TOTAL | Male | Female | Age 18-34 |
Age 35-44 |
Age 45+ |
Only have children 2 to 6 |
Only have children 7 to 12 |
Have both | |
|---|---|---|---|---|---|---|---|---|---|
| n= | 3000 | 1412 | 1578 | 622 | 1482 | 896 | 798 | 1497 | 704 |
| % | % | % | % | % | % | % | % | % | |
| English | 85 | 85 | 84 | 86 | 83 | 86 | 86 | 84 | 83 |
| French | 15 | 15 | 16 | 14 | 17 | 14 | 14 | 16 | 17 |
B. Qualitative Component
Eight groups of six-to-eight people were held between two locations (Toronto and Montreal) on April 27, 2019. In each location, separate sessions were conducted simultaneously with the two target groups - parents and children. In total, 27 parents and 27 children participated in person.
The Strategic Counsel recruited children through the parents attending. The parents agreed to have themselves and their child participate in the focus group separately. Parents also were required to sign a consent form on behalf of their child at the facilities prior to the group.
Participants were primarily recruited into two groups by the age of the child - younger (aged 6-8) and older (aged 9-12). In all groups, a 50/50 gender split among children was aimed for. In addition to screening based on the age and gender of children, participants were also recruited so that each group had a good mix by the children's screen time, food and beverage requests, and involvement in decisions around eating. As well, recruitment aimed to ensure a good cross section of parents by gender, number of children, household responsibilities, eating habits, marital status, employment, education, income and ethnicity.
Specifications for the focus groups are as follows:
| LOCATION | DATE* | LANGUAGE | TIME | GROUP # | GROUP COMPOSITION |
|---|---|---|---|---|---|
| Toronto | Saturday, April 27th, 2019 | English | 11:00-12:30 | 1 | Parents of children aged 6-8 (Grades 1-3) |
| 11:00-12:00 | 2 | Children aged 6-8 (Grades 1-3) | |||
| 2:00-3:30 | 3 | Parents of children aged 9-12 (Grades 4-6) | |||
| 2:00-3:00 | 4 | Children aged 9-12 (Grades 4-6) | |||
| Montreal | French | 11:00-12:30 | 5 | Parents of children aged 6-8 (Grade 1-3) | |
| 11:00-12:00 | 6 | Children aged 6-8 (Grades 1-3) | |||
| 2:00-3:30 | 7 | Parents of children aged 9-12 (Grades 4-6) | |||
| 2:00-3:00 | 8 | Children aged 9-12 (Grades 4-6) |
The parent groups were 90 minutes in length and the children's groups ran for 60 minutes. Arrangements were made to supervise the children until the conclusion of the focus groups with their parents. Parents and children received a $100 and $40 honorarium, respectively, for their time. Additional details on the dates, location, timing and composition of the groups are provided in the Recruiting Screener included in the Appendix.
As the groups ran simultaneously, four moderators conducted the groups. The groups in Toronto were moderated in English and in Montreal the sessions were moderated in French. A moderator's guide was developed in consultation with Health Canada and was deployed consistently in all discussions. The full guides (in English and French), can be found in the Appendix.
The output from the focus groups were recorded both in audio and video format.
The results from the qualitative research are directional and not statistically projectable to the target population.
Appendix A – Surveys (English and French)
Marketing to Kids
FINAL Survey – Mar. 7, 2019
Thanks for agreeing to participate in this survey. This survey is being conducted by Health Canada and covers a range of topics with a particular focus on food and beverage marketing. It should take you about 15 minutes to complete. Your participation is voluntary and completely confidential. Your answers will remain anonymous.
Click here [POP-UP IN NEW BROWSER WINDOW*] to verify its authenticity.
TEXT TO SHOW ONCE RESPONDENT CLICKS:
This research is sponsored by Health Canada. Note that your participation will remain completely confidential and it will not affect your dealings with the Government of Canada, including Health Canada, in any way.
You may contact Jared Cohen, Senior Advisor, Public Opinion Research, Communications and Public Affairs Branch, Health Canada at 613-608-4123 to verify the legitimacy of this survey.
Click here [POP-UP IN NEW BROWSER WINDOW*] for more information about how any personal information collected in this survey is handled.
TEXT TO SHOW ONCE RESPONDENT CLICKS:
The personal information you provide to Health Canada is governed in accordance with the Privacy Act and is being collected under the authority of Section 4 of the Department of Health Act in accordance with the Treasury Board Directive on Privacy Practices. We only collect the information we need to conduct the research project.
Purpose of collection: We require your personal information such as demographic information to better understand the topic of the research. However, your responses are always combined with the responses of others for analysis and reporting; you will never be identified.
For more information: This personal information collection is described in the standard personal information bank Public Communications – PSU 914, in Info Source, available online at www.infosource.gc.ca
Your rights under the Privacy Act: In addition to protecting your personal information, the Privacy Act gives you the right to request access to and correction of your personal information. For more information about these rights, or about our privacy practices, please contact Health Canada's Privacy Coordinator at 613-948-1219 or hc.privacy-vie.privee.sc@canada.ca. You also have the right to file a complaint with the Privacy Commissioner of Canada if you think your personal information has been handled improperly.
Click here [POP-UP IN NEW BROWSER WINDOW*] for more information about what happens after the survey is completed.
TEXT TO SHOW ONCE RESPONDENT CLICKS
The final report, written by the Strategic Counsel, will be available to the public from Library and Archives Canada http://www.bac-lac.gc.ca/.
INITIAL SCREENING QUESTIONS
1. Please indicate your gender.
- Male
- Female
- Non-binary, LGBTQ
- Prefer not to answer [PN: TERMINATE]
2. What is your age?
- Under 18 [PN: TERMINATE]
- 18-24
- 25-34
- 35-44
- 45-54
- 55-64
- 65 or older
- Prefer not to answer [PN: TERMINATE]
3. In which province or territory do you reside?
- Alberta
- British Columbia
- Manitoba
- New Brunswick
- Newfoundland and Labrador
- Northwest Territories
- Nova Scotia
- Nunavut
- Ontario
- Prince Edward Island
- Quebec
- Saskatchewan
- Yukon
- Outside of Canada [PN: TERMINATE]
- Prefer not to answer [PN: TERMINATE]
3a. Please provide the first 3 characters of your postal code below.
_____ _____ _____
- Prefer not to answer [PN: TERMINATE]
4. Are you the parent or guardian of a child who is between 2 and 12 years of age?
- Yes
- No [PN: TERMINATE]
- Prefer not to answer [PN: TERMINATE]
5. Please indicate how many children you are responsible for who are between the 2 and 12 years of age.
- Age of Child
- Number of Children [PN: DROP DOWN MENU]
- 2 years old [PN: TERMINATE IF RESPONDENT ONLY HAS CHILDREN AGED 2]
- 3 years old
- 4 years old
- 5 years old
- 6 years old
- 7 years old
- 8 years old
- 9 years old
- 10 years old
- 11 years old
- 12 years old
- Prefer not to answer [PN: TERMINATE]
6. Are you responsible for any other children, either younger than 2 of age or older than 12, who live with you? Check as many as apply.
- Yes, younger than 2 years of age
- Yes, older than 12 years of age
- No [PN: EXCLUSIVE]
7. Including yourself, how many people reside in your household?
- 2
- 3
- 4
- 5
- 6 or more
[PN: TOTAL SHOULD BE AT LEAST EQUAL TO NUMBER OF CHILDREN INDICATED AT Q.5, PLUS 1.]
A. FOOD SKILLS
8. In general, would you say that your eating habits are …
- Excellent
- Very good
- Good
- Fair
- Poor
9. When preparing the MAIN meal at home, which one of the following does your family do most often? By main meal we mean the meal of the day that requires the most preparation.
- We use mostly whole basic foods such as vegetables, fruits, pasta, legumes and meat
- We use mostly easy to prepare foods such as frozen lasagna
- We use a mix of whole basic foods and easy to prepare foods
- We buy ready-to-eat food or order take-out or delivery
10. Which one of the following best describes your ability to cook from basic ingredients?
- I don't know where to start when it comes to cooking
- I can do things such as boil an egg or cook a grilled cheese sandwich, but nothing more advanced
- I can prepare simple meals, but nothing too complicated
- I can cook most dishes if I have a recipe to follow
- I can prepare most dishes
- I frequently prepare sophisticated dishes
11. Have you ever used Canada's Food Guide?
- Yes
- No [PN: SKIP TO Q.14]
12. Health Canada recently published a new Canada's Food Guide. Please indicate which of the Guides you have used. Select all that apply. PN: ROTATE FIRST TWO RESPONSES.
- The old Canada's Food Guide [PN: SHOW SCREENSHOT OF OLD FOOD GUIDE]
- The updated Canada's Food Guide, released in 2019 [PN: SHOW SCREENSHOT OF UPDATED FOOD GUIDE]
- I have used a different version of the Guide
- I have not used any Guide [PN: EXCLUSIVE] [PN: SKIP TO Q.14]
13. How have you used the Guide? Select as many as apply. [PN: RANDOMIZE]
- To choose foods for myself
- To determine how much household members need to eat every day
- To plan meals or to help with grocery shopping
- To assess how well household members are eating
- To manage my weight
- To help make healthy choices when eating away from home
- Other: Please specify ________________________
B. CONCERN FOR AND ATTITUDES REGARDING FOOD AND BEVERAGE MARKETING TO CHILDREN
The remaining questions in the survey ask you to think about the impact of food and beverage marketing on your children who are between the ages of 2 and 12. You may have more than one child in this age group. If so, please consider the overall impact and/or the behaviours of all of your children aged 2 to 12 years when responding.
14. How concerned are you about the frequency with which your child is/children are exposed to food and beverage marketing in Canada? By marketing we mean advertising, promotions, packaging and displays from food and beverage companies, including fast-food, take-out or other restaurants.
- Very concerned
- Somewhat concerned
- Not very concerned
- Not concerned at all
15. [IF 'VERY/SOMEWHAT CONCERNED AT Q.14, ASK] What particular aspects of food and beverage marketing to your child/children most concern you? [PN: OPEN-END]
16. Please indicate your level of agreement with the following statements. [PN:CAROUSEL]
PN: ROTATE STATEMENTS
- Strongly agree
- Somewhat agree
- Neither agree nor disagree
- Somewhat disagree
- Strongly disagree
- Advertising of food and beverages contributes to overweight and obesity among children, and to health problems later in life.
- Advertising of food and beverages makes it more difficult for parents to raise healthy children.
- Children are exposed to too much food and beverage advertising.
- It's hard for parents to monitor and control the food and beverage advertising that their children are exposed to
- It is important for adults to protect children from food and beverage advertising.
- Food and beverage advertising affects the choices or requests that children make.
- Food and beverage advertising to children influences what parents buy.
- Food and beverage marketing directed at children is mostly for products that are not healthy.
- Please select 'Somewhat agree" as your answer choice. [PN: RED-HERRING QUESTION. PLEASE ANCHOR IN MIDDLE.]
17. To what extent do you feel your own children's health has been negatively affected by food and beverage marketing?
- A great deal
- A lot
- Some
- A little
- Not much
- Not at all
C. EXPOSURE TO FOOD AND BEVERAGE MARKETING
18. For each of the following categories, please indicate the top 3 brands with which your child is/children are familiar, by writing them in the space provided, OR select none.
PN: RANDOMIZE ITEMS.
- Brand 1
- Brand 2
- Brand 3
- None
- Breakfast cereals
- Candy or chocolates
- Cookies
- Fast-food or take-out restaurants
19. To what extent do you feel your child is/children are influenced by food and beverage marketing aimed at children via each of the following forms of media? [PN:CAROUSEL]
PN: RANDOMIZE ITEMS. 'ITEM T SHOULD ALWAYS FOLLOW ITEM S.'
- A great deal
- A lot
- A little
- Not at all
- Social media (Twitter, Facebook, Snapchat)
- YouTube videos
- Internet/online (general)
- Online games (video games)
- Board games
- Outdoor advertising (billboards, transit ads)
- Cinema/movie theatres
- Television
- Radio
- Sports events/sponsorships
- Promotional fundraisers for schools and community organizations
- Vending machines
- Product packaging
- Supermarket checkout
- In-store displays
- Children's magazines
- Giveaways, samples or special offers
- Celebrity endorsements
- Fast-food or take-out restaurants
- Other restaurants
20. Thinking back over the last 30 days, to the best of your knowledge please indicate whether you and/or your child/children have been exposed to marketing for any of the following categories of products. Again, by marketing we mean advertising, promotions, packaging, displays, etc. Please select all that apply.
PN: RANDOMIZE ITEMS.
- I have been exposed within the last 30 days
- My child has/children have been exposed within the last 30 days
- Breakfast cereals
- Candy and chocolate
- Cakes and cookies
- Frozen desserts (ice cream, frozen yogurt, gelato)
- Juice, soft drinks or sports drinks
- Frozen pizza or pizza-type snacks
- Granola bars or similar portable snacks
- Compartment-based lunch kits
- Potato chips, popcorn or other similar snacks
- Cheese
- Yogurt
- Fast-food or take-out restaurants
- I have not been exposed to marketing for any of these categories within the last 30 days [EXCLUSIVE]
- N/A
- My child/children has/have not been exposed to marketing for any of these categories within the last 30 days [PN EXCLUSIVE]:
- N/A
[PN: IF 'CHILD/CHILDREN NOT EXPOSED AT Q.20, SKIP TO Q.22.]
21. Where would your child/children have seen or heard about any of these products? Please select all that apply.
PN: RANDOMIZE ITEMS. 'ANOTHER RESTAURANT' SHOULD ALWAYS FOLLOW ITEM 'FAST-FOOD OR TAKE-OUT RESTAURANT.' ANCHOR 'OTHER, PLEASE SPECIFY' AS LAST ITEM.
- Social media (Twitter, Facebook, Snapchat)
- YouTube videos
- Internet/online (general)
- Online games (video games)
- Board games
- Outdoor advertising (billboards, transit ads)
- Cinema/movie theatres
- Television
- Radio
- Sports events/sponsorships
- Promotional fundraisers for schools and community organizations
- Vending machines
- Product packaging
- Supermarket checkout
- In-store displays
- Children's magazines
- Giveaways, samples or special offers
- Celebrity endorsements
- At a fast-food or take-out restaurant
- At another restaurant
- Other: Please specify _______________________________
D. MEASURING EXTENT OF PESTER POWER AND HOW PARENT RESPONDS
22. Which of the following have you or another member of your household purchased in the last 30 days, specifically because your child/children requested it? Please select all that apply.
PN: RANDOMIZE ITEMS. ANCHOR 'HAVEN'T PURCHASE ANY' AS LAST ITEM.
- Breakfast cereals
- Candy and chocolate
- Cakes and cookies
- Frozen desserts (ice cream, frozen yogurt, gelato)
- Juice, soft drinks or sports drinks
- Frozen pizza or pizza-type snacks
- Granola bars or similar portable snacks
- Compartment-based lunch kits
- Potato chips, popcorn or other similar snacks
- Cheese
- Yogurt
- Food or beverages from fast-food or take-out restaurants
- I haven't purchased any of these items as a result of my child/children requesting them [PN: EXCLUSIVE]
23. In general, how often would you say your child/children request(s) specific products or brands of foods and beverages, including fast-food or take-out restaurants?
- Very frequently
- Frequently
- Occasionally
- Rarely
- Very rarely
- Never [PN: SKIP TO Q.25]
24. And, in general, how often do you purchase products or brands requested by your child/children?
- Very frequently
- Frequently
- Occasionally
- Rarely
- Very rarely
- Never
25. Please indicate whether your child has/children have any of the following. Select all that apply.
- Toys or promotional items from fast-food restaurants
- Toys with a food or beverage company brand, logo or cartoon character
- Posters representing a food or beverage brand or cartoon character
- Games sponsored by or featuring a food or beverage company brand, logo or character
- Play sets featuring a food or beverage company brand, logo or character
- Clothing featuring a food or beverage company brand, logo or character
- Books featuring a food or beverage company brand, logo or character
- My child/children does/do not have any of these items [PN: EXCLUSIVE]
26. About how often does your child/do your children do each of the following? [PN:CAROUSEL]
PN: RANDOMIZE ITEMS.
- Very frequently
- Frequently
- Occasionally
- Rarely
- Never
- Visit websites of food and beverage companies
- Enter contests sponsored by food and beverage companies
- Play video games sponsored by food and beverage companies
- Go grocery shopping with you or another member of your household
E. OTHER KEY ANALYTICAL VARIABLES
27. About how often do you purchase food or beverages at fast-food or take-out restaurants?
- Never
- Less than once a month
- Once a month
- About 2 to 3 times a month
- About once a week
- Several times a week
- Daily
28. Does your child/do any of your children have access to the following devices?
PN: RANDOMIZE ITEMS
- Yes, their own device
- Yes, a shared/family device
- No
- A cell phone with a data plan
- A personal computer or laptop
- An iPad or tablet
- An iPod or other portable music device
- Video game console
- Smart TV (i.e., regular TV plus ability to use apps, stream, browse, shop, access to Apple TV, etc.)
29. Are there any other devices in your home that your child/children use to access to the Internet? Please list them in the space below.
- No other devices
30. On a daily basis, and excluding time spent at school, approximately how much time does your child/do your children spend doing each of the following?
PN: RANDOMIZE ITEMS.
- None
- 15 minutes or less
- About 30 minutes
- About an hour
- About 2 hours
- 3 hours or more
- Watching TV
- Using a personal computer
- Using a tablet
- Using a smart phone
- Playing games online
- Watching YouTube videos
- Listening to the radio
- Using an iPod/portable music device
31. Over the last two years has your child/have your children participated in any of the following? Please select all that apply.
- An organized sports team, sponsored by a food or beverage company
- A club or activity at school, sponsored by a food or beverage company
- A regularly scheduled school lunch (i.e., pizza day or submarine sandwich day), sponsored by a food or beverage company
- None of the above [PN: EXCLUSIVE]
32. To what extent do you feel that food and beverage marketing has an influence on your own child's/children's preferences for specific types of food and beverages?
- A great deal
- A lot
- Some
- A little
- Not much
- None
33. Which statement best describes your role in your household in each of the following areas?
[PN: RANDOMIZE ITEMS.]
- I have primary responsibility
- I share responsibility
- I don't usually do this
- Doing the grocery shopping
- Planning meals and preparing grocery lists
- Preparing family meals
- Deciding on where to eat for meals taken outside the home (i.e., restaurants or take-out)
F. DEMOGRAPHICS
34. What is the highest level of formal education that you have completed?
- Grade 8 or less
- Some high school
- High school diploma or equivalent
- Registered Apprenticeship or other trades certificate or diploma
- College, CEGEP, or other non-university certificate or diploma
- University certificate or diploma below Bachelor's level
- Bachelor's degree
- Post graduate degree above bachelor's level
- Prefer not to answer
35. Which of the following categories best describes you total household income in 2018? That is, the total income of all persons in your household combined, before taxes?
- Under $20,000
- $20,000 to just under $40,000
- $40,000 to just under $60,000
- $60,000 to just under $80,000
- $80,000 to just under $100,000
- $100,000 to just under $150,000
- $150,000 and above
- Prefer not to answer
36. Which of the following describes your current employment status? Are you …
- Working full-time, that is, 35 or more hours per week
- Working part-time, that is, less than 35 hours per week
- Self-employed
- Unemployed, but looking for work
- A student attending school full-time
- Retired
- Not in the workforce (i.e., Full-time homemaker, unemployed, not looking for work)
- Other
- Prefer not to answer
37. What is your marital status?
- Single, never married
- Married or domestic partnership
- Widowed
- Divorced or separated
- Prefer not to answer
38. Were you born in Canada?
- Yes [PN: SKIP TO Q.40]
- No
- Prefer not to answer
39. How many years have you lived in Canada?
- Less than 5 years
- 5-9 years
- 10-19 years
- 20-29 years
- 30 or more years
- Prefer not to answer
40. Thinking about your ethnic and cultural heritage, do you identify as …? Check as many as apply.
- Western European (UK, Spain, Portugal, France, Germany, Austria, Switzerland, etc.)
- Eastern European (Poland, Hungary, Romania, Ukraine, Russia, etc.)
- African
- Middle Eastern (Israel, Syria, Jordan, Egypt, Iran, Iraq, etc.)
- South Asian (India, Afghanistan, Pakistan, Sri Lanka, etc.)
- Southeast Asian (Thailand, Vietnam, Singapore, the Philippines, Indonesia, Cambodia, etc.)
- East Asian (China, Korea, Japan, Taiwan, etc.)
- South/Central/Latin American
- West Indian (Caribbean)
- Other, please specify: _________________________
- Prefer not to answer
41. How would you best describe the area in which you reside? Is it…
- Remote
- Rural
- Urban
- Suburban
- Don't know/Prefer not to answer
42. What is the size of the community in which you currently live?
- 1,000,000 or more people
- 500,000-999,999 people
- 100,000-499,999 people
- 50,000-99,999 people
- 10,000-49,999 people
- 5,000-9,999 people
- Under 5,000 people
- Don't know/Prefer not to answer
43. Language in which survey completed (Coded)
- English
- French
PRETEST EVALUATION
44. We'd like your feedback on the experience of answering this survey. Please indicate whether you agree or disagree with each of the following statements.
RANDOMIZE STATEMENTS
- Strongly Agree
- Somewhat Agree
- Somewhat Disagree
- Strongly Disagree
- This survey was easy to complete.
- The questions asked were straightforward and easy to understand.
- The length of the survey was reasonable.
- The topic was interesting.
45. Do you have any other comments about this survey or your experience completing the survey? [PN: OPEN-END]
- No other comments
Sondage sur la publicité destinée aux enfants
Version finale — 7 mars 2019
Merci d'avoir accepté de participer à ce sondage. Ce sondage est réalisé par Santé Canada et couvre un éventail de sujets, en s'attardant plus particulièrement à la publicité d'aliments et de boissons. Il vous faudra environ quinze minutes pour remplir le questionnaire. Votre participation est volontaire et confidentielle, et vos réponses resteront anonymes.
Cliquez ici [POP-UP IN NEW BROWSER WINDOW*] si vous souhaitez vérifier l'authenticité de ce sondage.
TEXT TO SHOW ONCE RESPONDENT CLICKS:
Santé Canada est le commanditaire de la présente étude. Soulignons que votre participation est strictement confidentielle et qu'elle n'aura aucune incidence sur vos rapports avec le gouvernement du Canada, y compris avec Santé Canada.
Vous pouvez vérifier la légitimité de ce sondage auprès de Jared Cohen, conseiller principal en recherche sur l'opinion publique – Direction générale des communications et des affaires publiques, Santé Canada, au 613-608-4123.
Cliquez ici [POP-UP IN NEW BROWSER WINDOW*] pour en savoir plus sur le traitement de vos renseignements personnels recueillis durant ce sondage.
TEXT TO SHOW ONCE RESPONDENT CLICKS:
Les renseignements personnels que vous donnez à Santé Canada sont régis par la Loi sur la protection des renseignements personnels et sont recueillis en vertu de l'article 4 de la Loi sur le ministère de la Santé,conformément à la directive du Conseil du Trésor sur les pratiques relatives à la protection de la vie privée. La collecte porte uniquement sur les renseignements nécessaires à la réalisation de l'étude.
Objet de la collecte : Nous avons besoin de vos renseignements personnels, par exemple de données démographiques, pour mieux comprendre le sujet de recherche. Cependant, vos réponses seront toujours regroupées avec celles des autres répondants au moment de l'analyse et des rapports; vous ne serez jamais identifié(e).
Pour en savoir plus : Vous trouverez une description de la collecte de ces renseignements personnels dans le fichier de renseignements personnels ordinaires POU 914 – Communications publiques, dans Info Source, disponible en ligne au www.infosource.gc.ca.
Vos droits en vertu de la Loi sur la protection des renseignements personnels : En plus de protéger vos renseignements personnels, la Loi sur la protection des renseignements personnels vous donne le droit de demander l'accès à ces renseignements ainsi que leur correction, le cas échéant. Pour plus d'information sur ces droits ou sur nos pratiques en matière de protection de la vie privée, veuillez appeler le coordonnateur de la protection des renseignements personnels de Santé Canada au 613-948-1219 ou lui écrire à hc.privacy-vie.privee.sc@canada.ca. Vous avez également le droit de déposer une plainte auprès du Commissariat à la protection de la vie privée du Canada si vous estimez que vos renseignements personnels ont été traités d'une manière inappropriée.
Cliquez ici [POP-UP IN NEW BROWSER WINDOW*] pour savoir ce qui se passera à la suite du sondage.
TEXT TO SHOW ONCE RESPONDENT CLICKS
Le rapport final, préparé par le cabinet The Strategic Counsel, sera accessible au public sur le site Web de Bibliothèque et Archives Canada : http://www.bac-lac.gc.ca/.
INITIAL SCREENING QUESTIONS
1. Veuillez indiquer votre sexe.
- Homme
- Femme
- Personne non binaire, LGBTQ
- Je préfère ne pas répondre [PN: TERMINATE]
2. Quel âge avez-vous ?
- Moins de 18 ans [PN: TERMINATE]
- 18 à 24 ans
- 25 à 34 ans
- 35 à 44 ans
- 45 à 54 ans
- 55 à 64 ans
- 65 ans ou plus
- Je préfère ne pas répondre [PN: TERMINATE]
3. Dans quelle province ou quel territoire habitez-vous ?
- Alberta
- Colombie-Britannique
- Manitoba
- Nouveau-Brunswick
- Terre-Neuve-et-Labrador
- Territoires du Nord-Ouest
- Nouvelle-Écosse
- Nunavut
- Ontario
- Île-du-Prince-Édouard
- Québec
- Saskatchewan
- Yukon
- À l'extérieur du Canada [PN: TERMINATE]
- Je préfère ne pas répondre [PN: TERMINATE]
3a. Veuillez saisir les trois premiers caractères de votre code postal.
_____ _____ _____
- Je préfère ne pas répondre [PN: TERMINATE]
4. Êtes-vous le parent, le tuteur ou la tutrice d'un enfant qui a entre 2 et 12 ans?
- Oui
- Non [PN: TERMINATE]
- Je préfère ne pas répondre [PN: TERMINATE]
5. Veuillez indiquer le nombre d'enfants de 2 à 12 ans dont vous avez la charge.
- Âge de l'enfant
- Nombre d'enfants [PN: DROP DOWN MENU]
- 2 ans [PN: TERMINATE IF RESPONDENT ONLY HAS CHILDREN AGED 2]
- 3 ans
- 4 ans
- 5 ans
- 6 ans
- 7 ans
- 8 ans
- 9 ans
- 10 ans
- 11 ans
- 12 ans
- Je préfère ne pas répondre [PN: TERMINATE]
6. Êtes-vous responsable d'autres enfants, qui ont soit moins de 2 ans, soit plus de 12 ans, et qui vivent chez vous? Cochez toutes les réponses pertinentes.
- Oui, enfant(s) de moins de 2 ans
- Oui, enfant(s) de plus de 12 ans
- Non [PN: EXCLUSIVE]
7. Combien de personnes vivent dans votre ménage, en vous comptant?
- 2
- 3
- 4
- 5
- 6 ou plus
[PN: TOTAL SHOULD BE AT LEAST EQUAL TO NUMBER OF CHILDREN INDICATED AT Q.5, PLUS 1.]
G. COMPÉTENCES ALIMENTAIRES
8. De manière générale, diriez-vous que vos habitudes alimentaires sont…
- Excellentes
- Très bonnes
- Bonnes
- Passables
- Mauvaises
9. Lorsque vous préparez le repas PRINCIPAL à la maison, lequel des choix suivants votre famille fait-elle le plus souvent? Par « repas principal », nous entendons le repas de la journée qui exige le plus de préparation.
- Nous utilisons surtout des aliments de base entiers comme des légumes, des fruits, des pâtes, des légumineuses et de la viande
- Nous utilisons surtout des aliments faciles à préparer, par exemple de la lasagne congelée
- Nous utilisons un mélange d'aliments de base entiers et d'aliments faciles à préparer
- Nous achetons du prêt-à-manger ou nous commandons des mets à emporter ou à livrer
10. Lequel des énoncés suivants décrit le mieux votre capacité à cuisiner à partir d'ingrédients de base?
- Je ne sais pas par où commencer quand il s'agit de cuisiner
- Je sais faire des choses comme faire cuire un œuf ou préparer un sandwich au fromage fondant, mais rien de plus élaboré
- Je peux préparer des repas simples, mais rien de trop compliqué
- Je peux cuisiner la plupart des plats si j'ai une recette
- Je peux préparer la plupart des plats
- Je prépare souvent des plats raffinés
11. Avez-vous déjà utilisé le Guide alimentaire canadien?
- Oui
- Non [PN: SKIP TO Q.14]
12. Santé Canada a récemment publié un nouveau Guide alimentaire canadien. Veuillez indiquer lequel de ces Guides vous avez utilisé. Cochez toutes les réponses pertinentes. PN: ROTATE FIRST TWO RESPONSES.
- L'ancien Guide alimentaire canadien [PN: SHOW SCREENSHOT OF OLD FOOD GUIDE]
- Le nouveau Guide alimentaire canadien publié en 2019 [PN: SHOW SCREENSHOT OF UPDATED FOOD GUIDE]
- J'ai utilisé une aucun Guide
- Je n'ai utilisé aucun de ces deux Guides [PN: EXCLUSIVE] [PN: SKIP TO Q.14]
13. Pour quelles raisons avez-vous utilisé le Guide? Cochez toutes les réponses pertinentes. [PN: RANDOMIZE]
- Pour choisir des aliments pour moi
- Pour déterminer la quantité de nourriture dont les membres de mon ménage ont besoin chaque jour
- Pour planifier les repas ou les achats à l'épicerie
- Pour évaluer dans quelle mesure les membres de mon ménage mangent bien
- Pour gérer mon poids
- Pour faire des choix santé lors de repas pris à l'extérieur
- Autres raisons; veuillez préciser : _______________________
H. PRÉOCCUPATIONS ET ATTITUDES À L'ÉGARD DE LA PUBLICITÉ D'ALIMENTS ET DE BOISSONS DESTINÉE AUX ENFANTS
Le reste des questions du sondage vous invite à réfléchir à l'impact de la publicité d'aliments et de boissons sur vos enfants âgés de 2 à 12 ans. Il se peut que vous ayez plus d'un enfant dans ce groupe d'âge. Si c'est le cas, veuillez considérer dans vos réponses l'impact global de cette publicité sur vos enfants ou les comportements de tous vos enfants âgés de 2 à 12 ans.
14. À quel point trouvez-vous inquiétante la fréquence à laquelle votre enfant ou vos enfants sont exposés à la publicité d'aliments et de boissons au Canada? Par « publicité », nous voulons dire les annonces, les promotions, les emballages et les présentoirs des entreprises d'aliments et de boissons, y compris la restauration rapide, les comptoirs de commandes à emporter ou d'autres restaurants.
- Très inquiétante
- Assez inquiétante
- Pas très inquiétante
- Pas du tout inquiétante
15. [IF 'VERY/SOMEWHAT CONCERNED AT Q.14, ASK] Quels aspects particuliers de la publicité d'aliments et de boissons destinée à vos enfants vous inquiètent le plus? [PN: OPEN-END]
16. Veuillez indiquer dans quelle mesure vous êtes d'accord avec les énoncés suivants. [PN:CAROUSEL]
PN: ROTATE STATEMENTS
- Tout à fait d'accord
- Plutôt d'accord
- Ni d'accord ni pas d'accord
- Plutôt en désaccord
- Pas du tout d'accord
- La publicité d'aliments et de boissons contribue au surpoids et à l'obésité chez les enfants, et à des problèmes de santé plus tard dans la vie.
- La publicité d'aliments et de boissons complique la tâche d'élever des enfants en bonne santé pour les parents.
- Les enfants sont exposés à trop de publicité d'aliments et de boissons.
- Il est difficile pour les parents de surveiller et de limiter la publicité d'aliments et de boissons à laquelle leurs enfants sont exposés.
- Il est important que les adultes protègent les enfants de la publicité d'aliments et de boissons.
- La publicité d'aliments et de boissons influence les choix faits par les enfants ou ce qu'ils réclament.
- La publicité d'aliments et de boissons destinée aux enfants influence les achats des parents.
- La publicité d'aliments et de boissons destinée aux enfants concerne surtout des produits qui ne sont pas sains.
- Veuillez cocher « Plutôt d'accord » comme choix de réponse. [PN: RED-HERRING QUESTION. PLEASE ANCHOR IN MIDDLE.]
17. Selon vous, dans quelle mesure la publicité d'aliments et de boissons a-t-elle nui à la santé de vos propres enfants?
- Énormément
- Beaucoup
- Dans une certaine mesure
- Un peu
- Pas beaucoup
- Pas du tout
I. EXPOSITION À LA PUBLICITÉ D'ALIMENTS ET DE BOISSONS
18. Pour chacune des catégories suivantes, veuillez indiquer dans l'espace réservé à cette fin les trois principales marques connues de votre enfant ou de vos enfants. Au besoin, cochez « Aucune ».
PN: RANDOMIZE ITEMS.
- Marque 1
- Marque 2
- Marque 3
- Aucune
- Céréales pour petit déjeuner
- Bonbons ou chocolats
- Biscuits
- Restauration rapide ou comptoirs de commandes à emporter
19. Selon vous, dans quelle mesure votre enfant ou vos enfants sont-ils influencés par la publicité d'aliments et de boissons ciblant les enfants au moyen de chacun des médias suivants? [PN:CAROUSEL]
PN: RANDOMIZE ITEMS. 'ITEM T SHOULD ALWAYS FOLLOW ITEM S.'
- Énormément
- Beaucoup
- Un peu
- Pas du tout
- Médias sociaux (Twitter, Facebook, Snapchat)
- Vidéos YouTube
- Internet, sites en ligne (en général)
- Jeux en ligne (jeux vidéo)
- Jeux de société
- Publicité extérieure (panneau-réclame, affichage-transport)
- Cinémas
- Télévision
- Radio
- Événements sportifs, commandites
- Collectes de fonds promotionnelles pour des écoles et des organismes communautaires
- Distributrices
- Emballages de produits
- Caisses des supermarchés
- Présentoirs en magasin
- Revues pour enfants
- Cadeaux, échantillons ou offres spéciales
- Promotion par des vedettes
- Restauration rapide ou comptoirs de commandes à emporter
- Autres restaurants
20. En pensant aux 30 derniers jours, veuillez indiquer si, à votre connaissance, vous, votre enfant ou vos enfants avez été exposés à des publicités sur l'une des catégories de produits suivantes. À nouveau, le terme « publicité » renvoie ici aux annonces, aux promotions, aux emballages, aux présentoirs, etc. Cochez toutes les réponses pertinentes.
PN: RANDOMIZE ITEMS.
- Exposition au cours des 30 derniers jours :
Moi - Exposition au cours des 30 derniers jours :
Mon enfant ou mes enfants
- Céréales pour petit déjeuner
- Bonbons et chocolats
- Gâteaux et biscuits
- Desserts glacés (crème glacée, yogourt glacé, gelato)
- Jus, boissons gazeuses ou boissons énergétiques
- Pizzas congelées ou collations de type pizza
- Barres granola ou autres collations semblables en portions individuelles
- Boîtes-repas avec compartiments
- Croustilles, maïs soufflé ou autres collations semblables
- Fromage
- Yogourt
- Restauration rapide ou comptoirs de commandes à emporter
- Je n'ai été exposé(e) à aucune publicité sur ces catégories au cours des 30 derniers jours [EXCLUSIVE]
- S.O.
- Mon enfant ou mes enfants n'ont été exposés à aucune publicité sur ces catégories au cours des 30 derniers jours [PN EXCLUSIVE]
- S.O.
[PN: IF 'CHILD/CHILDREN NOT EXPOSED AT Q.20, SKIP TO Q.22.]
21. À quel endroit votre enfant ou vos enfants auraient-ils vu ou entendu parler de ces produits? Cochez toutes les réponses pertinentes.
PN: RANDOMIZE ITEMS. 'ANOTHER RESTAURANT' SHOULD ALWAYS FOLLOW ITEM 'FAST-FOOD OR TAKE-OUT RESTAURANT.' ANCHOR 'OTHER, PLEASE SPECIFY' AS LAST ITEM.
- Médias sociaux (Twitter, Facebook, Snapchat)
- Vidéos YouTube
- Internet, sites en ligne (en général)
- Jeux en ligne (jeux vidéo)
- Jeux de société
- Publicité extérieure (panneau-réclame, affichage-transport)
- Cinémas
- Télévision
- Radio
- Événements sportifs, commandites
- Collectes de fonds promotionnelles pour des écoles et des organismes communautaires
- Distributrices
- Emballages de produits
- Caisses des supermarchés
- Présentoirs en magasin
- Revues pour enfants
- Cadeaux, échantillons ou offres spéciales
- Promotion par des vedettes
- Établissements de restauration rapide ou comptoirs de commandes à emporter
- Autres restaurants
- Autre endroit; veuillez préciser : _______________________________
J. MESURE DU POUVOIR D'INSISTANCE DES ENFANTS ET RÉPONSES DES PARENTS
22. Lesquels des produits suivants est-ce que vous ou un autre membre de votre ménage avez achetés au cours des 30 derniers jours, expressément à la demande de votre enfant ou de vos enfants? Cochez toutes les réponses pertinentes.
PN: RANDOMIZE ITEMS. ANCHOR 'HAVEN'T PURCHASE ANY' AS LAST ITEM.
- Céréales pour petit déjeuner
- Bonbons et chocolats
- Gâteaux et biscuits
- Desserts glacés (crème glacée, yogourt glacé, gelato)
- Jus, boissons gazeuses ou boissons énergétiques
- Pizzas congelées ou collations de type pizza
- Barres granola ou autres collations semblables en portions individuelles
- Boîtes-repas avec compartiments
- Croustilles, maïs soufflé ou autres collations semblables
- Fromage
- Yogourt
- Aliments ou boissons provenant d'établissements de restauration rapide ou de comptoirs de commandes à emporter
- Je n'ai acheté aucun de ces produits à la demande de mon enfant ou de mes enfants [PN: EXCLUSIVE]
23. En règle générale, à quelle fréquence diriez-vous que votre enfant ou vos enfants réclament des produits ou des marques d'aliments et de boissons précis, y compris les produits provenant d'établissements de restauration rapide ou de comptoirs de commandes à emporter?
- Très souvent
- Souvent
- Parfois
- Rarement
- Très rarement
- Jamais [PN: SKIP TO Q.25]
24. Et de manière générale, à quelle fréquence achetez-vous les produits ou les marques réclamés par votre enfant ou vos enfants?
- Très souvent
- Souvent
- Parfois
- Rarement
- Très rarement
- Jamais
25. Veuillez indiquer si votre enfant ou vos enfants ont les articles suivants. Cochez toutes les réponses pertinentes.
- Jouets ou articles promotionnels provenant d'établissements de restauration rapide
- Jouets comportant la marque, le logo ou le personnage de bande dessinée d'une entreprise d'aliments ou de boissons
- Affiches représentant une marque ou un personnage de bande dessinée d'une entreprise d'aliments ou de boissons
- Jeux commandités par une entreprise d'aliments ou de boissons, ou comportant sa marque, son logo ou son personnage de bande dessinée
- Ensembles de jeu comportant la marque, le logo ou le personnage de bande dessinée d'une entreprise d'aliments ou de boissons
- Vêtements comportant la marque, le logo ou le personnage de bande dessinée d'une entreprise d'aliments ou de boissons
- Livres comportant la marque, le logo ou le personnage de bande dessinée d'une entreprise d'aliments ou de boissons
- Mon enfant ou mes enfants n'ont aucun de ces articles [PN: EXCLUSIVE]
26. À quelle fréquence environ votre enfant ou vos enfants font-ils chacune des activités suivantes? [PN:CAROUSEL]
PN: RANDOMIZE ITEMS.
- Très souvent
- Souvent
- Parfois
- Rarement
- Jamais
- Visiter les sites Web d'entreprises d'aliments et de boissons
- Participer à des concours commandités par des entreprises d'aliments et de boissons
- Jouer à des jeux vidéo commandités par des entreprises d'aliments et de boissons
- Faire l'épicerie avec vous ou un autre membre de votre ménage
K. AUTRES VARIABLES ANALYTIQUES CLÉS
27. À quelle fréquence environ achetez-vous des aliments ou des boissons dans un établissement de restauration rapide ou à un comptoir de commandes à emporter?
- Jamais
- Moins d'une fois par mois
- Une fois par mois
- Deux à trois fois par mois
- Une fois par semaine environ
- Plusieurs fois par semaine
- Tous les jours
28. Votre enfant ou certains de vos enfants ont-ils accès aux appareils suivants?
PN: RANDOMIZE ITEMS
- Oui, à leur propre appareil
- Oui, à un appareil familial ou partagé
- Non
- Téléphone cellulaire avec forfait de données
- Ordinateur ou portable personnels
- iPad ou tablette
- iPod ou autre lecteur de musique portatif
- Console de jeu vidéo
- Télévision intelligente (une télévision ordinaire, mais qui permet d'utiliser des applications, de visionner des émissions en continu, de fureter, de magasiner, d'accéder à Apple TV, etc.)
29. Y a-t-il chez vous d'autres appareils que votre enfant ou vos enfants utilisent pour aller sur Internet? Veuillez en faire la liste ci-dessous.
- Pas d'autres appareils
30. Au quotidien, exclusion faite du temps passé à l'école, combien de temps environ votre enfant ou vos enfants consacrent-ils à chacune des activités suivantes?
PN: RANDOMIZE ITEMS.
- 0
- 15 minutes ou moins
- 30 minutes environ
- Une heure environ
- Deux heures environ
- Trois heures ou plus
- Regarder la télévision
- Utiliser un ordinateur personnel
- Utiliser une tablette
- Utiliser un téléphone intelligent
- Faire des jeux en ligne
- Regarder des vidéos YouTube
- Écouter la radio
- Utiliser un iPod ou un autre lecteur de musique portatif
31. Au cours des deux dernières années, votre enfant ou vos enfants ont-ils participé à l'une des activités suivantes? Cochez toutes les réponses pertinentes.
- Une équipe de sport organisé, commanditée par une entreprise d'aliments ou de boissons
- Un club ou une activité scolaire commandités par une entreprise d'aliments ou de boissons
- Un repas scolaire organisé de façon régulière (p. ex., la journée pizza, la journée sous-marin), commandité par une entreprise d'aliments ou de boissons
- Aucune de ces activités [PN: EXCLUSIVE]
32. Selon vous, dans quelle mesure la publicité d'aliments et de boissons influence-t-elle les préférences de votre enfant ou de vos enfants pour des types précis d'aliments et de boissons?
- Énormément
- Beaucoup
- Dans une certaine mesure
- Un peu
- Pas beaucoup
- Pas du tout
33. Quel énoncé décrit le mieux le rôle que vous jouez dans votre ménage dans chacun des domaines suivants?
[PN: RANDOMIZE ITEMS.]
- J'en ai la responsabilité principale
- J'en partage la responsabilité
- Je ne m'en occupe habituellement pas
- Courses à l'épicerie
- Planification des repas et listes d'épicerie
- Préparation des repas familiaux
- Choix du lieu pour les repas pris à l'extérieur (restaurants ou comptoirs de commandes à emporter)
L. DONNÉES DÉMOGRAPHIQUES
34. Quel est le niveau de scolarité le plus élevé que vous avez atteint?
- École primaire
- Études secondaires partielles
- Diplôme d'études secondaires ou l'équivalent
- Certificat ou diplôme d'apprenti inscrit ou d'une école de métiers
- Certificat ou diplôme d'un collège, cégep ou autre établissement non universitaire
- Certificat ou diplôme universitaire inférieur au baccalauréat
- Baccalauréat
- Diplôme d'études supérieur au baccalauréat
- Je préfère ne pas répondre
35. Laquelle des catégories suivantes décrit le mieux le revenu total de votre ménage pour 2018 ? (c.-à-d. le revenu cumulatif de tous les membres de votre ménage, avant impôt)
- Moins de 20 000 $
- 20 000 $ à moins de 40 000 $
- 40 000 $ à moins de 60 000 $
- 60 000 $ à moins de 80 000 $
- 80 000 $ à moins de 100 000 $
- 100 000 $ à moins de 150 000 $
- 150 000 $ ou plus
- Je préfère ne pas répondre
36. Laquelle des situations suivantes décrit votre situation d'emploi actuelle?
- Emploi à temps plein (35 heures ou plus par semaine)
- Emploi à temps partiel (moins de 35 heures par semaine)
- Travail autonome
- Sans emploi, mais à la recherche d'un emploi
- Aux études à temps plein
- À la retraite
- Pas sur le marché du travail (personne au foyer à temps plein, sans emploi et ne cherchant pas d'emploi)
- Autre
- Je préfère ne pas répondre
37. Quel est votre état
- Vous êtes célibataire, n'avez jamais été marié(e)
- Vous êtes marié(e) ou vivez en union de fait
- Vous êtes veuf, veuve
- Vous êtes divorcé(e) ou séparé(e)
- Je préfère ne pas répondre
38. Êtes-vous né(e) au Canada ?
- Oui [PN: SKIP TO Q.40]
- Non
- Je préfère ne pas répondre
39. Depuis combien d'années habitez-vous au Canada?
- Depuis moins de 5 ans
- Depuis 5 à 9 ans
- Depuis 10 à 19 ans
- Depuis 20 à 29 ans
- Depuis 30 ans ou plus
- Je préfère ne pas répondre
40. En ce qui concerne votre patrimoine ethnique et culturel, vous définissez-vous comme…? Cochez toutes les réponses pertinentes.
- Européen, Européenne de l'Ouest (R.-U., Espagne, Portugal, France, Allemagne, Autriche, Suisse, etc.)
- Européen, Européenne de l'Est (Pologne, Hongrie, Roumanie, Ukraine, Russie, etc.)
- Africain, Africaine
- D'origine moyen-orientale (Israël, Syrie, Jordanie, Égypte, Iran, Irak, etc.)
- Asiatique du Sud (Inde, Afghanistan, Pakistan, Sri Lanka, etc.)
- Asiatique du Sud-Est (Thaïlande, Vietnam, Singapour, Philippines, Indonésie, Cambodge, etc.)
- Asiatique de l'Est (Chine, Corée, Japon, Taiwan, etc.)
- Sud-Américain, Sud-Américaine; Centraméricain, Centraméricaine; Latino-Américain, Latino-Américaine
- Antillais, Antillaise (Caraïbes)
- Autre; veuillez préciser : _________________________
- Je préfère ne pas répondre
41. Comment décririez-vous l'endroit où vous habitez ? Est-ce…
- Une région éloignée
- Une région rurale
- Une ville
- Une banlieue
- Je ne sais pas/Je préfère ne pas répondre
42. Quelle est la taille de la collectivité dans laquelle vous habitez actuellement ?
- Un million d'habitants ou plus
- 500 000 à 999 999 habitants
- 100 000 à 499 999 habitants
- 50 000 à 99 999 habitants
- 10 000 à 49 999 habitants
- 5 000 à 9 999 habitants
- Moins de 5 000 habitants
- Je ne sais pas/Je préfère ne pas répondre
43. Langue du sondage (codée)
- Anglais
- Français
ÉVALUATION DE L'ESSAI PRÉLIMINAIRE DU SONDAGE
44. Nous aimerions savoir ce que vous avez pensé de votre expérience en répondant à ce sondage. Veuillez indiquer si vous êtes d'accord ou non avec chacun des énoncés suivants.
RANDOMIZE STATEMENTS
- Tout à fait d'accord
- Plutôt d'accord
- Plutôt en désaccord
- Tout à fait en désaccord
- Ce sondage était facile à remplir.
- Les questions posées étaient claires et faciles à comprendre.
- La longueur du sondage était raisonnable.
- Le sujet était intéressant.
45. Avez-vous d'autres commentaires sur ce sondage ou sur votre expérience à titre de répondant(e) à ce sondage? [PN: OPEN-END]
- Pas d'autres commentaires
Appendix B – Recruiting Scripts (English and French)
Health Canada
Food and Beverage Marketing
FINAL Recruiting Script (April 5, 2019)
Recruitment Specifications Summary
- Total of 8 groups – 4 groups with parents and 4 groups with children.
- We will recruit children through the parents attending. The parents agree to have themselves and their child participate in the focus group separately.
- Each parent group is expected to last 90 minutes. Each child group is expected to last 60 minutes. Arrangements will be made to supervise the children until the conclusion of the focus groups with their parents.
- Recruit 8 participants for 6-8 to show.
- Incentive will be $100 for parents and $40 for children.
- Ensure good mix of parents by gender, family size, marital status, age, education, employment status, household income and ethnicity. Also see other recruiting specifications and ensure mix by role in household, screen time of child, etc.
Specifications for the focus groups are as follows:
| LOCATION | DATE* | LANGUAGE | TIME | GROUP # | GROUP COMPOSITION |
|---|---|---|---|---|---|
| Toronto | Saturday, April 27th, 2019 Consumer Vision Midtown Toronto 1867 Yonge Street – Suite #200, Toronto ON M4S 1Y5 |
English | 11:00-12:30 | 1 | Parents of children aged 6-8 (Grades 1-3) |
| 11:00-12:00 | 2 | Children aged 6-8 (Grades 1-3) | |||
| 2:00-3:30 | 3 | Parents of children aged 9-12 (Grades 4-6) | |||
| 2:00-3:00 | 4 | Children aged 9-12 (Grades 4-6) | |||
| Montreal | Saturday, April 27th, 2019 CRC Montreal 1610 Rue Ste-Catherine Ouest – Bureau #411, Montréal QC H3H 2S2 |
French | 11:00-12:30 | 5 | Parents of children aged 6-8 (Grade 1-3) |
| 11:00-12:00 | 6 | Children aged 6-8 (Grades 1-3) | |||
| 2:00-3:30 | 7 | Parents of children aged 9-12 (Grades 4-6) | |||
| 2:00-3:00 | 8 | Children aged 9-12 (Grades 4-6) |
*Note that we have placed first tentative holds in each of these locations and will confirm once we have client approval to proceed.
Recruiting Script
INTRODUCTION
Hello, my name is [INSERT RECRUITER NAME]. I'm calling from The Strategic Counsel, on behalf of the Government of Canada. We are a national public opinion research firm organizing a series of focus group discussions to explore impressions of food and beverage advertising and marketing, and specifically marketing to children.
Your participation is completely voluntary and all your answers will be kept confidential. We are only interested in hearing your opinions - no attempt will be made to sell or market you anything. The report that is produced from the series of discussion groups we are holding will not contain comments that are attributed to specific individuals.
The format is a "round table" discussion, led by an experienced moderator. Participants will be given a cash honorarium in appreciation of your time.
But before we invite you to attend, we need to ask you a few questions to ensure that we get a good mix/variety of people in each of the groups. May I ask you a few questions?
- Yes CONTINUE
- No THANK AND TERMINATE
SCREENING QUESTIONS
1. Have you, or has anyone in your household, worked for any of the following types of organizations in the last 5 years?
- A market research firm THANK AND TERMINATE
- A marketing, branding or advertising agency THANK AND TERMINATE
- A magazine or newspaper THANK AND TERMINATE
- A federal, territorial, or provincial government THANK AND TERMINATE
- In public/media relations THANK AND TERMINATE
- In radio/television THANK AND TERMINATE
- In the food and beverage industry THANK AND TERMINATE
- No, none of the above CONTINUE
2. Would you be willing to tell me in which of the following age categories you belong?
Under 18 years of age IF POSSIBLE, ASK FOR SOMEONE OVER 18 AND REINTRODUCE. OTHERWISE THANK AND TERMINATE
- 18-24 years of age
- 25-34 years of age
- 35-54 years of age
- 55-64 years of age
- 65 years of age and older
- VOLUNTEERED Prefer not to answer THANK AND TERMINATE
ENSURE A GOOD CROSS SECTION OF PARTICIPANTS AGED: 18-34, 35-54, 55 AND OLDER. PARENTS OF CHILDREN IN THE TARGET AGE GROUP WILL TEND TO SKEW YOUNGER.
3. Have you ever attended a focus group discussion, an interview or survey which was arranged in advance and for which you received a sum of money?
- Yes CONTINUE
- No SKIP TO Q7
4. How long ago was the last focus group you attended?
- Less than 6 months ago THANK AND TERMINATE
- More than 6 months ago CONTINUE
5. How many focus group discussions have you attended in the past 5 years?
- 0-4 groups CONTINUE
- 5 or more groups THANK AND TERMINATE
6. And on what topics were they?
TERMINATE IF ANY ON ADVERTISING, MARKETING OR FOOD/BEVERAGE RELATED.
7. Do you have any children living with you who are currently in grades 1-6?
- Yes CONTINUE
- No THANK AND TERMINATE
- VOLUNTEERED Prefer not to answer THANK AND TERMINATE
8. Could you please tell me which grade level this child is/these children are in?
- Child
- Grade Level
- 1
- 2
- 3
- 4
- VOLUNTEERED Prefer not to answer CONTINUE
ASSIGN TO GROUP AS PER BELOW. IF MULTIPLE CHILDREN, ASSIGN BY LEAST FILL.
IF TORONTO AND GRADES 1, 2 OR 3 AT Q2 = PARENT IN GROUP 1 AND CHILD IN GROUP 2.
IF TORONTO AND GRADES 4, 5, OR 6 AT Q2 = PARENT IN GROUP 3 AND CHILD IN GROUP 4.
IF MONTREAL AND GRADES 1, 2 OR 3 AT Q2 = PARENT IN GROUP 5 AND CHILD IN GROUP 6.
IF MONTREAL AND GRADES 4, 5, OR 6 AT Q2 = PARENT IN GROUP 7 AND CHILD IN GROUP 8.
9. Could you tell me the ages of this child/these children?
- Child
- Age
- 1
- 2
- 3
- 4
- VOLUNTEERED Prefer not to answer THANK AND TERMINATE
IF PREFER NOT TO ANSWER AT Q3, ASSIGN TO GROUP BY AGE AS FOLLOWS:
IF TORONTO AND AGED 6, 7 OR 8 AT Q3 = PARENT IN GROUP 1 AND CHILD IN GROUP 2.
IF TORONTO AND AGED 9, 10, 11, 12 AT Q3 = PARENT IN GROUP 3 AND CHILD IN GROUP 4.
IF MONTREAL AND AGED 6, 7 OR 8 AT Q3 = PARENT IN GROUP 5 AND CHILD IN GROUP 6.
IF MONTREAL AND AGED 9, 10, 11, 12 AT Q3 = PARENT IN GROUP 7 AND CHILD IN GROUP 8.
10. We are looking to hold separate focus groups with a parent and one of their children, who is in grade 1-6. Focus groups will be conducted at the same location with different moderators. Would you and your child [in grade 1-6 /aged 6-12] be interested in participating? NOTE TO RECRUITER: EXPLAIN CONCEPT OF A FOCUS GROUP IF PARTICIPANT SEEMS UNFAMILIAR.
- Yes CONTINUE
- No THANK AND TERMINATE
11. How comfortable would your child/one of your children be participating in a 60-minute group with up to 8 other children? The group would involve some activities such as drawing, but also speaking up and interacting with other children and the moderator. The group would include boys and girls within the same age range as your child. Would he or she be …
- Very comfortable CONTINUE
- Somewhat comfortable CONTINUE
- Not very comfortable THANK AND TERMINATE
- Not comfortable at all THANK AND TERMINATE
12. What is the gender of the child who would be participating in the focus group?
- Female CONTINUE
- Male CONTINUE
AIM FOR 50/50 GENDER SPLIT IN EACH CHILD GROUP.
13. Outside school hours, approximately how many hours per day does this child spend in front of a screen, whether it is TV, on a computer, laptop, tablet, phone, outside of the time they are in school?
- 0
- 1-3
- 3-5
- 5 or more
ENSURE A GOOD MIX IN EACH CHILD GROUP. LIMIT THOSE WHO RESPOND '0' TO MAXIMUM 1 PER GROUP (PARENTS AND CHILDREN'S GROUPS).
14. Do you have any other children, outside the ages of 6 through 12?
- Yes CONTINUE
- No CONTINUE
ENSURE A GOOD MIX.
15. Now, we have a few questions for you, as the parent or guardian. When it comes to grocery shopping or making decisions about the kinds of food items purchased in your household, which of the following statements best describes your role?
- I am the person in my household who usually shops for groceries or makes decisions about the kinds of food items we purchase.
- I share responsibility for grocery shopping and making decisions about the kinds of food items we purchase about equally with other people in my household.
- Someone else in my household usually shops for groceries or makes most of the decisions about the kinds of food items we purchase.
ENSURE A GOOD MIX. LIMIT NUMBER WHO SAY 'SOMEONE ELSE' TO MAXIMUM 2 PER GROUP.
16. To what extent does your child/do your children, aged 6 to 12 years, ask for specific types or brands of food or beverages that they have seen or heard about?
- A lot
- Sometimes
- Hardly ever
- Never
ENSURE A GOOD MIX. LIMIT NUMBER OF THOSE WHO SAY 'HARDLY EVER/NEVER' TO MAXIMUM 1 PER GROUP.
17. And, to what extent do you involve your child/children preferences when you are making decisions on where or what to eat and drink, whether at home, take-out or at restaurants?
- Always
- Very often
- Sometimes
- Rarely
- Never
ENSURE A GOOD MIX. LIMIT NUMBER WHO SAY 'RARELY/NEVER' TO MAXIMUM 1 PER GROUP.
18. In an average month, approximately how often do you purchase take-out food and/or go to a restaurant?
- Less than once a month
- 2-4 times per month
- 5-8 times per month
- More than 8 times per month
ENSURE A GOOD MIX.
19. Parent Gender: DO NOT ASK. RECORD BY OBSERVATION.
- Female CONTINUE
- Male CONTINUE
AIM FOR 50/50 GENDER SPLIT IN EACH PARENT GROUP.
ADDITIONAL RECRUITING CRITERIA
20. Now we have just a few final questions before we give you the details of the focus group, including the time, date, and location. What is your marital status?
- Single/Widowed/Divorced/Separated
- Married/Common-Law
ENSURE A GOOD MIX.
21. Which of the following categories best describes your current employment status? Are you…
- Working full-time, that is, 35 or more hours per week
- Working part-time, that is, less than 35 hours per week
- Self-employed
- Unemployed, but looking for work
- A student attending school full-time
- Retired
- Full-time home maker
- Not in the workforce
- Other (specify)
- VOLUNTEERED Prefer not to answer
ENSURE A GOOD MIX OF WORKING AND STAY AT HOME PARENTS IN EACH GROUP.
22. What is the highest level of formal education that you have completed?
- Grade 8 or less
- Some high school
- High school diploma or equivalent
- Registered Apprenticeship or other trades certificate or diploma
- College, CEGEP or other non-university certificate or diploma
- University certificate or diploma below bachelor's level
- Bachelor's degree
- Post graduate degree above bachelor's level
- VOLUNTEERED Prefer not to answer
ENSURE A GOOD MIX.
23. Which of the following categories best describes your total household income? That is, the total income of all persons in your household combined, before taxes?
- Under $20,000
- $20,000 to just under $40,000
- $40,000 to just under $60,000
- $60,000 to just under $80,000
- $80,000 to just under $100,000
- $100,000 to just under $150,000
- $150,000 and above
- VOLUNTEERED Prefer not to answer
ENSURE A GOOD MIX.
24. Can you please tell me how would you describe your ethnicity?
- African
- Arab
- Canadian
- Caribbean
- Chinese
- European
- Other East/Southeast Asian (e.g. Filipino, Korean, Japanese)
- French
- Indigenous
- Latin/Central/South American
- South Asian/East Indian (i.e., Pakistani, Punjabi, East Indian, Tamil)
- Other (specify)
- VOLUNTEERED Prefer not to answer
ENSURE A GOOD MIX BY ETHNICITY.
25. If you won a million dollars what would be the first two things you would do with the money? (MUST HAVE TWO RESPONSES TO ACCEPT. TERMINATE IF PARTICIPANT RESPONDS IN A FLIPPANT MANNER, REFUSES TO ANSWER OR EXHIBITS DIFFICULTY IN RESPONDING.)
26. During the discussion, you could be asked to look at materials that are pinned up on a wall and to read handouts or other materials in print. You will also be asked to actively participate in a conversation about these materials. Can you think of any reason why you may have difficulty reading the materials or participating in the discussion? You may also be asked to write down a few thoughts on paper. Are you comfortable writing in (English/French)?
TERMINATE IF RESPONDENT OFFERS ANY REASON SUCH AS SIGHT OR HEARING PROBLEM, A WRITTEN OR VERBAL LANGUAGE PROBLEM, A CONCERN WITH NOT BEING ABLE TO COMMUNICATE EFFECTIVELY OR IF YOU AS THE INTERVIEWER HAVE A CONCERN ABOUT THE PARTICIPANT'S ABILITY TO PARTICIPATE EFFECTIVELY.
27. The focus group discussion will be audio-taped and video-taped for research purposes only. Do you consent to being audio-taped and video-taped?
- Yes
- No THANK AND TERMINATE
28. The report that will be prepared based on the discussions may contain anonymous quotations from participants. These quotations will not identify you, but may include comments that you made during the discussion. Do you consent to being quoted anonymously in the report that will be prepared following the groups?
- Yes
- No THANK AND TERMINATE
INVITATION
I would like to invite you to this focus group discussion. As I mentioned earlier, the group discussion will take place the evening of [INSERT DATE/TIME BASED ON GROUP # IN CHART ON PAGE 1]. The group with parents will be 90 minutes and the group with children will be 60 minutes. Arrangements will be made to supervise the children on-site with activities until the conclusion of your discussion group.
The consent of a responsible adult (i.e. parent or guardian) will be required for the child to participate. Parents must sign a standard consent for at the focus group facility prior to the in-person session.
Parents will receive $100 and children will received $40 for their participation.
Would you and your child be willing to attend?
- Yes CONTINUE
- No THANK AND END
The group will be held at:
[INSERT LOCATION]
We will be calling you back to verify the information given and will confirm this appointment the day before. May I please have your full name, a telephone number that is best to reach you at as well as your e-mail address if you have one so that I can send you the details for the group?
- Name:
- Telephone Number:
- E-mail Address:
This is a firm commitment. If you anticipate anything preventing you from attending (either home or work-related), please let me know now and we will keep your name for a future study.
We ask that you arrive 10-15 minutes prior to the beginning of the session and identify yourself to our staff who will gladly welcome you. Please bring photo identification with you, so that we make sure only people who have been invited participate in the group.
You may be required to view some material during the course of the discussion. If you or your child requires glasses to do so, please be sure to have them handy at the time of the group. If for any reason you are unable to attend, please let us know as soon as possible at [1-800-xxx-xxxx] so we can find a replacement.
Thank you very much for your time.
RECRUITED BY: ____________________
DATE RECRUITED: __________________
Santé Canada
Publicité d'aliments et de boissons
Script de recrutement, version finale (5 avril 2019)
Détails du recrutement
- Il y aura huit groupes de discussion en tout : quatre groupes de parents et quatre groupes d'enfants.
- Nous recrutons les enfants par l'intermédiaire des parents participants. Les parents donnent leur accord pour que leur enfant participe à un groupe distinct du leur.
- La durée prévue de la rencontre est de 90 minutes pour chaque groupe de parents et de 60 minutes pour chaque groupe d'enfants. Des dispositions seront prises pour s'occuper des enfants jusqu'à ce que le groupe de discussion des parents prenne fin.
- Nous recrutons huit participants afin de pouvoir compter sur la présence de six à huit personnes.
- L'incitatif est de 100 $ pour les parents et de 40 $ pour les enfants.
- La composition des groupes de parents doit être diversifiée sur le plan du sexe, de la taille du ménage, de l'état matrimonial, de l'âge, de l'éducation, de la situation d'emploi, des revenus et de l'ethnicité. Voir également les autres critères de recrutement et tenir compte des rôles au sein du ménage, du temps que les enfants passent devant un écran, etc.
Informations détaillées sur les groupes de discussion :
| LIEU | DATE* | LANGUE | HEURE | NO DU GROUPE | COMPOSITION DU GROUPE |
|---|---|---|---|---|---|
| Toronto | Samedi 27 avril 2019 Consumer Vision Midtown Toronto 1867 Yonge Street – Suite #200, Toronto ON M4S 1Y5 |
Anglais | 11 h - 12 h 30 | 1 | Parents d'enfants âgés de 6 à 8 ans (1re à 3e année) |
| 11 h - 12 h | 2 | Enfants âgés de 6 à 8 ans (1re à 3e année) |
|||
| 14 h - 15 h 30 | 3 | Parents d'enfants âgés de 9 à 12 ans (4e à 6e année) | |||
| 14 h - 15 h | 4 | Enfants âgés de 9 à 12 ans (4e à 6e année) |
|||
| Montréal | Samedi 27 avril 2019 CRC Montreal 1610 Rue Ste-Catherine Ouest – Bureau #411, Montréal QC H3H 2S2 |
Français | 11 h - 12 h 30 | 5 | Parents d'enfants âgés de 6 à 8 ans (1re à 3e année) |
| 11 h - 12 h | 6 | Enfants âgés de 6 à 8 ans (1re à 3e année) |
|||
| 14 h - 15 h 30 | 7 | Parents d'enfants âgés de 9 à 12 ans (4e à 6e année) | |||
| 14 h - 15 h | 8 | Enfants âgés de 9 à 12 ans (4e à 6e année) |
*N.B. Nous avons provisoirement réservé des locaux dans ces deux bureaux et confirmerons les réservations après avoir reçu l'approbation du client.
Script de recrutement
INTRODUCTION
Bonjour, je m'appelle [NOM DU RECRUTEUR]. Je vous téléphone du Strategic Counsel pour le compte du gouvernement du Canada. Nous sommes une société canadienne de recherche sur l'opinion publique et nous organisons une série de groupes de discussion sur le thème de la publicité d'aliments et de boissons, en particulier la publicité destinée aux enfants.
Votre participation est entièrement volontaire et toutes vos réponses seront confidentielles. Nous souhaitons uniquement connaître vos opinions : personne n'essaiera de vous vendre quelque chose ou de promouvoir des produits. Notre rapport sur cette série de groupes de discussion n'attribuera aucun commentaire à des participants individuels.
La rencontre prendra la forme d'une discussion en table ronde animée par un modérateur expérimenté. En remerciement de leur temps, les participants recevront une rétribution financière.
Avant de vous inviter à participer, je dois vous poser quelques questions qui nous permettront de former des groupes suffisamment diversifiés. Puis-je vous poser quelques questions?
- Oui CONTINUER
- Non REMERCIER ET CONCLURE
QUESTIONS DE SÉLECTION
1. Est-ce que vous ou une personne de votre ménage avez travaillé pour l'un des types d'organisations suivants au cours des cinq dernières années?
- Une société d'études de marché REMERCIER ET CONCLURE
- Une agence de commercialisation, de marque ou de publicité REMERCIER ET CONCLURE
- Un magazine ou un journal REMERCIER ET CONCLURE
- Un gouvernement fédéral, territorial ou provincial REMERCIER ET CONCLURE
- Dans les relations publiques ou les relations avec les médias REMERCIER ET CONCLURE
- Dans le milieu de la radio ou de la télévision REMERCIER ET CONCLURE
- Dans le secteur des aliments et des boissons REMERCIER ET CONCLURE
- Non, aucune de ces réponses CONTINUER
2. Seriez-vous prêt / prête à m'indiquer votre tranche d'âge dans la liste suivante?
- Moins de 18 ans SI POSSIBLE, DEMANDER À PARLER À UNE PERSONNE DE 18 ANS OU PLUS ET REFAIRE L'INTRODUCTION. AUTREMENT, REMERCIER ET CONCLURE.
- 18 à 24 ans
- 25 à 34 ans
- 35 à 54 ans
- 55 à 64 ans
- 65 ans ou plus
- RÉPONSE SPONTANÉE Je préfère ne pas répondre REMERCIER ET CONCLURE
ASSURER UNE BONNE REPRÉSENTATION DES TRANCHES D'ÂGE : 18 À 34 ANS, 35 À 54 ANS, 55 ANS ET PLUS. LES PARENTS DES ENFANTS DU GROUPE D'ÂGE CIBLE AURONT TENDANCE À ÊTRE PLUS JEUNES.
3. Avez-vous déjà participé à un groupe de discussion, à une entrevue ou à un sondage organisé à l'avance en contrepartie d'une somme d'argent?
- Oui CONTINUER
- Non PASSER À LA Q7
4. À quand remonte le dernier groupe de discussion auquel vous avez participé?
- À moins de six mois REMERCIER ET CONCLURE
- À plus de six mois CONTINUER
5. À combien de groupes de discussion avez-vous participé au cours des cinq dernières années?
- 0 à 4 groupes CONTINUER
- 5 groupes ou plus REMERCIER ET CONCLURE
6. Sur quels sujets portaient-ils?
CONCLURE SI LES SUJETS TOUCHAIENT À LA PUBLICITÉ, AU MARKETING OU AUX ALIMENTS ET AUX BOISSONS.
7. Avez-vous des enfants chez vous qui sont actuellement inscrits de la 1re à la 6e année du primaire?
- Oui CONTINUER
- Non REMERCIER ET CONCLURE
- DÉCLARATION SPONTANÉE Je préfère ne pas répondre REMERCIER ET CONCLURE
8. Pourriez-vous m'indiquer le niveau scolaire de cet enfant / de ces enfants?
- Enfant
- Niveau scolaire
- 1
- 2
- 3
- 4
- RÉPONSE SPONTANÉE Je préfère ne pas répondre REMERCIER ET CONCLURE
AFFECTER À UN GROUPE EN SUIVANT LES INDICATIONS CI-DESSOUS. SI PLUSIEURS ENFANTS, AFFECTER EN FONCTION DES GROUPES LES MOINS REMPLIS.
SI TORONTO ET 1RE, 2E OU 3E ANNÉE À LA Q2 = PARENT DANS LE GROUPE 1, ENFANT DANS LE GROUPE 2.
SI TORONTO ET 4E, 5E OU 6E ANNÉE À LA Q2 = PARENT DANS LE GROUPE 3, ENFANT DANS LE GROUPE 4.
SI MONTRÉAL ET 1RE, 2E OU 3E ANNÉE À LA Q2 = PARENT DANS LE GROUPE 5, ENFANT DANS LE GROUPE 6.
SI MONTRÉAL ET 4E, 5E OU 6E ANNÉE À LA Q2 = PARENT DANS LE GROUPE 7, ENFANT DANS LE GROUPE 8.
9. Pourriez-vous me dire l'âge de cet enfant / de ces enfants?
- Enfant
- Âge
- 1
- 2
- 3
- 4
- RÉPONSE SPONTANÉE Je préfère ne pas répondre REMERCIER ET CONCLURE
SI PRÉFÈRE NE PAS RÉPONDRE À LA Q3, AFFECTER AU GROUPE EN FONCTION DE L'ÂGE :
SI TORONTO ET ÂGÉ DE 6, 7 OU 8 ANS À LA Q3 = PARENT DANS LE GROUPE 1, ENFANT DANS LE GROUPE 2.
SI TORONTO ET ÂGÉ DE 9, 10, 11, 12 ANS À LA Q3 = PARENT DANS LE GROUPE 3, ENFANT DANS LE GROUPE 4.
SI MONTRÉAL ET ÂGÉ DE 6, 7 OU 8 ANS À LA Q3 = PARENT DANS LE GROUPE 5, ENFANT DANS LE GROUPE 6.
SI MONTRÉAL ET ÂGÉ DE 9, 10, 11, 12 ANS À LA Q3 = PARENT DANS LE GROUPE 7, ENFANT DANS LE GROUPE 8.
10. Nous allons organiser des groupes de discussion distincts pour les parents et leurs enfants inscrits de la 1re à la 6e année. Les groupes de discussion auront lieu au même endroit, avec des modérateurs différents. Est-ce que vous et votre enfant [de la 1re à la 6e année / âgé de 6 à 12 ans] souhaiteriez y participer? NOTE AU RECRUTEUR : EXPLIQUER LE CONCEPT DU GROUPE DE DISCUSSION S'IL NE SEMPLE PAS FAMILIER AU RÉPONDANT.
- Oui CONTINUER
- Non REMERCIER ET CONCLURE
11. À quel point votre enfant / l'un de vos enfants serait-il à l'aise de participer à un groupe de discussion d'une durée 60 minutes avec jusqu'à huit autres enfants? La rencontre comprendrait des activités comme le dessin, mais aussi des prises de parole et des interactions avec les autres enfants et le modérateur. Le groupe sera composé de garçons et de filles dans la même tranche d'âge que votre enfant. Votre enfant serait-il ou serait-elle…
- Très à l'aise CONTINUER
- Assez à l'aise CONTINUER
- Pas très à l'aise REMERCIER ET CONCLURE
- Pas du tout à l'aise REMERCIER ET CONCLURE
12. Quel est le sexe de l'enfant qui participerait au groupe de discussion?
- Féminin CONTINUER
- Masculin CONTINUER
ESSAYER D'OBTENIR UNE PROPORTION ÉGALE DE GARÇONS ET DE FILLES DANS CHAQUE GROUPE D'ENFANTS.
13. En dehors du temps passé à l'école, combien d'heures par jour environ cet enfant passe-t-il / passe-t-elle devant un écran, que ce soit une télévision, un ordinateur de bureau, un ordinateur portable, une tablette ou un téléphone?
- 0
- 1 à 3 heures
- 3 à 5 heures
- 5 heures ou plus
ASSURER UN BON MÉLANGE DANS CHAQUE GROUPE D'ENFANTS. LIMITER LE NOMBRE DE PERSONNES QUI RÉPONDENT « 0 » À UNE PAR GROUPE (GROUPES DES PARENTS ET DES ENFANTS).
14. Avez-vous d'autres enfants en dehors de la tranche d'âge de 6 à 12 ans?
- Oui CONTINUER
- Non CONTINUER
ASSURER UN BON MÉLANGE.
15. Maintenant, nous avons quelques questions à vous poser à titre de parent ou de tuteur / tutrice. Lorsqu'il s'agit de faire l'épicerie ou de prendre les décisions concernant les types de produits alimentaires à acheter pour votre ménage, lequel des énoncés suivants décrit le mieux votre rôle?
- Dans mon ménage, je suis habituellement la personne qui fait l'épicerie ou qui prend les décisions concernant les types de produits alimentaires à acheter.
- Je partage à peu près également avec d'autres personnes de mon ménage la responsabilité de faire l'épicerie et de prendre les décisions concernant les types de produits alimentaires à acheter.
- Une autre personne de mon ménage s'occupe habituellement de faire l'épicerie et de prendre la plupart des décisions concernant les types de produits alimentaires à acheter.
ASSURER UN BON MÉLANGE. LIMITER LE NOMBRE DE PERSONNES QUI RÉPONDENT « UNE AUTRE PERSONNE » À DEUX PAR GROUPE.
16. Dans quelle mesure votre enfant / vos enfants âgés de 6 à 12 ans réclament-ils des marques ou des types d'aliments ou de boissons précis qu'ils ont vus ou dont ils ont entendu parler?
- Souvent
- Parfois
- Presque jamais
- Jamais
ASSURER UN BON MÉLANGE. LIMITER LE NOMBRE DE PERSONNES QUI RÉPONDENT « PRESQUE JAMAIS OU JAMAIS » À UNE PAR GROUPE.
17. Et dans quelle mesure tenez-vous compte des préférences de votre enfant / de vos enfants lorsque vous décidez où manger et quels aliments et boissons consommer, que ce soit à la maison, à un comptoir de commandes à emporter ou au restaurant?
- Toujours
- Très souvent
- Parfois
- Rarement
- Jamais
ASSURER UN BON MÉLANGE. LIMITER LE NOMBRE DE PERSONNES QUI DISENT « JAMAIS OU RAREMENT » À UNE PAR GROUPE.
18. En moyenne, combien de fois par mois achetez-vous des mets à emporter ou allez-vous au restaurant?
- Moins d'une fois par mois
- 2 à 4 fois par mois
- 5 à 8 fois par mois
- Plus de 8 fois par mois
ASSURER UN BON MÉLANGE.
19. Sexe du parent : NE PAS DEMANDER. NOTER SELON VOTRE OBSERVATION.
- Femme CONTINUER
- Homme CONTINUER
ESSAYER D'OBTENIR UNE PROPORTION ÉGALE D'HOMMES ET DE FEMMES DANS CHAQUE GROUPE DE PARENTS.
CRITÈRES DE RECRUTEMENT SUPPLÉMENTAIRES :
20. Il nous reste quelques dernières questions avant de discuter des détails du groupe de discussion, comme l'heure, la date et le lieu. Quel est votre état matrimonial?
- Célibataire / Veuf, veuve / Divorcé(e) / Séparé(e)
- Marié(e) / Conjoint(e) de fait
ASSURER UN BON MÉLANGE.
21. Laquelle des situations suivantes décrit le mieux votre situation d'emploi actuelle?
- Emploi à temps plein (35 heures ou plus par semaine)
- Emploi à temps partiel (35 heures ou moins par semaine)
- Travail autonome
- Sans emploi, mais à la recherche d'un emploi
- Aux études à temps plein
- À la retraite
- Personne au foyer à temps plein
- Pas sur le marché du travail
- Autre situation (préciser)
- DÉCLARATION SPONTANÉE Je préfère ne pas répondre
ASSURER UN BON ÉQUILIBRE DANS CHAQUE GROUPE ENTRE LES PARENTS QUI TRAVAILLENT ET LES PARENTS AU FOYER.
22. Quel est le niveau de scolarité le plus élevé que vous avez atteint?
- École primaire
- Études secondaires partielles
- Diplôme d'études secondaires ou l'équivalent
- Certificat ou diplôme d'apprenti inscrit ou d'une école de métiers
- Certificat ou diplôme d'un collège, cégep ou autre établissement non universitaire
- Certificat ou diplôme universitaire inférieur au baccalauréat
- Baccalauréat
- Diplôme d'études supérieur au baccalauréat
- DÉCLARATION SPONTANÉE Je préfère ne pas répondre
ASSURER UN BON MÉLANGE.
23. Laquelle des catégories suivantes décrit le mieux le revenu annuel total de votre ménage? (c.-à-d. le revenu cumulatif de tous les membres de votre ménage, avant impôt)
- Moins de 20 000 $
- 20 000 $ à moins de 40 000 $
- 40 000 $ à moins de 60 000 $
- 60 000 $ à moins de 80 000 $
- 80 000 $ à moins de 100 000 $
- 100 000 $ à moins de 150 000 $
- 150 000 $ ou plus
- DÉCLARATION SPONTANÉE Je préfère ne pas répondre
ASSURER UN BON MÉLANGE.
24. Pouvez-vous me dire comment vous décririez votre appartenance ethnique?
- Africaine
- Arabe
- Canadienne
- Caraïbéenne
- Chinoise
- Européenne
- Est-asiatique ou sud-est asiatique (p. ex. : philippine, coréenne, japonaise)
- Française
- Autochtone
- Latino-américaine, centraméricaine ou sud-américaine
- Sud-asiatique ou indienne d'Asie (p. ex. : pakistanaise, punjabi, indienne d'Asie, tamoule)
- Autre appartenance (préciser)
- DÉCLARATION SPONTANÉE Je préfère ne pas répondre
ASSURER UN BON MÉLANGE SUR LE PLAN ETHNIQUE.
25. Si vous remportiez un million de dollars, quelles sont les deux premières choses que vous feriez avec cet argent? (DOIT DONNER DEUX RÉPONSES POUR ÊTRE ACCEPTÉ. CONCLURE L'ENTRETIEN SI LE RÉPONDANT DÉMONTRE PEU DE SÉRIEUX, REFUSE DE RÉPONDRE OU A DE LA DIFFICULTÉ À RÉPONDRE.)
26. Au cours de la discussion, vous pourriez devoir examiner du matériel affiché au mur et lire de la documentation imprimée. On vous demandera également de participer activement aux discussions portant sur ce matériel. Pensez-vous avoir de la difficulté, pour une raison ou une autre, à lire les documents ou à participer à la discussion? On pourrait aussi vous demander de noter quelques réflexions sur papier. Êtes-vous à l'aise pour écrire (en français/en anglais)?
CONCLURE L'ENTRETIEN SI LE RÉPONDANT SIGNALE UN PROBLÈME DE VISION OU D'AUDITION, UN PROBLÈME DE LANGUE PARLÉE OU ÉCRITE, S'IL CRAINT DE NE POUVOIR COMMUNIQUER EFFICACEMENT, OU SI VOUS, EN TANT QU'INTERVIEWEUR, AVEZ DES DOUTES QUANT À SA CAPACITÉ DE PARTICIPER EFFICACEMENT AUX DISCUSSIONS.
27. La discussion sera enregistrée sur bandes audio et vidéo, strictement aux fins de la recherche. Est-ce que vous consentez à être enregistré(e) sur bandes audio et vidéo?
- Oui
- Non — REMERCIER ET CONCLURE
28. Le rapport qui sera préparé à partir des discussions pourrait contenir des citations anonymes provenant des participants. Ces citations ne vous nommeront pas, mais elles pourraient contenir des commentaires que vous avez faits durant la discussion. Est-ce que vous consentez à être cité(e) de façon anonyme dans le rapport qui sera préparé à la suite des discussions?
- Oui
- Non — REMERCIER ET CONCLURE
INVITATION
J'aimerais vous inviter à ce groupe de discussion. Comme je l'ai mentionné plus tôt, le groupe de discussion aura lieu le soir du [DONNER LA DATE ET L'HEURE EN FONCTION DU NO DU GROUPE INDIQUÉ DANS LE TABLEAU, PAGE 1]. La rencontre des parents durera 90 minutes, et celle des enfants, 60 minutes. Des dispositions ont été prises pour superviser les enfants sur place et leur proposer des activités en attendant que votre groupe de discussion soit terminé.
Le consentement d'un adulte responsable (parent ou tuteur) sera nécessaire pour que l'enfant puisse participer. Les parents doivent signer un formulaire de consentement standard à leur arrivée sur les lieux, avant la rencontre en personne.
Les parents recevront 100 $ pour leur participation, et les enfants, 40 $.
Est-ce que vous et votre enfant souhaitez participer au groupe de discussion?
- Oui CONTINUER
- Non REMERCIER ET CONCLURE
Le groupe de discussion aura lieu à :
[DONNER L'ADRESSE]
Nous vous rappellerons la veille de la rencontre pour confirmer le rendez-vous et les renseignements fournis. Puis-je avoir votre nom complet, le numéro de téléphone où vous êtes le plus facile à joindre et votre adresse électronique, si vous en avez une, pour vous envoyer tous les détails?
- Nom :
- Numéro de téléphone :
- Courriel :
Ce rendez-vous est un engagement ferme. Si vous pensez ne pas pouvoir être présent(e) pour des raisons personnelles ou professionnelles, veuillez m'en aviser dès maintenant et nous conserverons votre nom pour une étude ultérieure.
Nous vous prions d'être sur les lieux au moins dix à quinze minutes avant le début de la rencontre et de vous présenter à notre personnel, qui se fera un plaisir de vous accueillir. Apportez une pièce d'identité avec photo; cela nous permettra de vérifier que seules les personnes invitées participent au groupe.
Vous pourriez devoir examiner des documents durant la rencontre. Si vous ou votre enfant portez des lunettes, assurez-vous de les avoir avec vous le jour de la discussion. Enfin, si jamais vous n'êtes pas en mesure de participer, veuillez nous prévenir le plus rapidement possible au [1-800-xxx-xxxx] pour que nous puissions trouver un remplaçant.
Merci de votre temps.
RECRUTEMENT FAIT PAR : ____________________
DATE DU RECRUTEMENT : __________________
Appendix C – Moderator's Guides (English and French)
MODERATOR'S GUIDE – FOOD AND BEVERAGE MARKETING TO CHILDREN
PARENTS – FINAL (APR. 24, 2019)
Objectives: To elicit parents' views on:
- Those elements of food and beverage packaging and advertising which they feel are attractive to children; and
- Those elements of food and beverage packaging and advertising they think are intended for children.
| LOCATION | LANGUAGE | TIME | GROUP # | GROUP COMPOSITION |
|---|---|---|---|---|
| Toronto Consumer Vision Midtown Toronto 1867 Yonge Street – Suite #200, Toronto ON M4S 1Y5 |
English | 10:00-11:30 | 1 | Parents of children aged 6-8 (Grades 1-3) |
| 1:00-2:30 | 3 | Parents of children aged 9-12 (Grades 4-6) | ||
| Montreal CRC Montreal 1610 Rue Ste-Catherine Ouest – Bureau #411, Montréal QC H3H 2S2 |
French | 10:00-11:30 | 5 | Parents of children aged 6-8 (Grade 1-3) |
| 1:00-2:30 | 7 | Parents of children aged 9-12 (Grades 4-6) |
A. INTRODUCTION (5 MINUTES)
- Welcome participants/introduction of moderator
- Explain sponsor and purpose of groups with parents and with children – groups being undertaken on behalf of the Government of Canada (Health Canada) to explore impressions of food and beverage marketing, and specifically marketing to children.
- Explain room/video-conference set-up and confidentiality provisions:
- Videotaping/recording and two-way mirror
- Confidentiality – no attribution of comments to participants
- Use of first names only, participants' names will not appear in any report
- Explain the format of discussion
- Free flowing discussion - looking for open, honest responses to questions, not necessarily consensus
- Discussion will last the full 90 minutes
- Moderator does not work for Health Canada of for the food and beverage industry
- Brief roundtable introductions – tell us a little bit about yourself. All of you are parents – so I'd also like to know how many children you have and what ages they are.
- Please note that throughout the discussion I will mostly be asking you to respond thinking about your children who are between the ages of (6-8/9-12, depending on group). You may have children in other age groups, but I would like you to respond from the perspective of your children who are specifically in this age bracket.
B. WARM-UP: CONCERNS ABOUT FOOD AND BEVERAGE MARKETING (5 MINUTES)
- How do you feel about marketing by food and beverage companies to children? Is this something you think about much? Probe for:
- Are you at all concerned about how frequently children are being exposed to marketing or what is being marketed to them? i.e., unhealthy products, sugary products, high fat products, etc.
- Do you feel children are more/less vulnerable or susceptible to marketing by food and beverage companies compared to teenagers, young adults, and adults? Probe for:
- In what ways? How are they impacted?
- At what age do you feel children become more attuned to marketing and/or recognize specific brands, and begin making requests for specific brands/products? Probe for differences between younger/older children in the 2-12 age range.
C. GENERAL VIEWS ON FOOD AND BEVERAGE MARKETING TACTICS AIMED AT/INTENDED FOR CHILDREN (10 MINUTES)
- Do you think there are some types or categories of foods which mostly intended for kids? By this I mean food categories or products for which marketing campaigns are created that are more clearly aimed at children. Probe for:
- What types or categories of food and beverage products do you feel tend to market more actively to kids? (i.e., cereals, snack foods, cookies, crackers, desserts, beverages, restaurants/fast-food outlets)
- What are some of the marketing tactics that you feel are most commonly employed by the companies that produce these brands? MODERATOR TO WRITE LIST ON FLIP CHART. Probe for the following and for each attempt to get precise details for each and how effective each is (i.e., which TV shows, where online, types of promotions, etc.):
- Logos
- Displays in-store/placement of items at check-out
- Seasonal displays (i.e., Halloween, XMAS, etc.)
- Product packaging
- Advertising on TV, online, cinemas
- Product placement in TV shows, movies, etc.
- Video games
- Vending machines
- Promotions/sponsorships
- Contests/giveaways
- In schools (if applicable), day care/child care centres
- Word-of-mouth (i.e., seeing what other children have)
- Celebrity endorsements – who is most popular/most influential?
- Sale of collateral items (i.e., characters/branded clothing, toys/games, etc.)
- Others?
- Thinking of each of these tactics, which ones do you feel are the most powerful – that is, are most influential or effective on children in terms of exposing them to specific brands that your children then ask for, repeatedly? MODERATOR TO CIRCLE ON FLIP CHART.
D. ASSESSING FOOD AND BEVERAGE TACTICS INTENDED FOR/APPEAL TO KIDS (45 MINUTES)
1. LOGOS
- (NOTE TO MODERATOR) THE PURPOSE OF THIS SECTION IS TO TEST WHICH OF THE ELEMENTS OF LOGOS, WHEN OTHER CONTEXT SUCH AS PACKAGING/ADVERTISING HAS BEEN REMOVED, ARE CONSIDERED TO BE MORE APPEALING TO CHILDREN THAN TO ADULTS.
- I want to delve into some of these tactics in more detail. Let's look at some product logos. MODERATOR TO PIN LOGOS TO WALL. FOR EACH, ASK: First, would your children recognize any/all of these logos? Are there any that your children would not likely recognize? Which ones? Do you recall what type of product this logo is associated with?
- When you scan across these logos, which logos indicate that the brand is one that A) Is intended for children? And B) Appeals to children? Probe for:
- What about the features or elements in the design of the logo increases their appeal to children? MODERATOR TO PLACE GREEN STICKERS ON THOSE LOGOS THAT PARENTS SAY WOULD APPEAL MORE TO CHILDREN. Discuss. And, by contrast, are there features or element in the design that appeal either equally or more so to adults? MODERATOR TO PLACE YELLOW STICKERS ON THOSE LOGOS THAT PARENTS SAY WOULD APPEAL MORE TO ADULTS. Discuss. Probe for:
- Use of human figure
- Use of cartoon character
- Use of colour
- Association of product with particular type of food (i.e., sweet foods, dairy, fast food, etc.)
- What about the features or elements in the design of the logo increases their appeal to children? MODERATOR TO PLACE GREEN STICKERS ON THOSE LOGOS THAT PARENTS SAY WOULD APPEAL MORE TO CHILDREN. Discuss. And, by contrast, are there features or element in the design that appeal either equally or more so to adults? MODERATOR TO PLACE YELLOW STICKERS ON THOSE LOGOS THAT PARENTS SAY WOULD APPEAL MORE TO ADULTS. Discuss. Probe for:
- Let's look at a few of these more closely. Several of these logos incorporate human figures or faces (Aunt Jemima, Paul Newman, Chef Boyardee, Sun Maid and KFC). Probe for:
- Which of these is more appealing to children/to adults? Why? What is it specifically that children are attracted to?
- Looking at the Chef Boyardee and Paul Newman logos, is one more attractive to children than the other? If so, what about it makes it more child-friendly?
- A number of the logos use cartoon-style characters. Probe for:
- Which of these is more appealing to children/to adults? What about the design do you think is intended to appeal to children?
- Why do you think it is that children come to recognize and recall this particular logo?
- For M&M's in particular, these characters are said to be marketed to adults, but we are wondering if/why children find them appealing/interesting?
- Some of these logos seem to be more obviously directed at getting children's attention, compared to others, but we are wondering about three in particular – Vlasic, Starbucks and Voortman's.
- Let's look at Vlasic first. Would this mascot for a brand of pickles appeal to children? Why or why not?
- Now, let's look at the Starbucks logo. What, if anything, about this logo is appealing to children?
- When you look at Voortman's compared to Starbucks, how do these two logos compare in terms of their appeal to children?
- Reviewing these logos again, and thinking about your children (aged 6-8/9-12) which ones represent a brand that markets products that you feel are not suitable for your children? Depending on responses to previous questions, ask: So, it looks like some of these brands are mainly intended for adults, but might have some appeal to children. Does this concern you at all?
2. PRODUCT PACKAGING – CRACKERS/COOKIES
- (NOTE TO MODERATOR) THE PURPOSE OF THIS SECTION IS TO IDENTIFY WHICH PACKAGES ARE CONSIDERED TO APPEAL TO CHILDREN/MORE LIKELY TO APPEAL TO CHILDREN THAN TO ADULTS, AND WHY.
- Now, I'd like to look at the influence and impact of product packaging, again using a few examples. Before we look at them, do you feel that your children are able to tell from the packaging whether they will like the taste of the food? What is it about the packaging that would make your children feel the product would taste good? Is this something you take into account when purchasing a product (i.e., how it is packaged)?
- Now, I want to show you some examples of packaging for cookies and crackers. MODERATOR TO POST EXAMPLES. First, would your children recognize any/all of these brands? Are there any that your children would not likely recognize? Which ones?
- Looking at the product packaging for each of these, which are being marketed in a way that would likely appeal more to children? MODERATOR TO PLACE GREEN STICKERS ON THOSE PARENTS SAY WOULD APPEAL MORE TO CHILDREN.
- What is it about what is shown on the package that makes you think this will appeal more to children? Probe for: Imagery, design, high impact colours, shapes, product name, the wording used to describe the products, dynamic movement, etc.
- For others that you feel have less child appeal and/or might be more directed to adults, what is it about the product packaging that makes you feel that way?
- Let's have a look at a few examples from the same brand – Oreo Cookies. MODERATOR TO SHOW 5 EXAMPLES OF OREO – MINI (2), BIRTHDAY CAKE, DOUBLE STUF AND THINS. Oreos are a very popular cookie brand. What about it makes it so popular with children? And, when we compare these different package designs, what elements stand out for you as being particularly appealing to/intended to get the attention of children? Probe for:
- Some of the packages could appeal equally to children/adults? Which ones are these? What elements draw children's/adult's attention?
- Finally, looking at all of these examples of packaging for various cooked and crackers, which would you say are not suitable for your children (i.e., is not a product that should be marketed to children)? Depending on responses to previous questions, ask: So, it looks like some might appeal to children even though you feel they are not suitable for children to consume? Does this concern you at all? Is there anything you feel should be done to address this?
3. MOVIE CONCESSION PRODUCTS
- (NOTE TO MODERATOR) THE PURPOSE OF THIS SECTION IS TO ASSESS PARENT'S VIEWS ON WHETHER THE BRANDED POPCORN BUCKETS AND DRINK CUPS ARE CONSIDERED TO BE OF HIGH CHILD APPEAL, EVEN WHEN THE FILM ITSELF HAS BEEN RATED FOR OLDER AUDIENCES.
- Now, I'm going to show you a selection of products that are typically sold at movie theatre concessions. I'd like you to look at the packaging/design for the product, rather than think about the product itself (i.e, popcorn and beverages).
- Which of these containers would be more/less appealing to children? MODERATOR TO PLACE GREEN STICKERS ON THOSE PARENTS SAY WOULD APPEAL MORE TO CHILDREN. What is it about these items that makes them more appealing to children? Probe for:
- Are the 'movie-branded' or character design containers more appealing than the generic movie-theater-branded containers or does it not make much of a difference? Explain.
- Specifically, I'm interested in learning more about those that are branded in association with a movie – some incorporate the name, while others use creative elements drawing from the movie. Looking at these, are there some that would appeal more to children? Which ones? Why? What is it about them that appeals to children? Probe for:
- Characters, colours, design of the container itself, etc.
- Would all of the films noted on the packaging be appropriate for your children to see? Depending on answers to previous questions, ask: It's interesting that even though the film may not be rated for children, the packaging of these products would be appealing to children? Do you have an issue with this? Is this a concern for you? Do you feel anything should be done to address this?
E. GROCERY STORE DISPLAYS (15 MINUTES)
- In a survey we undertook with parents across Canada, parents told us that in-store displays on shelves and at check-out counters were one of the more common ways in which their children are exposed to food and beverage marketing. First, how many of you usually take your child/children along when grocery shopping? Which of the following statements best reflects how you feel?
- I try to avoid it because I can do it faster alone
- I try to avoid it because he/she is pushing for treats
- I enjoy choosing food together with my child/children
- I have to, but I don't enjoy it
- I've got some pictures to show you that might help stimulate your thinking about in-store displays. MODERATOR TO POST EXAMPLES. Probe for:
- Do grocery displays work? Do they influence you children's food requests?
- What types of food displays are most appealing to children? What is it about them that makes them effective? What makes them attractive to children?
- Which food and beverage companies/brands make use of this type of marketing technique most effectively (in terms of getting your children's attention)?
- What about seasonal displays (i.e., Halloween, Back to School, Christmas, Easter, Canada Day, etc.)? Do these also have a significant influence on your children's food requests? Explain. What is it about the seasonal context that has an impact?
F. WRAP UP: SCREEN TIME (10 MINUTES – ONLY IF TIME PERMITS)
- I'd like to know a little more about the kinds of activities your children are involved in, which might expose them to various food and beverage products and brands?
- How many of your children have access to the Internet? How are they going online? What are they doing online? Probe for:
- Online video games – which ones?
- YouTube videos – what kind of videos are they watching?
- Using social media – which platforms?
- Accessing specific websites – which ones? Are any of them food and beverage company websites? Or, are any of the sites they are visiting sponsored by/inked to products offered by food and beverage companies?
- What about TV? Do your children watch TV regularly? Which shows are they watching? Probe for:
- Cartoons – which ones?
- Other types of TV shows?
- [If not mentioned earlier, ask] What about access to a cell phone with a data plan/smartphone? Probe for:
- How many have children who have access to a cell phone? At what age did they get it?
- At what age is it appropriate for your child to have access?
- Do you limit at all what your child can use the cell phone for? Why/why not?
- How many of your children have access to the Internet? How are they going online? What are they doing online? Probe for:
- Do you feel differently about food and beverage marketing to children now as compared to before you took part in this discussion? If so, how? What of the various things we've discussed has had the most impact on you?
THANK PARTICIPANTS AND END SESSION
GUIDE DE L'ANIMATEUR -- LA COMMERCIALISATION DES ALIMENTS ET DES BOISSONS AUPRÈS DES ENFANTS
PARENTS
Objectifs :
Solliciter l'opinion des parents sur :
- Les éléments de l'emballage et de la publicité sur les aliments et les boissons qu'ils croient avoir un attrait auprès des enfants; ainsi que
- Les éléments de l'emballage et de la publicité sur les aliments et les boissons qu'ils croient être destinés aux enfants.
LIEU |
LANGUE | HEURE | GROUPE # | COMPOSITION DU GROUPE |
|---|---|---|---|---|
| Toronto Consumer Vision Midtown Toronto 1867 Yonge Street – Suite #200, Toronto ON M4S 1Y5 |
ANGLAIS | 10 H à 11 H | 1 | Parents d'enfants 6 ans à 8 ans (1erannée à la 3e année) |
| 13 H à 14 H 30 | 3 | Parents d'enfants 9 ans à 12 ans (4e année à la 6e année) |
||
| Montréal CRC Montréal 1610 Rue Ste-Catherine Ouest, Bureau 411, Montréal QC H3H 2S2 |
FRANÇAIS | 10 H à 11 H | 5 | Parents d'enfants 6 ans à 8 ans (1erannée à la 3e année) |
| 13 H à 14 H 30 | 7 | Parents d'enfants 9 ans à 12 ans (4e année à la 6e année) |
G. INTRODUCTION (5 MINUTES)
- Souhaiter la bienvenue aux participantes et aux participants/présentation de l'animateur
- Précisez le commanditaire de la recherche et expliquez l'objectif des groupes menés auprès des parents ainsi que les enfants : les groupes sont entrepris pour le compte du gouvernement du Canada (Santé Canada) afin d'étudier les impressions quant à la commercialisation des aliments et des boissons, notamment auprès des enfants.
- Expliquez les particularités de la salle/des installations de vidéoconférence et les dispositions en matière de confidentialité :
- Enregistrement vidéo/audio et le miroir argus
- Confidentialité – aucun commentaire ne sera attribué aux participantes et participants
- Utilisation des prénoms seulement et aucun nom n'apparaitra dans quelque rapport que ce soit
- Expliquez la façon dont la discussion sera structurée
- Conversation fluide – nous recherchons des réponses sincères et honnêtes plutôt que nécessairement obtenir un consensus
- La discussion durera dans l'ensemble 90 minutes
- L'animateur ne travaille pas pour Santé Canada, ni pour l'industrie des aliments et des boissons
- Tour de table pour se présenter brièvement – Je vous demanderais de nous donner votre prénom et de nous parler un peu de vous. Vous êtes toutes et tous des parents, donc j'aimerais également savoir combien d'enfants vous avez ainsi que leurs âges.
- Veuillez noter que tout au long de la discussion je vais surtout vous demander de me répondre en tenant compte de vos enfants qui ont de (6 à 8 ans/9 à 12 ans, selon le groupe). Il est possible que vous ayez des enfants qui se trouvent dans d'autres tranches d'âge, mais j'aimerais que vous me répondiez selon la perspective de vos enfants se trouvant dans la tranche d'âge que nous venons de spécifier.
H. MISE EN TRAIN : PRÉOCCUPATIONS PAR RAPPORT À LA COMMERCIALISATION DES ALIMENTS ET DES BOISSONS (5 MINUTES)
- Comment vous sentez-vous par rapport à la commercialisation des aliments et des boissons auprès des enfants que font les entreprises ? Est-ce une chose à laquelle vous songez beaucoup ? Sondez pour :
- Dans quelle mesure êtes-vous préoccupés par la fréquence à laquelle vos enfants sont exposés aux campagnes de commercialisation, ainsi qu'aux produits qui sont commercialisés ? Tel que des produits malsains, des produits sucrés, des produits à forte teneur lipidique, etc..
- Sentez-vous que les enfants sont plus ou moins susceptibles d'être influencés par la commercialisation des aliments et des boissons par les entreprises comparativement aux adolescents, aux jeunes adultes, et aux adultes ? Sondez :
- De quelle façon ? Comment sont-ils affectés ?
- À quel âge direz-vous que les enfants deviennent davantage sensibilisés à la commercialisation de produits et/ou se mettent-ils à reconnaître des marques spécifiques, ainsi qu'à en faire la demande ? Sondez pour les différences pouvant y avoir entre les plus jeunes enfants et les plus vieux, parmi la tranche d'âge de 2 à 12 ans.
I. OPINIONS GÉNÉRALES SUR LES TACTIQUES DE COMMERCIALISATION D'ALIMENTS ET DE BOISSONS VISANT LES ENFANTS OU S'ADRESSANT À EUX (10 MINUTES)
- Croyez-vous qu'il y ait certains types ou certaines catégories d'aliments qui sont surtout destinés aux enfants ? C'est-à-dire des catégories d'aliments ou de produits pour lesquels les campagnes de commercialisation sont clairement conçues pour davantage rejoindre les enfants. Sondez :
- Selon vous, quels types ou quelles catégories de produits alimentaires et de boissons ont davantage tendance à s'adresser activement aux enfants avec leurs campagnes de commercialisation ? (P. ex. les céréales, les grignotines, les biscuits, les craquelins, les desserts, les boissons, les restaurants/la restauration rapide)
- Quelles seraient certaines des tactiques de commercialisation que vous diriez sont les plus fréquemment utilisées par les entreprises qui produisent ces marques ? L'ANIMATEUR ÉCRIRA LA LISTE AU TABLEAU PAPIER. Sondez les tactiques suivantes et pour chacune veuillez tenter d'obtenir des détails précis, ainsi que leur efficacité respective. (C.-à-d., quelles émissions de télé, à quel endroit en ligne, les genres de promotion, etc.)
- Logos
- Présentoirs en magasins/placement de produits à la caisse
- L'emballage de produits
- La publicité à la télé, en ligne, au cinéma
- Le placement de produits dans les émissions de télé, dans les films, etc.
- Jeux vidéos
- Distributeurs automatiques
- Promotions/commandites
- Concours/prix
- Dans les écoles (si cela s'applique), les garderies/CPE
- Bouche-à-oreille (c.-à-d. voir ce qu'ont les autres enfants)
- Promotions faites par des personnalités connues – qui jouit d'une plus grande popularité/qui est davantage influent ?
- Vente de produits dérivés (c-à-d. des personnages/des vêtements de marque, jouets/jeux, etc.)
- Autres choses ?
- En songeant à chacune de ces tactiques, lesquelles croyez-vous sont les plus puissantes -- c'est-à-dire qui auraient le plus d'influence ou seraient les plus efficaces auprès des enfants quant à les exposer à des marques spécifiques et qu'ensuite votre enfant en fasse la demande à répétition ? L'ANIMATEUR LES ENCERCLERA AU TABLEAU PAPIER.
J. ÉVALUATION DES TACTIQUES UTILISÉES PAR L'INDUSTRIE DE L'ALIMENTATION ET DES BOISSIONS, DESTINÉES AUX ENFANTS OU AYANT UN ATTRAIT POUR EUX (45 MINUTES)
4. LOGOS
- (NOTE À L'INTENTION DE L'ANIMATEUR) L'OBJECTIF DE CETTE SECTION EST D'ÉVALUER QUELS ÉLÉMENTS DES LOGOS, LORSQUE RETIRER DE SON CONTEXTE EMBALLAGE ET PUBLICITAIRE, SONT CONSIDÉRÉS COMME ÉTANT PLUS ATTRAYANT POUR LES ENFANTS QUE POUR LES ADULTES
- J'aimerais entrer dans les détails de certaines de ces tactiques. Regardons les logos de certains produits. L'ANIMATEUR FIXERA LES LOGOS AU MUR. POUR CHACUN, DEMANDEZ : Premièrement, est-ce que votre enfant reconnaîtrait certains/tous ces logos ?. Y'en a-t-il que votre enfant ne reconnaîtrait probablement pas ? Lesquels ? Vous souvenez-vous à quel genre de produit ce logo est associé ?
- Lorsque vous parcourez l'ensemble de ces logos, veuillez m'indiquer lequel A) Est destiné aux enfants ? ET B) Est attrayant pour un enfant ? Sondez :
- Par rapport aux caractéristiques ou aux éléments de la conception du logo, qu'est-ce qui les rend plus attrayant pour les enfants ? L'ANIMATEUR PLACERA UN AUTO-COLLANT VERT SUR CEUX DONT LES PARENTS DISENT QU'ILS SERAIENT PLUS ATTRAYANTS POUR LES ENFANTS. Discuter. En revanche, y a-t-il des caractéristiques ou des éléments de la conception du logo qui le rend tout autant, sinon plus attrayant pour les adultes ? L'ANIMATEUR PLACERA UN AUTO-COLLANT JAUNE SUR CEUX DONT LES PARENTS DISENT QU'ILS SERAIENT PLUS ATTRAYANTS POUR LES ADULTES. Discuter. Sondez :
- L'utilisation d'une forme humaine
- L'utilisation d'un personnage animée
- L'utilisation de couleurs
- L'association faite entre le produit et un certain type d'aliment (c.-à-d. aliment sucré, produit laitier, nourriture rapide, etc.)
- Par rapport aux caractéristiques ou aux éléments de la conception du logo, qu'est-ce qui les rend plus attrayant pour les enfants ? L'ANIMATEUR PLACERA UN AUTO-COLLANT VERT SUR CEUX DONT LES PARENTS DISENT QU'ILS SERAIENT PLUS ATTRAYANTS POUR LES ENFANTS. Discuter. En revanche, y a-t-il des caractéristiques ou des éléments de la conception du logo qui le rend tout autant, sinon plus attrayant pour les adultes ? L'ANIMATEUR PLACERA UN AUTO-COLLANT JAUNE SUR CEUX DONT LES PARENTS DISENT QU'ILS SERAIENT PLUS ATTRAYANTS POUR LES ADULTES. Discuter. Sondez :
- Regardons plus en détails certains de ces logos. Plusieurs d'entre eux vont intégrer une forme humaine ou bien un visage (Aunt Jemima, Paul Newman, Chef Boyardee, Sun Maid, PFK). Sondez :
- Lequel d'entre eux est plus attrayant pour un enfant/un adulte ? Pourquoi ? Veuillez me préciser ce à quoi les enfants sont attirés ?
- Si l'on regarde les logos du Chef Boyardee et de Paul Newman, y'en a-t-il un qui est plus attrayant que l'autre pour un enfant ? Le cas échéant, qu'est-ce qui le rend davantage sympathique ?
- Un certain nombre de logos utilisent des personnages de style bande dessinée. Sondez :
- Lequel d'entre eux est plus attrayant pour un enfant/un adulte ? Quel(s) aspect(s) de la conception vous fait pensez que l'intention est de le rendre attrayant pour les enfants ?
- Pourquoi pensez-vous que les enfants viennent qu'à le reconnaître et à se rappeler de ce logo en particulier ?
- Dans le cas qui nous occupe, on dit que les personnages utilisés dans la commercialisation des M&M sont destinés aux adultes. On se demande si/pourquoi les enfants les trouvent attrayants/intéressants ?
- Certains de ces logos semblent visiblement conçus pour capter l'attention des enfants, comparativement aux autres. Cependant, on se questionne quant à trois en particulier – Vlasic, Starbucks et Voortman's
- Examinons d'abord Vlasic. Diriez-vous que la mascotte pour cette marque de cornichons a un attrait auprès des enfants ? Pourquoi ou pourquoi pas ?
- Maintenant, regardons le logo de Starbucks. S'il y a lieu, qu'est-ce qui rend ce logo attrayant pour un enfant.
- Lorsque vous regardez le logo de Voortman's et celui de Starbucks, comment se comparent-ils quant à l'attrait qu'un enfant pourrait avoir envers l'un ou l'autre ?
- Si on parcourt ces logos de nouveau, tout en tenant compte de vos enfants (âgés de 6 à 8 ans/9 à 12 ans), lesquels représentent des marques qui commercialisent des produits que vous sentez ne conviennent pas à vos enfants ? Tout dépendant des réponses obtenues à la question précédente, demandez : Donc, il semble que certaines de ces marques sont surtout destinées aux adultes, mais qu'elles pourraient avoir un attrait auprès des enfants. Est-ce que cela vous préoccupe ?
5. EMBALLAGE PRODUIT – CRAQUELINS/BISCUITS
- (NOTE À L'INTENTION DE L'ANIMATEUR) L'OBJECTIF DE CETTE SECTION EST D'IDENTIFIER LESQUELS DES EMBALLAGES SONT CONSIDÉRÉS COMME ÉTANT PLUS ATTRAYANT POUR LES ENFANTS QUE POUR LES ADULTES ET POURQUOI
- Maintenant, à l'aide de quelques exemples, j'aimerais qu'on regarde l'influence et l'impact de l'emballage produit. Mais avant de les regarder, croyez-vous que vos enfants puissent dire s'ils vont aimer le goût des aliments qu'en regardant l'emballage ? Par rapport à l'emballage, c'est quoi qui leur fait croire qu'ils aimeront le goût du produit ? Est-ce quelque chose que vous prenez en considération lorsque vous achetez un produit (c.-à-d., la façon dont le produit est emballé) ?
- Je vais maintenant vous montrer des emballages de biscuits et de craquelins. L'ANIMATEUR AFFICHERA LES EXEMPLES. D'abord, est-ce que vos enfants reconnaîtraient certaines ou toutes ces marques ? Y aurait-il certaines marques que vos enfants ne reconnaissent probablement pas ? Lesquelles ?
- En regardant chacun des emballages, lesquels des produits selon vous sont commercialisés de sorte à les rendre probablement plus attrayants pour les enfants ? L'ANIMATEUR PLACERA UN AUTO-COLLANT VERT SUR CEUX DONT LES PARENTS DISENT QUE ÇA SERAIT PLUS ATTRAYANT POUR LES ENFANTS.
- Que voyez-vous sur l'emballage qui vous fait croire que ça attira davantage les enfants ? Sondez : L'imagerie, la conception, les couleurs éclatantes, les formes, le nom du produit, les mots utilisés pour décrire le produit, un mouvement dynamique, etc.
- Pour ce qui est des autres emballages produits, ceux envers lesquels vous croyez que les enfants auraient moins d'attrait ou qui sont sont davantage destinés aux adultes, qu'ont-ils qui vous fait dire cela ?
- Jetons un coup d'œil à quelques exemples d'une même marque – les Biscuits Oreo L'ANIMATEUR MONTRE CINQ EXEMPLES D'OREO – MINI (2), GÂTEAU D'ANNIVERSAIRE, DOUBLE CRÈME. Oreo est une marque de biscuit très répandue et très appréciée. Qu'est-ce qui la rend aussi appréciée auprès des enfants ? Et, lorsque que nous comparons la conception des différents emballages, quels éléments ressortent le plus pour vous comme étant ceux qui la rend particulièrement attrayante pour les enfants et quels sont ceux qui tentent de capter l'attention des enfants ? Sondez :
- Y a-t-il des emballages qui attirent autant les enfants que les adultes ? Lesquels ? Quels éléments captent l'attention des enfants ?
- Finalement, regardons tous les exemples d'emballage des différents biscuits et craquelins. Lesquels diriez-vous ne conviennent pas aux enfants (c.-à-d. que ce n'est pas un produit qui devrait-être commercialisé auprès des enfants) ? Selon les réponses aux questions précédentes, demandez : Donc, il semble qu'il y'a des emballages qui attirent les enfants, malgré votre sentiment que ce n'est pas un produit qui est convenable pour eux de consommer.
6. PRODUITS AU COMPTOIR D'ALIMENTATION EN SALLE DE CINÉMA
- (NOTE À L'INTENTION DE L'ANIMATEUR) L'OBJECTIF DE CETTE SECTION EST D'ÉVALUER LES POINTS DE VUE DES PARENTS, À SAVOIR SI LES SEAUX DE MAÏS SOUFFLÉ ET LES GOBELETS DE PLASTIQUE ONT UN NIVEAU D'ATTRAIT ÉLEVÉ POUR LES ENFANTS MÊME LORSQUE LE FILM EST CLASSÉ POUR UN PUBLIC PLUS ÂGÉ.
- Je vais maintenant vous montrer une sélection de produits qui sont typiquement vendus au comptoir d'alimentation dans les salles de cinéma. J'aimerais que vous regardiez le contenant et sa conception, plutôt que le produit lui-même (c.-à-d. le maïs soufflé et la boisson).
- Lesquels de ces contenants seraient plus/moins attrayants pour les enfants ? L'ANIMATEUR PLACERA UN AUTO-COLLANT VERT SUR CEUX DONT LES PARENTS DISENT QU'ILS SERAIENT PLUS ATTRAYANT POUR LES ENFANTS. Qu'est-ce qui les rend plus attrayants pour les enfants ? Sondez :
- Est-ce que les contenants qui sont en lien avec « l'image de marque » d'un film ou ayant une conception en lien avec un personnage ont un plus grand attrait que les contenants plus génériques affichant le nom de la salle de cinéma, ou bien est-ce que cela fait peu de différence ? Veuillez expliquer.
- Je suis particulièrement intéressé à en apprendre davantage sur ceux qui sont associés aux différents éléments de « la marque » d'un film que ce soit le nom, une image, ou même une conception à l'effigie d'un personnage, ainsi que tout autre élément tirez du film même. Lorsque vous regardez ceux-ci, y'en a-t-il qui auraient un plus grand attrait pour les enfants ? Lesquels ? Pourquoi ? Qu'est-ce qui les rend plus attrayants pour les enfants ? Sondez :
- Personnages, couleurs, la conception même du contenant, etc.
- Serait-il convenable pour vos enfants de visionner tous les films que l'on retrouve sur les contenants ? Selon les réponses aux questions précédentes, demandez : C'est intéressant de noter que malgré que le film ne soit peut-être pas classé pour enfants, que ceux-ci trouveraient les contenants d'aliments et de boissons attrayants.
K. PRÉSENTOIRS EN ÉPICERIE
- Dans le cadre d'un sondage que nous avons mené auprès de parents à travers le Canada, on nous a dit que les présentoirs en magasin, aux tablettes et à la caisse sont les façons les plus courantes par lesquels leurs enfants sont exposés à la commercialisation de produits alimentaires et de boissons. D'abord, combien d'entre vous allez faire l'épicerie avec vos enfants ? Lequel des énoncés suivants reflète le mieux comment vous vous sentez ?
- J'essaie d'éviter ça, car lorsque je suis seul je peux les faire plus rapidement
- J'essaie d'éviter ça, car il ou elle insiste pour avoir des gâteries
- Je prends plaisir de choisir les aliments ensemble avec mon/mes enfant(s)
- Je dois le faire, mais je n'y prends pas plaisir.
- J'ai des photos à vous montrer qui pourraient vous aider à stimuler votre réflexion par rapport au présentoir en magasin. L'ANIMATEUR AFFICHERA LES EXEMPLES. Sondez :
- Est-ce que les présentoirs que l'on retrouve en épicerie fonctionnent ? Est-ce que ceux-ci influencent vos enfants quant aux aliments qu'ils ou elles vous demandent de leur procurer ?
- Quel genre de présentoirs d'aliments sont les plus attrayants pour les enfants ? Qu'est-ce qui les rend efficaces ? Qu'est-ce qui les rend attrayants pour les enfants ?
- Quelles marques ou entreprises d'alimentation et de boissons sont les plus efficaces (pour ce qui est de capter l'attention de vos enfants) quant à l'utilisation de cette technique de commercialisation ?
- Qu'en est-il des présentoirs saisonniers (c.-à-d. l'Halloween, la rentrée scolaire, Noël, Pâques, la fête du Canada, etc.) ? Est-ce que ceux-ci ont également une influence significative sur vos enfants quant aux aliments qu'ils ou elles vous demandent de leur procurer ? Veuillez expliquer. Qu'est-ce qui fait que le contexte saisonnier a un tel effet ?
POUR CONCLURE : TEMPS PASSÉ DEVANT UN ÉCRAN
- J'aimerais en savoir un peu plus au sujet des types d'activités auxquelles vos enfants participent et qui pourraient peut-être leur permettre de découvrir divers produits alimentaires et boissons, ainsi que marques.
- Combien de vos enfants ont accès à Internet ? De quelle façon vont-ils en ligne ? Que font-ils en ligne ? Sondez :
- Jeux vidéo en ligne – lesquels ?
- Vidéos YouTube – quels genres de vidéos regardent-ils ?
- Utilisent-ils les médias sociaux – quelles plateformes ?
- Accèdent-ils à des sites web spécifiques – lesquels ? Y'en a-t-il qui sont des sites d'entreprises d'alimentation et de boissons ? Ou bien, est-ce que certains des sites qu'ils visitent sont commandités ou sont en lien avec des produits offerts par des entreprises d'alimentation et de boissons ?
- Qu'en est-il de la télé ? Est-ce que vos enfants écoutent régulièrement la télé ? Quelles émissions regardent-ils ? Sondez :
- Des dessins animés – lesquels ?
- D'autres genres d'émissions de télé ?
- [Si ce n'est pas déjà mentionné, demandez] Qu'en est-il d'avoir accès à un téléphone cellulaire avec un forfait données/de téléphone intelligent ? Sondez :
- Combien d'entre vous avez des enfants qui ont accès à un téléphone cellulaire ? À quel âge l'ont-ils obtenu ?
- À quel âge est-il approprié pour un enfant d'y avoir accès ?
- Est-ce que vous limitez de quelque façon que ce soit ce que font vos enfants avec leur téléphone cellulaire ? Pourquoi/pourquoi pas ?
- Combien de vos enfants ont accès à Internet ? De quelle façon vont-ils en ligne ? Que font-ils en ligne ? Sondez :
- Vous sentez-vous différemment par rapport à la commercialisation des produits alimentaires et des boissons auprès des enfants maintenant versus avant d'avoir participé à cette discussion.
REMERCIER LES PARTICIPANTS ET TERMINER LA SESSION