Baseline Survey on Lyme Disease and Other Tick-Borne Diseases
Final Report
Prepared for Health Canada
Supplier Name: Phoenix SPI
Contract Number: HT372-213550/001/CY
Contract Value: $73,980.14 (including applicable taxes)
Award Date: 2021-06-24
Delivery Date: 2021-09-12
Registration Number: POR # 019-21
For more information on this report, please contact Health Canada at: hc.cpab.por-rop.dgcap.sc@canada.ca
Ce rapport est aussi disponible en français.
Baseline Survey on Lyme Disease and Other Tick-Borne Diseases
Final Report
Prepared for Health Canada
Supplier name: Phoenix Strategic Perspectives Inc.
September 2021
This public opinion research report presents the results of an online survey conducted with 1,872 panellists at least 18 years of age who (at the time of the fieldwork) resided in areas across Canada of higher risk of Lyme disease and other tick-borne diseases and who spent time outdoors. This included: parents of children under 15 years of age, outdoor enthusiasts, people with occupational exposure, those living in rural areas and people with pets. The fieldwork was conducted August 4 through August 15, 2021.
This publication may be reproduced for non-commercial purposes only. Prior written permission must be obtained from Health Canada. For more information on this report, please contact Health Canada at:
hc.cpab.por-rop.dgcap.SC@canada.ca or at:
Communications and Public Affairs Branch
Health Canada
200 Eglantine Driveway, Jeanne Mance Building
AL 1915C, Tunney's Pasture
Ottawa, Ontario K1A 0K9
Catalogue number:
H14-384/2021E-PDF
International Standard Book Number (ISBN):
ISBN 978-0-660-40347-2
Related publications (registration number: POR 019-21):
Catalogue number (Final report, French) H14-384/2021F-PDF
ISBN 978-0-660-40348-9
© Her Majesty the Queen in Right of Canada, as represented by the Minister of Health, 2021.
Cette publication est aussi disponible en français sous le titre : Sondage de référence sur la maladie de Lyme et autres maladies transmises par les tiques
Table of Contents
Executive Summary
Introduction
Background and Objectives
Methodology
Notes to Reader
Detailed Findings
Awareness and general knowledge of Lyme disease and ticks
Perceptions of Risk
Preventative Measures
Knowledge about Pets in Relation to Tick Bites and Lyme Disease
Workplace Exposure and Information
Information Sources
Assessments of Ads
Profile of Survey Respondents
Appendix
Technical Specifications
Survey Questionnaire
Figures
Figure 1: Awareness of Lyme disease
Figure 2: Knowledge of cause of Lyme disease
Figure 3: Knowledge of where ticks are found
Figure 4: Knowledge of actions to take following a tick bite
Figure 5: Knowledge of how best to remove a tick
Figure 6: Knowledge of Lyme disease and symptoms
Figure 7: Level of concern about contracting Lyme disease
Figure 8: Perceived importance of Lyme disease and tick-borne diseases
Figure 9: Level of attention given to Lyme disease
Figure 10: Protecting yourself from tick bites
Figure 11: Measures taken to prevent tick bites
Figure 12: Measures taken to prevent tick bites in children
Figure 13: Barriers to taking precautions to reduce the chance of tick bites
Figure 14: Use of insect repellent
Figure 15: Frequency of checking for ticks
Figure 16: Awareness of potential risk of ticks and tick-borne diseases
Figure 17: Maintenance of exterior of property
Figure 18: Reasons for not taking action to prevent ticks on property
Figure 19: Knowledge of Lyme disease in pets
Figure 20: Frequency of checking pets for ticks
Figure 21: Preventative information provided by employer
Figure 22: Personal protective equipment provided by employer
Figure 23: Knowledge about preventing tick bites
Figure 24: Information on Lyme disease
Figure 25: Reasons for not looking for information on Lyme disease
Figure 26: Source of information for health-related issues
Figure 27: Source of information on outdoor activities
Figure 28: Source of information on home gardening
Figure 29: Perceptions of the information pamphlet
Figure 30: Likelihood of taking selected actions after seeing the pamphlet
Figure 31: Web banner recall
Figure 32: Perceptions of the web banner
Figure 33: Instagram Stories ranked
Figure 34: Reasons for most liked Instagram Story
Figure 35: Age and gender
Figure 36: Ethnic and cultural background
Figure 37: Level of formal education
Figure 38: Household income
Figure 39: Parents or guardians of children under 18
Figure 40: Pet ownership
Figure 41: Participation in outdoor activities
Figure 42: Frequency engaging in outdoor activities
Figure 43: Community size
Figure 44: Employment status
Figure 45: Environmental exposure
Figure 46: Environmental exposure – sector of work
Executive Summary
Health Canada commissioned Phoenix Strategic Perspectives (Phoenix SPI) to conduct a baseline survey of Canadians to measure awareness and knowledge of Lyme disease and other tick-borne diseases.
1. Research purpose and objectives
Lyme disease is one of the most rapidly emerging infectious diseases in Canada and the most commonly reported vector-borne disease in North America. The Public Health Agency of Canada (PHAC) developed a national tick and Lyme disease education and awareness campaign, in collaboration with partners. The purpose of this research was to provide evidence-based data and key insights to guide the development of the upcoming three-year marketing strategy to educate Canadians. The research objectives were to a) assess general knowledge, attitudes, prevention methods, perceptions and behaviours towards tick bite prevention, Lyme disease and other tick-borne diseases; and b) gather information on how best to inform and communicate with populations in areas at risk of contracting Lyme disease.
2. Methodology
A 15-minute online survey was administered to 1,872 adults (Footnote 1) aged 18 and older who reside in areas of higher risk of Lyme disease and other tick-borne diseases (Footnote 2) and who spend time outdoors, including: parents of children under the age of 15, outdoor enthusiasts (Footnote 3), people with occupational exposure (Footnote 4), those living in rural areas (Footnote 5), and people with pets (a cat and/or a dog). This was a non-probability sample drawn from a commercial online panel; therefore, no inferences can be made to the greater population. The fieldwork was conducted August 4 to August 15, 2021.
3. Key Findings
A large majority have heard of Lyme disease.
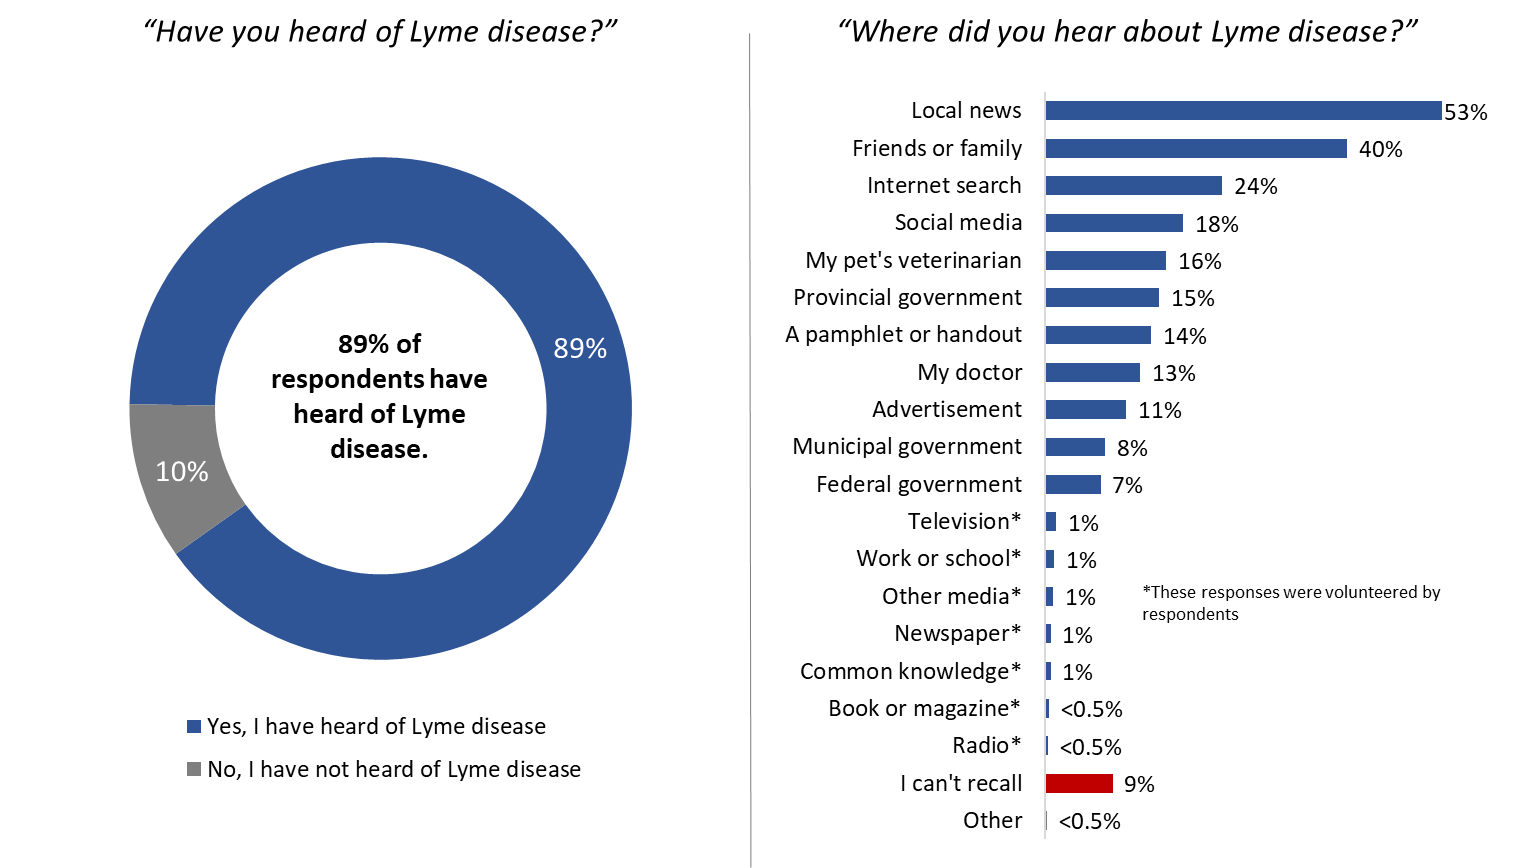
Almost nine in 10 (89%) respondents said they have heard of Lyme disease. Awareness of Lyme disease was higher among rural dwellers (94%), pet owners (91%), and those considered outdoor enthusiasts (91%). Among those who have heard of Lyme disease, most heard about it on the local news (53%) and through family and friends (40%).
Respondents are moderately knowledgeable about Lyme disease and ticks.
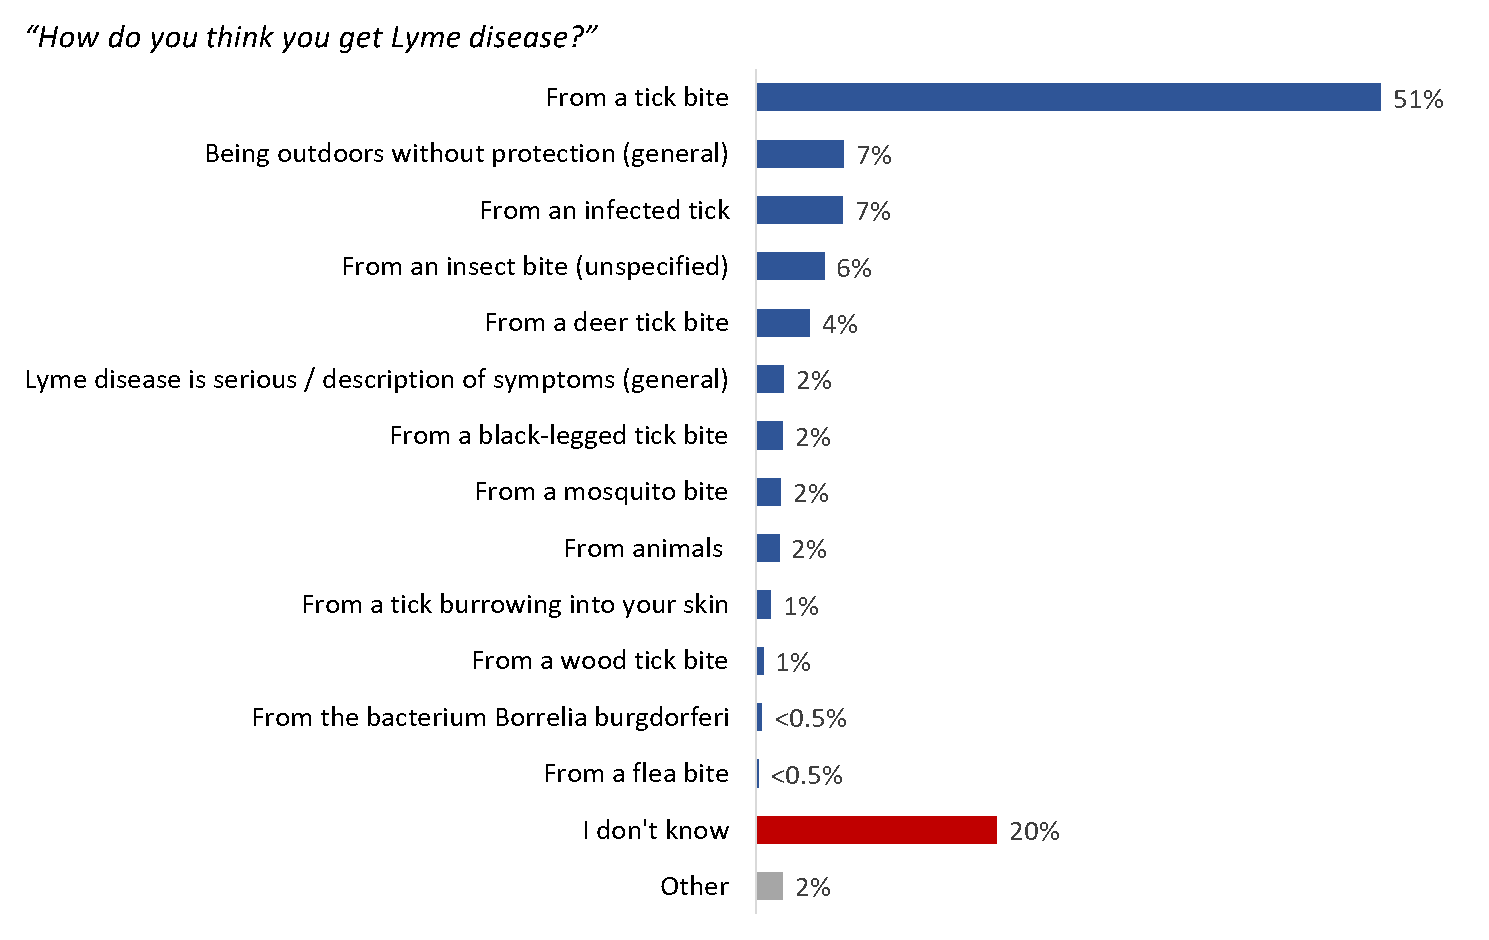
When asked in an open-ended manner how they think people get Lyme disease, approximately two-thirds (65%) of respondents correctly said that Lyme disease is contracted through a tick bite. One in five (20%) did not know how Lyme disease is contracted.
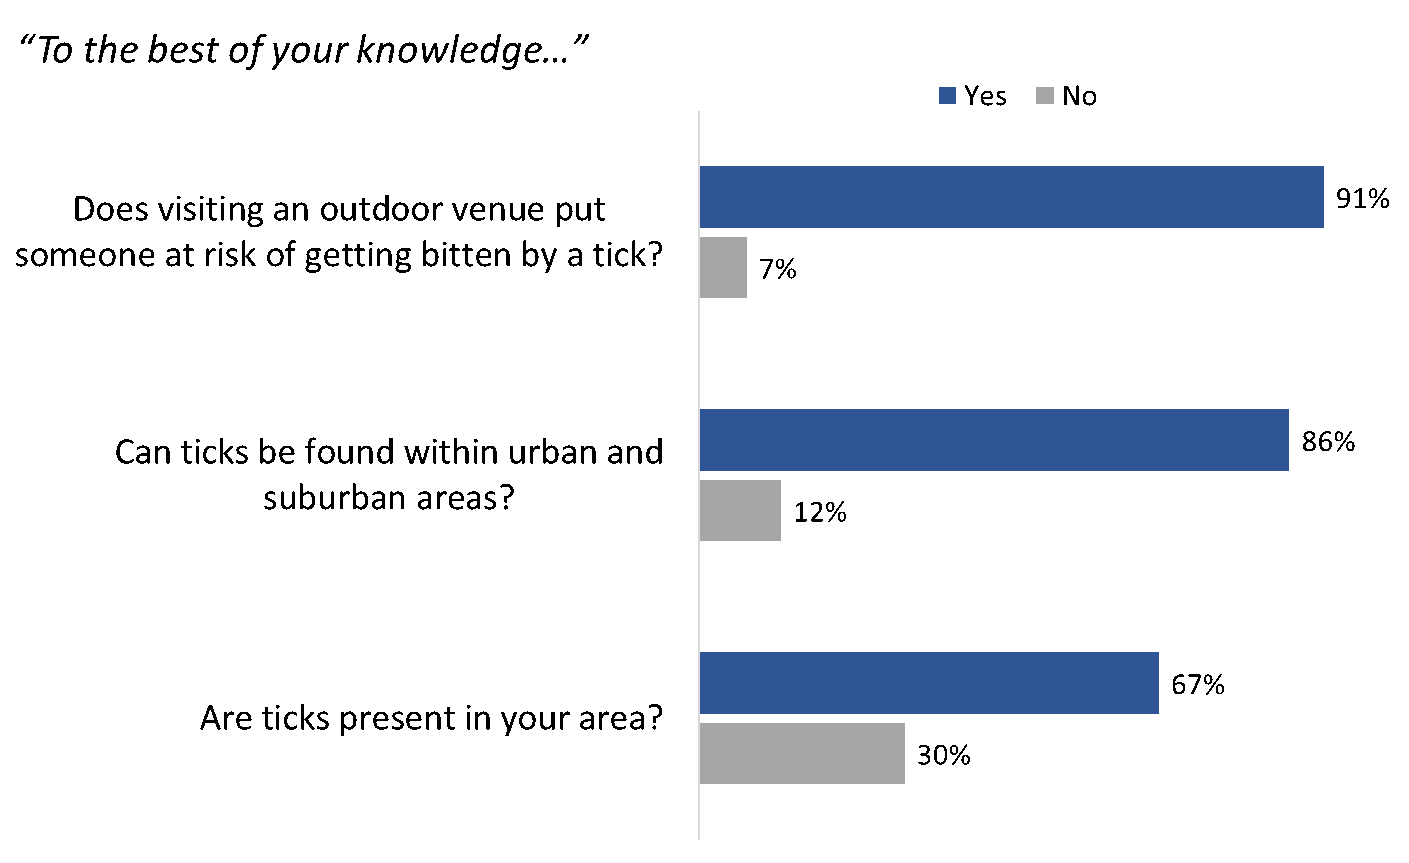
The vast majority of respondents believe visiting an outdoor venue puts someone at risk of getting bitten by a tick (91%), even within urban and suburban areas (86%). Additionally, two-thirds of those surveyed believe that ticks can be found in their area (67%). Overall, outdoor enthusiasts, rural dwellers, and pet owners were generally more knowledgeable about where ticks can be found.
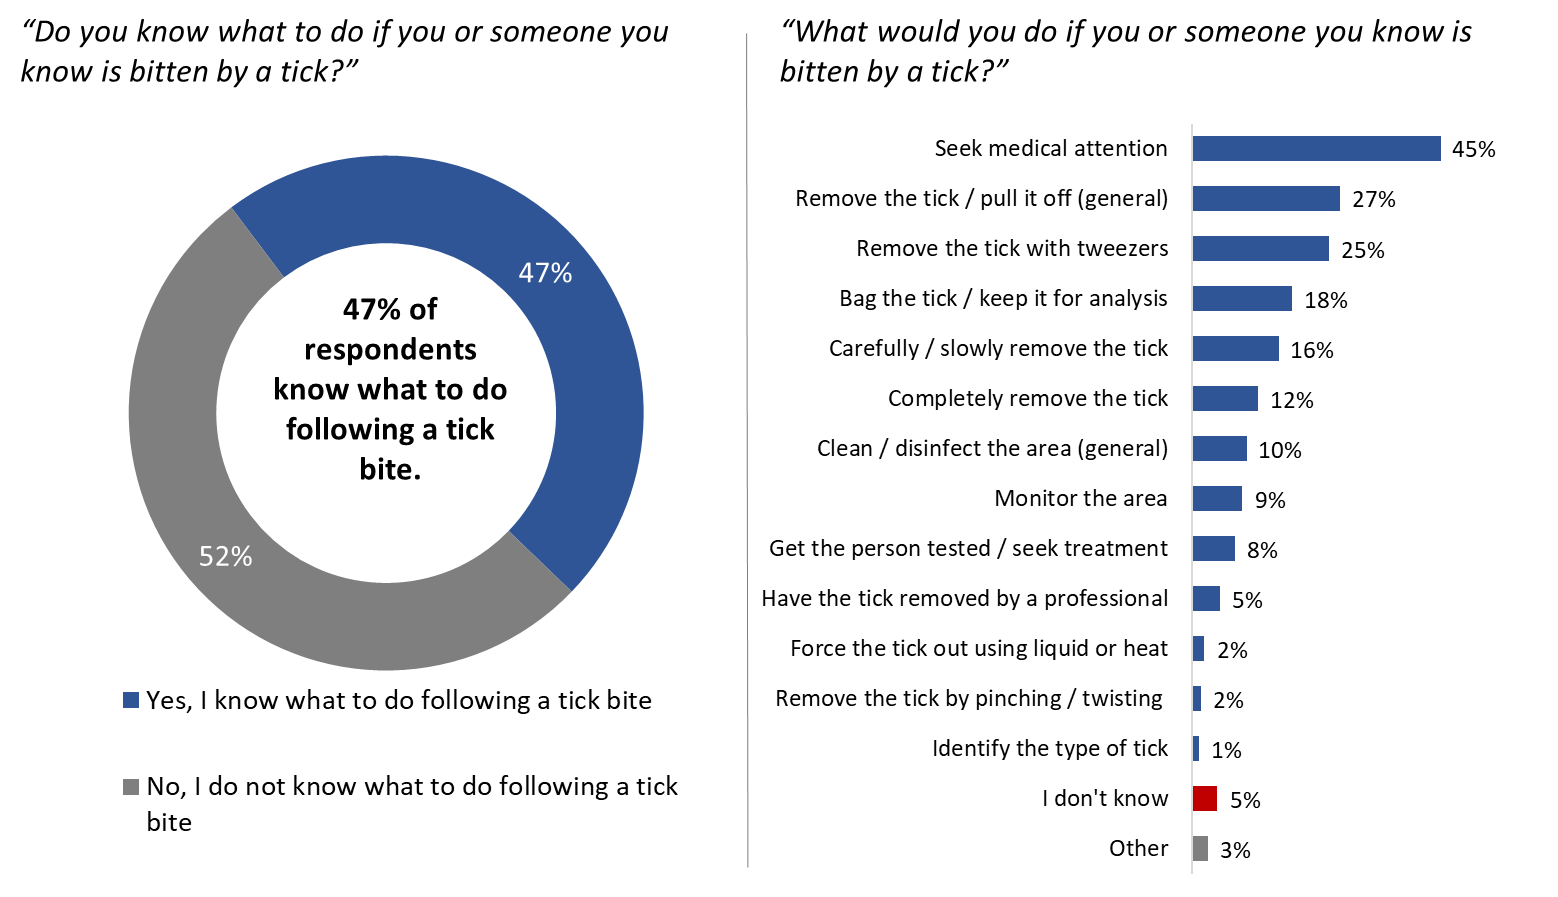
While many respondents claimed to know how Lyme disease is contracted and majorities knew where ticks can be found, fewer than half (47%) would know what to do if they, or someone they know, is bitten by a tick. Those who live in a rural area of the country (59%) and those who are outdoor enthusiasts (49%) were among those most likely to say they would know what to do in the event of a tick bite.
Those who said they would know how to handle a tick bite were asked, in an open-ended manner, what actions they would take. A large proportion (45%) said they would seek medical attention. Following this, similar proportions said they would remove the tick or pull it off (27%) or remove it using tweezers (25%). When later asked to identify the best way to remove a tick, seven in 10 (70%) said the best method is to use tweezers.
Many are at least moderately concerned about contracting Lyme disease and believe that the topic is an important issue.
Two-thirds (67%) of respondents said they are at least moderately concerned about contracting Lyme disease. Concern about contracting Lyme and other tick-borne diseases was higher among those at risk of workplace exposure (76%), parents (75%), dog owners (74%), and outdoor enthusiasts (69%).
Underscoring concern, nine in 10 (91%) view the topic of Lyme and tick-borne diseases as an important issue for Canadians and six in 10 (60%) believe that Lyme disease does not receive enough attention. Respondents who live in rural areas were more likely to say that Lyme and other tick-borne diseases is an important topic of discussion for Canadians (94% versus 90% of those living in urban areas).
Many believe they know how to protect themselves from being bitten by a tick.
When it comes to prevention, six in 10 (60%) said they know how to help protect themselves from being bitten by a tick. Knowledge of protective measures was higher among rural dwellers, pet owners, and outdoor enthusiasts.
Approximately nine in 10 respondents identified at least one precaution they take to protect themselves from tick bites. The preventative measures most frequently mentioned include wearing pants (70%), avoiding areas with ticks (69%), checking their body for ticks (65%), and wearing long-sleeved shirts (63%). Among those who use insect repellent to prevent tick bites (n=984), the majority (62%) use DEET. The most common areas to apply insect repellent is to the legs (89%), arms (87%), neck (77%), and hands (67%).
There are few barriers, moreover, to taking action to prevent tick bites. Half (51%) of those who do not take preventative measures said there is no reason—they simply have not done anything to reduce the chance of being bitten by a tick. Those who pointed to specific reasons, or barriers, noted a lack of information (24%) and the cost of purchasing appropriate outdoor clothing (3%). Others said they do not think there are ticks where they live (12%), do not view ticks as a threat (7%), or trust themselves not to get bitten (5%).
Close to half (44%) have looked for information on Lyme disease.
Forty-four percent of respondents have looked for information on Lyme disease or other tick-borne diseases and an additional 12% have not done so but plan to in the coming weeks. Those at risk of workplace exposure (58%), pet owners (49%), rural dwellers (48%), and outdoor enthusiasts (46%) were more likely to have looked for information on Lyme disease or other tick-borne diseases. Among those who have looked for this type of information, three-quarters (75%) have looked for symptoms of Lyme disease or other tick-borne diseases. Smaller, and similar proportions said they have looked for information on the following topics: prevention (63%), treatment (61%) as well as areas where ticks are found (60%).
Respondents hold generally positive impressions of the advertising materials.
The vast majority of respondents agreed somewhat or strongly that the information in the pamphlet is easy to understand (94%), that the design is attention-catching (89%), and that the information is personally relevant (88%). Additionally, after having seen the information pamphlet, nine in 10 (91%) said they felt more confident about how to protect themselves from tick bites. Turning to the web banner ad, eight in 10 agreed somewhat or strongly that the information is relevant (80%) and that the design and text is attention-catching (79%). Nearly three-quarters (73%) said they want to learn more about ticks and Lyme disease after having seen the ad. There was no consensus when it came to the Instagram Stories, although the fourth Instagram Story ('socks') was preferred by the single largest proportion—34%.
4. Limitations of the research
Surveys, like this one, that use samples drawn from online panels cannot be described as statistically projectable to the target population and no estimates of sampling error can be calculated because the sample is based on those who initially self-selected for participation in the panel.
5. Use of the results
The results of this research will be used by the Government of Canada to better understand the knowledge, attitudes, barriers, and motivations that influence tick-prevention behaviours. This will help to inform and validate the national tick and Lyme disease education and awareness campaign's direction, messaging, and products, as well as preferred communication channels and tactics.
6. Political Neutrality Certification
I hereby certify, as a Senior Officer of Phoenix Strategic Perspectives, that the deliverables fully comply with the Government of Canada political neutrality requirements outlined in the Communications Policy of the Government of Canada and Procedures for Planning and Contracting Public Opinion Research. Specifically, the deliverables do not contain any reference to electoral voting intentions, political party preferences, standings with the electorate, or ratings of the performance of a political party or its leader.
Signed:
Alethea Woods, President
Phoenix Strategic Perspectives Inc.
7. Contract value
The contract value was $73,980.14 (including HST).
Introduction
Phoenix Strategic Perspectives (Phoenix SPI) was commissioned by Health Canada to conduct a baseline survey of Canadians on Lyme disease and other tick-borne diseases.
Background and Objectives
Lyme disease is one of the most rapidly emerging infectious diseases in Canada and the most commonly reported vector-borne disease in North America. As the climate changes, Canada is becoming more favourable to tick populations resulting not only in growth in the number of ticks but also northward expansion. The risk of contracting Lyme disease in Canada is increasing, from 144 cases reported in 2009 to 2,636 cases reported in 2019 (preliminary numbers as of November 2021). (Footnote 6)
Ticks are most active in spring, summer and fall but can be found at any time of the year when the temperature is consistently above freezing. Cases usually occur between May and November, peaking in July when the ticks are most active, and Canadians are frequently involved in outdoor activities where they are found. While the probability of encountering an infected tick may be lower in some areas of the country, it is possible to find an infected tick almost anywhere in Canada, and all Canadians should be aware of steps they can take to prevent tick bites and what to do to reduce their risk of contracting Lyme disease and other tick-borne diseases if they get bit by a tick.
This research will support key deliverables identified under the Federal Framework on Lyme Disease and Action Plan (2017-22). Under the Action Plan Commitments, the Public Health Agency of Canada (PHAC) developed a national tick and Lyme disease education and awareness campaign, in collaboration with partners, which addresses:
a. Tick bite prevention and early intervention; and
b. How to recognize Lyme disease symptoms so patients can seek help and front-line professionals can perform early diagnosis and treatment.
This research was designed to inform and validate the multi-year Lyme disease marketing campaign targeting the general public, specifically Canadians who live or visit higher risk areas, to educate and raise awareness about Lyme disease. The specific objectives for the research were to:
a. Assess general knowledge, attitudes, prevention methods, perceptions and behaviours towards tick bite prevention, Lyme disease and other tick-borne diseases, including:
- knowledge of ticks, Lyme disease and other tick-borne diseases, including signs and symptoms;
- perception of risks and preventative measures for tick bites and tick-borne diseases;
- attitudes and behaviours towards taking action to reduce risks and/or change in lifestyle behaviours to avoid tick bites; and
- knowledge about pets in relation to tick bites and Lyme disease, and how people can be bitten and infected.
b. Gather information on how best to inform and communicate with populations in areas at risk of contracting Lyme disease, including:
- determine if the approach and possible messages are meaningful, relevant, credible and trigger a call to action;
- assess clarity and comprehensiveness of messages; and
- determine the best tactics to use so that education messages reaches the intended audience; and
- determine what new and emerging platforms Canadians are receptive to receiving information about Lyme disease.
Methodology
A 15-minute online survey was administered to 1,872 adults (Footnote 7) aged 18 and older who reside (at the time of the fieldwork) in areas of higher risk of Lyme disease and other tick-borne diseases (Footnote 8) and who spend time outdoors. More specifically, the survey proposed a minimum of n=500 respondents for the following target groups: parents of children under the age of 15, outdoor enthusiasts (Footnote 9), people with occupational exposure (Footnote 10), those living in rural areas (Footnote 11), and people with pets (a cat and/or a dog). Actual sample sizes for these groups were as follows: n=404 parents of children under 15, n=188 respondents with occupational exposure, n=560 who live in rural areas, and n=1,116 who have pets. (Footnote 12) This was a non-probability sample drawn from a commercial online panel; therefore, no inferences can be made to the greater population. The fieldwork was conducted August 4 to August 15, 2021. The data was weighted to ensure the survey sample is geographically proportionate to the areas in Canada targeted as being of higher risk of Lyme disease and other tick-borne diseases. More information on the methodology can be found in the Appendix: Technical Specifications.
Notes to Reader
- All results are expressed as percentages, unless otherwise noted. Throughout the report, percentages may not always add to 100 due to rounding and/or multiple responses being offered by respondents.
- At times, the number of respondents changes in the report because questions were asked of sub-samples of the survey population. Accordingly, readers should be aware of this and exercise caution when interpreting results based on smaller numbers of respondents.
- Where base sizes are reported in graphs, they reflect the actual number of respondents who were asked the question.
- Statistically significant subgroup differences are identified in the report. Subgroup reporting includes a variety of demographic and attitudinal variables.
- The results of significance tests establish the extent of relationships among variables but cannot be generalized to the population given the use of non-probability sampling. When reporting subgroup variations, only differences that are significant at the 95% confidence level and that pertain to a subgroup sample size of more than n=30 are discussed in the report. If one or more categories in a subgroup is not mentioned in a discussion of subgroup differences (for example, if two out of three age groups are compared), it can be assumed that significant differences were found only among the categories reported.
- The research instrument can be found in the Appendix along with more information about the technical specifications of research.
Detailed Findings
Awareness and general knowledge of Lyme disease and ticks
This section explores awareness and knowledge of Lyme disease and ticks.
Large majority have heard of Lyme disease
A large majority of respondents (89%) have heard of Lyme disease. More than half (53%) first learned about Lyme disease on the local news, two in five (40%) have discussed Lyme disease with friends and family, and one-quarter (24%) have searched on the Internet for information about Lyme disease. Following this, 18% mentioned social media, 16% their pet's veterinarian (Footnote 13), 15% a provincial government, 14% a pamphlet or handout, and 13% their doctor. The full list of sources can be found in figure 1. Respondents were presented with a list of potential sources; sources mentioned without prompting are identified in figure 1 by an asterisk.
Figure 1: Awareness of Lyme disease
[LEFT] Q10. Have you heard of Lyme disease?
Base: n= 1,872; all respondents. [NR: < 0.5%].
[RIGHT] Q11. Where did you hear about Lyme disease? [Multiple responses accepted].
Base: n= 1,670; respondents who have heard about Lyme disease.
| [LEFT] Q10. Have you heard of Lyme disease? | All respondents (n=1,872) |
|---|---|
Yes, I have heard of Lyme disease |
89% |
No, I have not heard of Lyme disease |
10% |
| [RIGHT] Q11. Where did you hear about Lyme disease? | Respondents who have heard about Lyme disease (n=1,670) |
|---|---|
| Local news | 53% |
| Friends or family | 40% |
| Internet search | 24% |
| Social media | 18% |
| My pet's veterinarian | 16% |
| Provincial government | 15% |
| A pamphlet or handout | 14% |
| My doctor | 13% |
| Advertisement | 11% |
| Municipal government | 8% |
| Federal government | 7% |
| Television | 1% |
| Work or school | 1% |
| Other media | 1% |
| Newspaper | 1% |
| Common knowledge | 1% |
| Book or magazine | <0.5% |
| Radio | <0.5% |
| I can't recall | 9% |
| Other | <0.5% |
Awareness of Lyme disease was higher among rural dwellers (94%), pet owners (91%), and outdoor enthusiasts (91%). Those at a higher risk of workplace exposure to ticks were less likely than those with no risk of exposure to be aware of Lyme disease (83% versus 90%). The same was true for parents—parents (81%) were less likely than those who do not have children (92%) to be aware of Lyme disease.
Awareness of Lyme disease was also higher among:
- Those who reside in Nova Scotia (97%), New Brunswick (99%) and Quebec (97%) compared to Ontario (87%), Manitoba (91%) and British Columbia (86%).
- Older respondents, particularly those 55 and over (94%).
- Those with high school (93%) or college (92%) as compared to a university degree (86%).
Visible minorities in the survey sample were less likely to be aware of Lyme disease (69% versus 95% of those who are not a visible minority).
Those from Nova Scotia (61%), New Brunswick (64%), Ontario (53%) and Manitoba (68%) were more likely to mention local news as compared to those from Quebec (50%) and British Columbia (45%). The likelihood of having heard about Lyme disease through local news increased with age, from 36% of 18- to 34-year-olds, to 60% of those aged 55+.
Other noteworthy differences included the following:
- Dog owners (35%) were more likely to have heard about Lyme disease from their pet's veterinarian compared to cat owners (20%).
- Outdoor enthusiasts were more likely to point to most sources, including local news (55%), friends or family (42%), and an Internet search (25%).
- Rural dwellers were more likely to have heard about Lyme disease from friends or family (45%).
Half know that Lyme disease is contracted through tick bites
Respondents were asked in an open-ended manner how they think people get Lyme disease. Half of those surveyed (51%) knew that Lyme disease is contracted through a tick bite. Similar responses included the following: from an infected tick (7%), from a deer tick bite (4%), from a black-legged tick bite (2%), from a tick burrowing into one's skin (1%), or from a wood tick bite (1%). In all, 65% of respondents correctly said that Lyme disease is contracted through a tick bite. In addition, 7% mentioned from being outdoors without protection, while small proportions incorrectly said from an insect bite (6%), from a mosquito bite (2%), or from animals (2%). Notably, one in five (20%) are unaware how people contract Lyme disease.
Figure 2: Knowledge of cause of Lyme disease
Q12. How do you think you get Lyme disease? [Multiple responses accepted].
Base: n=1,872; all respondents.
| Q12. How do you think you get Lyme disease? | All respondents (n=1,872) |
|---|---|
| From a tick bite | 51% |
| Being outdoors without protection (general) | 7% |
| From an infected tick | 7% |
| From an insect bite (unspecified) | 6% |
| From a deer tick bite | 4% |
| Lyme disease is serious / description of symptoms (general) | 2% |
| From a black-legged tick bite | 2% |
| From a mosquito bite | 2% |
| From animals | 2% |
| From a tick burrowing into your skin | 1% |
| From a wood tick bite | 1% |
| From the bacterium Borrelia burgdorferi | <0.5% |
| From a flea bite | <0.5% |
| I don't know | 20% |
| Other | 2% |
The following were more likely to correctly say Lyme disease is contracted from a tick bite:
- Pet owners (53%); this is particularly true among those who own a cat (54%).
- Outdoor enthusiasts who participate in outdoor activities more than 10 or more times per year (55%) compared to those who are not outdoor enthusiasts (47%).
- Those living in rural communities (58%).
- Those who reside in Nova Scotia (64%).
- Respondents aged 55+ (57%).
- Women (55%).
Conversely, parents were less likely than non-parents to say Lyme disease is contracted through a tick bite (42% versus 54%, respectively).
Those at risk of exposure to ticks via the workplace (31%) were less likely than their counterparts who are not at risk (53%) to say Lyme disease is contracted through a tick bite. Notably, those who may be exposed to ticks in the workplace were among those most likely to say they do not know how Lyme disease is contracted (29%).
Most are knowledgeable about where ticks can be found
The vast majority of respondents believe visiting an outdoor venue puts someone at risk of getting bitten by a tick (91%), even within urban and suburban areas (86%). Additionally, two-thirds of those surveyed believe that ticks can be found in their area (67%). Three in 10 (30%) do not think ticks are present in where they live. Recall that the target population is Canadians living in areas who reside in areas of higher risk of Lyme disease and other tick-borne diseases and who spend time outdoors.
Figure 3: Knowledge of where ticks are found
Q13. To the best of your knowledge:
Base: n= 1,872; all respondents. [NR: 2% each].
Q13. To the best of your knowledge: |
All respondents (n=1,872) |
|
|---|---|---|
| Yes | No | |
| Does visiting an outdoor venue put someone at risk of getting bitten by a tick? | 91% | 7% |
| Can ticks be found within urban and suburban areas? | 86% | 12% |
| Are ticks present in your area? | 67% | 30% |
Overall, outdoor enthusiasts, rural dwellers, and pet owners were generally more knowledgeable about where ticks are found. Outdoor enthusiasts and rural dwellers were more likely to believe that ticks can be found within urban and suburban areas (88% and 89%, respectively), are present in their area (71% and 82%, respectively), and that visiting an outdoor venue puts them at risk of tick bites (92% and 93%, respectively). Compared to those who do not own a pet, pet owners were more likely to know that ticks are present in their area (72%) and that visiting an outdoor venue puts them at risk of tick bites (92%).
Parents, on the other hand, were less likely to be knowledgeable when compared to their counterparts without children. Specifically, 87% of parents compared to 92% of non-parents said visiting an outdoor venue puts someone at risk of getting bitten by a tick. Moreover, 63% of parents (correctly) believe that ticks are present in their area versus 70% of non-parents who said the same.
In addition, knowledge increased with age, with those aged 55+ most likely to know where ticks can be found. Visible minorities were less likely than others to know that ticks are present in their area, that they can be found within urban as well as suburban areas, and that visiting an outdoor venue puts them at risk of getting bitten by a tick.
Nearly half believe they know what to do after a tick bite; in terms of actions, many would attempt to remove the tick themselves
Almost half (47%) of those surveyed said they would know what to do if they, or someone they know, is bitten by a tick. Those who said they would know what actions to take following a tick bite were asked in an open-ended manner to explain what they would do.
Two-thirds (66%) of respondents would use varying methods to remove the tick themselves if they or someone they know is bitten. Specifically: 27% would pull it off (unspecified), 25% would pull it with tweezers, 16% would remove it 'carefully' or 'slowly', 12% would remove it 'completely', and much smaller proportions would use liquid or heat to 'force the tick out' (2%) or to remove it by 'pinching' or 'twisting' it (2%). Following this, 45% volunteered that they would seek medical attention. Notably, four in 10 would seek medical attention and attempt to remove the tick themselves.
Others mentioned they would bag the tick for analysis (18%), clean or disinfect the area (unspecified) (10%), monitor the affected area (9%), get the individual with the tick bite tested or treated (8%), have the tick removed by a professional (5%), and attempt to identify the type of tick (1%). Five percent of respondents said they did not know what they would do if they or someone they know is bitten by a tick.
Figure 4: Knowledge of actions to take following a tick bite
[LEFT] Q14. Do you know what to do if you or someone you know is bitten by a tick?
Base: n= 1,872; all respondents. [NR: <0.5%].
[RIGHT] Q15. What would you do if you or someone you know is bitten by a tick? [Multiple responses accepted].
Base: n= 889; respondents who report knowing what to do following a tick bite.
| [LEFT] Q14. Do you know what to do if you or someone you know is bitten by a tick? | All respondents (n=1,872) |
|---|---|
| Yes, I know what to do following a tick bite | 47% |
| No, I do not know what to do following a tick bite | 52% |
| [RIGHT] Q15. What would you do if you or someone you know is bitten by a tick? | Respondents who report knowing what to do following a tick bite (n=889) |
|---|---|
| Seek medical attention | 45% |
| Remove the tick / pull it off (general) | 27% |
| Remove the tick with tweezers | 25% |
| Bag the tick / keep it for analysis | 18% |
| Carefully / slowly remove the tick | 16% |
| Completely remove the tick | 12% |
| Clean / disinfect the area (general) | 10% |
| Monitor the area | 9% |
| Get the person tested / seek treatment | 8% |
| Have the tick removed by a professional | 5% |
| Force the tick out using liquid or heat | 2% |
| Remove the tick by pinching / twisting | 2% |
| Identify the type of tick | 1% |
| I don't know | 5% |
| Other | 3% |
Respondents who live in a rural area (59%) and those who are outdoor enthusiasts (49%) were among those most likely to say they would know what to do it they or someone they know is bitten by a tick. Those living in British Columbia were among the least knowledgeable about what to do following a tick bite—65% indicated that they would not know what to do in this situation. Self-assessed knowledge increased with age, from 39% of 18- to 34-year-olds saying they would know what to do, to 53% of those aged 55+.
The likelihood of saying they would seek medical attention if bitten by a tick was higher among British Columbians (60%). Compared to parents and those at risk of exposure to ticks in their workplace, rural dwellers (29%), pet owners (27%), and outdoor enthusiasts (27%) were more likely to say, that if bitten by a tick, they would remove the tick / pull it off.
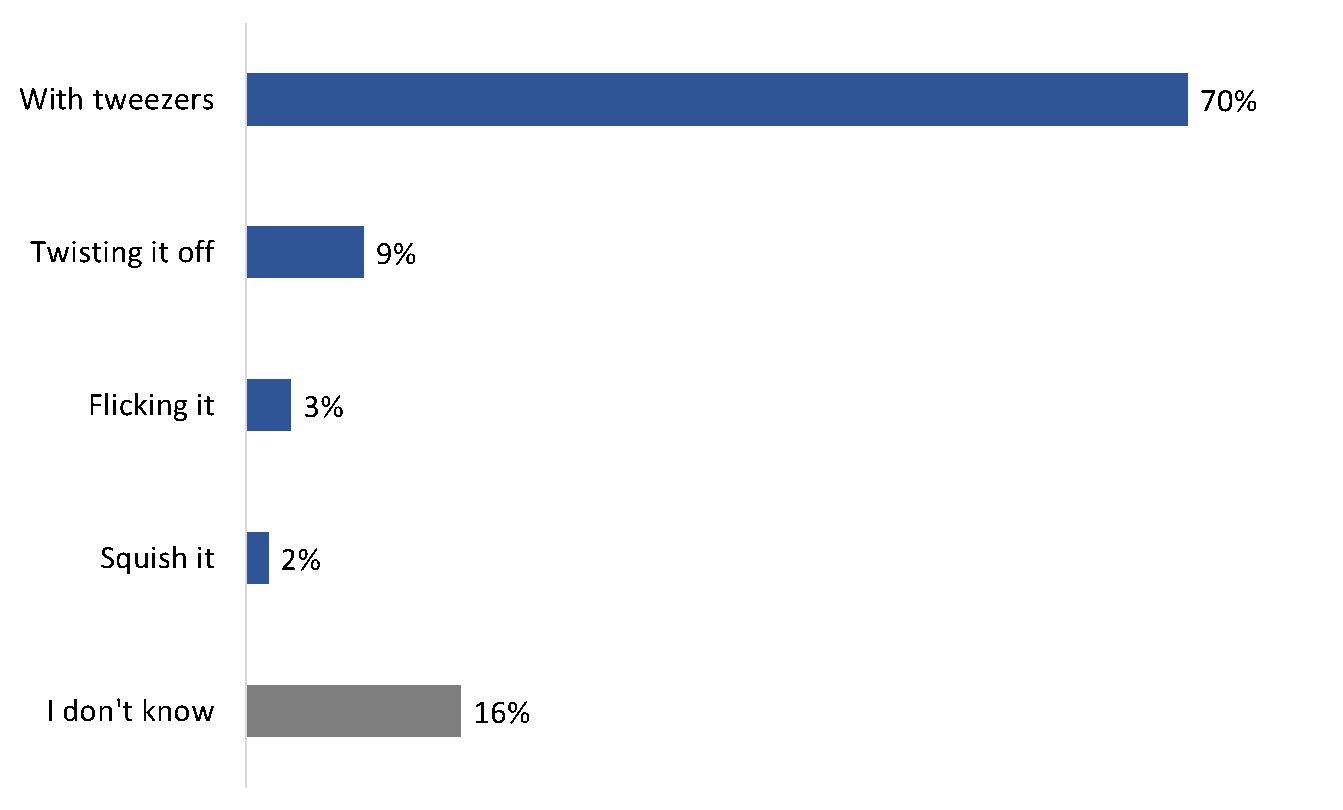
7 in 10 know it is best to remove a tick with tweezers
When asked what they think the best method is to remove a tick attached to their skin or someone else's skin, 70% said to do so with tweezers. Fewer thought that twisting (9%), flicking (3%), or squishing (2%) the tick were the best removal methods.
Figure 5: Knowledge of how best to remove a tick
Q16. What do you think is the best way to remove a tick attached to your skin or someone else's skin?
Base: n=1,872; all respondents.
| Q16. What do you think is the best way to remove a tick attached to your skin or someone else's skin? | All respondents (n=1,872) |
|---|---|
| With tweezers | 70% |
| Twisting it off | 9% |
| Flicking it | 3% |
| Squish it | 2% |
| I don't know | 16% |
The following were more likely to say that using tweezers is the best way to remove a tick:
- Respondents living in New Brunswick (84%) and Nova Scotia (83%).
- Rural dwellers (77%).
- Those aged 55 and older (75%).
- Non-parents (72%) as opposed to parents (62%).
- Outdoor enthusiasts (71%) – particularly among outdoor enthusiasts who are active outdoors more than 10 or more times per year (73%).
The following were more likely to say they do not know the best way to remove a tick: respondents living in British Columbia (20%) and Ontario (18%), those aged 35 to 54 (20%) compared to those aged 55+ (13%), respondents who completed a university degree (19%), and visible minorities
No clear consensus on symptoms and signs of Lyme disease
When asked to select from a list the common symptoms of Lyme disease, half or more correctly pointed to fatigue (59%), muscle aches (58%) and joint pain (51%), as well as fever (50%). Close to half (47%) mentioned a rash followed by 42% who indicated that a headache is a common symptom of Lyme disease. Smaller proportions incorrectly said that vomiting (17%) and coughing (9%) are symptoms associated with Lyme disease. Nearly one-quarter (23%) could not identify any common symptoms of Lyme disease.
Most respondents did not know how long it takes for the symptoms associated with Lyme disease typically to appear after a tick bite. A significant minority (45%) volunteered that they did not know when to expect symptoms to appear while almost one-third incorrectly said within the same day (9%), one to two days later (18%), two to 12 months later (4%), or more than a year after the bite (1%). One-quarter (24%) knew that symptoms associated with Lyme disease typically appear three to 30 days following exposure.
Figure 6: Knowledge of Lyme disease and symptoms
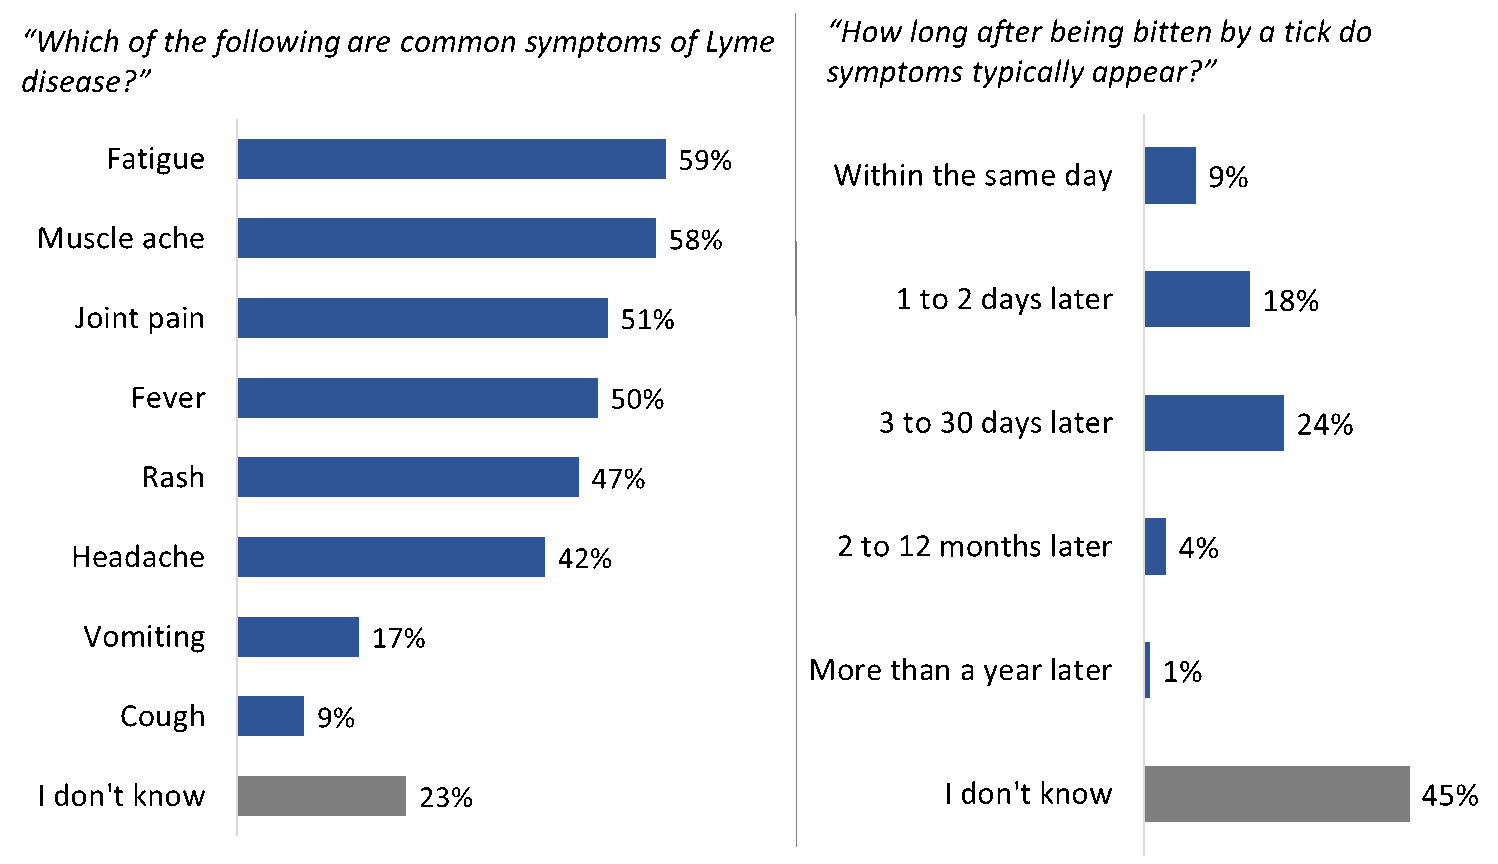
[LEFT] Q17. To the best of your knowledge, which of the following are common symptoms associated with Lyme disease? [Multiple responses accepted].
Base: n= 1,872; all respondents.
[RIGHT] Q18. How long after being bitten by a tick do symptoms associated with Lyme disease typically appear?
Base: n= 1,872; all respondents.
| [LEFT] Q17. To the best of your knowledge, which of the following are common symptoms associated with Lyme disease? | All respondents (n=1,872) |
|---|---|
| Fatigue | 59% |
| Muscle ache | 58% |
| Joint pain | 51% |
| Fever | 50% |
| Rash | 47% |
| Headache | 42% |
| Vomiting | 17% |
| Cough | 9% |
| I don't know | 23% |
| [RIGHT] Q18. How long after being bitten by a tick do symptoms associated with Lyme disease typically appear? | All respondents (n=1,872) |
|---|---|
| Within the same day | 9% |
| 1 to 2 days later | 18% |
| 3 to 30 days later | 24% |
| 2 to 12 months later | 4% |
| More than a year later | 1% |
| I don't know | 45% |
Knowledge of the common symptoms of Lyme disease did not vary much by target population, with one exception—outdoor enthusiasts. Compared to those who do not regularly engage in outdoor activities, outdoor enthusiasts were more likely to identify the following as symptoms associated with Lyme disease:
- Fatigue: 60%
- Muscle aches: 59%
- Joint pain: 53%
- Fever: 51%
- Rash: 48%
- Headache: 44%
The likelihood of correctly indicating that symptoms of Lyme disease typically appear within three to 30 days was higher among dog owners (26% versus 22% of those who do not own a pet), outdoor enthusiasts (25%), those living in Nova Scotia (34%), those who completed a university degree (29%), and those who are not a visible minority (25%).
Perceptions of Risk
This section presents respondents' views of the perceived risk of Lyme disease and other tick-borne diseases.
Two-thirds are at least moderately concerned about Lyme disease
The majority of respondents are concerned to some extent about contracting Lyme disease or other tick-borne diseases. Approximately one in five (19%) are very concerned that they or members of their immediate family might get Lyme disease or other tick-borne diseases and nearly half (48%) are moderately concerned about this. In contrast, one-quarter (25%) are not very concerned about contacting these diseases, and 6% are not at all concerned.
Figure 7: Level of concern about contracting Lyme disease
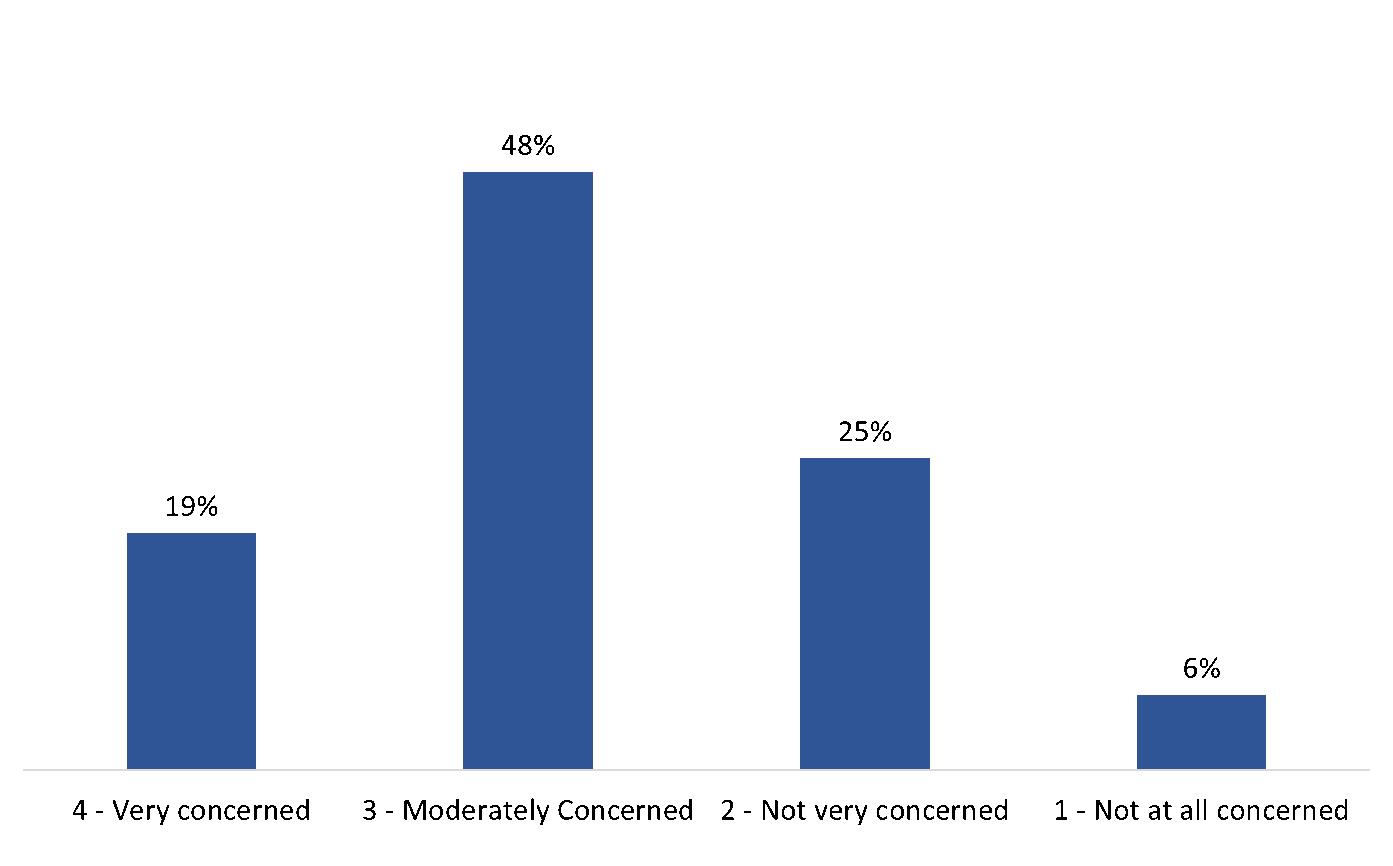
Q19. How concerned are you that you, or members of your immediate family, might get Lyme disease or other tick-borne diseases?
Base: n=1,872; all respondents. [NR: 1%].
| Q19. How concerned are you that you, or members of your immediate family, might get Lyme disease or other tick-borne diseases? | All respondents (n=1,872) |
|---|---|
| Very concerned | 19% |
| Moderately concerned | 48% |
| Not very concerned | 25% |
| Not at all concerned | 6% |
Concern about contracting Lyme disease or other tick-borne diseases was higher among those at risk of workplace exposure (76%), parents (75%), dog owners (74%), and outdoor enthusiasts (69%), as well as those residing in Nova Scotia (76%), New Brunswick (77%), Quebec (66%), and Ontario (71%) compared to Manitoba (62%) and British Columbia (56%). Notice that concern is higher among two of the populations—parents and those at risk of workplace exposure—that are less likely to be knowledgeable about ticks and prevention.
9 in 10 view Lyme disease and other tick-borne diseases as an important issue for Canadians
The vast majority of respondents (91%) believe Lyme disease and other tick-borne diseases is an important issue to Canadians. Among them, 45% said, in their view, this is a very important issue to Canadians. In contrast, few respondents (8%) hold the opinion that Lyme disease and other tick-borne diseases is not very or not at all important.
Figure 8: Perceived importance of Lyme disease and tick-borne diseases
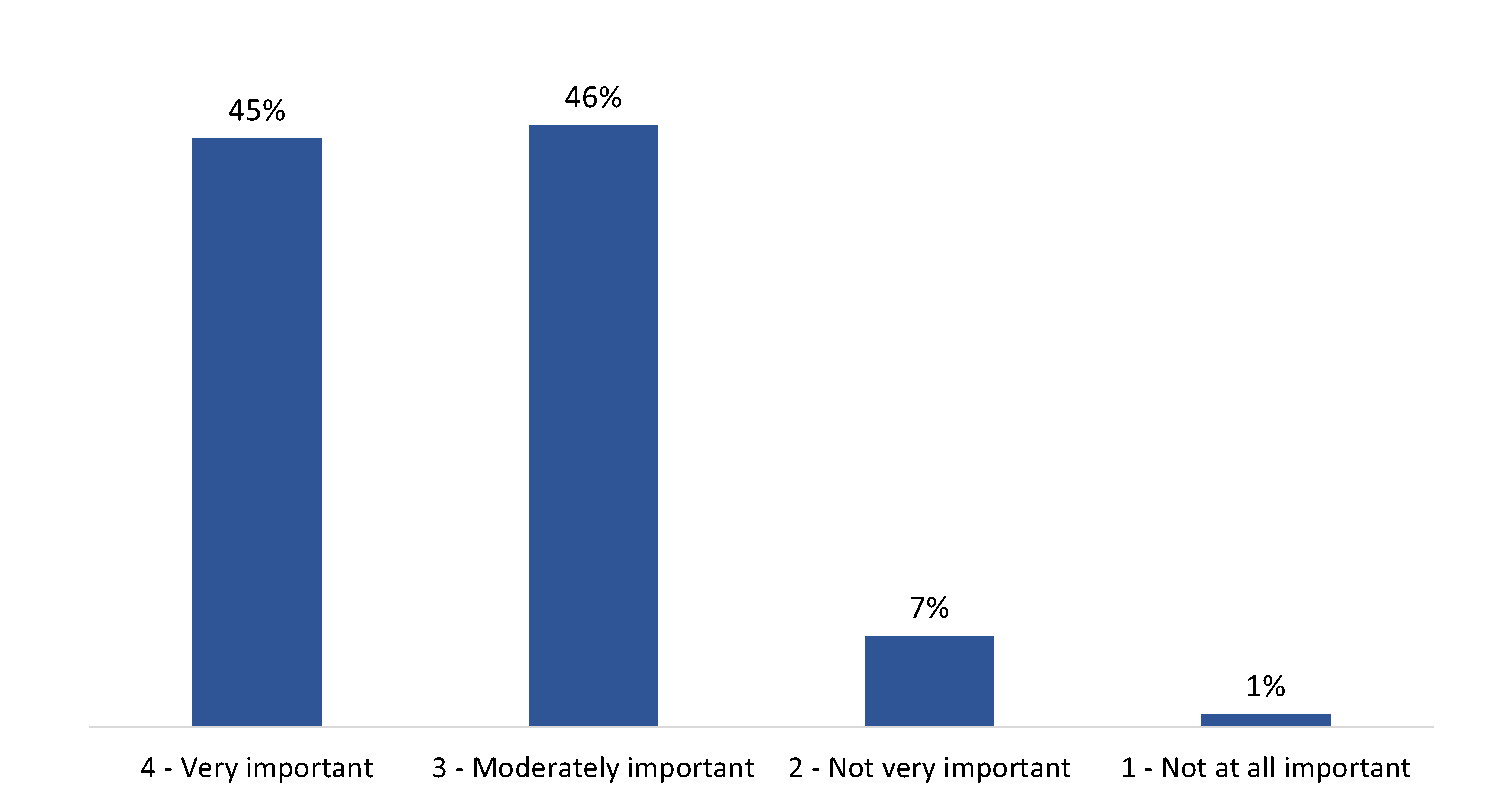
Q20. In your view, how important of an issue is Lyme disease and other tick-borne diseases to Canadians?
Base: n= 1,872; all respondents. [NR: 1%].
| Q20. In your view, how important of an issue is Lyme disease and other tick-borne diseases to Canadians? | All respondents (n=1,872) |
|---|---|
| Very important | 45% |
| Moderately important | 46% |
| Not very important | 7% |
| Not at all important | 1% |
Respondents who live in rural settings were more likely to say that Lyme disease and other tick-borne diseases is an important topic of discussion for Canadians (94%). In addition, those from British Columbia (87%) were less likely than those living in Nova Scotia (95%), New Brunswick (96%), Ontario (92%) or Manitoba (93%) to consider Lyme disease and other tick-borne diseases to be an important issue to Canadians. The likelihood of attributing importance to this issue was higher among less-educated respondents (94% of those with high school or less versus 90% of those who completed college or university).
Many say Lyme disease does not get enough attention
Based on what they have read, seen, or heard recently, six in 10 (60%) believe that Lyme disease does not receive enough attention. Conversely, 3% of respondents feel it receives too much attention. The rest said Lyme disease receives about the right amount of attention (28%) or did not know how to rate the level of attention given to Lyme disease (10%).
Figure 9: Level of attention given to Lyme disease
Q21. Based on what you may have seen, read or heard recently, does Lyme disease…
Base: n=1,872; all respondents.
| Q21. Based on what you may have seen, read or heard recently, does Lyme disease… | All respondents (n=1,872) |
|---|---|
| Receive too much attention | 3% |
| Receive about the right amount of attention | 28% |
| Receive not enough attention | 60% |
| I don't know | 10% |
The following groups were more likely to say Lyme disease does not receive enough attention:
- Outdoor enthusiasts (62%).
- Those living in rural areas (65%).
- Respondents aged 55+ (66%; the likelihood of saying this increased with age).
- Women (64%).
- Those from New Brunswick (74%).
Visible minorities (55%), parents (52%), and those at risk of workplace exposure (47%) were less likely than their counterparts to say that Lyme disease does not receive enough attention based on what they have seen, read or heard recently.
Preventative Measures
This section describes respondents' knowledge of measures than can be taken to prevent tick bites.
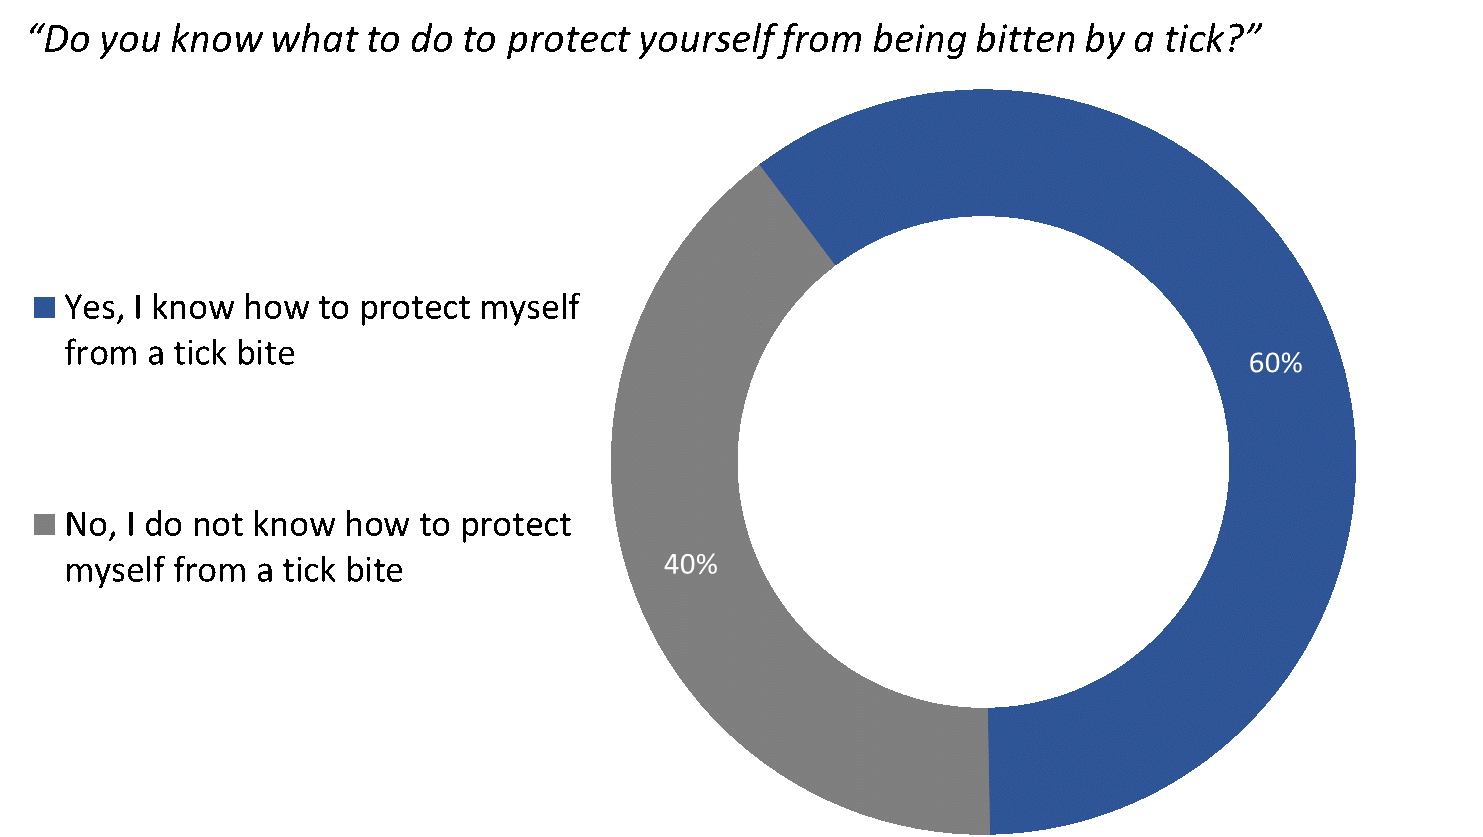
Many think they know how to protect themselves from being bitten by a tick.
Six in 10 respondents (60%) said they know how to help protect themselves from being bitten by a tick. Four in 10 (40%) do not know how to protect themselves from a tick bite.
Figure 10: Protecting yourself from tick bites
Q22. Do you know what to do to help protect yourself from being bitten by a tick?
Base: n=1,872; all respondents.
| Q22. Do you know what to do to help protect yourself from being bitten by a tick? | All respondents (n=1,872) |
|---|---|
Yes, I know how to protect myself from a tick bite |
60% |
No, I do not know how to protect myself from a tick bite |
40% |
The following were more likely to say they know how to help protect themselves from being bitten by a tick: rural dwellers (68%), those aged 55 and older (66%), outdoor enthusiasts (61%), and pet owners (60%). Conversely, those at risk of workplace exposure (57%), parents (53%), and visible minorities (40%) were less likely than their counterparts to say they know how to protect themselves. Additionally, when comparing results geographically, those in British Columbia (50%), followed by Ontario (57%), were the least likely to know how to protect themselves from being bitten by a tick.
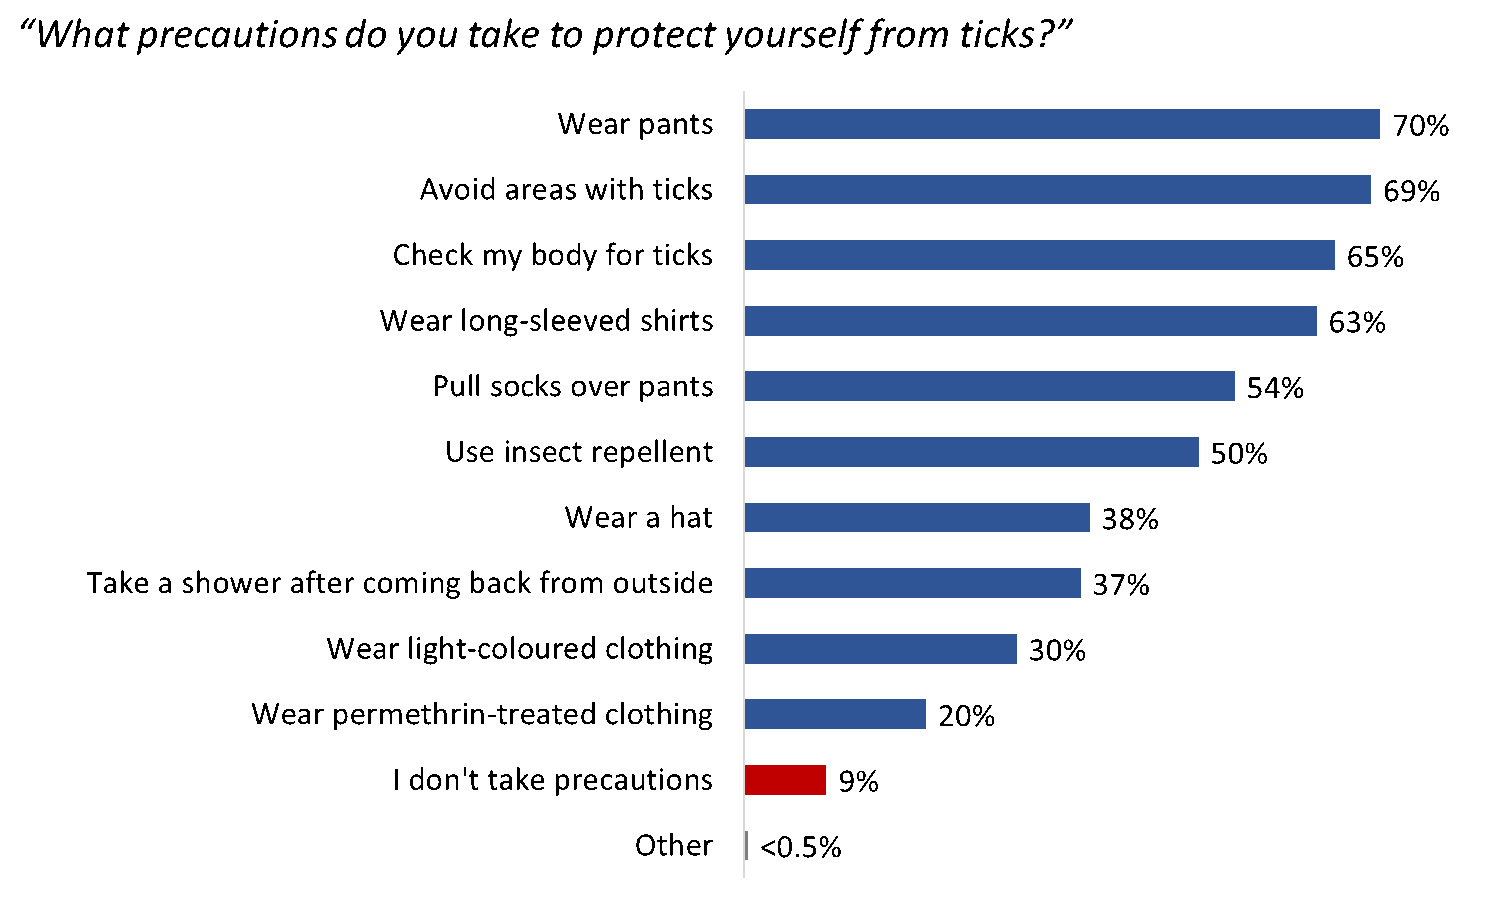
Long pants and avoiding tick-heavy areas are the most common preventative measures
Approximately nine in 10 respondents identified at least one precaution they take to protect themselves from tick bites. The preventative measures most frequently mentioned include wearing pants (70%), avoiding areas with ticks (69%), checking their body for ticks (65%), and wearing long-sleeved shirts (63%). Following these measures, 54% said they pull their socks over their pants and exactly half (50%) use insect repellent to deter ticks. Smaller proportions wear a hat (38%), take a shower after coming back from outside (37%), and wear light-coloured (30%) or permethrin-treated (20%) clothing.
Figure 11: Measures taken to prevent tick bites
Q23. What precautions, if any, do you take to protect yourself from ticks? [Multiple responses accepted].
Base: n=1,872; all respondents. [NR: 1%].
| Q23. What precautions, if any, do you take to protect yourself from ticks? [Multiple responses accepted]. | All respondents (n=1,872) |
|---|---|
| Wear pants | 70% |
| Avoid areas with ticks | 69% |
| Check my body for ticks | 65% |
| Wear long-sleeved shirts | 63% |
| Pull socks over pants | 54% |
| Use insect repellent | 50% |
| Wear a hat | 38% |
| Take a shower after coming back from outside | 37% |
| Wear light-coloured clothing | 30% |
| Wear permethrin-treated clothing | 20% |
| I don't take precautions | 9% |
| Other | <0.5% |
Parents were less likely than their counterparts without children to wear pants (62%), to avoid areas with ticks (62%), to check their body for ticks (58%), and to wear long-sleeved shirts (56%) in an effort to protect themselves from ticks. The same was true of those at risk of workplace exposure to ticks—they were less likely than those not at risk to say they take many of these precautions.
Compared to those who do not own a pet, pet owners were more likely to say they wear pants (72%), long-sleeved shirts (65%), and hats (40%), as well as take a shower after coming back from outside (39%). The likelihood of taking all of these precautions was higher among outdoor enthusiasts than their counterparts who do not take part in outdoor activities on a regular basis each year.
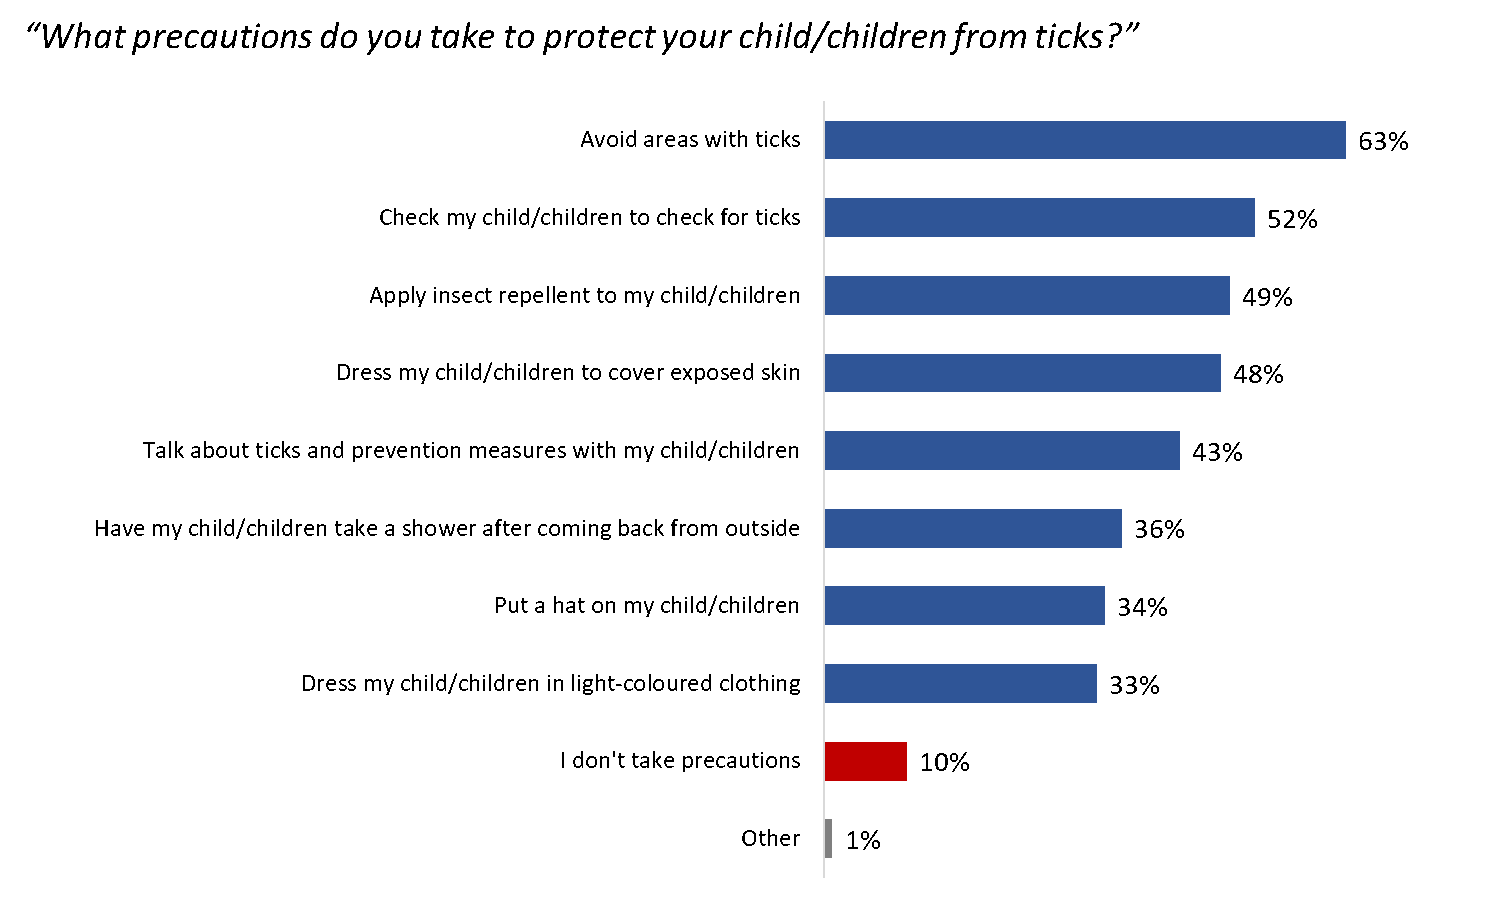
Most parents and guardians take precautions to protect their children from ticks
Parents and guardians of children aged 14 and under protect their child/children from ticks by avoiding tick-heavy areas (63%), checking them for ticks (52%), applying insect repellent (49%), dressing them to cover exposed skin (48%), and talking with them about ticks and preventative measures (43%). Approximately one-third said they have their child/children shower after coming back from outside (36%), put a hat on their child/children (34%), and dress their child/children in light-coloured clothing.
Figure 12: Measures taken to prevent tick bites in children
Q24. What precautions, if any, do you take to protect your child/children from ticks? [Multiple responses accepted].
Base: n=404; parents and guardians of children under 15. [NR: 1%].
| Q24. What precautions, if any, do you take to protect your child/children from ticks? | Parents and guardians of children under 15 (n=404) |
|---|---|
| Avoid areas with ticks | 63% |
| Check my child/children to check for ticks | 52% |
| Apply insect repellent to my child/children | 49% |
| Dress my child/children to cover exposed skin | 48% |
| Talk about ticks and prevention measures with my child/children | 43% |
| Have my child/children take a shower after coming back from outside | 36% |
| Put a hat on my child/children | 34% |
| Dress my child/children in light-coloured clothing | 33% |
| I don't take precautions | 10% |
| Other | 1% |
Parents who are outdoor enthusiasts and/or who live in rural areas were more likely than parents who do not do outdoor activities regularly and/or who live in urban areas to say they do the following: check or remind their child/children to check themselves for ticks (55% and 67%, respectively) and talk about ticks and prevention measures with their child/children (45% and 58%, respectively).
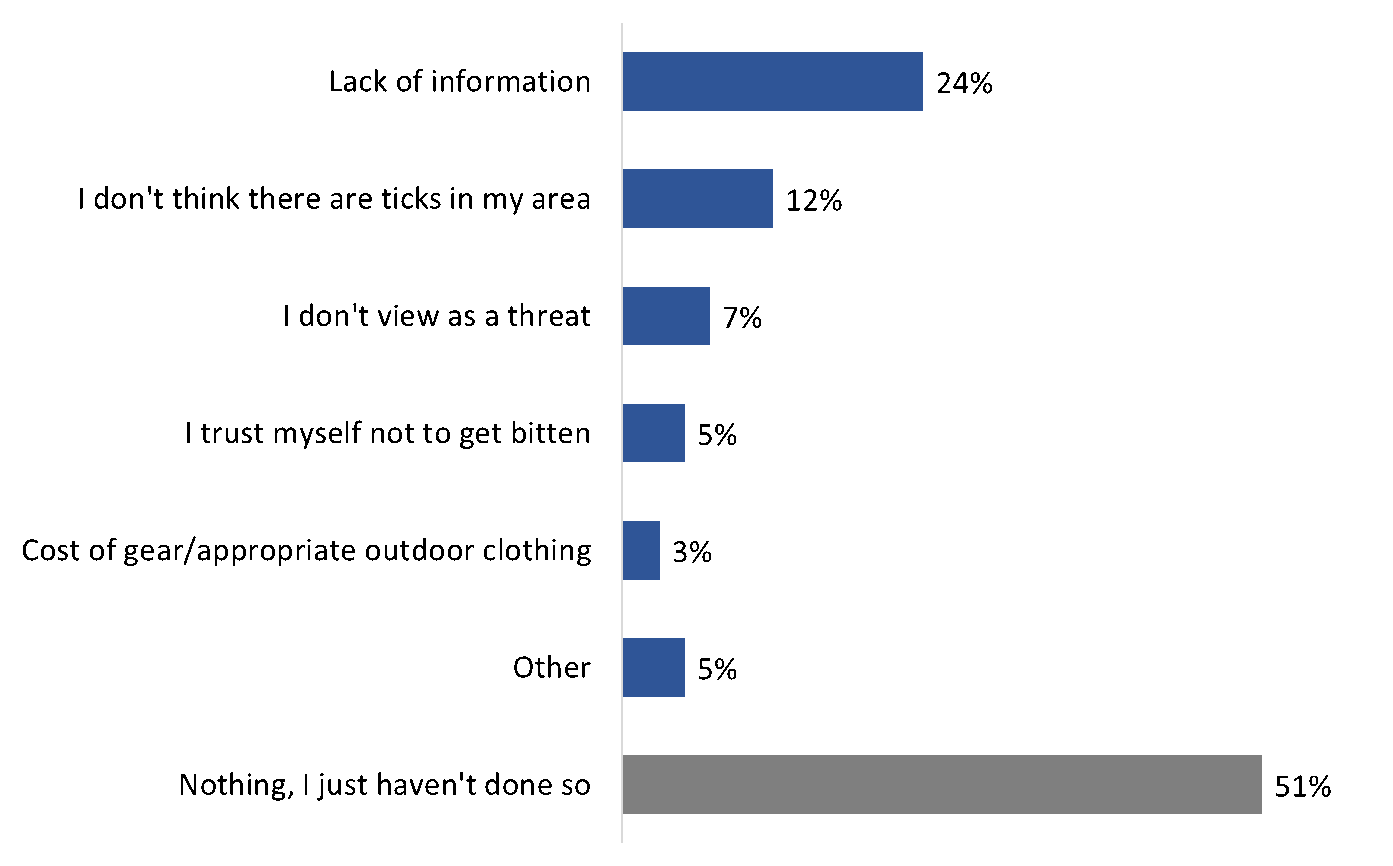
Few barriers to taking action; many simply do not take preventative measures
Respondents who indicated they do not take precautions to prevent tick bites were asked why they do not do so. Half (51%) said there is no reason—they simply have not done anything to reduce the chance of being bitten by a tick. Those who pointed to specific reasons, or barriers, noted a lack of information (24%) and the cost of purchasing appropriate outdoor clothing (3%). Others said they do not think there are ticks where they live (12%), do not view ticks as a threat (7%), or trust themselves not to get bitten (5%).
Figure 13: Barriers to taking precautions to reduce the chance of tick bites
Q25. What is stopping you from taking precautions to reduce the chance of being bitten by a tick? [Multiple responses accepted].
Base: n=163; respondents who don't take precautions to prevent tick bites.
| Q25. What is stopping you from taking precautions to reduce the chance of being bitten by a tick? | Respondents who don't take precautions to prevent tick bites (n=163) |
|---|---|
| Lack of information | 24% |
| I don't think there are ticks in my area | 12% |
| I don't view as a threat | 7% |
| I trust myself not to get bitten | 5% |
| Cost of gear/appropriate outdoor clothing | 3% |
| Other | 5% |
| Nothing, I just haven't done so | 51% |
There are no noteworthy differences by target population nor by demographic subgroup.
Many who use insect repellent use DEET and apply to their legs, arms, and neck
Among those who use insect repellent to prevent tick bites, 62% said they use DEET. Following at a distance, 19% use chemical free (Footnote 14) / natural repellents, 15% use wearable devices, such as wristbands, stickers, and clip-on foggers, and 12% use candles or torches. A variety of other types of insect repellents were reported by fewer than one in 10 respondents and are identified in figure 14.
Those who use insect repellents that are applied to their body (DEET, chemical free repellents, or Icaridin) apply these repellents to their legs (89%), arms (87%), and neck (77%), followed by their hands (67%), feet (58%), clothing (56%), face (45%), and hair (30%).
Figure 14: Use of insect repellent
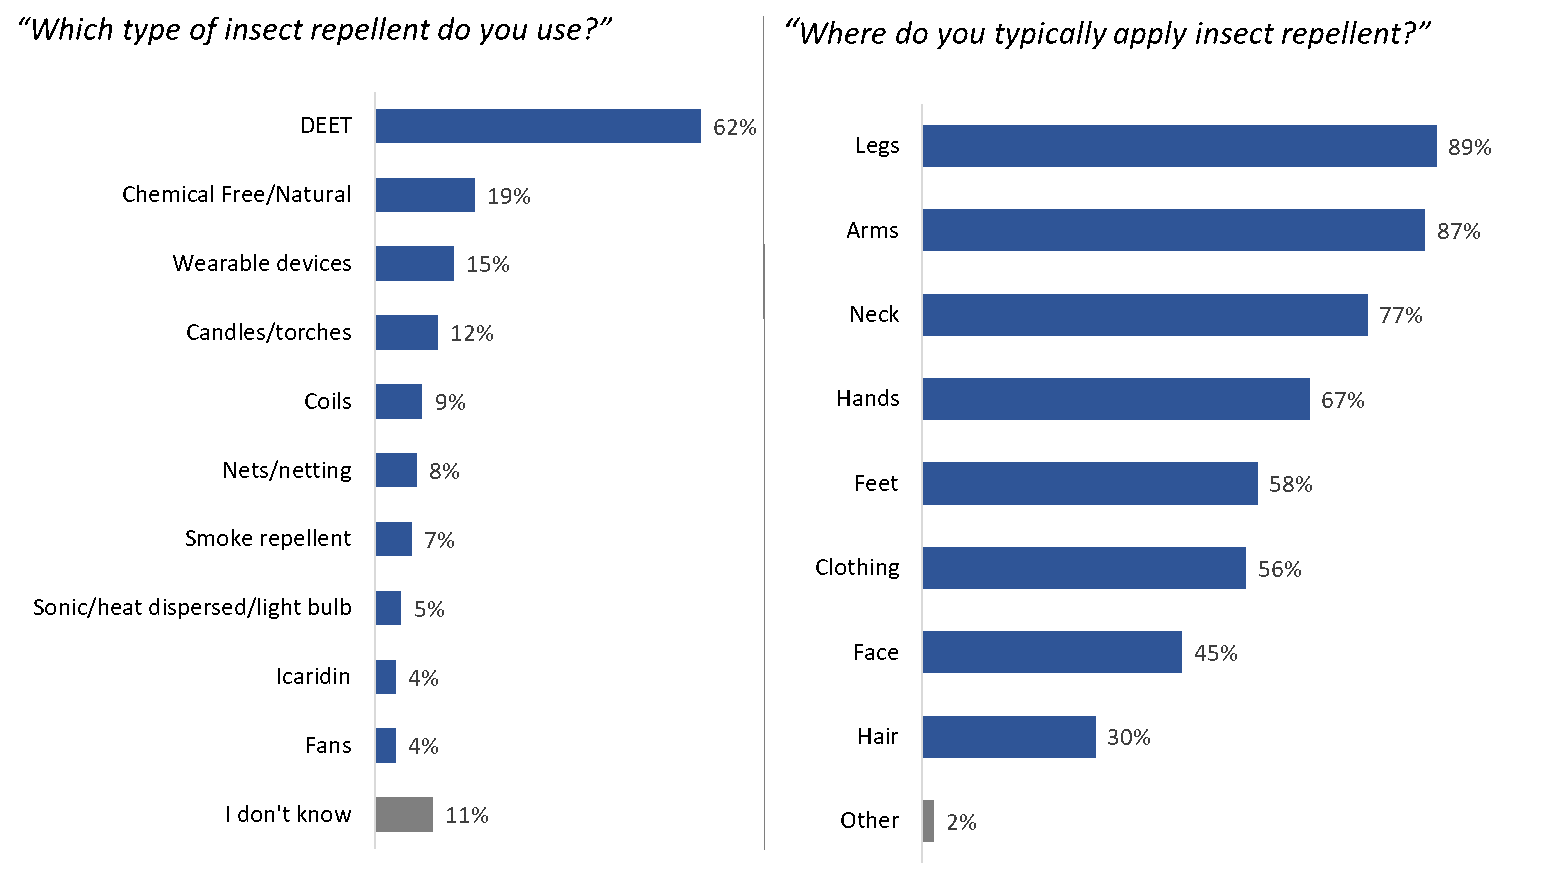
[LEFT] Q26. Which type of insect repellent do you typically use? [Multiple responses accepted].
Base: n=984; respondents who use insect repellent to prevent tick bites.
[RIGHT] Q27. Where do you usually apply insect repellent? [Multiple responses accepted].
Base: n=761; respondents who apply insect repellent. [NR: <0.5%].
| [LEFT] Q26. Which type of insect repellent do you typically use? | Respondents who use insect repellent to prevent tick bites (n=984) |
|---|---|
| DEET | 62% |
| Chemical Free/Natural | 19% |
| Wearable devices | 15% |
| Candles/torches | 12% |
| Coils | 9% |
| Nets/netting | 8% |
| Smoke repellent | 7% |
| Sonic/heat dispersed/light bulb | 5% |
| Icaridin | 4% |
| Fans | 4% |
| I don't know | 11% |
| [RIGHT] Q27. Where do you usually apply insect repellent? | Respondents who apply insect repellent (n=761) |
|---|---|
| Legs | 89% |
| Arms | 87% |
| Neck | 77% |
| Hands | 67% |
| Feet | 58% |
| Clothing | 56% |
| Face | 45% |
| Hair | 30% |
| Other | 2% |
Those who are not parents of children under 15 years of age were more likely to report using DEET (67% versus 50% of parents). Parents, instead, were more likely to say they use chemical free or wearable devices (31% and 29%, respectively). Additionally, use of DEET was higher among outdoor enthusiasts (64%) and rural dwellers (74%), and its use increased with age, from 41% of those 18 to 34 years of age, to 72% of those aged 55+. Visible minorities were more likely to say they use chemical free or wearable devices (31% and 22%, respectively).
The likelihood of applying insect repellent to one's clothing was higher among those living in Nova Scotia (76%) or New Brunswick (72%), as well as among women (60%), pet owners (60%), and rural dwellers (64%).
Half who check their body for ticks do so always or often
Among those who said they check their body and/or their child/children for ticks as a precaution (n=1,283), 28% do so always and 30% do so often after spending time outdoors. One in three (29%) typically check for ticks some of the time. The rest (10%) said they only check for ticks when doing certain types of activities.
Figure 15: Frequency of checking for ticks
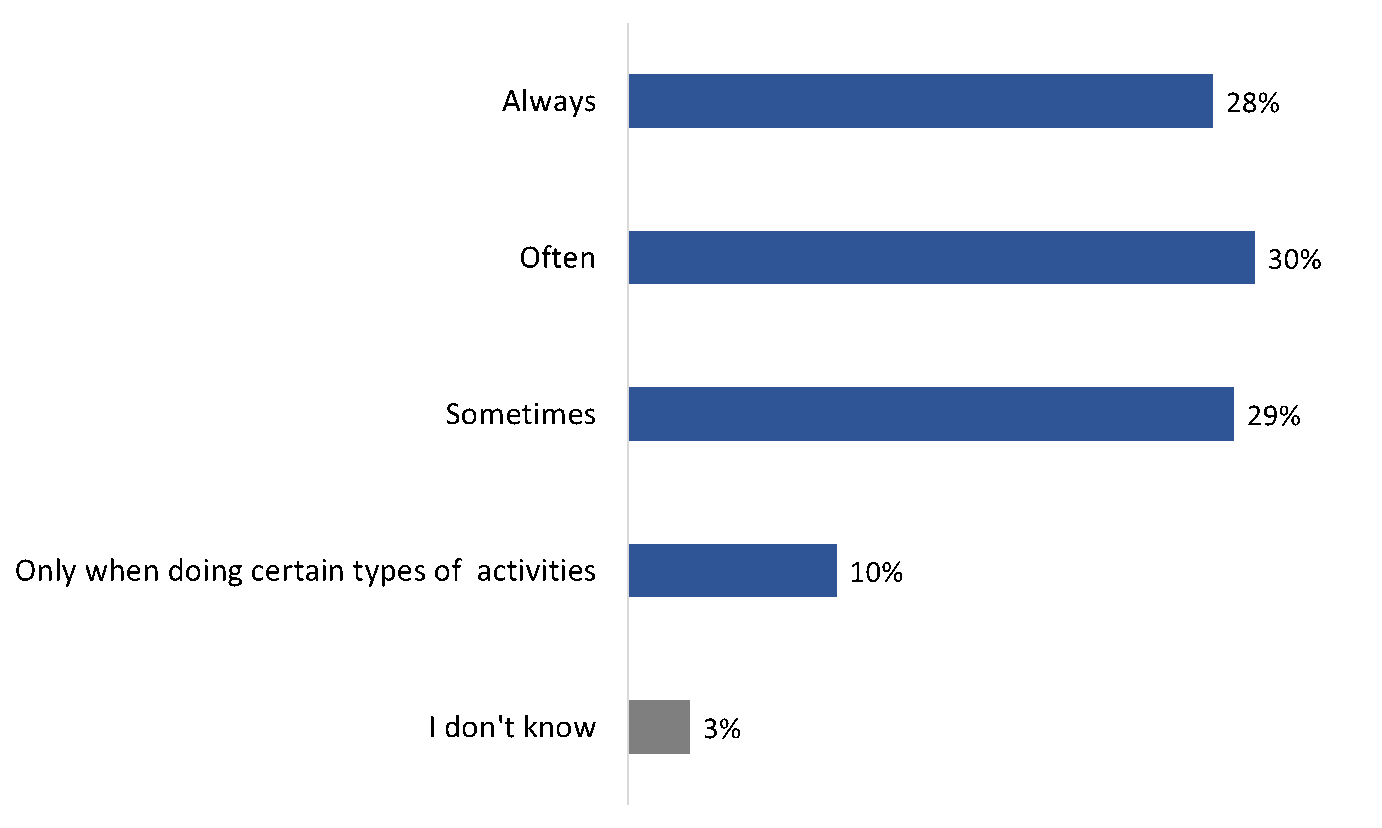
Q28. You mentioned that you check for ticks as a precaution. How often do you typically do this after spending time outdoors?
Base: n=1,283; those who check their themselves/their children for ticks.
| Q28. You mentioned that you check for ticks as a precaution. How often do you typically do this after spending time outdoors? | Those who check themselves/their children for ticks (n=1,283) |
|---|---|
| Always | 28% |
| Often | 30% |
| Sometimes | 29% |
| Only when doing certain types of activities | 10% |
| I don't know | 3% |
Dog owners (31%) were more likely than non-pet owners (25%) to say they always check for ticks as a precaution.
More than half are aware of the potential risk of tick bites when travelling outside of their area of residence
Fifty-seven percent of respondents claimed to be aware of the potential risk of ticks and tick-borne diseases when travelling outside of their area of residence for an outdoor activity, such as hiking or camping. Specifically, 15% said they are very aware and 42% viewed themselves as moderately aware. Conversely, a sizeable minority are not very (31%) or not at all (11%) aware of these risks in the areas they are travelling to.
Figure 16: Awareness of potential risk of ticks and tick-borne diseases
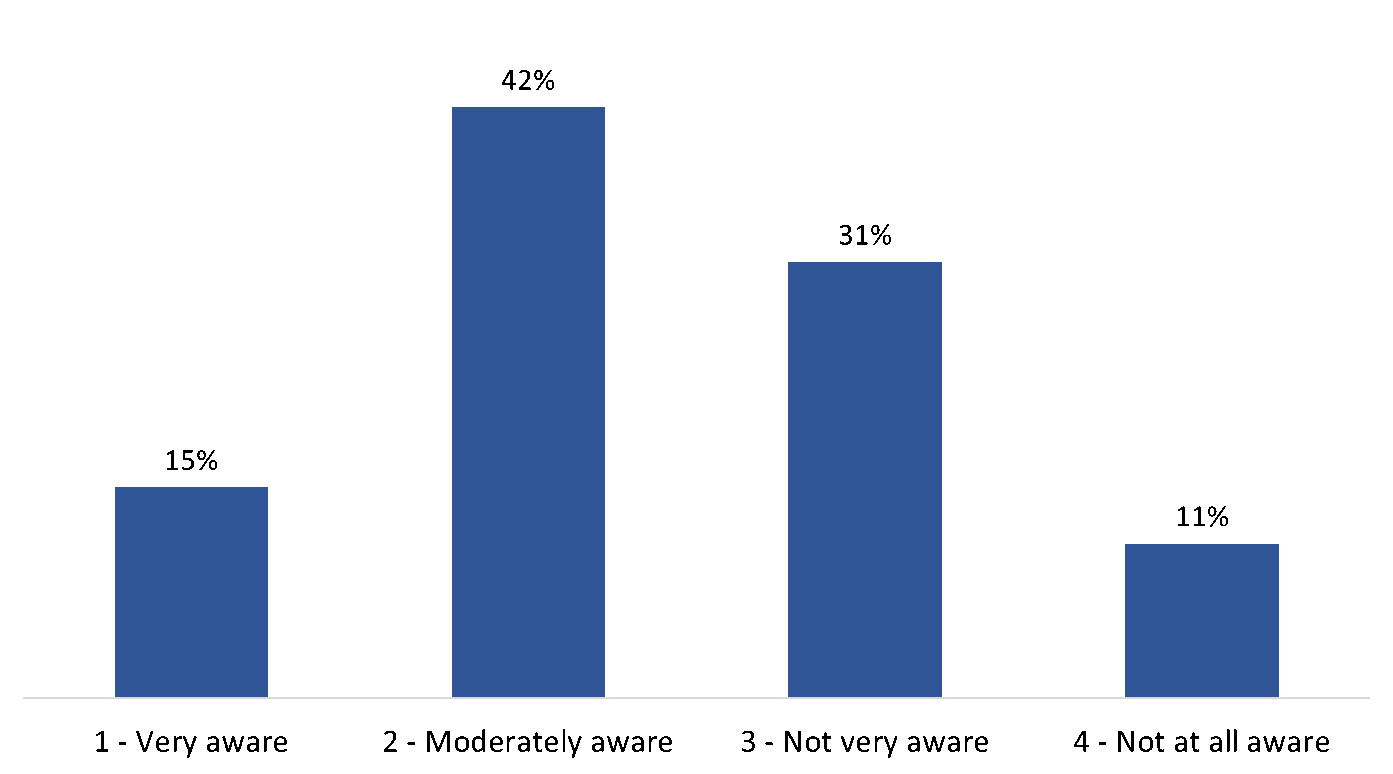
Q29. When travelling outside of your area of residence for an outdoor activity such as hiking or camping, how aware are you of the potential risk of ticks and tick-borne diseases in the area you are travelling to?
Base: n= 1,872; all respondents. [NR: 1%].
| Q29. When travelling outside of your area of residence for an outdoor activity such as hiking or camping, how aware are you of the potential risk of ticks and tick-borne diseases in the area you are travelling to? | All respondents (n=1,872) |
|---|---|
| Very aware | 15% |
| Moderately aware | 42% |
| Not very aware | 31% |
| Not at all aware | 11% |
Pet owners (60%) were more likely than those who do not own a pet (52%) to say they are aware of the risk of ticks and tick-borne diseases in the areas they are travelling to. Awareness also was higher among outdoor enthusiasts who engage in these types of activities 10+ times a year (59% versus 53% of outdoor enthusiasts who do these activities less frequently) and among those at risk of exposure in their workplace (64% versus 56% of those who are not at risk). Regionally, awareness was higher among respondents from Nova Scotia (73%) and Manitoba (68%) as compared to those from New Brunswick (54%), Ontario (57%), and British Columbia (48%).
Most live in a home that requires exterior maintenance; among them, more than half have taken preventative measures
More than three-quarters (77%) of those surveyed said they live in a home that requires them to maintain the exterior of their property—for example, a yard, garden, or balcony. Among these respondents, 56% have taken preventative measures to reduce ticks on their property, while 41% have not done so. Recall that just over half of survey respondents are aged 55 or older, three in 10 live in small population centres or rural areas, and many are pet owners. This may explain, in part, the high proportion of respondents who reported living in a home with an exterior that requires maintenance.
Figure 17: Maintenance of exterior of property
[LEFT] Q30. Do you live in a home that requires you to maintain the exterior of the property (e.g., a yard, garden, balcony, etc.)?
Base: n= 1,872; all respondents. [NR: 1%].
[RIGHT] Q31. Have you ever taken preventative measures to reduce ticks on your property? This could include things like mowing the lawn frequently, raking leaves, or using insect controls.
Base: n= 1,452; respondents who maintain the exterior of their property. [NR: 3%].
| [LEFT] Q30. Do you live in a home that requires you to maintain the exterior of the property (e.g., a yard, garden, balcony, etc.)? | All respondents (n=1,872) |
|---|---|
| Yes, I need to maintain the exterior | 77% |
| No, I do not need to maintain the exterior | 22% |
| [RIGHT] Q31. Have you ever taken preventative measures to reduce ticks on your property? This could include things like mowing the lawn frequently, raking leaves, or using insect controls. | Respondents who maintain the exterior of their property (n=1,452) |
|---|---|
| Yes, I have taken preventative measures | 56% |
| No, I have not taken preventative measures | 41% |
Rural dwellers (84%), outdoor enthusiasts (82%), and pet owners (80%) were more likely than their counterparts to have said they live in a home that requires them to maintain the exterior of the property. Additionally, those who live in Nova Scotia (83%), as compared to Ontario (77%) or British Columbia (75%), were more likely to report being responsible for the outdoor maintenance of their home. The likelihood of having responsibility for maintaining the exterior of their property increased with age, from 66% of 18- to 34-year-olds, to 81% of those aged 55+.
The following were more likely to say they have taken preventative measures on their property:
- Those exposed to the risk of ticks in the workplace (64%).
- Rural dwellers (62%).
- Dog owners (60%).
- Outdoor enthusiasts (56%).
Those living in Quebec (47%) and British Columbia (45%) who have responsibility for maintaining the exterior of their property were less likely than their counterparts elsewhere in the country to have taken preventative measures.
Many didn't know it was possible to reduce the risk of ticks on their property
Respondents who live in a home that requires exterior maintenance who have not taken preventative action to reduce ticks were asked why. The two reasons mentioned with the greatest frequency were lack of knowledge ('I didn't know it was possible to reduce ticks') (40%) and lack of information on what to do (33%). Notably, three in 10 (29%) think there is no need to take preventative action to reduce ticks on their property.
Figure 18: Reasons for not taking action to prevent ticks on property
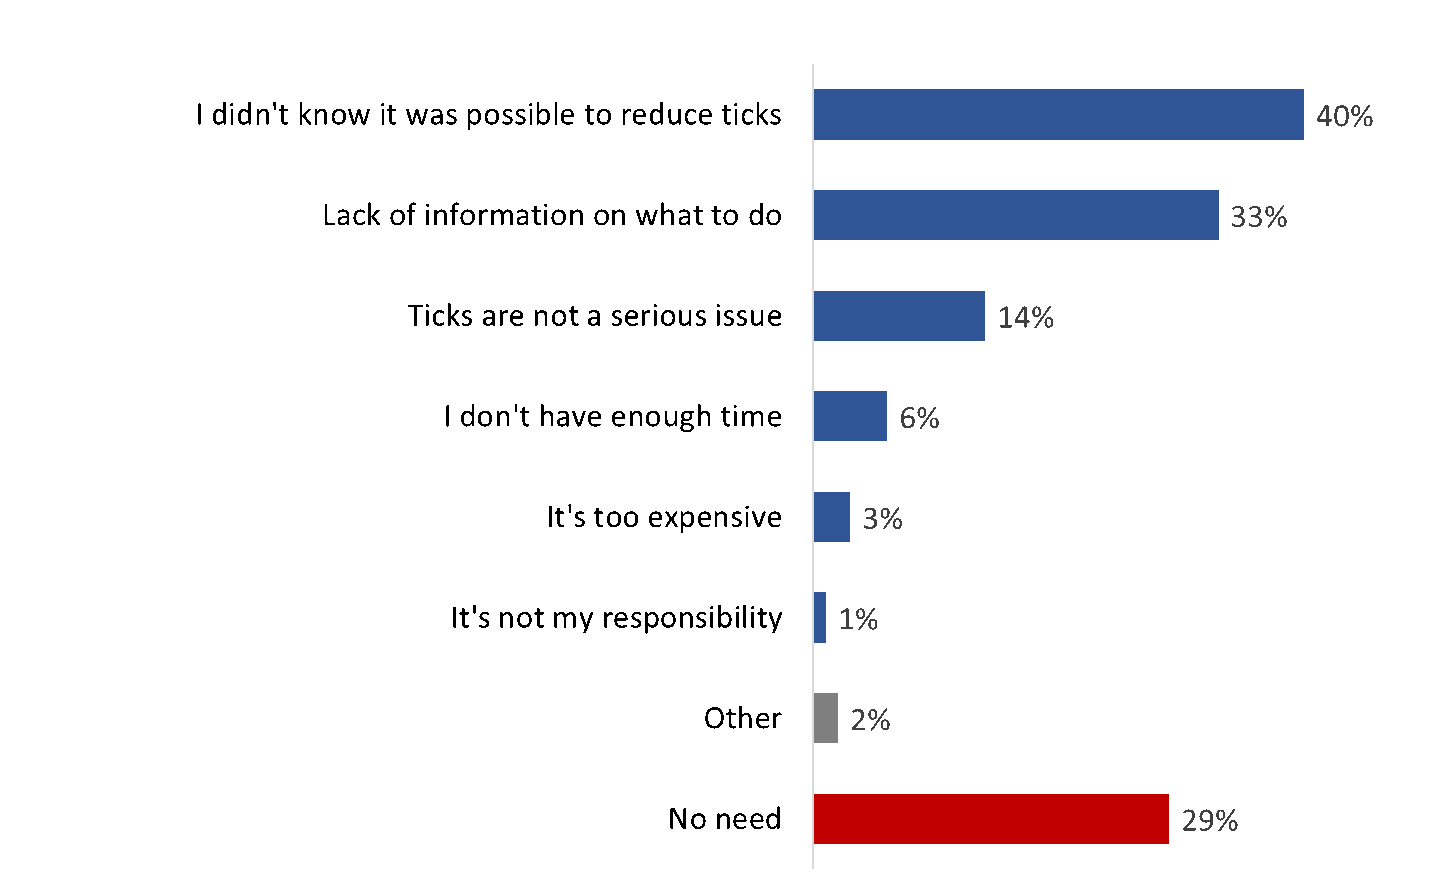
Q32. Why haven't you taken preventative action to reduce ticks on your property? [Multiple responses accepted].
Base: n= 581; respondents who have not taken preventative measures on their property. [NR: 2%].
| Q32. Why haven't you taken preventative action to reduce ticks on your property? | Respondents who have not taken preventative measures on their property (n=581) |
|---|---|
| I didn't know it was possible to reduce ticks | 40% |
| Lack of information on what to do | 33% |
| Ticks are not a serious issue | 14% |
| I don't have enough time | 6% |
| It's too expensive | 3% |
| It's not my responsibility | 1% |
| Other | 2% |
| No need | 29% |
Forty-nine percent of rural dwellers said they did not know it was possible to reduce ticks on their property as compared to 36% of urban dwellers who said the same. Those living in urban areas, instead, were more likely to say they have not taken preventative measures because there is no need (33%). At 41%, outdoor enthusiasts were more likely than their counterparts who do not engage in outdoor activities regularly (27%) to not know it was possible to reduce ticks.
Knowledge about Pets in Relation to Tick Bites and Lyme Disease
This section explores dog and cat owners' knowledge of tick bites and Lyme disease in pets.
Two-thirds say it is possible for their pet to be infected with Lyme disease
Two-thirds (68%) of dog and cat owners believe it is possible for their pet to become infected with Lyme disease. Of the rest, 12% said this is not possible and one in five (20%) do not know whether it is possible for their pet to contract Lyme disease.
Figure 19: Knowledge of Lyme disease in pets

Q33. To the best of your knowledge, is it possible for your pet to be infected with Lyme disease?
Base: n=1,116; pet owners.
| Q33. To the best of your knowledge, is it possible for your pet to be infected with Lyme disease? | Pet owners (n=1,116) |
|---|---|
| Yes | 68% |
| No | 12% |
| I don't know | 20% |
Among pet owners, dog owners were more likely to say it is possible for their pet to be infected with Lyme disease (72% versus 66% of cat owners). Additionally, pet owners who are also outdoor enthusiasts were more likely than those who are not to believe it is possible for their pet to become infected (68% and 65%, respectively).
Nearly 4 in 10 always or often check their pet for ticks
Of the pet owners surveyed, 14% always and 25% often check their pet for ticks and other bugs after spending time outdoors. In addition, one-quarter (24%) said they check their pet some of the time. Taken together, more than six in 10 check their pet for ticks and other bugs at least some of the time. At the other end of the spectrum, 14% never check their pet after being outdoors and 22% do not take their pet outdoors.
When those who said their pet does not go outside are excluded, the proportion of pet owners who check their pet at least some of the time increases to 80%: 17% always check, 32% often check and 31% sometimes check their pet.
Figure 20: Frequency of checking pets for ticks
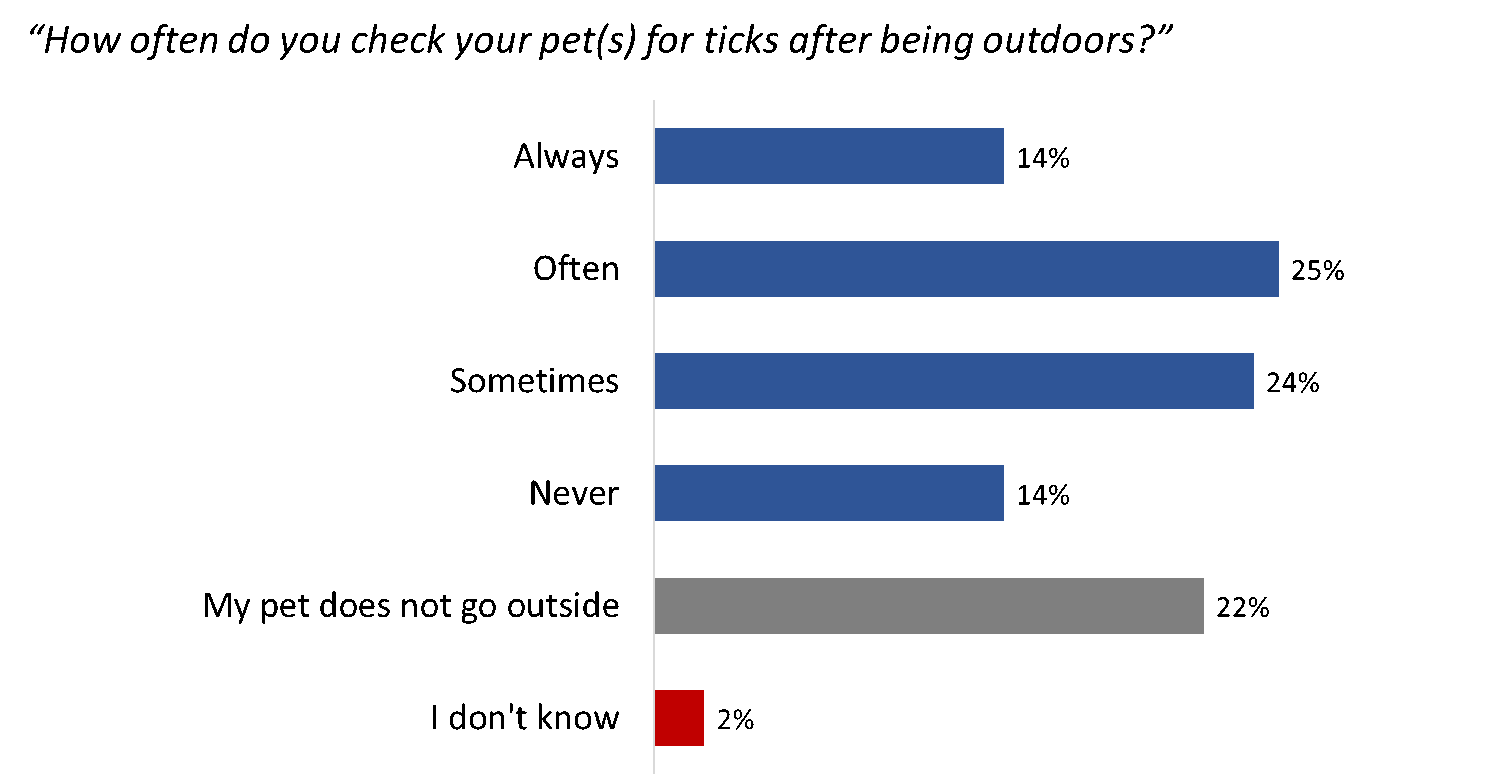
Q34. How often do you check your pet(s) for ticks and other bugs after they have spent time outdoors?
Base: n=1,116; pet owners
| Q34. How often do you check your pet(s) for ticks and other bugs after they have spent time outdoors? | Pet owners (n=1,116) |
|---|---|
| Always | 14% |
| Often | 25% |
| Sometimes | 24% |
| Never | 14% |
| My pet does not go outside | 22% |
| I don't know | 2% |
Dog owners are particularly likely to check their pet for ticks and other bugs—19% always do so, and approximately one-third do so often (34%) or sometimes (31%). Pet owners living in rural areas also are more likely to always check their pets for bugs (19%) compared to 12% of urban dwellers who do the same.
Workplace Exposure and Information
This section presents findings related to workplace exposure and preventative information. The questions in this section were asked only of those who work in a job that requires them to spend most or all of the day outdoors, putting them at risk of environmental exposure to Lyme disease and other tick-borne diseases.
Half at risk of environmental exposure as a result of their job have not received any information from their employer
Fifty-four percent (54%) of respondents at risk of environmental exposure to Lyme disease and other tick-borne diseases as a result of their job have not received from their employer any information or training on the steps to take to avoid tick bites while on the job. Conversely, 39% said their employer has provided information or training on the subject (7% did not know what, if anything, has been provided by their employer).
Figure 21: Preventative information provided by employer

Q35. Has your employer provided any information or training on the steps to take to avoid tick bites while on the job?
Base: n=188; respondents at risk of environmental exposure at work.
| Q35. Has your employer provided any information or training on the steps to take to avoid tick bites while on the job? | Respondents at risk of environmental exposure at work (n=188) |
|---|---|
| Yes | 39% |
| No | 54% |
| I don't know | 7% |
There are no demographic differences of note to report.
More than half have not received personal protective equipment from their employer
More than half who are at risk of exposure to ticks and tick bites in the workplace (55%) said they have not received any personal protective equipment, such as insect repellent or protective clothing, from their employer. In contrast, 41% have received such protective equipment from their employer (4% did not know).
Figure 22: Personal protective equipment provided by employer

Q36. Does your employer provide any personal protective equipment, such as insect repellents, insecticides, or protective clothing?
Base: n=188; respondents at risk of environmental exposure at work.
| Q36. Does your employer provide any personal protective equipment, such as insect repellents, insecticides, or protective clothing? | Respondents at risk of environmental exposure at work (n=188) |
|---|---|
| Yes | 41% |
| No | 55% |
| I don't know | 4% |
There are no demographic differences of note to report.
Most feel informed about protecting themselves from tick bites while on the job
Two-thirds of those at risk of environmental exposure to ticks feel moderately (38%) or very well (29%) informed about how to protect themselves from tick bites and tick-borne diseases while on the job. Conversely, one-third feel they are not very well (21%) or not at all (11%) informed about how to prevent tick bites while on the job.
Figure 23: Knowledge about preventing tick bites
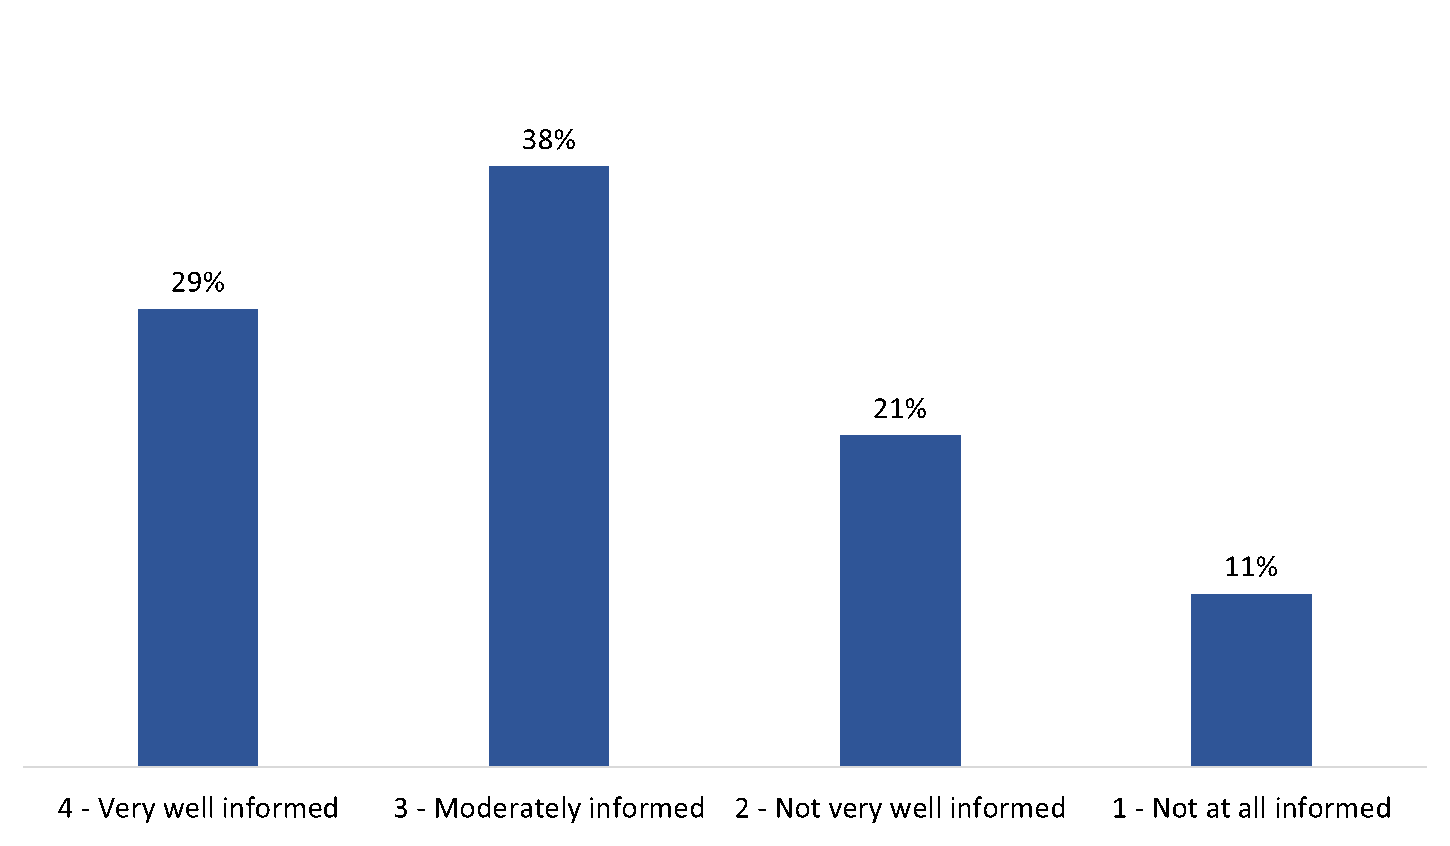
Q37. How well informed do you feel you are about how to protect yourself from tick bites and tick-borne diseases while on the job?
Base: n=188; respondents at risk of environmental exposure at work. [NR: 1%].
| Q37. How well informed do you feel you are about how to protect yourself from tick bites and tick-borne diseases while on the job? | Respondents at risk of environmental exposure at work (n=188) |
|---|---|
| Very well informed | 29% |
| Moderately informed | 38% |
| Not very well informed | 21% |
| Not at all informed | 11% |
Respondents at risk of environmental exposure who consider themselves informed about how to protect themselves from tick bites and tick-borne diseases on the job tend to get their information from a range of sources, most notably google/search engines (41%) and medical websites (35%). Additionally, those at a risk of environmental exposure who are informed are more likely than those who are uninformed to get their information from health care professionals (31%) and friends (29%). In terms of protection, those who are at risk of environmental exposure in the workplace tend to do the following: check their body for ticks (57%), wear pants (57%), wear long-sleeved shirts (55%) and pull their socks over pants (50%) when outdoors.
Information Sources
This section presents findings about the sources of information used by respondents when looking for information about health and lifestyle activities.
44% have looked for information on Lyme disease; symptoms are the top search item
Forty-four percent of respondents have looked for information on Lyme disease or other tick-borne diseases and an additional 12% have not done so but plan to in the coming weeks. Conversely, 40% have not looked for information and do not foresee doing so.
Among respondents who have looked for information on Lyme disease or other tick-borne diseases, three-quarters (75%) have looked for symptoms. Smaller, and similar proportions said they have looked for information on the following topics: prevention (63%), treatment (61%) as well as areas where ticks are found (60%). One-third (33%) typically look for information on the causes of Lyme disease or other tick-borne diseases.
Figure 24: Information on Lyme disease
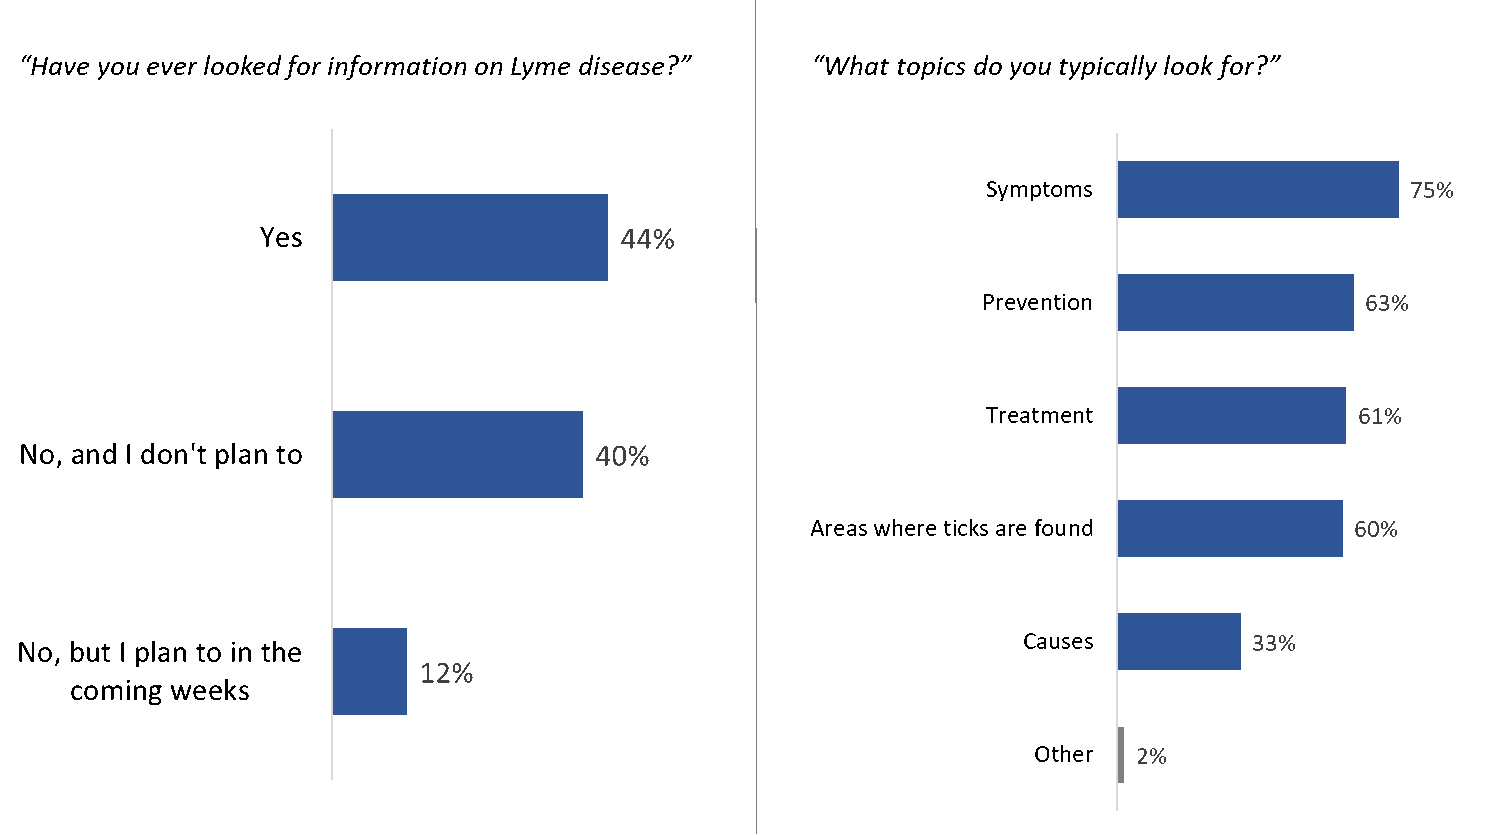
[LEFT] Q38. Have you ever looked for any information on Lyme disease or other tick-borne diseases?
Base: n=1,872; all respondents. [NR: 4%].
[RIGHT] Q40. What topics related to Lyme disease or other tick-borne diseases do you typically look for? [Multiple responses accepted].
Base: n=836; respondents who have looked for information on Lyme disease/tick-borne diseases. [NR: <0.5%].
| [LEFT] Q38. Have you ever looked for any information on Lyme disease or other tick-borne diseases? | All respondents (n=1,872) |
|---|---|
| Yes | 44% |
| No, and I don't plan to | 40% |
| No, but I plan to in the coming weeks | 12% |
| [RIGHT] Q40. What topics related to Lyme disease or other tick-borne diseases do you typically look for? | Respondents who have looked for information on Lyme disease/tick-borne diseases (n=836) |
|---|---|
| Symptoms | 75% |
| Prevention | 63% |
| Treatment | 61% |
| Areas where ticks are found | 60% |
| Causes | 33% |
| Other | 2% |
The following are more likely to have looked for information on Lyme disease or other tick-borne diseases: those at risk of workplace exposure (58%), pet owners (49%), rural dwellers (48%), and outdoor enthusiasts (46%). In addition, respondents from Nova Scotia (57%) were more likely than those living in other high-risk areas of the countries to report having looked for this type of information. The likelihood of having looked for information was also higher among 18 to 34 year olds (52%), and those who completed college or university (44% and 48%, respectively).
Comparing the target populations, pet owners (76%), rural dwellers (76%) and outdoor enthusiasts (75%) were more likely than those at risk of workplace exposure (62%) to report having looked for information about the symptoms of Lyme disease and other tick-borne diseases. In terms of what they look for, parents (66%) were more likely than those at risk of workplace exposure (54%) to say they have looked for information on prevention. The likelihood of looking for information about the areas wherein ticks can be found was higher among outdoor enthusiasts (61%) than parents (51%) and those at risk of workplace exposure (51%). Additionally, rural dwellers (22%) were the least likely to have said they look for information about the causes of Lyme disease and other tick-borne diseases (versus 41% of those at risk of workplace exposure, 39% of parents, and 32% each of pet owners and outdoor enthusiasts).
Many who have not looked for information on Lyme disease don't have any need for this information
When asked to indicate why they have not looked for information on Lyme disease or other tick-borne diseases, many respondents pointed to a lack of need. Specifically, 26% simply said they do not have any need for this information, 22% said they are already well-informed about Lyme disease or other tick-borne diseases, 8% were not aware of Lyme disease before the survey, and 5% were not worried about Lyme disease.
In addition to lack of need, 17% do not know where to get the information, 14% did not know this type of information is available, and 10% said they do not have the time needed to look for this information. Five percent said they have trouble understanding this type of information and 4% mentioned that the information they found was conflicting.
Figure 25: Reasons for not looking for information on Lyme disease
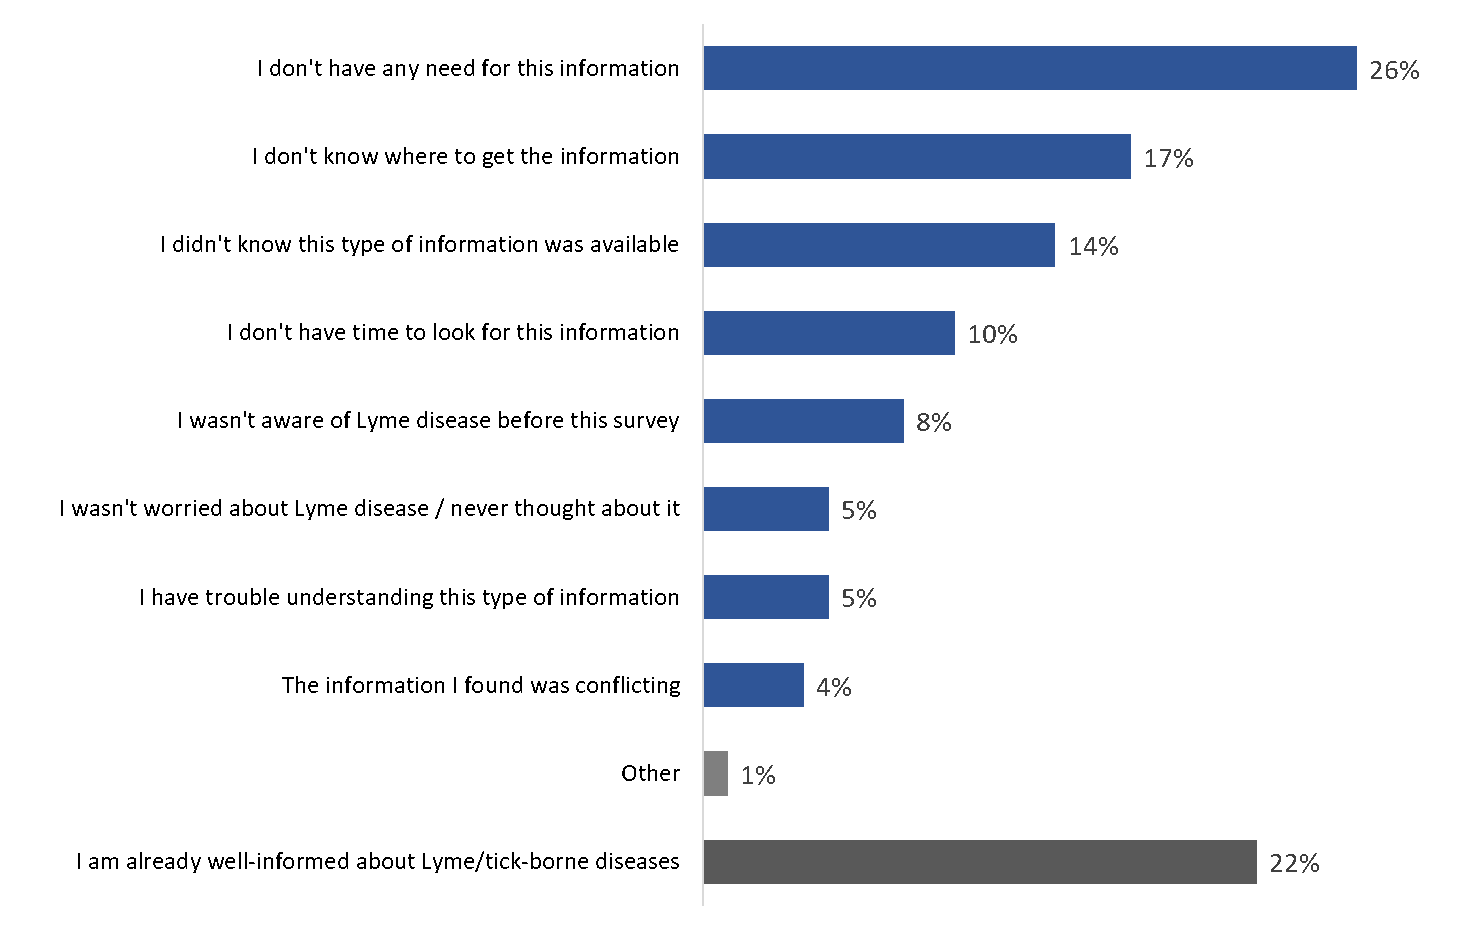
Q39. Why have you not looked for information on Lyme disease or other tick-borne diseases? [Multiple responses accepted].
Base: n=958; respondents who have not looked for any information on Lyme disease/tick-borne diseases
| Q39. Why have you not looked for information on Lyme disease or other tick-borne diseases? | Respondents who have not looked for any information on Lyme disease/tick-borne diseases (n=958) |
|---|---|
| I don't have any need for this information | 26% |
| I don't know where to get the information | 17% |
| I didn't know this type of information was available | 14% |
| I don't have time to look for this information | 10% |
| I wasn't aware of Lyme disease before this survey | 8% |
| I wasn't worried about Lyme disease / never thought about it | 5% |
| I have trouble understanding this type of information | 5% |
| The information I found was conflicting | 4% |
| Other | 1% |
| I am already well-informed about Lyme/tick-borne diseases | 22% |
Rural dwellers (31%), outdoor enthusiasts (24%), and pet owners (24%) who have not looked for information on Lyme disease were more likely to say they do not have a need for this information as compared to those at risk of exposure in the workplace (14%).
Google or health care professionals are the top 2 sources of information on health-related issues
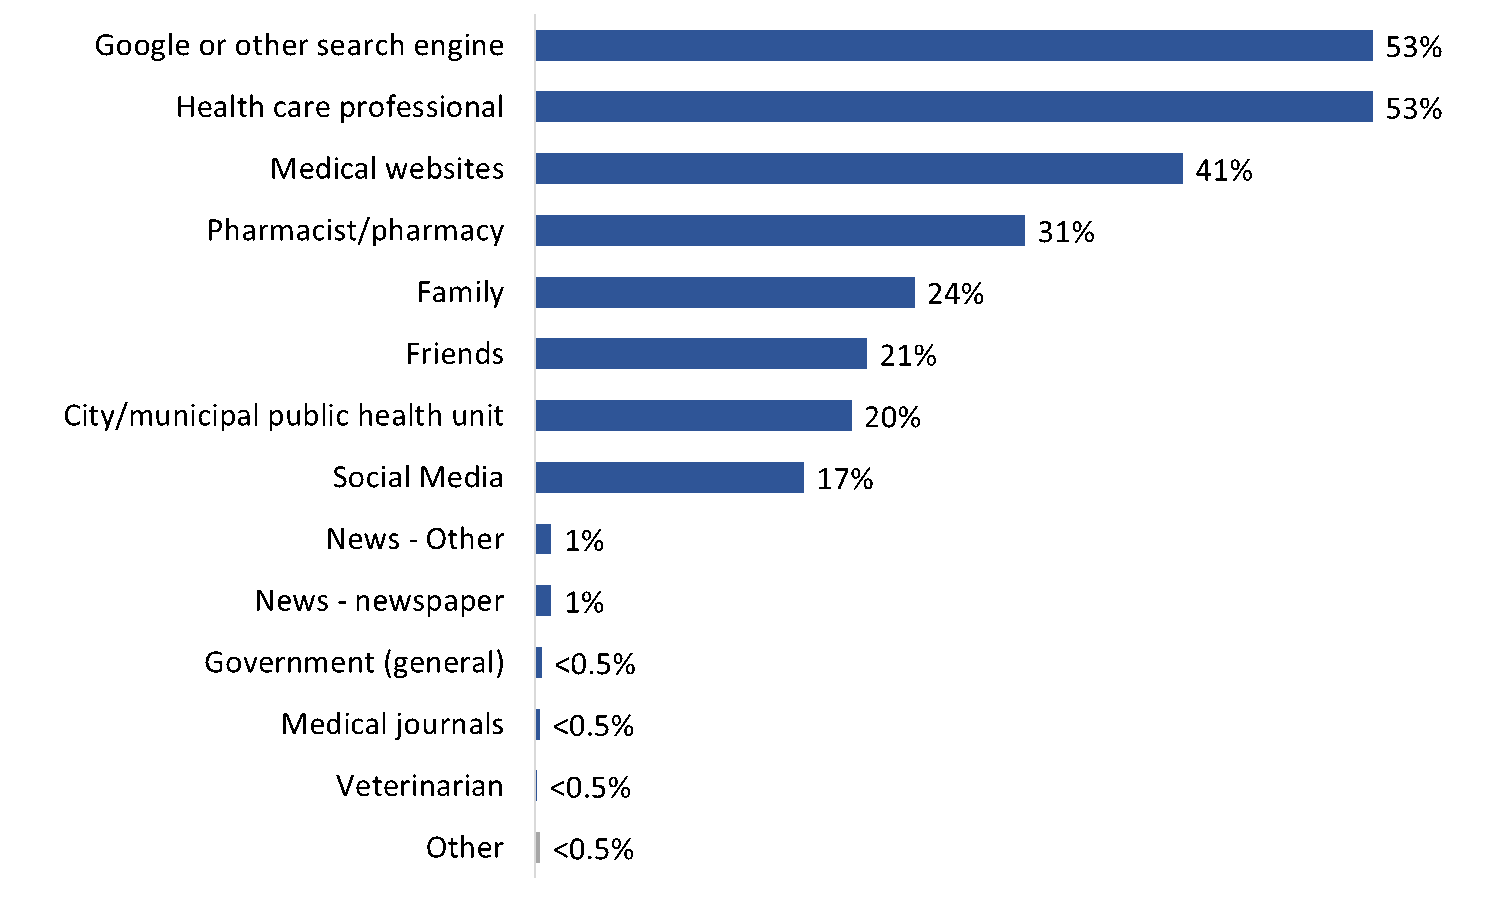
A majority of respondents said they typically get information on health-related issues from Google or another search engine (53%) or from health care professionals (53%). Following this, four in 10 (41%) mentioned medical websites and three in 10 (31%) mentioned pharmacists or pharmacies as the sources of their information on health-related issues. One in four (24%) turn to family and one in five (21%) turn to friends. Seventeen percent use social media for health-related information. More specifically, 10% turn to YouTube and 8% to Facebook, while fewer get their information from Reddit (4%), Instagram (2%), Twitter (2%) or TikTok (2%). The full list of sources can be found in figure 26.
Figure 26: Source of information for health-related issues
Q41. Where do you typically get information on health-related issues in general? [Multiple responses accepted].
Base: n=1,872; all respondents. [NR: 1%].
| Q41. Where do you typically get information on health-related issues in general? | All respondents (n=1,872) |
|---|---|
| Google or other search engine | 53% |
| Health care professional | 53% |
| Medical websites | 41% |
| Pharmacist/pharmacy | 31% |
| Family | 24% |
| Friends | 21% |
| City/municipal public health unit | 20% |
| Social Media | 17% |
| News - Other | 1% |
| News - newspaper | 1% |
| Government (general) | <0.5% |
| Medical journals | <0.5% |
| Veterinarian | <0.5% |
| Other | <0.5% |
Outdoor enthusiasts were more likely to have said they turn to search engines (54%), medical professionals (54%), or medical websites (43%) for general health-related information as compared to their counterparts who do not engage frequently in outdoor activities. In addition, rural dwellers were more likely than urban dwellers to report turning to medical professionals (57% versus 51%, respectively) and pharmacists or the pharmacy (37% versus 28%, respectively) for their health-related information. The likelihood of pointing to social media was higher among those at risk of workplace exposure (41%) than those who are not at risk (15%).
Age-related differences were also noteworthy: the likelihood of saying they would turn to a health care professional or pharmacist/pharmacy increased with age, while the likelihood of mentioning social media increased as age decreased. Respondents living in Ontario were the most likely to have said they typically get information on health-related issues from their city or municipal public health unit.
Most use Google or other search engines to get information on outdoor activities
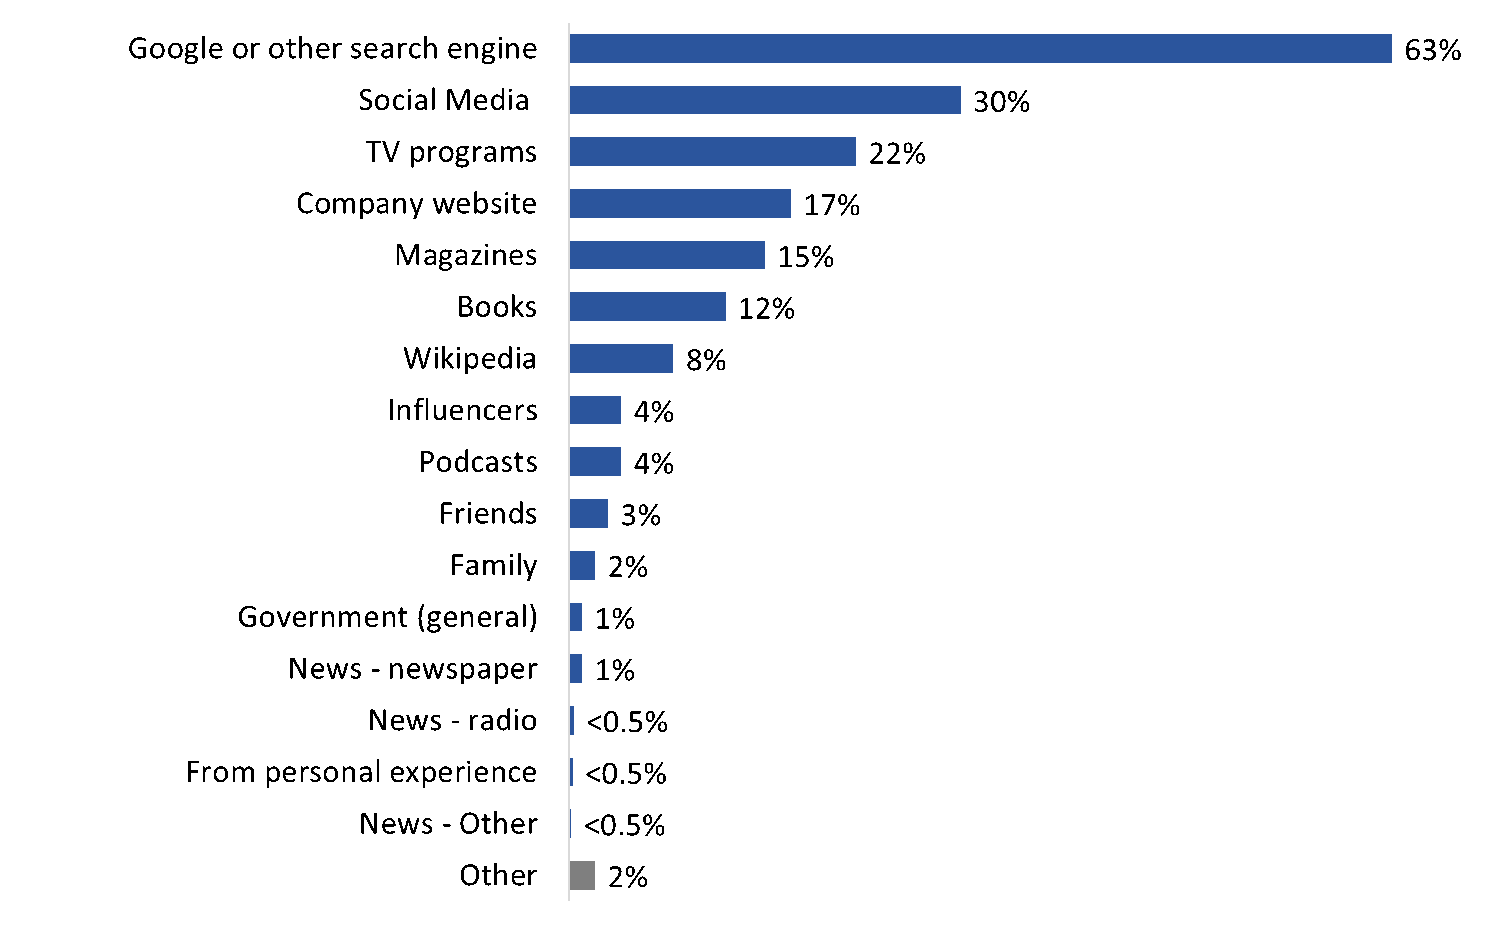
Almost two-thirds of respondents who hike, camp, or play sports outdoors (63%) said they get their information on outdoor activities from Google or another search engine. This is the only source of information mentioned by a majority of those who hike, camp, or play sports outdoors. This is followed, at a distance, by social media (30%): 17% get their information from Facebook, 13% from YouTube and 6% from Instagram. Others typically use TV programs (22%), company websites (17%), magazines (15%), and books (12%) for information on outdoor activities. The full list of sources can be found in figure 27.
Figure 27: Source of information on outdoor activities
Q42. Where do you typically get information on outdoor activities, including camping, sports and fitness activities? [Multiple responses accepted].
Base: n= 1,257; respondents who hike, camp, or play sports outdoors. [NR: 5%].
| Q42. Where do you typically get information on outdoor activities, including camping, sports and fitness activities? | Respondents who hike, camp, or play sports outdoors (n=1,257) |
|---|---|
| Google or other search engine | 63% |
| Social Media | 30% |
| TV programs | 22% |
| Company website | 17% |
| Magazines | 15% |
| Books | 12% |
| Wikipedia | 8% |
| Influencers | 4% |
| Podcasts | 4% |
| Friends | 3% |
| Family | 2% |
| Government (general) | 1% |
| News - newspaper | 1% |
| News - radio | <0.5% |
| From personal experience | <0.5% |
| News - Other | <0.5% |
| Other | 2% |
Those who hike, camp or play sports outdoors engage in outdoor activities and are at risk of workplace exposure (42%) were less likely than outdoor enthusiasts (64%), rural dwellers (62%), pet owners (62%), and parents (59%) to say they typically get information on outdoor activities from Google or another search engine. Outdoor enthusiasts (30%) and those living in rural areas (26%) were less likely than those at risk of workplace exposure (46%), parents (42%), and pet owners (35%) to report using social media for the purpose of getting information on outdoor activities.
More than half get their home gardening information through Google or other search engines
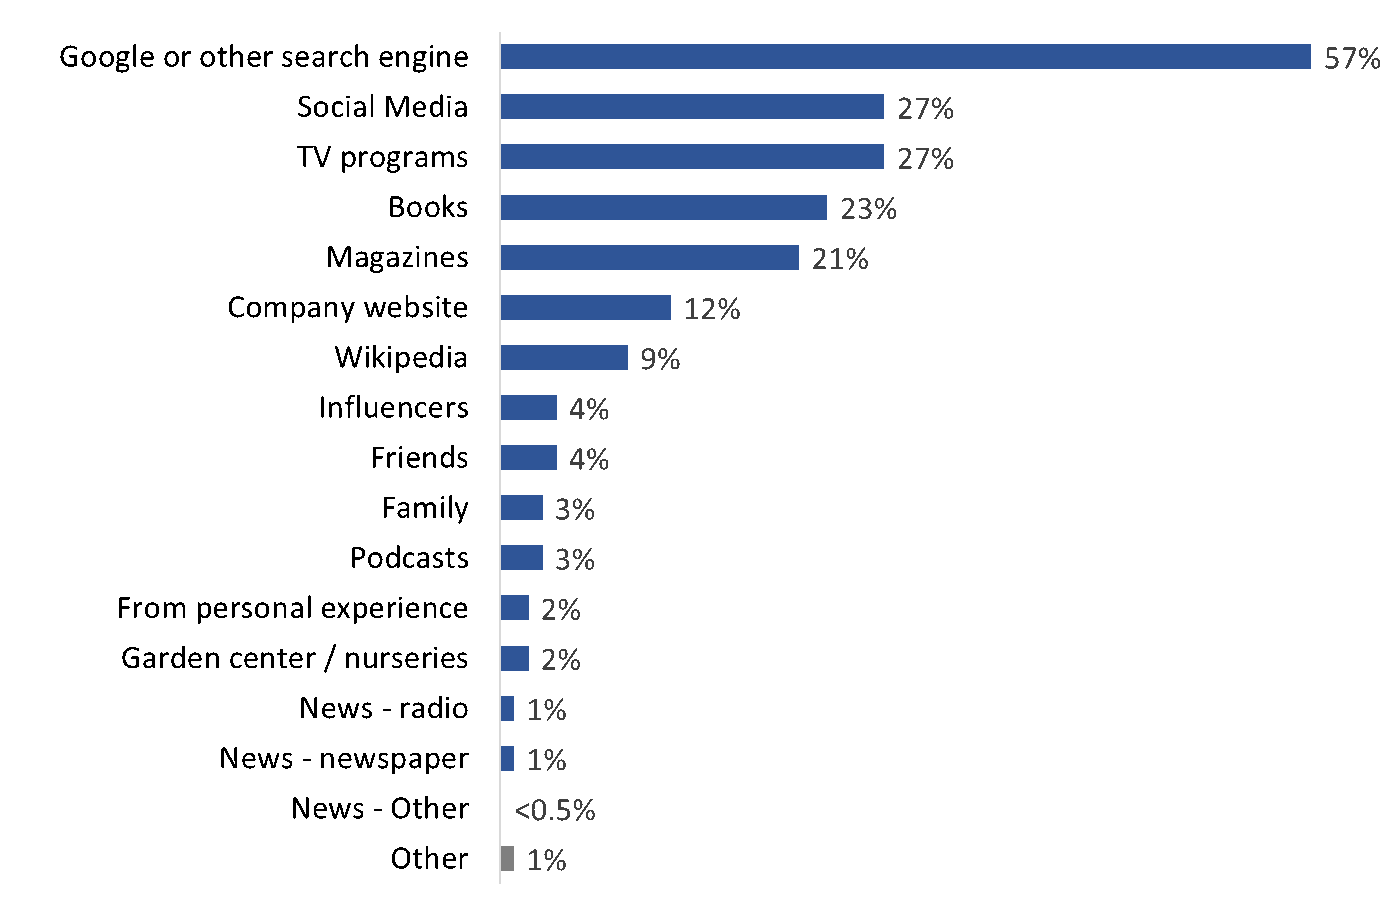
Fifty-seven percent (57%) of those who garden typically get their information on home gardening from Google or other search engines. Once again, this is the only source of information mentioned by a majority of gardeners. Following this, 27% of respondents mentioned they get their information from social media. More specifically, 17% mentioned YouTube, while others pointed to Facebook (11%), Instagram (4%), or Tik Tok (3%). Other sources mentioned with some frequency include TV programs (27%), books (23%), and magazines (21%). The full list of sources can be found in figure 28.
Figure 28: Source of information on home gardening
Q43. Where do you typically get information on home gardening? [Multiple responses accepted].
Base: n= 1,374; respondents who garden.
| Q43. Where do you typically get information on home gardening? | Respondents who garden (n=1,374) |
|---|---|
| Google or other search engine | 57% |
| Social Media | 27% |
| TV programs | 27% |
| Books | 23% |
| Magazines | 21% |
| Company website | 12% |
| Wikipedia | 9% |
| Influencers | 4% |
| Friends | 4% |
| Family | 3% |
| Podcasts | 3% |
| From personal experience | 2% |
| Garden center / nurseries | 2% |
| News - radio | 1% |
| News - newspaper | 1% |
| News - Other | <0.5% |
| Other | 1% |
Those who garden and who work in an industry that puts them at risk of workplace exposure were the least likely to use Google or another search engine for information about gardening (39% versus 58% of outdoor enthusiasts, 56% each of rural dwellers and pet owners, and 53% of parents). Rural dwellers were the least likely of the target populations to report using social media for this purpose (21% versus 42% of parents, 40% of those at risk of workplace exposure, 31% of pet owners, and 27% of outdoor enthusiasts).
Assessments of Ads
The section of the report provides respondents' feedback on a set of advertisements being used by the Public Health Agency of Canada (PHAC) to educate Canadians about ticks and Lyme disease.
Impressions of the 'Enjoy the Outdoors Without a Tick' resource are positive
Respondents were presented with the following image:
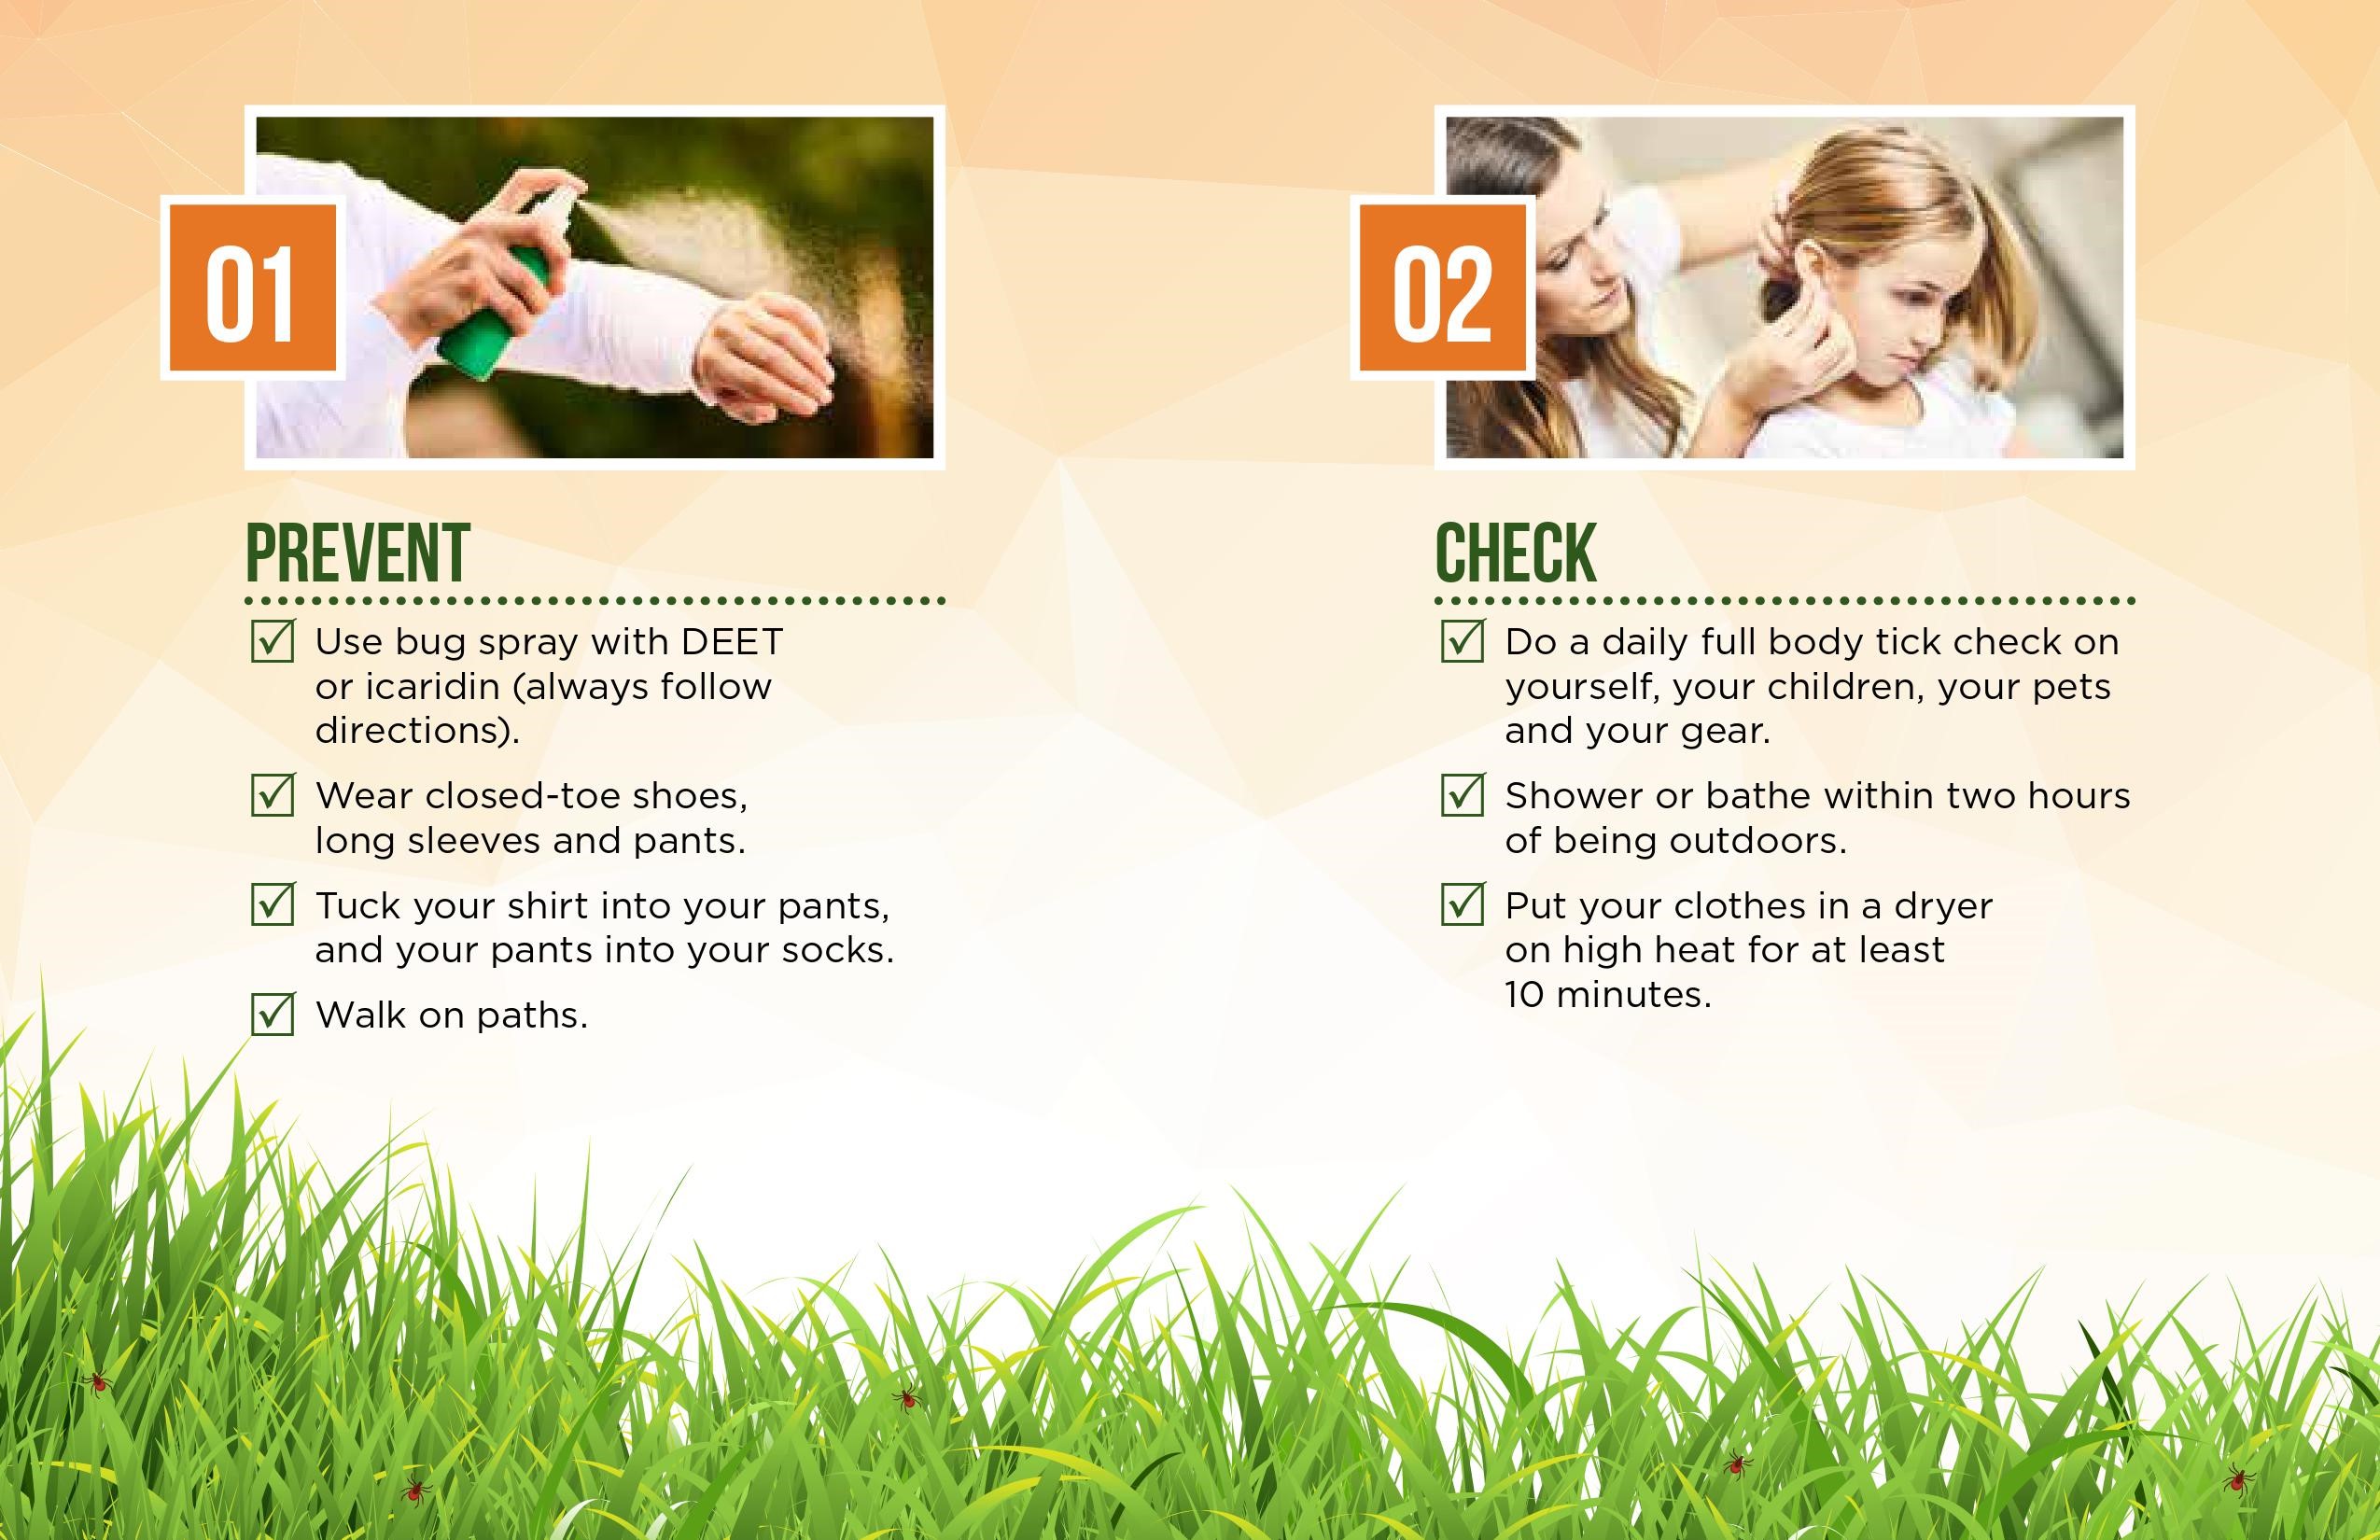
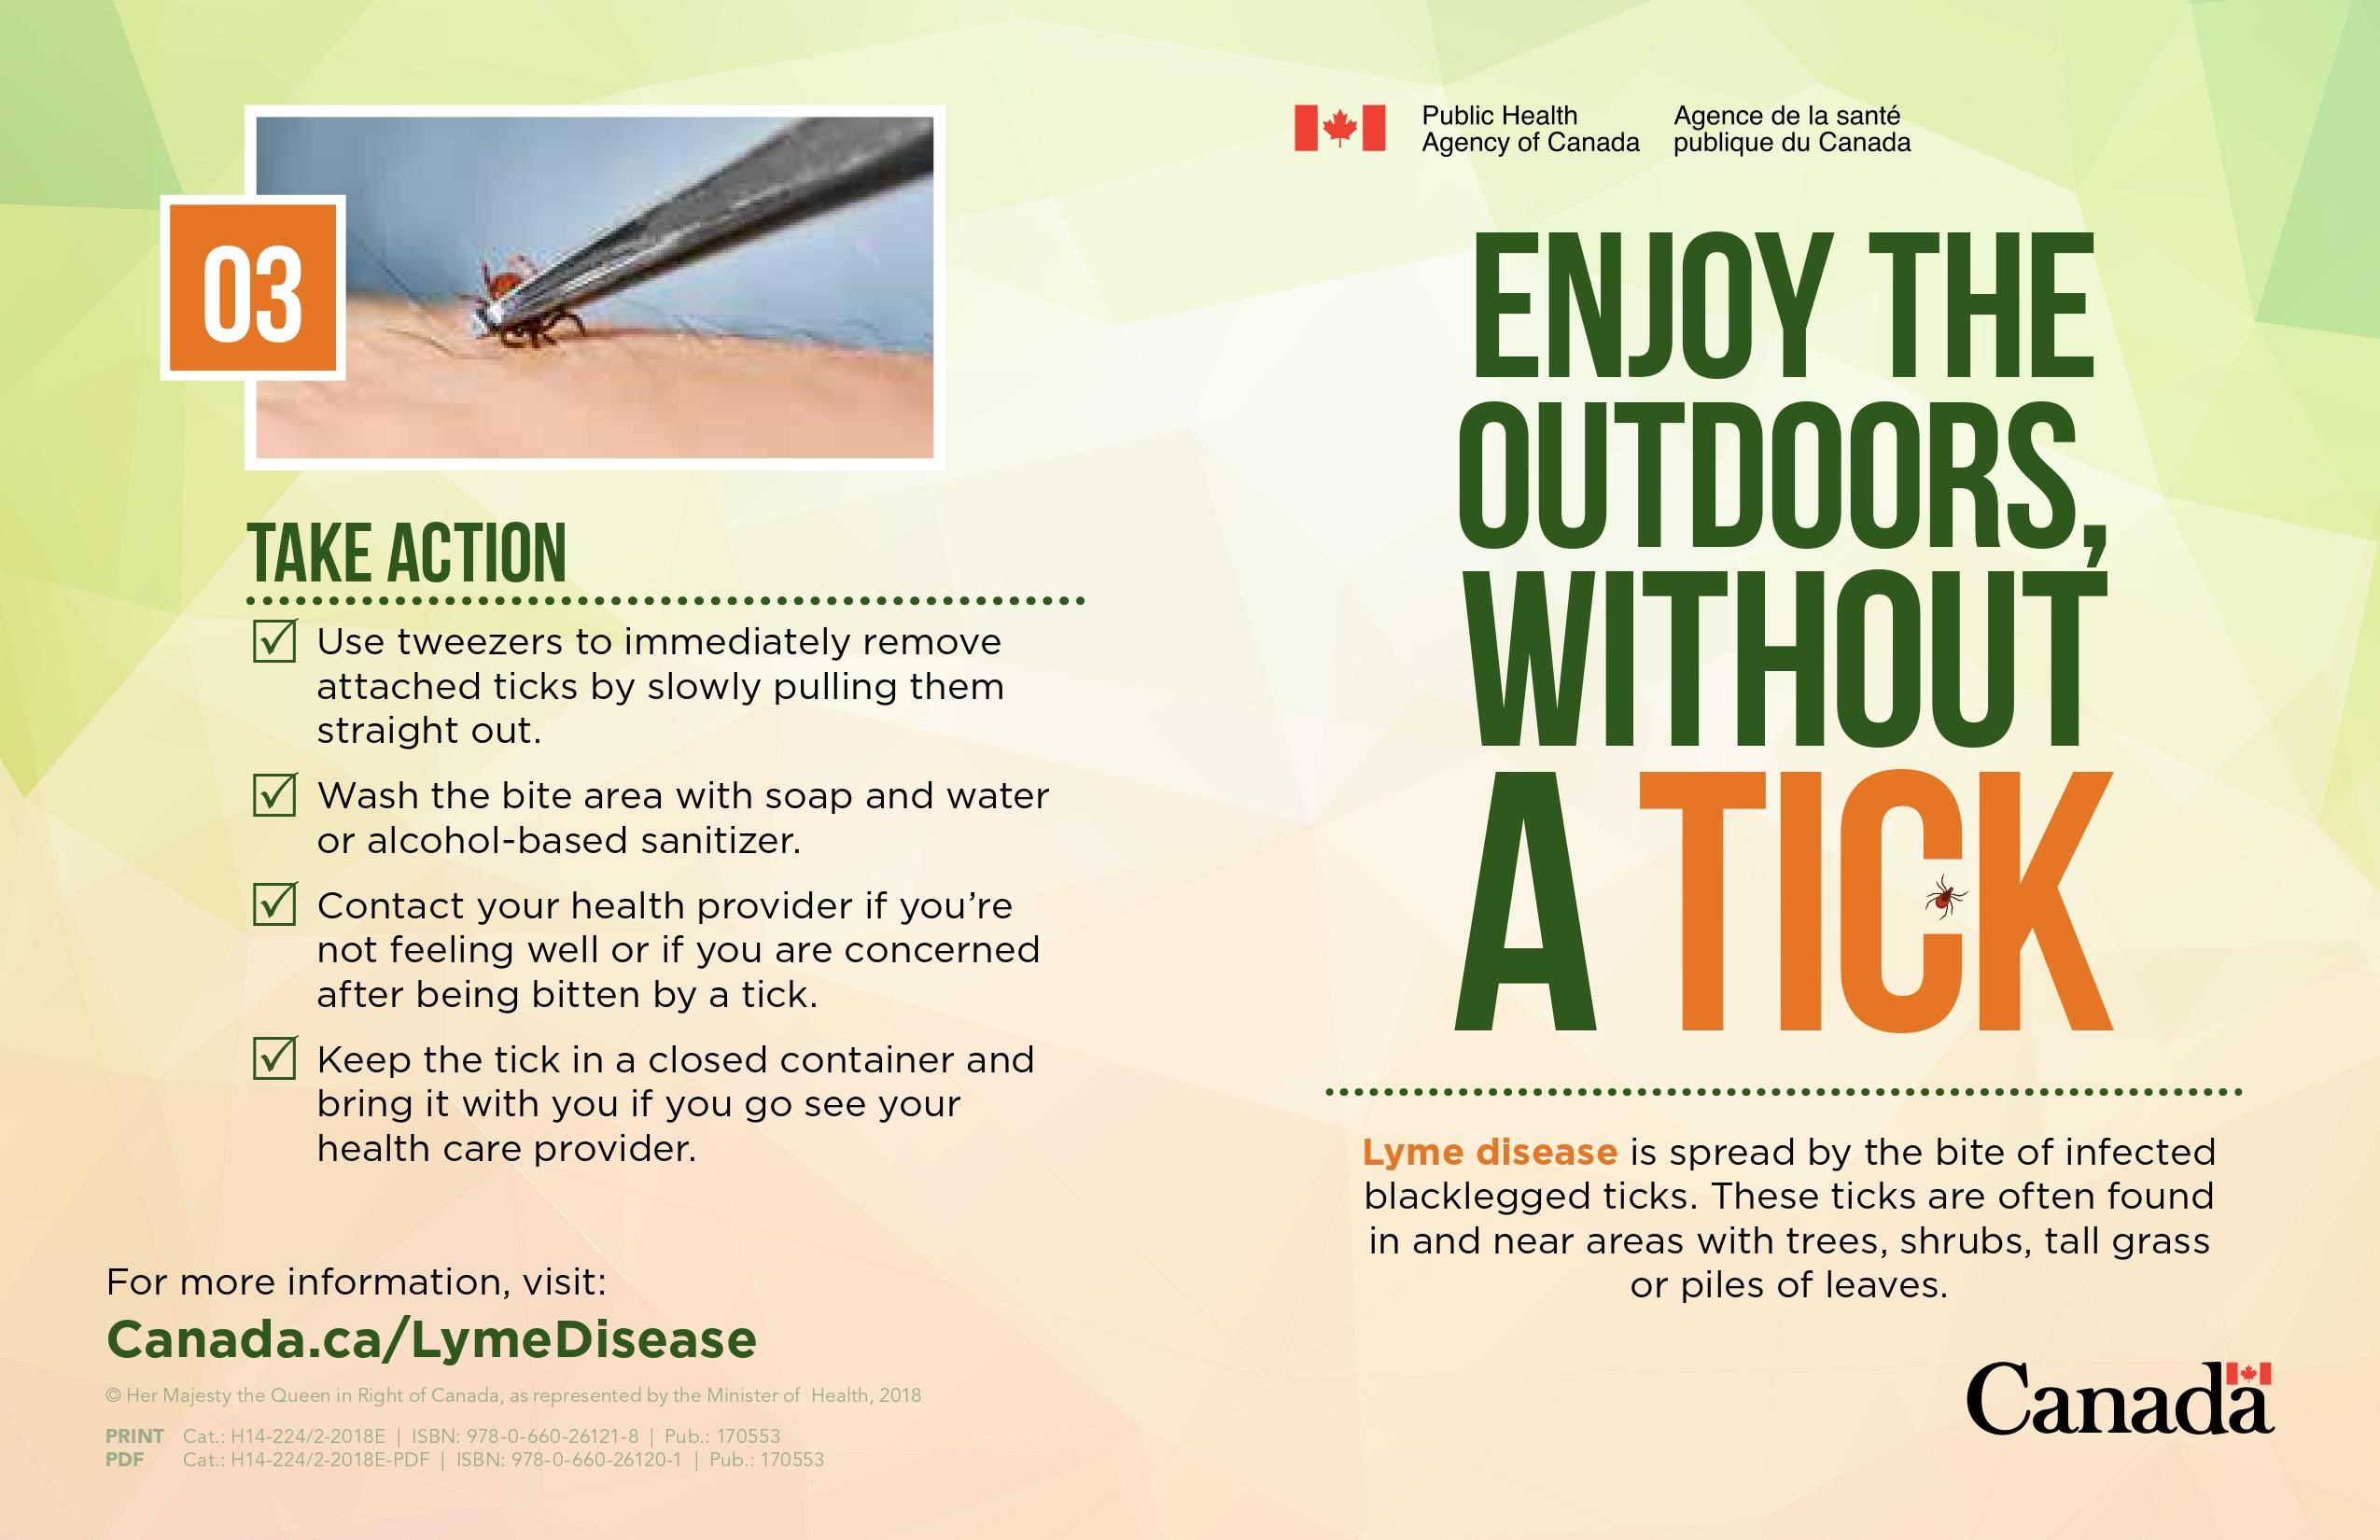
The vast majority of respondents agreed somewhat or strongly that the information in the pamphlet is easy to understand (94%), that they feel more confident about how to protect themselves from tick bites after having read the pamphlet (91%), that the design is attention-catching (89%), and that the information is personally relevant (88%).
Figure 29: Perceptions of the information pamphlet
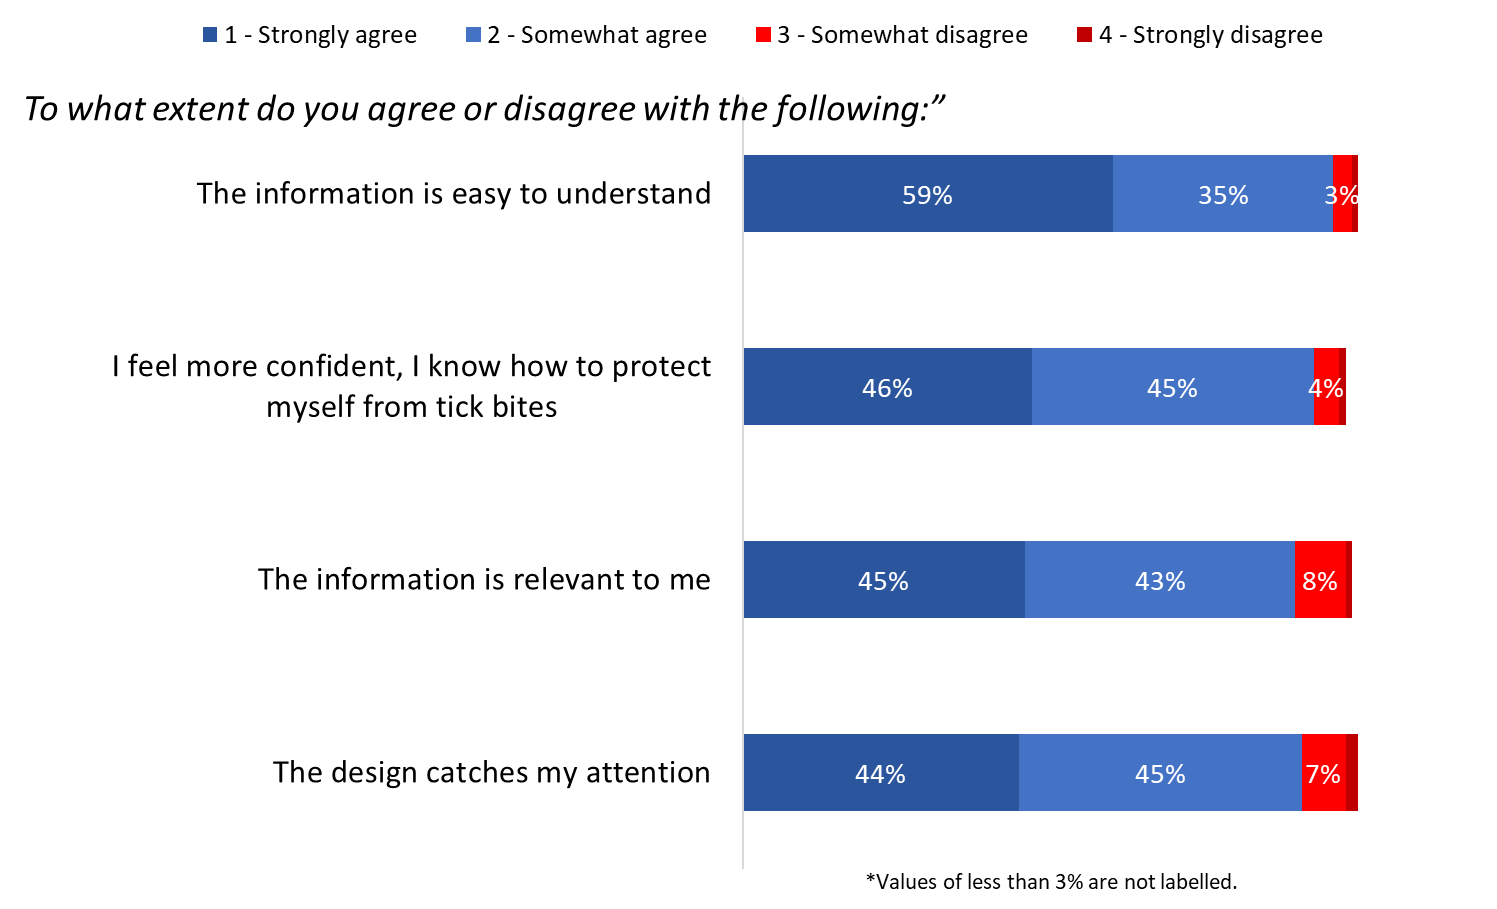
Q44. Here is an information postcard. To what extent do you agree or disagree with the following statements about the information postcard?
Base: n=1,872; all respondents. [DK: ranged from 2-4%].
| Q44. Here is an information postcard. To what extent do you agree or disagree with the following statements about the information postcard? | All respondents (n=1,872) |
|||
|---|---|---|---|---|
| 1 – Strongly agree | 2 – Somewhat agree | 3 – Somewhat disagree | 4 – Strongly disagree | |
| I feel more confident, I know how to protect myself from tick bites | 46% | 45% | 4% | 1% |
| The information is relevant to me | 45% | 43% | 8% | 1% |
| The design catches my attention | 44% | 45% | 7% | 2% |
Compared to non-pet owners, pet owners were more likely to have agreed that the information pamphlet is relevant to them (89% versus 84% of those who do not own a pet). Similarly, outdoor enthusiasts were much more likely to agree that the information is relevant to them when compared to their counterparts (89% versus 75% of those who are not outdoor enthusiasts). In addition, outdoor enthusiasts (95% versus 89% of those who are not) and pet owners (96% versus 93% of those who are not) were more likely to have agreed that the information pamphlet is easy to understand. Outdoor enthusiasts also felt more confident about protecting themselves from tick bites following the presentation of the information pamphlet (93% versus 83% of those who are not outdoor enthusiasts).
Majorities are likely to take some action after seeing the information pamphlet
Nine in 10 (90%) respondents were somewhat or very likely to say they will take steps to protect themselves when outdoors after having seen the information pamphlet, including nearly half (48%) who said they are very likely to do this. Seven in 10 (70%) say they will search online for more information about Lyme disease, although only 27% are very likely to do so, and six in 10 (60%) are likely to go to the Government of Canada website after having seen the information product.
Figure 30: Likelihood of taking selected actions after seeing the pamphlet
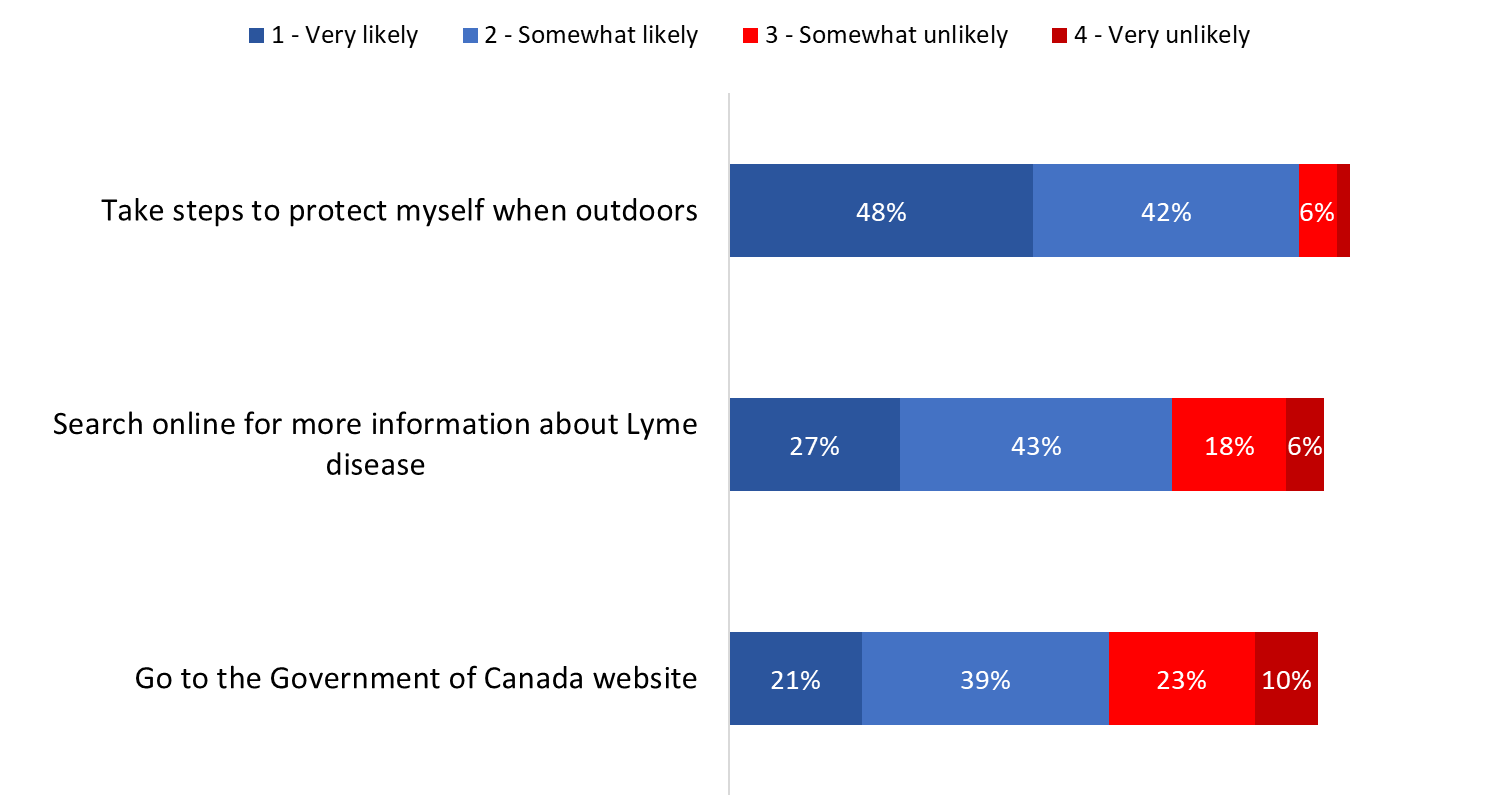
Q45. After having seen this information postcard, how likely are you to do the following?
Base: n=1,872; all respondents.
| Q45. After having seen this information postcard, how likely are you to do the following? | All respondents (n=1,872) |
|||
|---|---|---|---|---|
| 1 – Very likely | 2 – Somewhat likely | 3 – Somewhat unlikely | 4 – Very unlikely | |
| Take steps to protect myself when outdoors | 48% | 42% | 6% | 2% |
| Search online for more information about Lyme disease | 27% | 43% | 18% | 6% |
| Go to Government of Canada website | 21% | 39% | 23% | 10% |
Among the target populations, those at risk of workplace exposure (82%) and parents (79%) were more likely to say they would search online for information about Lyme disease after having seen the pamphlet. Compared to those who do not engage in outdoor activities regularly, outdoor enthusiasts were more likely to agree that they would take steps to protect themselves from tick bites after having seen the information pamphlet (91% versus 82%). The same was true of dog owners—compared to non-pet owners, dog owners were more likely to have said they would take steps to protect themselves when outdoors (92% versus 88%). Pet owners (63%), outdoor enthusiasts (61%), those at risk of workplace exposure (75%), as well as those living in urban areas (62%) were more likely to have said they would go to the Government of Canada website after seeing the information pamphlet.
Vast majority have not seen the web banner
Nine in 10 (92%) respondents did not recall having seen the following web banner ad.

Long description
- Orange background with 3 blades of grass to the left. The tallest blade has a tick climbing up the grass. One the right side of the ad is a patch of grass, a smaller sized tick is climbing up one of the single blades of grass in the patch.
- Scrolling text reads:
- Yard clean up time.
- Watch out for ticks!
- Prevent tick bites
- Protect yourself from tick-borne diseases like Lyme Disease
Figure 31: Web banner recall
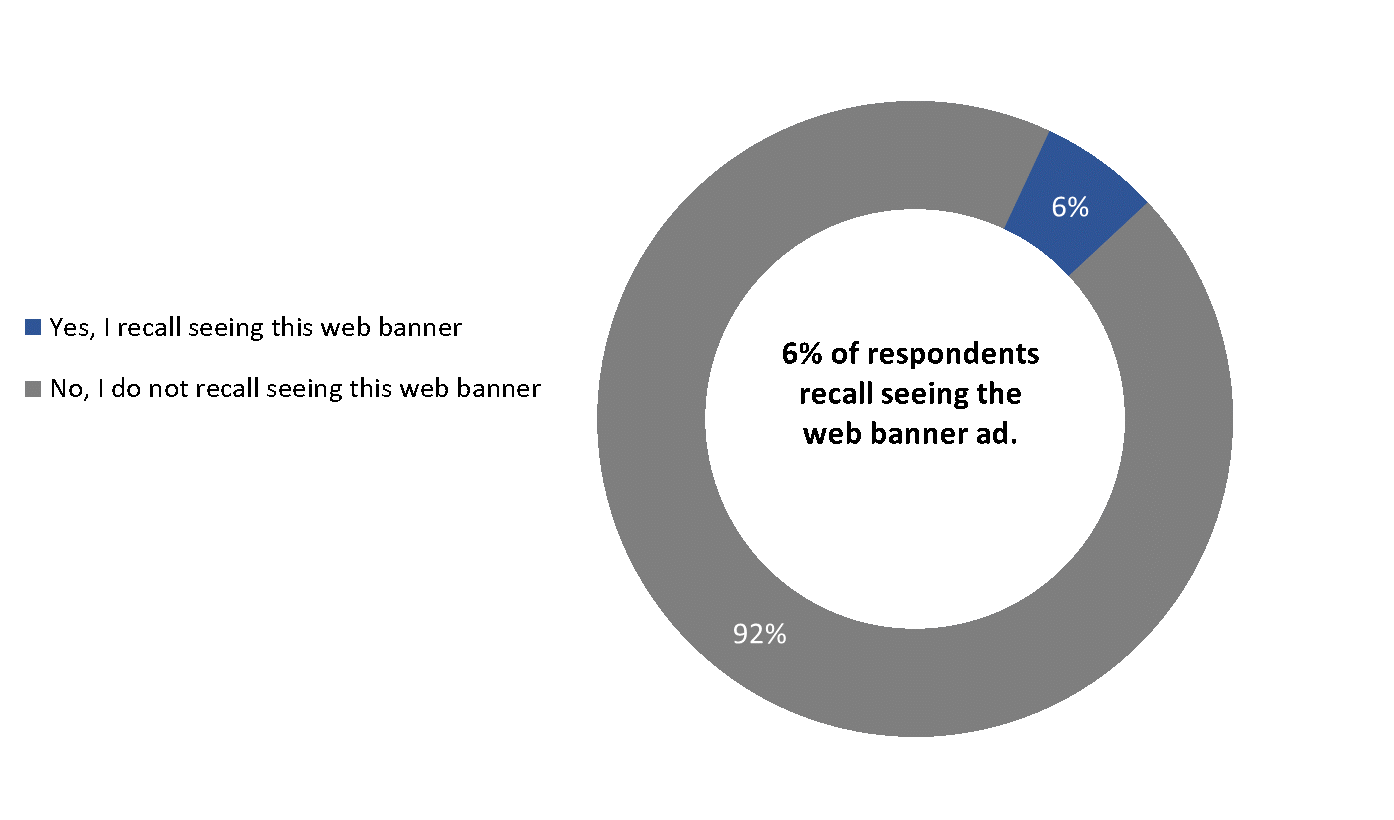
Q46. Do you recall ever having seen this web banner ad?
Base: n=1,872; all respondents.
| Q46. Do you recall ever having seen this web banner ad? | All respondents (n=1,872) |
|---|---|
| Yes, I recall seeing this web banner | 6% |
| No, I do not recall seeing this web banner | 92% |
The following were more likely to recall seeing the web banner ad:
- Those at risk of environmental exposure at work (24%).
- Those under 35 (15%).
- Parents (14%).
- Visible minorities (12%).
- Those between the ages of 35 to 54 (9%).
- Pet owners (7%).
- Those living in urban settings (7%).
- Those with a university degree (7%).
- Those in Ontario (7%).
Most agree the web banner is relevant and attention grabbing
Eight in 10 respondents agreed somewhat or strongly that the information in the web banner is relevant (80%) and that the design and text is attention-catching (79%). In addition, nearly three-quarters (73%) agreed that they want to learn more about ticks and Lyme disease after having seen the web banner ad. Feedback tended to be moderate, however, with more respondents agreeing somewhat as opposed to strongly on all of these aspects.
Figure 32: Perceptions of the web banner
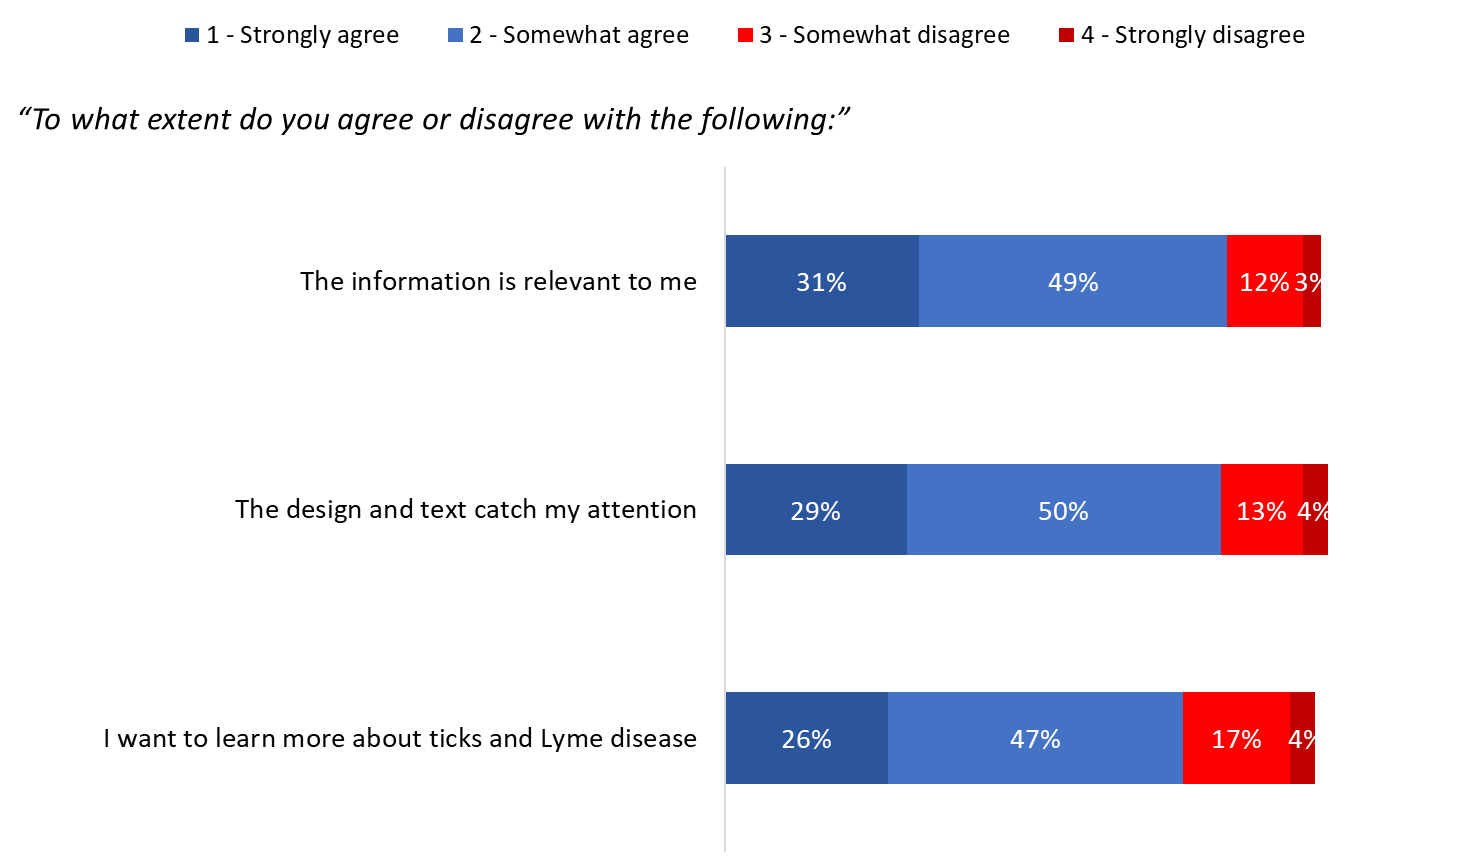
Q47. To what extent do you agree or disagree with the following statements about the web banner ad?
| Q47. To what extent do you agree or disagree with the following statements about the web banner ad? | All respondents (n=1,872) |
|||
|---|---|---|---|---|
| 1 – Strongly agree | 2 – Somewhat agree | 3 – Somewhat disagree | 4 – Strongly disagree | |
| The information is relevant to me | 31% | 49% | 12% | 3% |
| The design and text catch my attention | 29% | 50% | 13% | 4% |
| I want to learn more about ticks and Lyme disease | 26% | 47% | 17% | 4% |
The following were more likely to say the information in the web banner is relevant to them:
- 87% of parents compared to 79% of those who are not parents.
- 84% of pet owners compared to 76% of non-pet owners.
- 83% of outdoor enthusiasts compared to 64% of non-enthusiasts.
- 82% of those living in urban centres compared to 78% of rural dwellers.
The call to action was most effective for the following (i.e., these groups were more likely to say they want to learn more about ticks and Lyme disease): those at risk of workplace exposure (81%), parents (80%), pet owners (76%), outdoor enthusiasts (76%), and urban dwellers (75%). Additionally, respondents at risk of environmental exposure through their workplace (87%), urban dwellers (81%), and outdoor enthusiasts (81%) were more likely to agree the banner catches their attention.
One-third ranked the fourth Instagram Story as best
Asked to rank four Instagram Stories in order of preference, 34% preferred the graphic depicting tucking in socks to prevent tick bites. Following this, preference was split nearly evenly between the third (23%), second (22%), and first (21%) Instagram Story. The third ad depicts a tick emerging from the ground, while the second ad provides a closeup visual of ticks, and the first story depicts possible places to check yourself for ticks.
Figure 33: Instagram Stories ranked
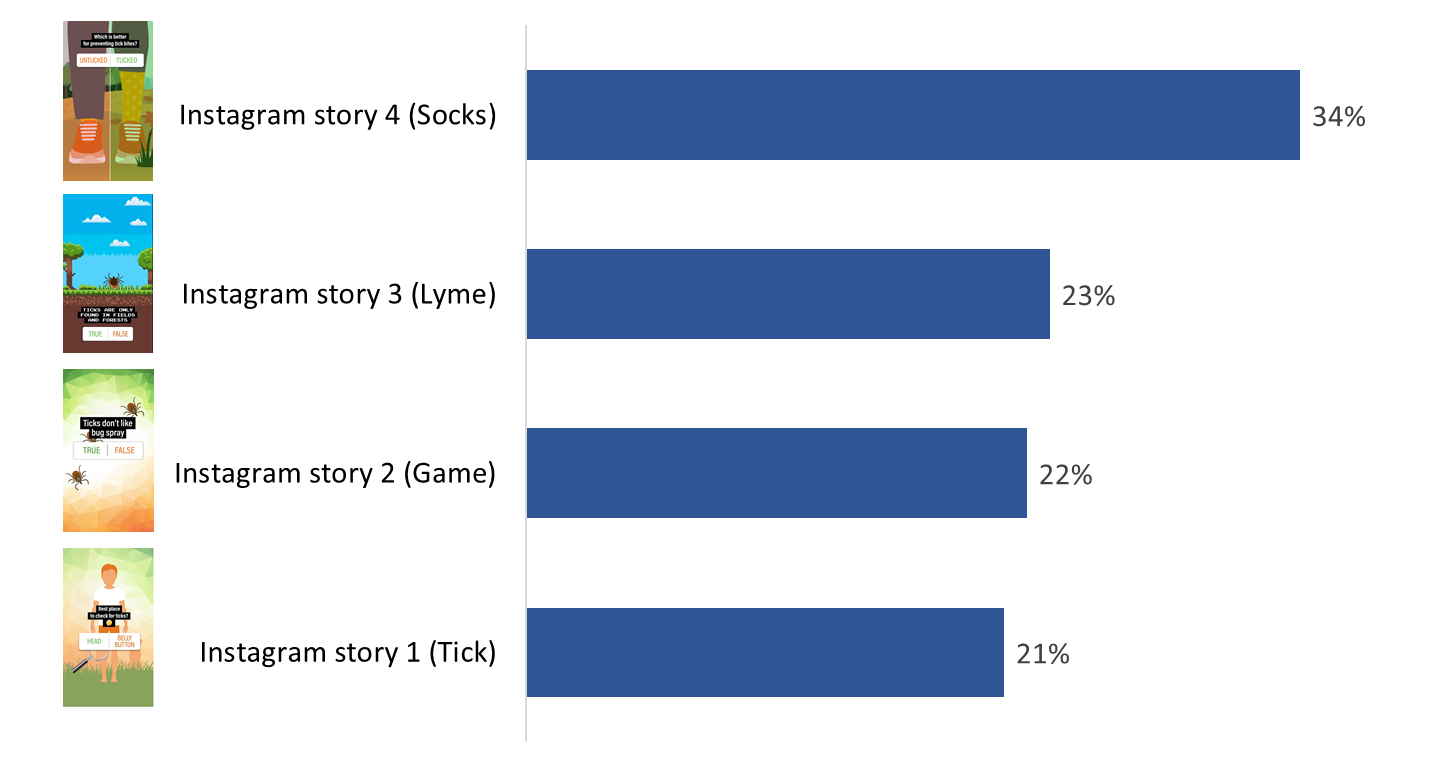
Q48. Now, here are 4 Instagram Stories. Please take a look at each and rank them in order of preference.
Base: n=1,872; all respondents.
| Q48. Now, here are 4 Instagram Stories. Please take a look at each and rank them in order of preference. | All respondents (n=1,872) |
|---|---|
| Instagram story 4 (Socks) | 34% |
| Instagram story 3 (Lyme) | 23% |
| Instagram story 2 (Game) | 22% |
| Instagram story 1 (Tick) | 21% |
Long description 1:
- A non-descriptive person is standing on a patch of grass, their dog is sitting right behind them.
- A magnifying glass is moving around their body.
- The text reads:
- Best place to check for ticks? (thinking emoji)
- Head or belly button?
Long description 2:
- Ticks are crawling across the frame from top to bottom.
- The text reads:
- Ticks don't like bug spray
- True or False
Long description 3:
- An oversized tick is rising from a field between two trees.
- After a moment the tick hides in the same patch of grass.
- The text reads:
- Ticks are only found in fields and forests
- True or False
Long description 4:
- The image is split in two halves from top to bottom.
- On the left side is a person's leg with their pants untucked.
- The right side has a person's pants tucked into their sock.
- The text reads:
- Which is better for preventing tick bites?
- Untucked or tucked
There were few noteworthy differences when looking at preferences by target population. The fourth Instagram Story ('socks') was more likely to be preferred by those who are not parents (35%). In contrast, parents were more likely to rank the second Instagram Story ('game') as their top choice (27%). Moreover, when comparing target groups to one another, those living in rural areas (36%) were more likely to select the fourth Instagram story ('socks') as their favourite, particularly when compared to parents (29%).
One in five ranked the post they liked best based on the perceived usefulness of the information
When asked in an open-ended manner why they preferred the Instagram Story they ranked first, approximately one in five (22%) said it was because of the useful advice – this was even higher among individuals 55 and older (27%). This is followed by the aesthetics of the stories: 15% liked the story they ranked first because of the attractive visuals and another 15% said because the post itself is attractive and attention-grabbing. Others pointed to the content: that it contains valuable/helpful information (11%), that it is simple and easy to understand (10%), that the information is inspiring/thought-provoking (9%), and that the message is good (7%) and concise (7%). Moreover, those aged 55 and older were more likely to point to the valuable/helpful information (13%) as compared to younger respondents. The full range of reasons can be found in figure 34. Notably, 22% of respondents could not point to a specific reason why they selected a particular Instagram Story as best.
Figure 34: Reasons for most liked Instagram Story
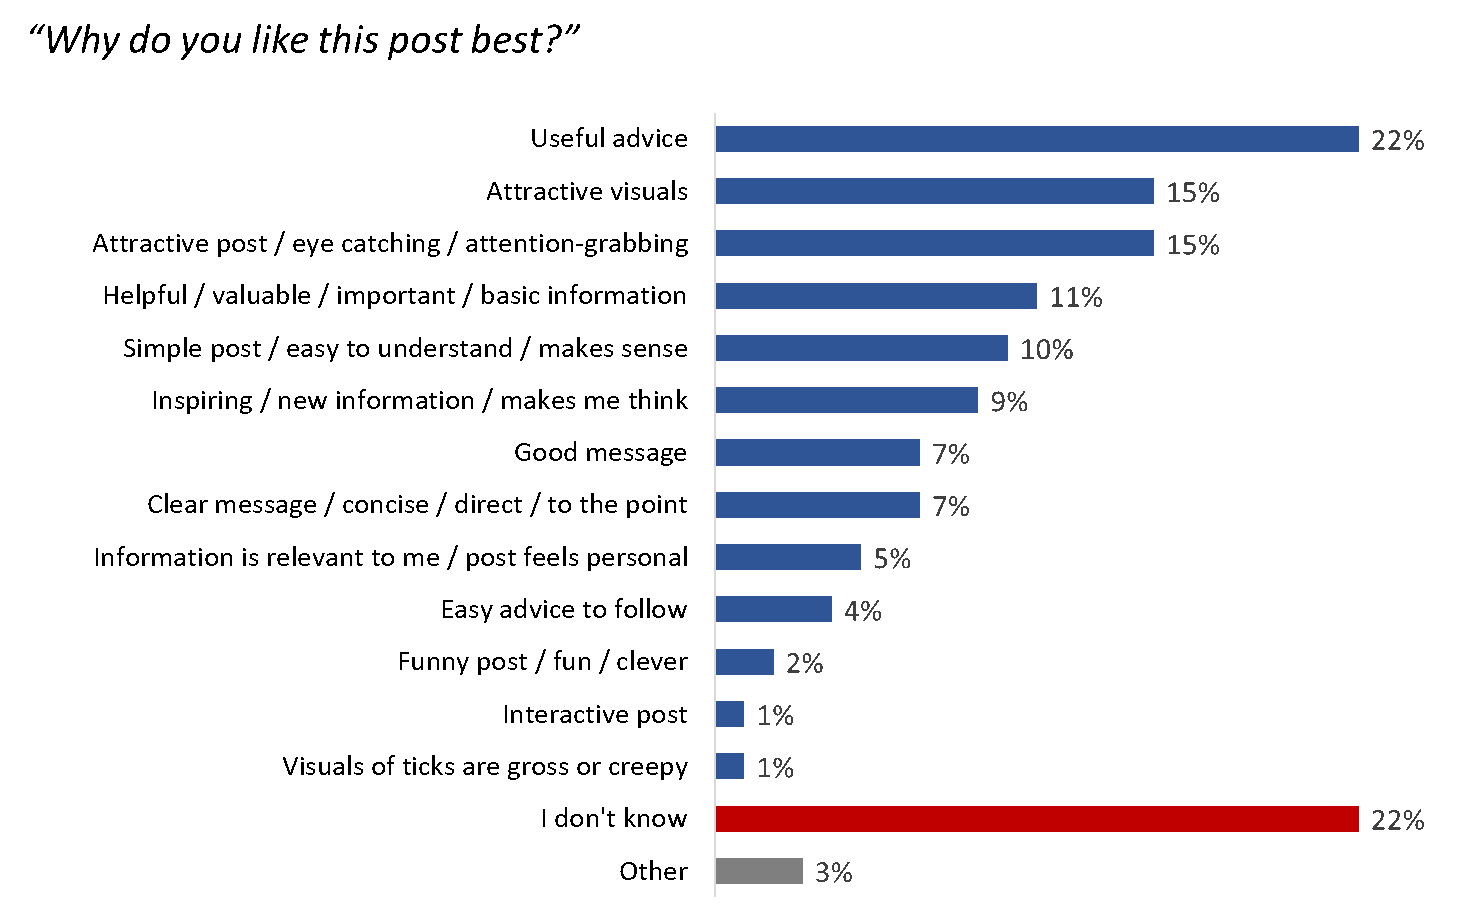
Q49. Why do you like this post best?
Base: n=1,872; all respondents.
| Q49. Why do you like this post best? | All respondents (n=1,872) |
|---|---|
| Useful advice | 22% |
| Attractive visuals | 15% |
| Attractive post / eye catching / attention-grabbing | 15% |
| Helpful / valuable / important / basic information | 11% |
| Simple post / easy to understand / makes sense | 10% |
| Inspiring / new information / makes me think | 9% |
| Good message | 7% |
| Clear message / concise / direct / to the point | 7% |
| Information is relevant to me / post feels personal | 5% |
| Easy advice to follow | 4% |
| Funny post / fun / clever | 2% |
| Interactive post | 1% |
| Visuals of ticks are gross or creepy | 1% |
| I don't know | 22% |
| Other | 3% |
Comparing target populations, rural dwellers (23%), outdoor enthusiasts (22%), and pet owners (22%) were among those most likely to appreciate the useful advice in the Instagram Story they ranked best.
Profile of Survey Respondents
Slightly more than half of respondents are aged 55+ and female
Just over half of survey respondents (54%) are aged 55 or older, while approximately one-third (35%) are between 35 and 54. Fewer (11%) are between 18 and 34 years of age. Just over half (53%) of the respondents identified as female and 47% as male.
Figure 35: Age and gender
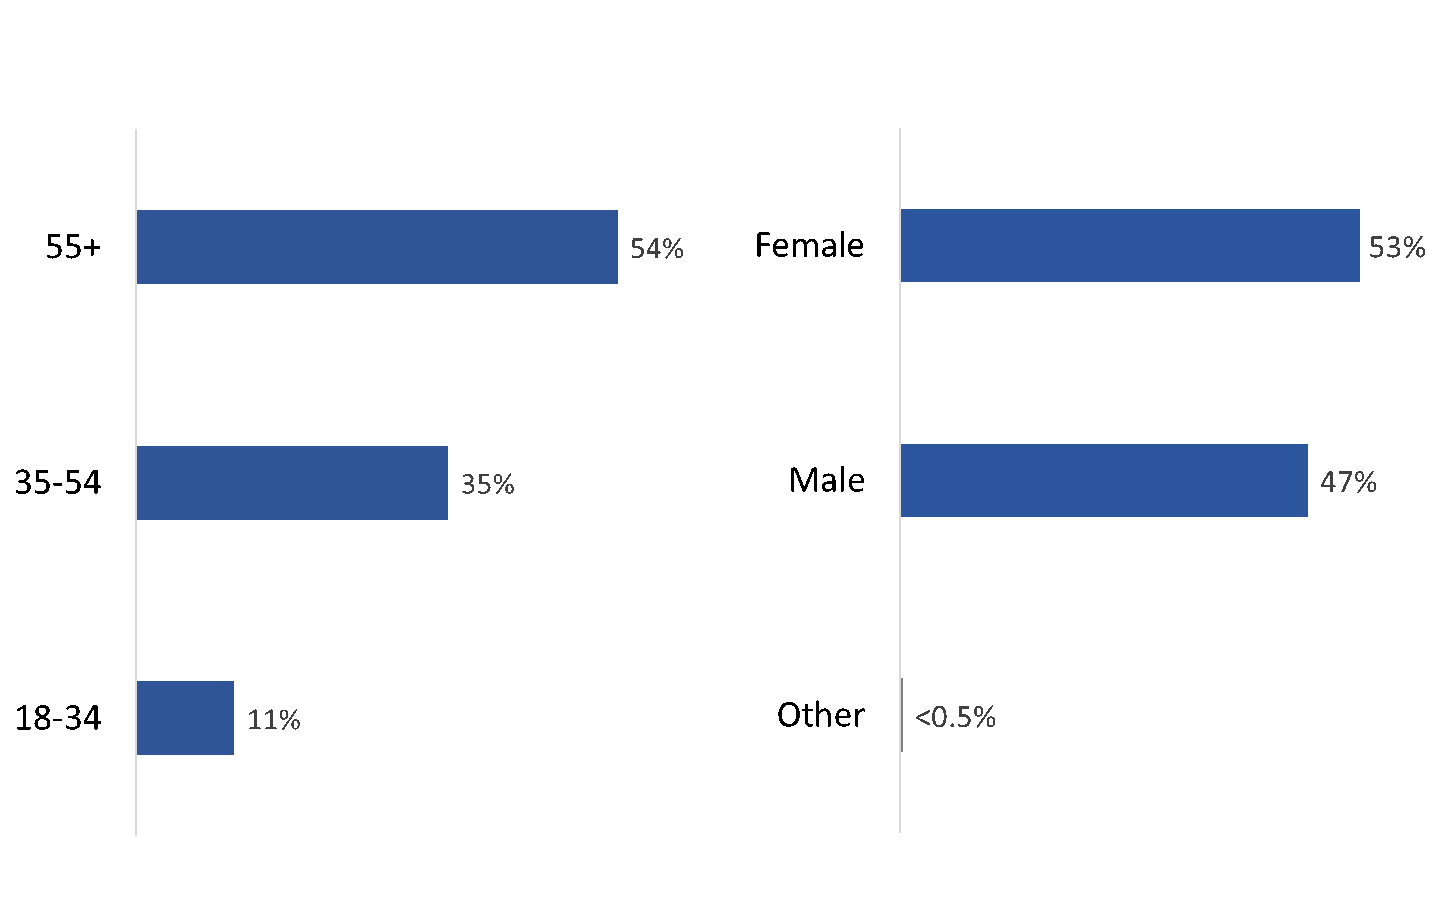
| [LEFT] SCR1. What is your age? | All respondents (n=1,872) |
|---|---|
| 55+ | 54% |
| 35-54 | 35% |
| 18-34 | 11% |
| [RIGHT] Q50. How do you identify your gender? This may be different from the information noted on your birth certificate or other official documents? | All respondents (n=1,872) |
|---|---|
| Female | 53% |
| Male | 47% |
| Other | <0.5% |
Majority of respondents are Caucasian / white
Three-quarters of respondents (76%) self-identified as Caucasian or white.
Figure 36: Ethnic and cultural background
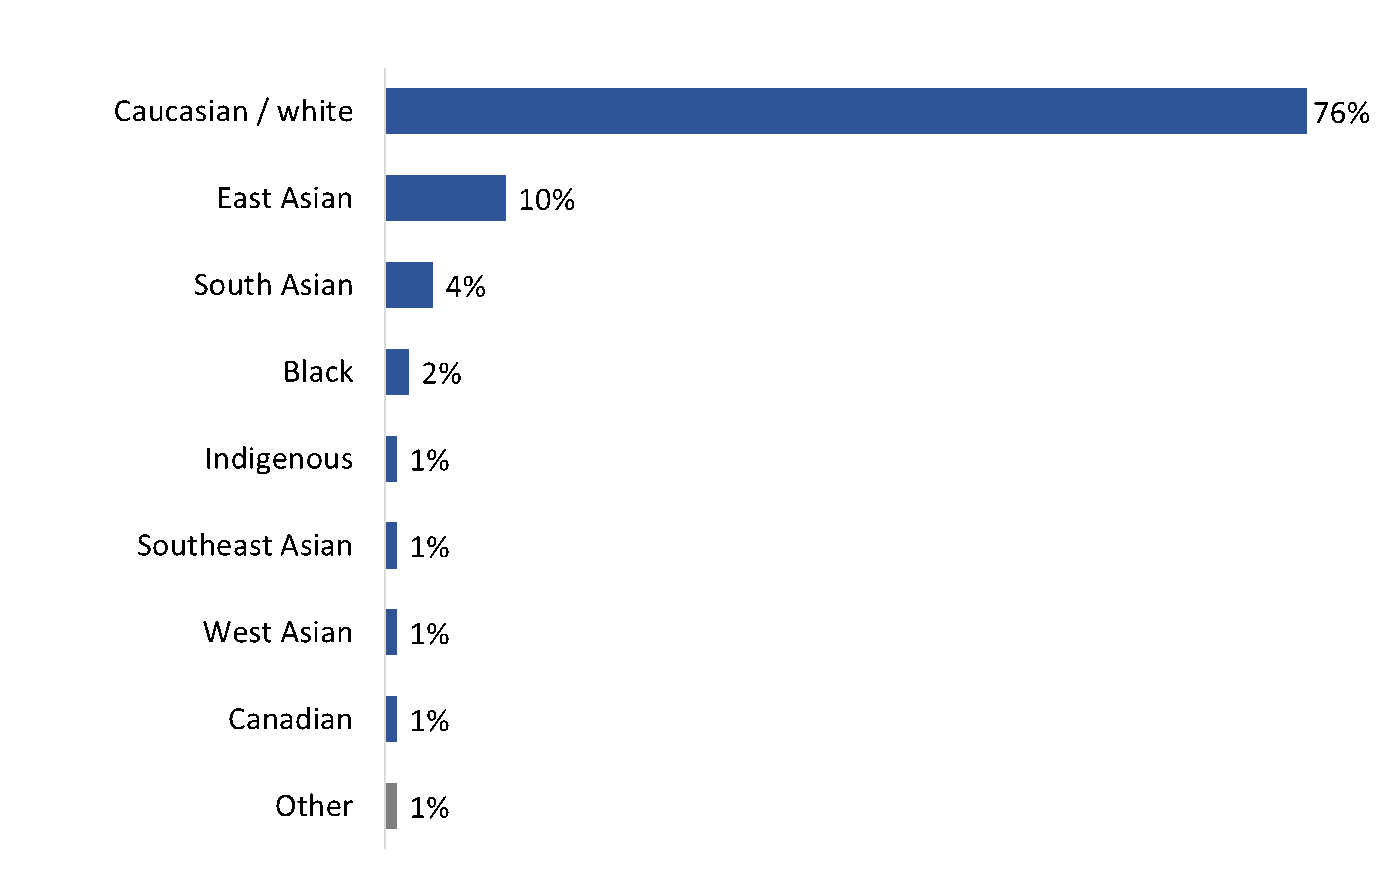
| Q51. What is your ethnic or cultural background? | All respondents (n=1,872) |
|---|---|
| Caucasian / white | 76% |
| East Asian | 10% |
| South Asian | 4% |
| Black | 2% |
| Indigenous | 1% |
| Southeast Asian | 1% |
| West Asian | 1% |
| Canadian | 1% |
| Other | 1% |
Level of formal education among respondents is varied
Four in 10 respondents have completed a bachelor's degree (28%) or post-graduate degree above a bachelor level (12%). One-quarter (26%) completed a college, CEGEP or other non-university certificate or diploma, while 6% each completed a Registered Apprenticeship or other trades certificate or diploma or a university certificate or diploma below a bachelor level. Most of the rest completed high school (19%) or less (2%).
Figure 37: Level of formal education
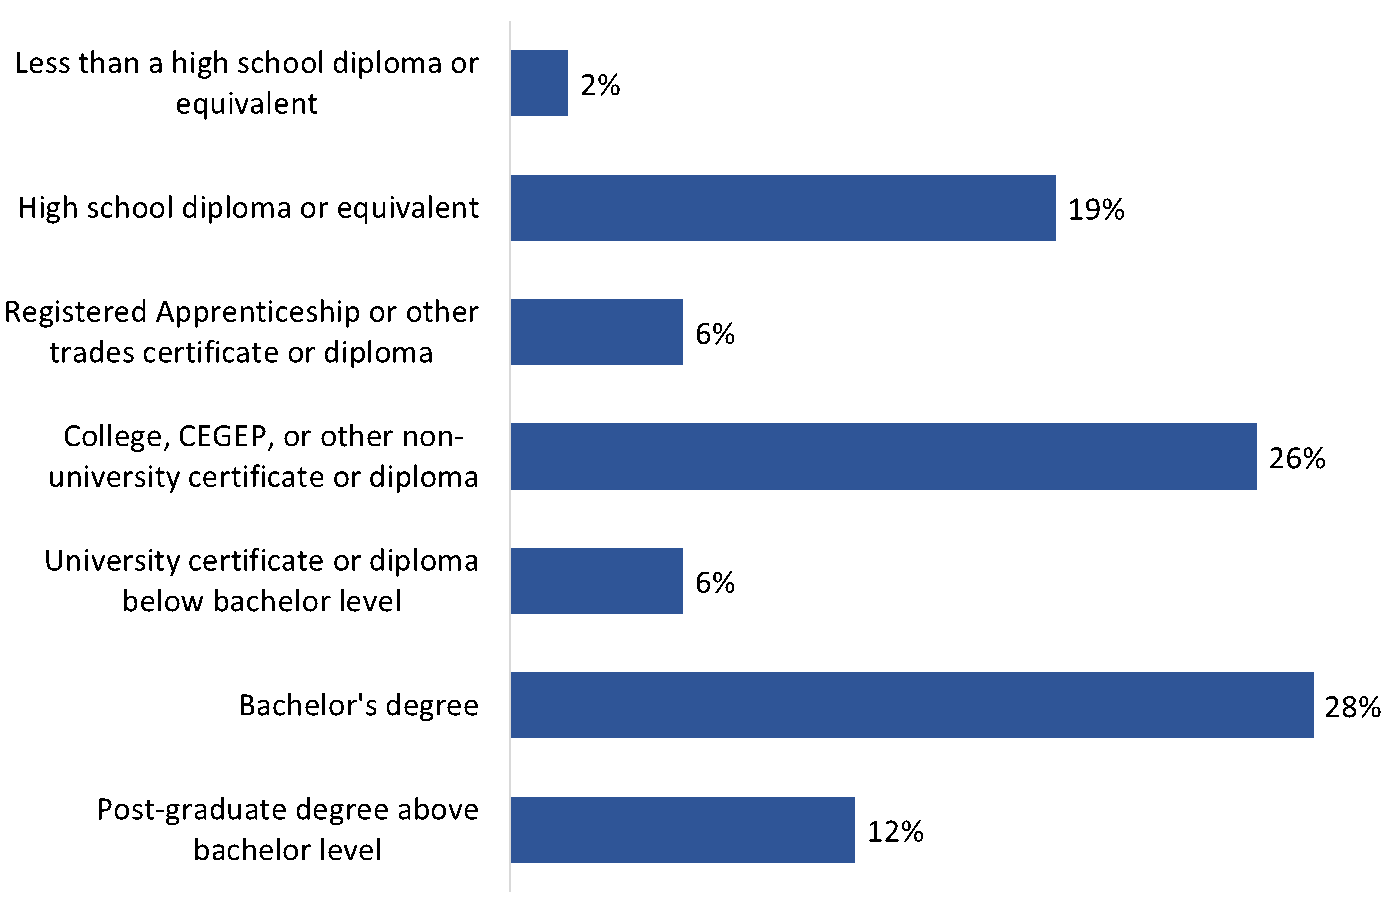
| Q52. What is the highest level of formal education that you have completed? | All respondents (n=1,872) |
|---|---|
| Less than a high school diploma or equivalent | 2% |
| High school diploma or equivalent | 19% |
| Registered Apprenticeship or other trades certificate or diploma | 6% |
| College, CEGEP, or other non-university certificate or diploma | 26% |
| University certificate or diploma below bachelor level | 6% |
| Bachelor's degree | 28% |
| Post-graduate degree above bachelor level | 12% |
Approximately half have a household income exceeding $60,000
Most respondents (72%) have a household income of $40,000 or greater, including just over half (54%) that earn $60,000 or more annually, from all sources for all household members. One in five (20%) said their total household income is under $40,000.
Figure 38: Household income
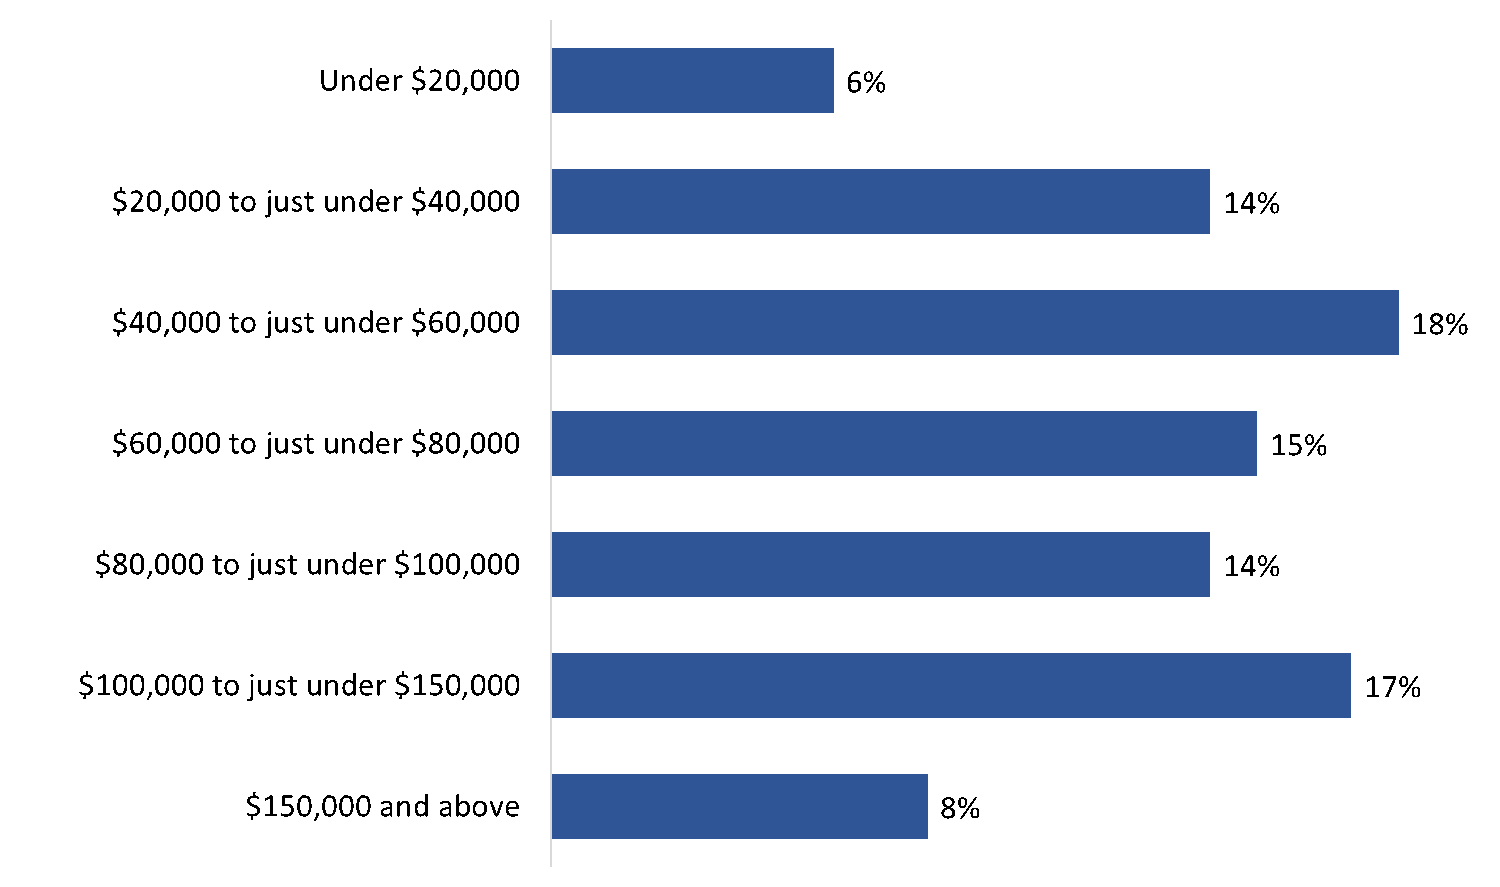
| Q53. Which of the following best describes your total household income last year, before taxes, from all sources for all household members? | All respondents (n=1,872) |
|---|---|
| Under $20,000 | 6% |
| $20,000 to just under $40,000 | 14% |
| $40,000 to just under $60,000 | 18% |
| $60,000 to just under $80,000 | 15% |
| $80,000 to just under $100,000 | 14% |
| $100,000 to just under $150,000 | 17% |
| $150,000 and above | 8% |
One-quarter are parents or guardians of children under 18, most are 6 or older
Twenty-seven percent of respondents are the parent or guardian of a child under 18. Among these respondents, the single largest proportion (43%) are parents or guardians to children between the ages of 6 and 11 years.
Figure 39: Parents or guardians of children under 18
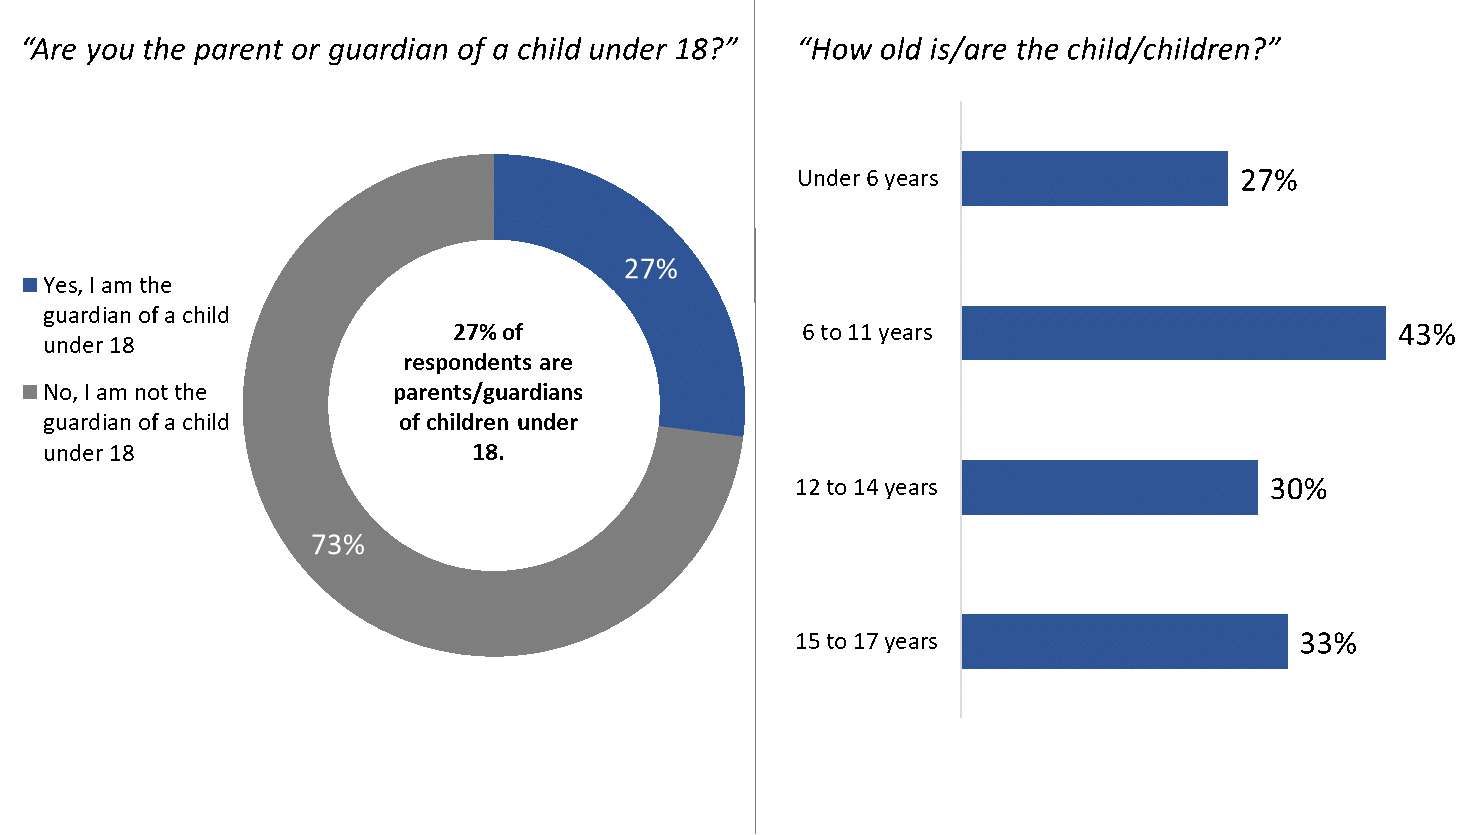
| [Left] Q1. Are you the parent or guardian of any child under 18 years of age living at home with you? | All respondents (n=1,872) |
|---|---|
| Yes, I am the guardian of a child under 18 | 27% |
| No, I am not the guardian of a child under 18 | 73% |
| [Right] Q2. How old is/are the child/children? | Parents or guardian of any child under 18 (n=512) |
|---|---|
| Under 6 years | 27% |
| 6 to 11 years | 43% |
| 12 to 14 years | 30% |
| 15 to 17 years | 33% |
Three-quarters are pet owners
Seventy-five percent of respondents are pet owners: 36% are dog owners and 34% are cat owners. Note: only dog and cat owners were included in the pet quota for the purposes of this survey.
Figure 40: Pet ownership
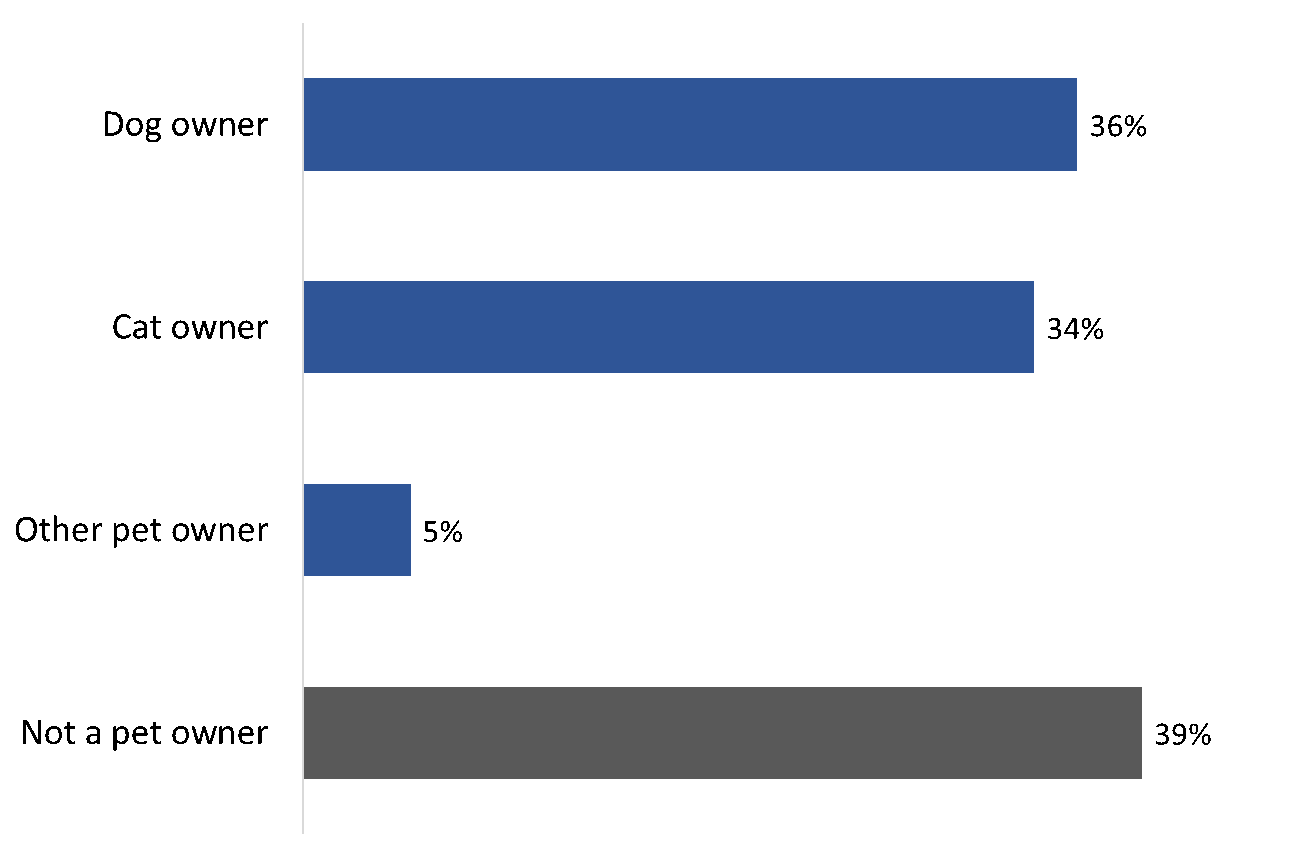
| Q3. Do you have a pet? | All respondents (n=1,872) |
|---|---|
| Dog owner | 36% |
| Cat owner | 34% |
| Other pet owner | 5% |
| Not a pet owner | 39% |
Most respondents garden or landscape, or participate in outdoor activities
Seventy-three percent of respondents garden or landscape (73%), followed by 59% who hike, walk in nature and/or trail run. Following this, 22% camp and 19% play sports outdoors on a field. The full range of outdoor activities can be found in figure 41.
Figure 41: Participation in outdoor activities
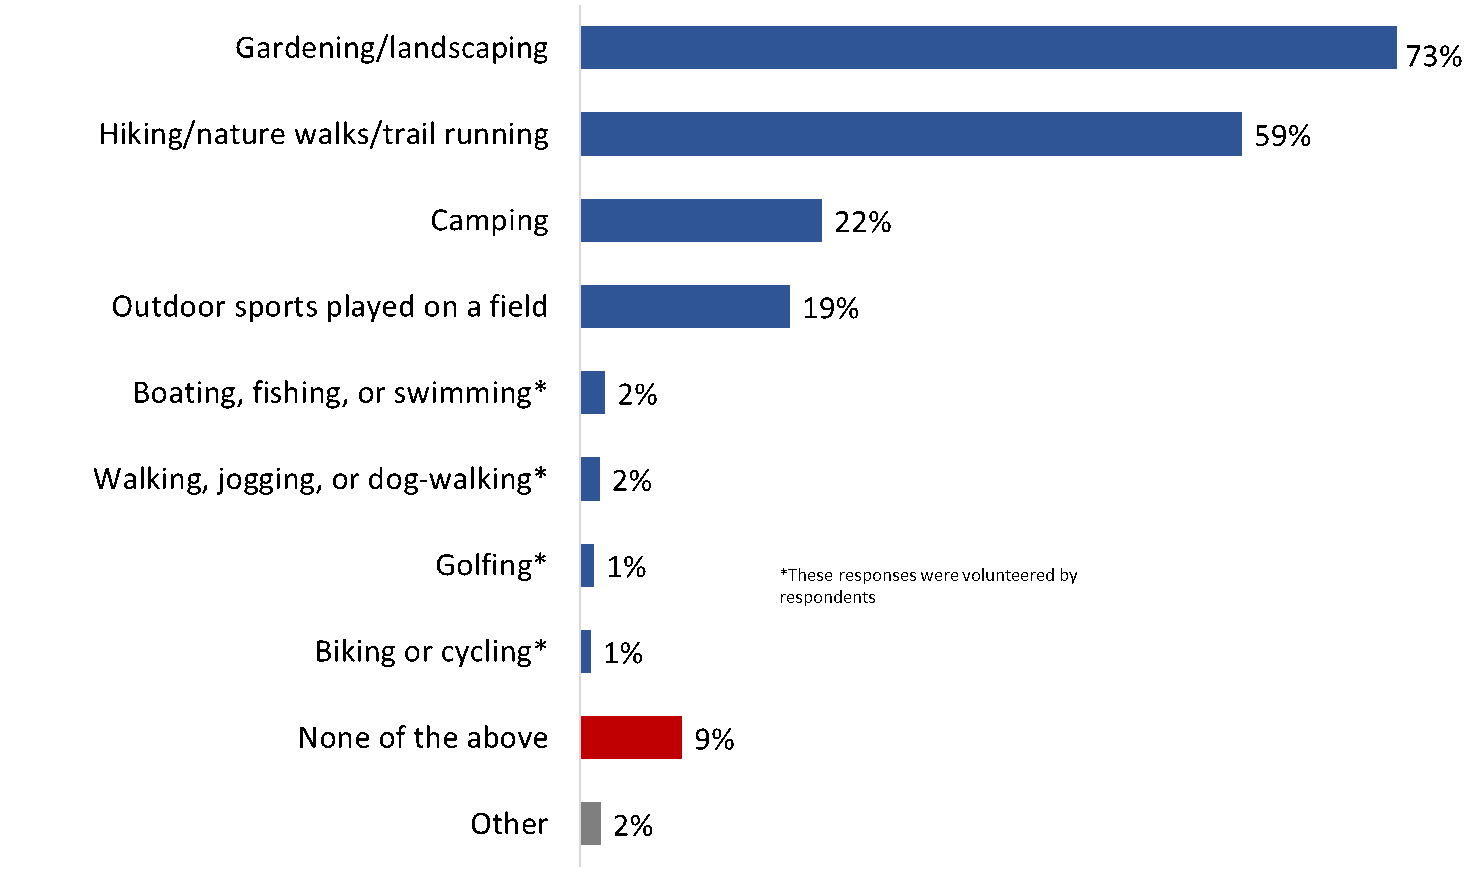
| Q4. In the last year, which of the following outdoor activities have you done? | All respondents (n=1,872) |
|---|---|
| Gardening/landscaping | 73% |
| Hiking/nature walks/trail running | 59% |
| Camping | 22% |
| Outdoor sports played on a field | 19% |
| Boating, fishing, or swimming | 2% |
| Walking, jogging, or dog-walking | 2% |
| Golfing | 1% |
| Biking or cycling | 1% |
| None of the above | 9% |
| Other | 2% |
Most participate in outdoor activities 10 or more times per year
With the exception of those who go camping, most others who hike (54%), play sports outdoors (54%), garden (67%), or participate in some other outdoor activity (71%) do so more than 10 or more times per year. In contrast, those who go camping say this is typically fewer than three times per year (43%), or between three and five times per year (33%).
Figure 42: Frequency engaging in outdoor activities
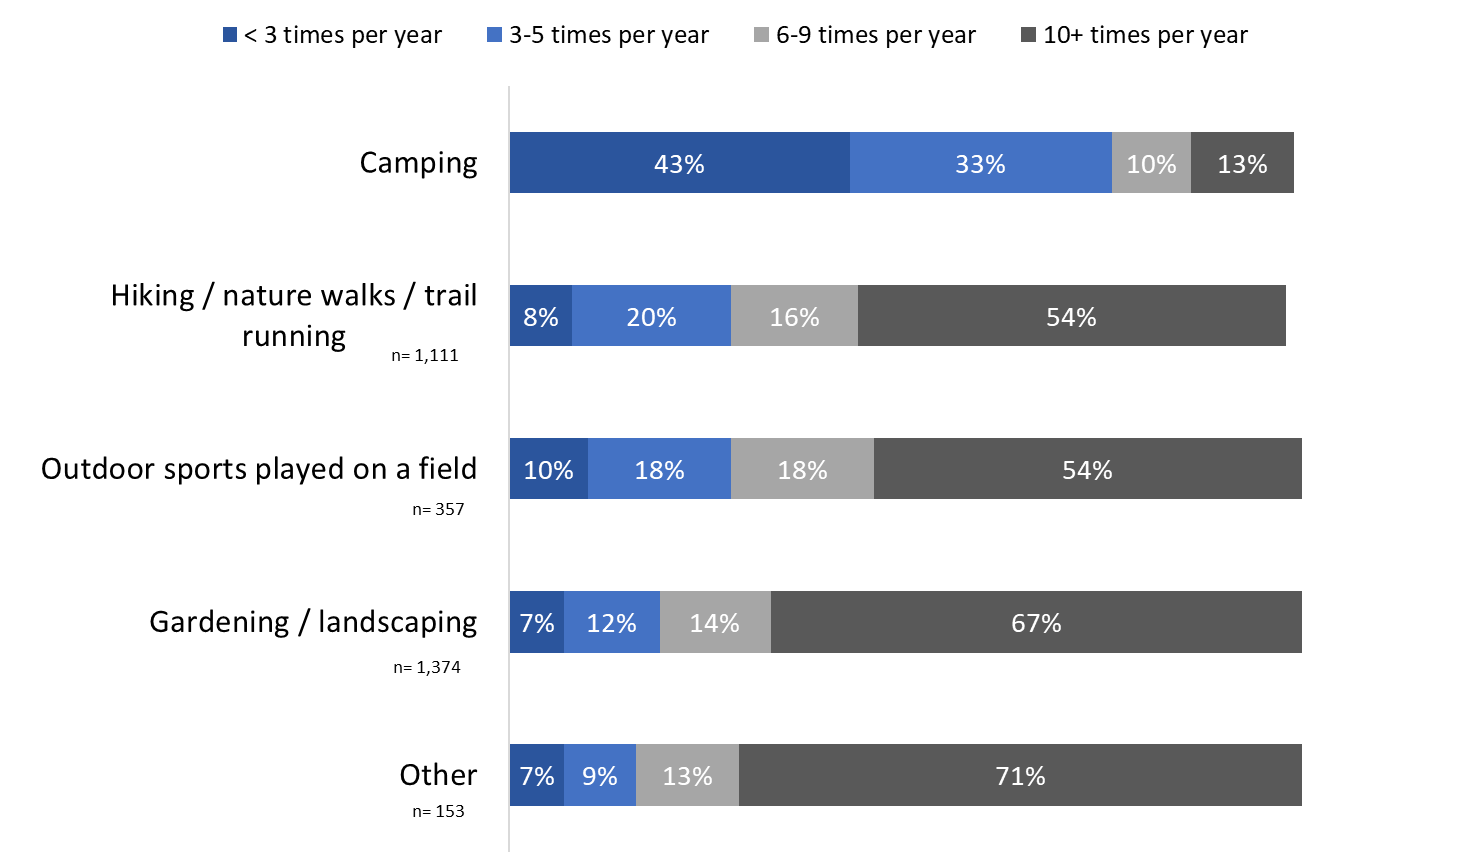
| Q5. In a typical year, how often do you engage in these outdoor activities? | Respondents who took part in outdoor activities last year | |||
|---|---|---|---|---|
| <3 times per year | 3-5 times per year | 6-9 times per year | 10+ times per year | |
| Camping (n=410) | 43% | 33% | 10% | 13% |
| Hiking / nature walks / trail running (n=1,111) | 8% | 20% | 16% | 54% |
| Outdoor sports played on a field (n=357) | 10% | 18% | 18% | 54% |
| Gardening / landscaping (n=1,374) | 7% | 12% | 14% | 67% |
| Other (n=153) | 7% | 9% | 13% | 71% |
Approximately half live in large urban population centres
Just under half of all respondents live in large urban population centres (49%) with a population greater than 100,000, followed by 21% who live in a medium population centre (population of 30,000 to 99,999), and 18% in a small population centre of 1,000 to 29,000 people. Fewer respondents live in rural areas with a population under 1,000 (12%).
Figure 43: Community size
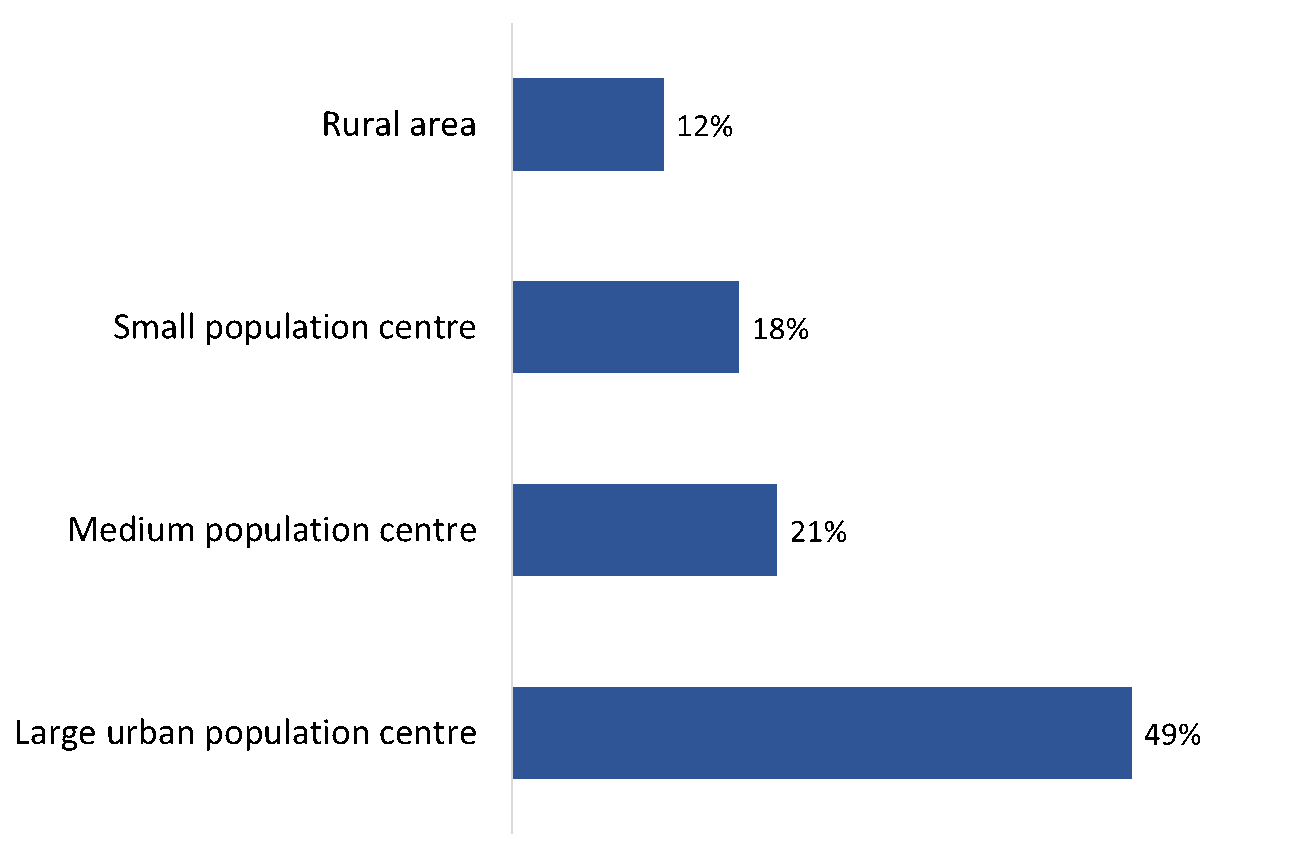
| Q6. Which of the following best describes the size of your community? | All respondents (n=1,872) |
|---|---|
| Rural area | 12% |
| Small population centre | 18% |
| Medium population centre | 21% |
| Large urban population centre | 49% |
Majority either working full-time or are retired
Among those surveyed, 39% work full-time and 35% are retired. Smaller proportions work part-time or are self-employed, are not in the workforce, are unemployed or are attending school full-time.
Figure 44: Employment status
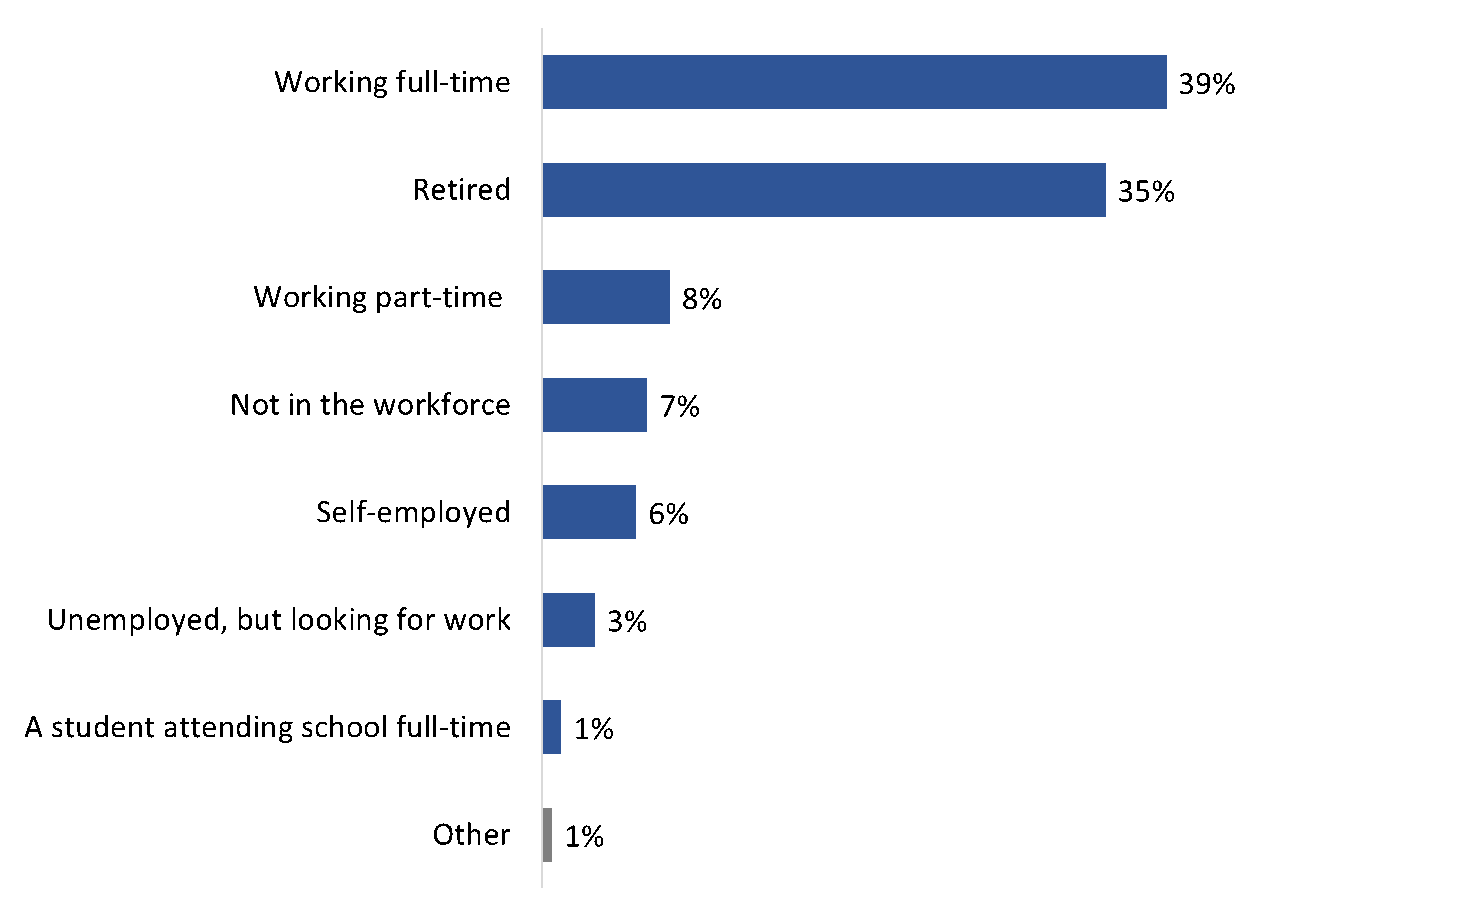
| Q7. Which of the following categories best describes your current employment status? | All respondents (n=1,872) |
|---|---|
| Working full-time | 39% |
| Retired | 35% |
| Working part-time | 8% |
| Not in the workforce | 7% |
| Self-employed | 6% |
| Unemployed, but looking for work | 3% |
| A student attending school full-time | 1% |
| Other | 1% |
Most do not work outdoors most of the day
A majority of respondents who work full time do not work outdoors most of the days (81%), while 19% work in an environment that requires them to be outdoors most or all of the day.
Figure 45 : Environmental exposure
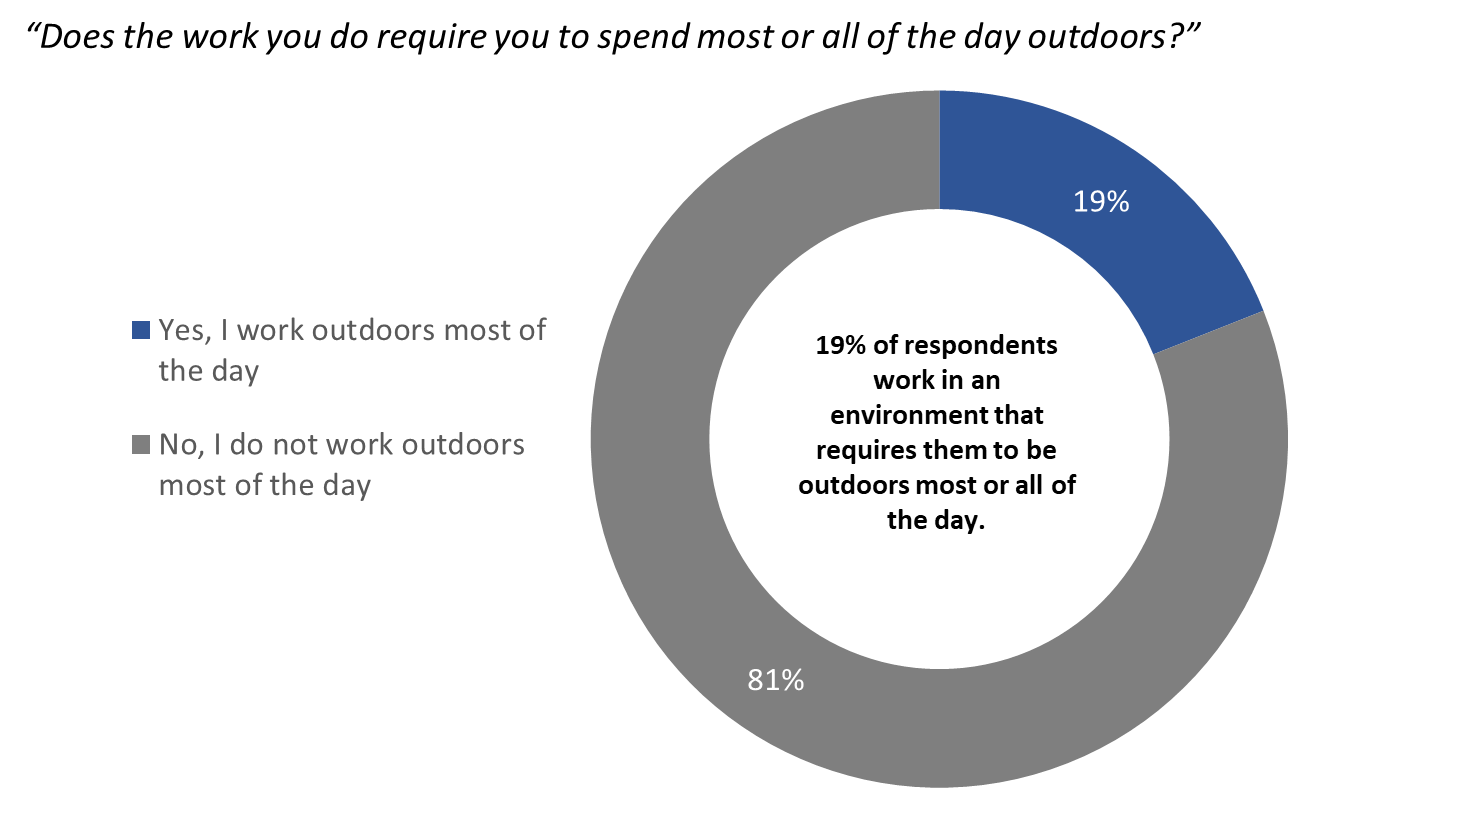
| Q8. Does the work you do require you to spend most or all of the day outdoors? | Respondents in the workforce (n=995) |
|---|---|
| Yes, I work outdoors most of the day | 19% |
| No, I do not work outdoors most of the day | 81% |
One in five with environmental exposure risk work in construction
Among those exposed to environmental risk at work, 20% work in the construction sector, followed by 10% who work in landscaping. The full list of sectors can be found in figure 46.
Figure 46: Environmental exposure – sector of work
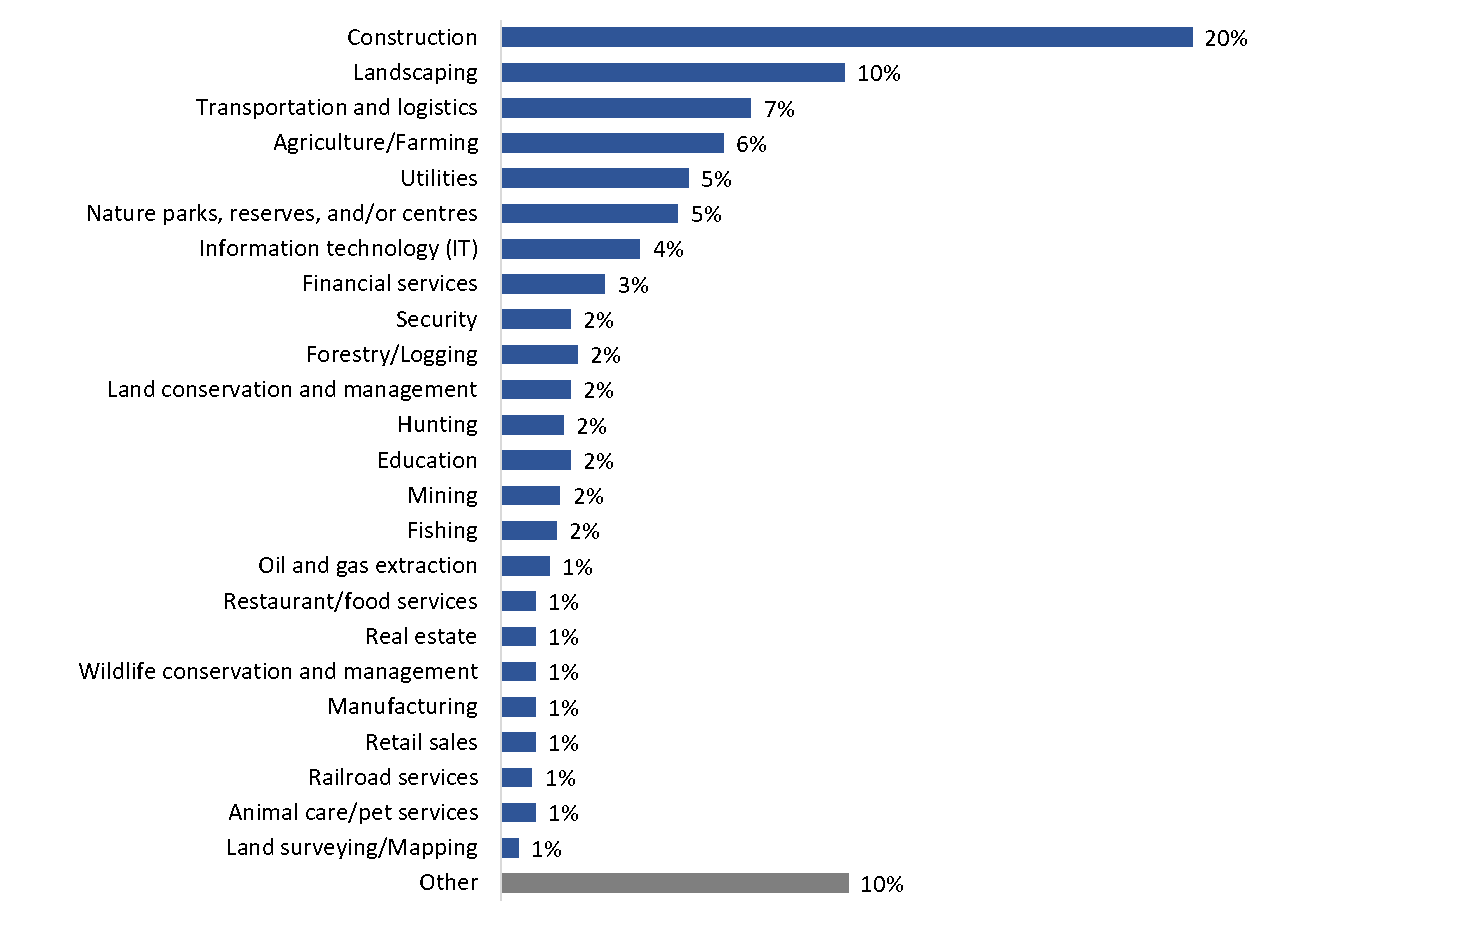
| Q9. Which of the following best describes the industry or sector you work in? | Respondents exposed to environmental exposures at work (n=188) |
|---|---|
| Construction | 20% |
| Landscaping | 10% |
| Transportation and logistics | 7% |
| Agriculture/Farming | 6% |
| Utilities | 5% |
| Nature parks, reserves, and/or centres | 5% |
| Information technology (IT) | 4% |
| Financial services | 3% |
| Security | 2% |
| Forestry/Logging | 2% |
| Land conservation and management | 2% |
| Hunting | 2% |
| Education | 2% |
| Mining | 2% |
| Fishing | 2% |
| Oil and gas extraction | 1% |
| Restaurant/food services | 1% |
| Real estate | 1% |
| Wildlife conservation and management | 1% |
| Manufacturing | 1% |
| Retail sales | 1% |
| Railroad services | 1% |
| Animal care/pet services | 1% |
| Land surveying/Mapping | 1% |
| Other | 10% |
Appendix
Technical Specifications
- An online survey was administered to 1,872 online panellists who met the eligibility requirements.
- The sample was drawn from Dynata's panel of online Canadians. Surveys that use samples drawn from online panels cannot be described as statistically projectable to the target population.
- Panellists were invited to participate in the survey through an email invitation which contained a password-protected URL to access the survey.
- All survey respondents were informed that their participation was voluntary, and that information collected was protected under the authority of privacy legislation.
- Sponsorship of the study was revealed (i.e., the Government of Canada).
- Panellists were rewarded for taking part in the survey per the panel's incentive program, which is structured to reflect the length of survey and the nature of the sample.
- The survey averaged 15 minutes to complete, and the fieldwork was conducted between August 4 and August 15, 2021.
- The survey questionnaire was programmed using computer-assisted web interviewing (CAWI) technology. The programming was tested for skip logic by the initial programmer, as well as by a second senior programmer.
- Following survey best practices, the questionnaire was pre-tested in advance of the fieldwork to ensure that it measured what it was intended to measure. There was a minimum of 10 completions in each official language and a total of 29 completed surveys. No issues were identified during the pre-test.
- Following the fieldwork, the data were cleaned and checked using SPSS syntax. The review assessed response ranges and the length of time taken to complete the survey to identify any respondent who took an unreasonably short time answering, who "straightlined" responses. Any cases flagged for data quality were replaced prior to the weighting and tabulation of the data.
- Survey data was weighted by forward sortation area (FSA) to reflect the demographic composition of the target population. The source of the weights was 2020 FSA and Census Subdivision (CSD) data provided by Health Canada.
- Because the sample is based on those who initially self-selected for participation in the panel, no estimates of sampling error can be calculated. In addition, it is possible that non-response has introduced bias into the final survey sample.
- The participation rate was 9%, calculated using the formula outlined in the Standards for the Conduct of Government of Canada Public Opinion Research (Online Surveys).
| Response Rate = R/(U+IS+R) | |
|---|---|
Total Sample Used |
*26,001 |
Unresolved (U) |
23,268 |
In-scope non-responding units (IS) |
348 |
Respondent break-off/did not complete the survey |
348 |
Responding units (R) |
2,385 |
Completed survey |
1872 |
Disqualified – Age |
19 |
Disqualified – Postal Code |
102 |
Disqualified – Participated in a GC survey in the previous 30 days |
286 |
Disqualified – Does not meet any target population quota |
106 |
Participation Rate = R/(U+IS+R) |
9% |
All steps of the project complied with market research industry standards and the Standards for the Conduct of Government of Canada Public Opinion Research.
Survey Questionnaire
Page 1: Landing Page
Please select the language in which you wish to complete the survey.
- English
- French
[NEXT]
Page 2: Survey Intro Page
Thank you for agreeing to take part in this short survey. We anticipate that the survey will take up to 15 minutes to complete.
Background information
This research is being conducted by Phoenix Strategic Perspectives (Phoenix SPI), a Canadian public opinion research firm, on behalf of Public Health Agency of Canada (PHAC).
The purpose of this online survey is to collect feedback that will be used to help inform a public education campaign.
How does the online survey work?
- Your participation in the survey is completely voluntary and confidential.
- Your decision on whether or not to participate will not affect any dealings you may have with the Government of Canada, now or in future.
What about your personal information?
- Please be assured that all opinions will remain anonymous and will not be attributed to you personally in any way.
- The personal information you will provide to PHAC is governed in accordance with the Privacy Act and is being collected under the authority of section 4 of the Department of Health Act in accordance with the Treasury Board Directive on Privacy Practices. For more information, click here.
- Your personal information will be collected by Phoenix SPI in accordance with the applicable provincial privacy legislation or the Personal Information Protection and Electronic Documents Act (PIPEDA).
What happens after the online survey?
The final report written by Phoenix SPI will be available to the public through Library and Archives Canada.
If you have any questions about the survey, you may contact Phoenix SPI at research@phoenixspi.ca.
Your participation is greatly appreciated, and we look forward to receiving your feedback.
[CONTINUE]
Page 3: Reminders
On each screen, after selecting your answer, click on the "Next" button at the bottom of the screen to move forward in the survey. If you leave the survey before completing it, you can return to the survey URL later, and you will be returned to the page where you left off. Your answers up to that point in the survey will be saved.
PROGRAMMING NOTES:
ALL SURVEY QUESTIONS TO BE PRESENTED 1 QUESTION PER PAGE UNLESS OTHERWISE INDICATED.
SECTION TITLES SHOULD NOT APPEAR ON SCREEN FOR RESPONDENTS.
DO NOT PRESENT QUESTION NUMBERS.
INCLUDE A PROGRESS BAR.
ALL QUESTIONS ARE MANDATORY.
Screening
1. What is your age?
01 [TEXT BOX]
99 Prefer not to answer [ASK QSCR1a]
TERMINATE IF UNDER 18
TERMINATION MESSAGE [AGE]:
Thank you very much for your interest in completing this survey. Unfortunately you must be at least 18 years of age to take part in this survey.
SCR1a. Would you be willing to indicate in which of the following age categories you belong?
01 Under 18 [TERMINATE]
02 18 to 24
03 25 to 34
04 35 to 44
05 45 to 54
06 55 to 64
07 65 or older
99 Prefer not to answer [TERMINATE]
TERMINATION MESSAGE [AGE]:
Thank you very much for your interest in completing this survey. Unfortunately you must be at least 18 years of age to take part in this survey.
2. What is your postal code?
01 [OPEN; TEXT – VALIDATE AGAINST LIST]
99 Prefer not to answer
SCR2a. [IF SCR2=99] What are the first three digits of your postal code?
01 [OPEN; TEXT – VALIDATE AGAINST LIST]
99 Prefer not to answer [TERMINATE]
3. In the previous 30 days, have you participated in?
Select all that apply
01 A Government of Canada survey
02 A survey on Lyme disease or ticks
03 None of the above [CONTINUE; TERMINATE IF SCR3=01-02]
TERMINATION MESSAGE [GENERAL]:
Thank you very much for your interest in completing this survey. Unfortunately you are not eligible for this survey.
Quotas
1. Are you the parent or guardian of any child under 18 years of age living at home with you?
01 Yes
02 No
03 Prefer not to answer
2. [IF Q1=01] How old is/are the child/children?
Select all that apply
01 Under 6 years of age [PARENT QUOTA]
02 6 to 11 years [PARENT QUOTA]
03 12 to 14 years [PARENT QUOTA]
04 15 to 17 years
99 Prefer not to answer
3. Do you have a pet?
Select all that apply
01 No
02 Yes, a dog [PET QUOTA]
03 Yes, a cat [PET QUOTA]
04 Yes, other
99 Prefer not to answer [TERMINATE]
4. In the last year, which of the following outdoor activities have you done?
Select all that apply
01 Gardening and/or landscaping (mowing lawn, raking leaves, etc.)
02 Hiking/nature walks/trail running
03 Outdoor sports played on a field (soccer, baseball, football, etc.)
04 Camping
05 None of the above
06 Other – Please specify:
99 Prefer not to answer
5. [SKIP IF Q4=07,99] In a typical year, how often do you engage in these outdoor activities?
[GRID LAYOUT]
[ROWS: ITEMS FROM Q4]
[COLUMNS: RESPONSE OPTIONS]
01 Less than 3 times per year
02 3-5 times per year [OUTDOOR ENTHUSIAST QUOTA]
03 6-9 times per year [OUTDOOR ENTHUSIAST QUOTA]
04 10 or more times per year [OUTDOOR ENTHUSIAST QUOTA]
99 Prefer not to answer
6. Which of the following best describes the size of your community?
01 Rural area (less than 1,000 people) [RURAL QUOTA]
02 Small population centre (1,000 to 29,999 people) [RURAL QUOTA]
03 Medium population centre (30,000 to 99,999 people)
04 Large urban population centre (100,000+ people)
99 Prefer not to answer
7. Which of the following categories best describes your current employment status?
01 Working full-time (35 or more hours per week)
02 Working part-time (less than 35 hours per week)
03 Self-employed
04 Unemployed, but looking for work
05 A student attending school full-time
06 Retired
07 Not in the workforce [Full-time homemaker, unemployed, not looking for work]
08 Other
99 Prefer not to answer
8. [IF Q7=01,02,03] Does the work you do require you to spend most or all of the day outdoors?
01 Yes [ENVIRONMENTAL EXPOSURE QUOTA]
02 No [TERMINATE IF DOES NOT MEET ANY OTHER QUOTA]
99 Prefer not to answer [TERMINATE IF DOES NOT MEET ANY OTHER QUOTA]
QUOTA TERMINATION MESSAGE:
Thank you very much for your willingness to complete this survey. We're sorry, but at this time we've already received a sufficient number of completed surveys from people with a similar profile to yours.
9. [IF Q8=01] Which of the following best describes the industry or sector you work in?
- Agriculture/Farming [NAICS #11] (Footnote 15)
- Forestry/Logging [NAICS #11]
- Fishing [NAICS #11]
- Hunting [NAICS #11]
- Oil and gas extraction [NAICS #21] (Footnote 16)
06 Mining [NAICS #21]
07 Utilities [NAICS #22]
08 Construction [NAICS #23]
09 Landscaping [NAICS #56] (Footnote 17)
10 Land surveying/Mapping [NAICS #54] (Footnote 18)
11 Railroad services [NAICS #48-49] (Footnote 19)
12 Wildlife conservation and management [NAICS #91] (Footnote 20)
13 Land conservation and management [NAICS #91]
14 Nature parks, reserves and/or centres [NAICS #71] (Footnote 21)
15 Other - Please specify:
99 Prefer not to say
General Knowledge + Awareness
10. Have you heard of Lyme disease?
01 Yes
02 No
99 Prefer not to answer
11. [IF Q10=01] Where did you hear about Lyme disease?
Select all that apply
01 [DO NOT SHOW IF Q3=01,99] My pet's veterinarian
02 My doctor
03 A pamphlet or handout
04 Municipal government
05 Provincial government
06 Federal government
07 Local news
08 Friends or family
09 Internet search
10 Social media
11 Advertisement
12 Other - Please specify:
99 I can't recall
12. How do you think you get Lyme disease?
[OPEN TEXT BOX]
02 I don't know
You can get Lyme disease if you are bitten by an infected blacklegged tick. The blacklegged ticks that transmit Lyme disease can also carry other tick-borne diseases, such as anaplasmosis or babesiosis.
13. To the best of your knowledge:
[GRID LAYOUT]
[ROWS]
- Are ticks present in your area?
- Can ticks be found within urban and suburban areas?
- Does visiting an outdoor venue, such as a park, trail, or sports field, put someone at risk of getting bitten by a tick?
[COLUMNS: RESPONSE OPTIONS]
01 Yes
02 No
99 Prefer not to answer
14. Do you know what to do if you or someone you know is bitten by a tick?
01 Yes
02 No
99 Prefer not to answer
15. [IF Q14=01] What would you do if you or someone you know is bitten by a tick?
[OPEN TEXT BOX]
02 I don't know
16. What do you think is the best way to remove a tick attached to your skin or someone else's skin?
[ROTATE ITEMS]
01 With tweezers
02 Twisting it off
03 Flicking it
04 Squish it
05 I don't know [ANCHOR]
[NEW SCREEN]
Tick Removal
To remove a tick, use clean, fine-point tweezers to grasp the head as close to the skin as possible and slowly pull straight out. Try not to twist or squeeze the tick. Ticks firmly attach their mouthparts into the skin which requires slow but firm traction to remove them.
17. To the best of your knowledge, which of the following are common symptoms associated with Lyme disease?
Select all that apply
[ROTATE ITEMS]
01 Fever
02 Rash
03 Headache
04 Fatigue
05 Muscle ache
06 Joint pain
07 Cough
08 Vomiting
09 I don't know [ANCHOR]
18. How long after being bitten by a tick do symptoms associated with Lyme disease typically appear?
01 Within the same day
02 1 to 2 days later
03 3 to 30 days later
04 2 to 12 months later
05 More than a year later
06 I don't know
Perceptions of Risk
19. How concerned are you that you, or members of your immediate family, might get Lyme disease or other tick-borne diseases?
01 Not at all concerned
02 Not very concerned
03 Moderately concerned
04 Very concerned
99 Prefer not to answer
20. In your view, how important of an issue is Lyme disease and other tick-borne diseases to Canadians?
01 Not at all important
02 Not very important
03 Moderately important
04 Very important
99 Prefer not to answer
21. Based on what you may have seen, read or heard recently, does Lyme disease…
01 Receive too much attention
02 Receive about the right amount of attention
03 Not receive enough attention
04 I don't know
Preventative Measures: Knowledge + Behaviours
22. Do you know what to do to help protect yourself from being bitten by a tick?
01 Yes
02 No
23. What precautions, if any, do you take to protect yourself from ticks?
Select all that apply
[ROTATE ITEMS]
01 Use insect repellent
02 Wear light-coloured clothing
03 Pull socks over pants
04 Wear long-sleeved shirts
05 Wear pants
06 Wear a hat
07 Wear permethrin-treated clothing
08 Avoid areas with ticks, such as wooded or high grassy areas
09 Check my body for ticks
10 Take a shower after coming back from outside
11 Other – please specify: [ANCHOR]
12 I don't take precautions [ANCHOR]
99 Prefer not to answer [ANCHOR]
24. [IF A PARENT] What precautions, if any, do you take to protect your child/children from ticks?
Select all that apply
[ROTATE ITEMS]
01 Apply insect repellent to my child/children or remind them to do so before going outdoors
02 Dress or remind my child/children to dress themselves to cover exposed skin
03 Dress or remind my child/children to dress themselves in light-coloured clothing
04 Put a hat on my child/children or remind them to do so
06 Avoid areas with ticks, such as wooded or high grassy areas
07 Check or remind my child/children to check themselves for ticks
08 Have my child/children take a shower after coming back from outside or remind them to do so
09 Talk about ticks and prevention measures with my child/children
10 Other – please specify: [ANCHOR]
11 I don't take precautions [ANCHOR]
99 Prefer not to answer [ANCHOR]
25. [IF Q23=12 AND, FOR PARENTS, IF Q23 AND Q24=11] What is stopping you from taking precautions to reduce the chance of being bitten by a tick?
Select all that apply
[ROTATE ITEMS]
01 Lack of information
02 Lack of resources
- Please specify: What type of resources?
03 The cost of gear/appropriate outdoor clothing
03 I trust myself to not get bitten
04 I don't think there are ticks in my area
05 I don't view Lyme disease and other tick-borne diseases as a serious threat
06 Nothing; I just haven't done so [ANCHOR]
07 Other – please specify: [ANCHOR]
99 Prefer not to answer [ANCHOR]
26. [IF Q23=01 OR Q24=01] You mentioned that you use insect repellent. Which type of insect repellent do you typically use?
Select all that apply
[ROTATE ITEMS]
01 Chemical Free/Natural such as essential oils
02 DEET
03 Icaridin
04 Candles/torches (e.g., citronella)
05 Wearable repellent devices (e.g., wristbands, stickers, clip-on foggers)
06 Sonic, heat dispersed, or light bulb repellents
07 Coils
08 Fans
09 Nets/netting
10 Smoke repellent
05 I don't know [ANCHOR]
27. [IF Q26=01,02,03] Where do you usually apply insect repellent?
Select all that apply
[ROTATE ITEMS]
01 Face
02 Neck
03 Hair
04 Arms
05 Hands
06 Legs
07 Feet
08 Clothing
09 Other – please specify: [ANCHOR]
99 Prefer not to answer [ANCHOR]
28. You mentioned that you check [IF ONLY Q23=09 'your body', IF ONLY Q24=07 'your child/children's' IF Q23=09 AND Q24=07 'yours/your child/children's' for ticks as a precaution. How often do you typically do this after spending time outdoors? Please include all types of outdoor activities, from hiking and camping, to playing sports and running, to gardening or walking your pet?
01 Always
02 Often
03 Sometimes
04 Only when doing certain types of outdoor activities
04a: Please specify what type of activities? [TEXT]
05 I don't know
29. When travelling outside of your area of residence for an outdoor activity such as hiking or camping, how aware are you of the potential risk of ticks and tick-borne diseases in the area you are travelling to?
01 Very aware
02 Moderately aware
03 Not very aware
04 Not at all aware
99 Prefer not to answer
30. Do you live in a home that requires you to maintain the exterior of the property (e.g., a yard, garden, balcony, etc.)? This could be a detached home, a semi-detached home, a townhouse, a condominium/condo, or an apartment.
01 Yes
02 No
99 Prefer not to answer
31. [IF Q30=01] Have you ever taken preventative measures to reduce ticks on your property? This could include things like mowing the lawn frequently, raking leaves, or using insect controls.
01 Yes
02 No
03 I don't know
32. [IF Q31=02] Why haven't you taken preventative action to reduce ticks on your property?
Select all that apply
[ROTATE ITEMS]
01 I didn't know it was possible to reduce ticks
02 Lack of information on what to do
03 I don't have enough time
04 It's too expensive
05 Ticks are not a serious issue
06 No need
09 Other – please specify: [ANCHOR]
99 Prefer not to answer [ANCHOR]
Knowledge about Pets in Relation to Tick Bites and Lyme Disease
[ONLY ASK PET OWNERS]
33. To the best of your knowledge, is it possible for your pet to be infected with Lyme disease?
01 Yes
02 No
- I don't know
34. How often do you check your pet(s) for ticks and other bugs after they have spent time outdoors?
01 Always
02 Often
03 Sometimes
04 Never
05 I don't know
06 My pet does not go outside
Workplace Exposure and Information
[ONLY ASK THOSE AT RISK OF ENVIRONMENTAL EXPOSURE]
35. You mentioned that your job requires you to spend most or all of your working hours outdoors. Has your employer provided any information or training on the steps to take to avoid tick bites while on the job?
01 Yes
02 No
03 I don't know
36. Does your employer provide any personal protective equipment, such as insect repellents, insecticides, or protective clothing?
01 Yes
02 No
03 I don't know
37. How well informed do you feel you are about how to protect yourself from tick bites and tick-borne diseases while on the job?
01 Not at all informed
02 Not very informed
03 Moderately informed
04 Very well informed
99 Prefer not to answer
Information Sources
[EVERYONE]
38. Have you ever looked for any information on Lyme disease or other tick-borne diseases?
01 Yes
02 No, but I plan to in the coming weeks
02a: Please specify why you plan to?
03 No, and I don't plan to
99 Prefer not to answer
39. [IF Q38=02,03] Why have you not looked for information on Lyme disease or other tick-borne diseases?
Select all that apply
[ROTATE ITEMS]
01 I don't have any need for this information
02 I didn't know this type of information was available
03 I wasn't aware of Lyme disease before this survey
04 I don't know where to get the information
05 I don't have time to look for this information
06 I have trouble understanding this type of information
07 The information I found was conflicting
08 No need; I am ready well-informed about Lyme disease and other tick-borne diseases
08 Other – please specify: [ANCHOR]
99 Prefer not to answer [ANCHOR]
40. [IF Q38=01] What topics related to Lyme disease or other tick-borne diseases do you typically look for?
Select all that apply
[ROTATE ITEMS]
01 Symptoms
02 Causes
03 Areas where ticks can be found
04 Prevention
05 Treatment
06 Other – please specify: [ANCHOR]
99 Prefer not to answer [ANCHOR]
41. Where do you typically get information on health-related issues in general?
Select all that apply
[ROTATE ITEMS]
01 Health care professional such as a physician/family doctor/nurse practitioner
02 Friends
03 Family
04 Social Media [DROPDOWN]
- YouTube
- TikTok
- Other: Please specify: [TEXT]
05 Google or other search engine
06 Pharmacist/pharmacy
07 City/municipal public health unit
08 Medical websites
09 Other – please specify: [ANCHOR]
99 Prefer not to answer [ANCHOR]
42. [IF Q4=02,03,04] Where do you typically get information on outdoor activities, including camping, sports and fitness activities?
Select all that apply
[ROTATE ITEMS]
01 Social Media [DROPDOWN]
- YouTube
- TikTok
- Other: Please specify: [TEXT]
02 Google or other search engine
03 Podcasts
04 Wikipedia
05 Company website
06 Magazines
07 Books
08 TV programs
09 Influencers
08 Other – Please specify: [ANCHOR]
99 Prefer not to answer [ANCHOR]
43. [IF Q4=01] Where do you typically get information on home gardening?
Select all that apply
[ROTATE ITEMS]
01 Social Media [DROPDOWN]
- YouTube
- TikTok
- Other: Please specify: [TEXT]
02 Google or other search engine
03 Podcasts
04 Wikipedia
05 Company website
06 Magazines
07 Books
08 TV programs
09 Influencers
08 Other – Please specify: [ANCHOR]
99 Prefer not to answer [ANCHOR]
Testing of Materials
The Public Health Agency of Canada is developing a set of advertisements to educate Canadians about ticks and Lyme disease. We'd like your feedback on the advertising materials.
44. Here is an information postcard. To what extent do you agree or disagree with the following statements about the information postcard?
[DISPLAY_IMAGE_POSTCARD]
[GRID]
[ROTATE ROWS]
a. The design catches my attention.
b. The information is relevant to me.
c. The information is easy to understand.
d. I feel more confident, I know how to protect myself from tick bites.
[OPTIONS]
01 Strongly agree
02 Somewhat agree
03 Somewhat disagree
04 Strongly disagree
05 Don't know
45. After having seen this information postcard, how likely are you to do the following?
[GRID]
[ROTATE ROWS]
a. Search online for more information about Lyme disease.
b. Take steps to protect myself when outdoors.
c. Go to the Government of Canada website.
[OPTIONS]
01 Very likely
02 Somewhat likely
03 Somewhat unlikely
04 Very unlikely
05 Don't know
46. Do you recall ever having seen this web banner ad?
[DISPLAY_BANNER]
01 Yes
02 No
03 I don't know
47. To what extent do you agree or disagree with the following statements about the web banner ad?
[DISPLAY_IMAGE_WEB_BANNER]
[GRID]
[ROTATE ROWS]
a. The design and text catch my attention.
b. The information is relevant to me.
c. I want to learn more about ticks and Lyme disease.
01 Strongly agree
02 Somewhat agree
03 Somewhat disagree
04 Strongly disagree
98 Don't know
48. Now, here are 4 Instagram Stories. Please take a look at each and rank them in order of preference. In the box beside each image, please assign a rank of 1 to 4 with "1" being the post you would be most likely to notice as an Instagram Story and "4" being the post you would be the least likely to notice.
| INSTAGRAM_A_QUESTION | INSTAGRAM_B_GAME | INSTAGRAM_C_STORY | INSTAGRAM_D_SOCKS |
|---|---|---|---|
| 01 Story – A | 02 Story – B | 03 Story – C | 04 Story – D |
49. Why do you like this post best?
[DISPLAY POST]
[OPEN TEXT BOX]
02 I don't know
Demographics
These last few questions will be used for statistical purposes only.
50. How do you identify your gender? This may be different from the information noted on your birth certificate or other official documents.
01 Male
02 Female
03 Other
99 Prefer not to answer
51. What is your ethnic or cultural background?
01 Caucasian/white
02 Indigenous
03 East Asian [DROPDOWN—alphabetical order]
- Chinese
- Japanese
- Korean
- Taiwanese
- Other – Please specify:
- South Asian [DROPDOWN—alphabetical order]
- Bangladeshi
- Bengali
- Bruneian
- Gujarati
- East Indian
- Indo Pakistani
- Mauritian
- Mayotte
- Mongolian
- Pakistani
- Punjabi
- Singhalese
- Sri Lankan
- Tamil
- Other – Please specify:
- Southeast Asian [DROPDOWN—alphabetical order]
- Filipino
- Vietnamese
- Cambodian
- Malaysian
- Laotian
- Indonesian
- Singaporean
- Burmese
- Kampuchean
- Thai
- Other – Please specify:
- West Asian [DROPDOWN—alphabetical order]
- Palestinian
- Lebanese
- Iranian
- Other – Please specify:
07 Arab
08 Black [DROPDOWN—alphabetical order]
- African
- Caribbean
09 Latin American
10 Other – Please specify:
99 Prefer not to answer
52. What is the highest level of formal education that you have completed?
01 Less than a high school diploma or equivalent
02 High school diploma or equivalent
03 Registered Apprenticeship or other trades certificate or diploma
04 College, CEGEP or other non-university certificate or diploma
05 University certificate or diploma below bachelor level
06 Bachelor's degree
07 Post-graduate degree above bachelor level
99 Prefer not to answer
53. Which of the following best describes your total household income last year, before taxes, from all sources for all household members?
01 Under $20,000
02 $20,000 to just under $40,000
03 $40,000 to just under $60,000
04 $60,000 to just under $80,000
05 $80,000 to just under $100,000
06 $100,000 to just under $150,000
07 $150,000 and above
99 Prefer not to answer
Completion Page
That concludes the survey. Thank you very much for your feedback. The results will be available on the Library and Archives Canada website in the coming months.
We invite you to subscribe to the Lyme and Other Tick-Borne Diseases e-mail list. This e-mail service provides a way for you to receive information about federal Lyme disease and other tick-borne disease projects and initiatives, as well as opportunities for engagement, collaboration and involvement.
For information on tick bite prevention and tick-borne diseases: www.canada.ca/lymedisease
Footnotes
Footnote 1
The target sample size was n=2,000. The fieldwork ended early due to the 44th general election.
Footnote 2
This was determined based on postal codes. Health Canada provided a list of postal codes located in higher risk areas.
Footnote 3
This includes people who garden, hike, trail run, play sports outdoors, or camp three or more times in a typical year.
Footnote 4
This includes people whose work requires them to spend most or all of the day outdoors.
Footnote 5
This includes rural areas (less than 1,000 people) and small population centres (1,000 to 29,999 people).
Footnote 6
Source: "Surveillance of Lyme disease"; [Retrieved: November 2021] https://www.canada.ca/en/public-health/services /diseases/lyme-disease/surveillance-lyme-disease.html.
Footnote 7
The target sample size was n=2,000. The fieldwork ended early due to the 44th general election.
Footnote 8
This was determined based on postal codes. Health Canada provided a list of postal codes located in higher risk areas.
Footnote 9
This includes people who garden, hike, trail run, play sports outdoors, or camp three or more times in a typical year.
Footnote 10
This includes people whose work requires them to spend most or all of the day outdoors.
Footnote 11
This includes rural areas (less than 1,000 people) and small population centres (1,000 to 29,999 people).
Footnote 12
The fieldwork ended early due to the 44th general election, which resulted in some quotas not being met.
Footnote 13
This option was only presented to pet owners.
Footnote 14
When selecting "chemical free/natural", respondents were most likely thinking about "DEET free" repellents. However, because "DEET free" was not a specific response option for this question, the report refers to these responses as "chemical free/natural".
Footnote 15
NAICS Label: Agriculture, Forestry, Fishing and Hunting
Footnote 16
NAICS Label: Mining, Quarrying, and Oil and Gas Extraction
Footnote 17
NAICS Label: Administrative and support, waste management and remediation services
Footnote 18
NAICS Label: Professional, scientific and technical services
Footnote 19
NAICS Label: Transportation and warehousing
Footnote 20
NAICS Label: Public administration
Footnote 21
NAICS Label: Arts, entertainment and recreation