Text description
HEALTH CANADA ADVISES
MISE EN GARDE DE SANTÉ CANADA
Alcohol causes cancer including breast and colon cancers
L'alcool case le cancer y compris le cancer du sein et du côlon
Supplier Name: Nanos Research
Contract Number: CW2242531
Contract Value: $296,738.57 (including HST)
Award Date: 2022-09-07
Delivery Date: 2023-08-02
Registration number: POR-055-22
For more information on this report, please contact Health Canada at: HC.cpab.por-rop.dgcap.SC@canada.ca.
Ce rapport est aussi disponible en français
Prepared for Health Canada by Nanos Research
August 2023
This publication may be reproduced for non-commercial purposes only. Prior written permission must be obtained from Health Canada. For more information on this report, please contact Health Canada at: HC.cpab.por-rop.dgcap.SC@canada.ca.
© His Majesty the King in Right of Canada, as represented by the Minister of Public Services and Procurement Canada, 2023.
Communications Branch
Health Canada
200 Eglantine Driveway
AL 1915C, Tunney's Pasture
Ottawa, ON K1A 0K9
Catalogue Number: H14-460/2023E-PDF
International Standard Book Number (ISBN): 978-0-660-68101-6
Aussi disponible en français sous le titre Sondage sur la sensibilisation du public aux méfaits de l'alcool.
Numéro de catalogue : H14-460/2023F-PDF
Numéro international normalisé du livre (ISBN) : 978-0-660-68102-3
Alcohol is a popular legal psychoactive substance that holds special social and cultural significance in Canada as in many parts of the world. Many Canadians associate drinking with pleasurable social events, such as music festivals, parties, watching sports, and/or to de-stress or to cope. Our society condones, supports, and in some cases promotes drinking such as through "drink of the day" specials and sale prices on certain brands. Alcohol also plays a significant role in the Canadian economy, generating jobs, and tax revenues for governments.
While alcohol is socially accepted and its use widely tolerated and promoted, particularly in comparison with other substances, it has one of the most significant impacts on the health and wellbeing of Canadians compared to other substances. In 2020, there were over 17,000 alcohol-related deaths and 652,000 emergency visits in Canada, including deaths from alcohol poisoning and impaired driving[i]. Alcohol is the most costly substance, with $19.67 billion in costs to Canadian society in terms of direct health care costs, direct law enforcement costs, and indirect costs related to lost productivity[1]. Although more deaths can be attributed to tobacco use, alcohol use has the highest cost because it can be attributed to injuries and deaths of people at a younger age and was therefore responsible for more lost years of productive life. In 2020, alcohol use accounted for the greatest costs to the criminal justice system at nearly $4.0 billion or 39.8% of all criminal justice costs[ii]. Evidence shows that alcohol use is a serious public health issue that is having significant impacts on Canadians.
The costs and harms of alcohol use are well documented, and 75% of Canadians understand generally that alcohol use can increase the risk of developing serious health conditions[viii]. However, there is little national data available on Canadians' awareness of specific alcohol-related harms. For example, a 2017-2018 survey in the Yukon and Northwest Territories demonstrated a general low-level knowledge of alcohol-related health risks, with only 23% being aware that alcohol increased breast cancer risk[ix]. According to a 2019 public opinion research report, only 32% of respondents were familiar with Canada's Low-Risk Alcohol Drinking Guidelines, and only approximately half of those surveyed knew what comprised a standard serving of beer[x]. In light of the above, this initiative will provide a comprehensive, up-to-date national scan on Canadians' awareness of specific alcohol-related harms.
The overall objective of the research is to benchmark the views and knowledge of Canadians related to alcohol and the associated risks when consuming it.
The specific research objectives were as follows:
The survey is comprised of 9,812 Canadians, 16 years of age and older. The survey was conducted across Canada in each province and territory between February 13th and June 30th, 2023.
The survey sample was drawn from two sources:
The resulting sample contains Canadians who were all randomly recruited by telephone, thus it is a probability sample and allows a margin of error to be associated with the research. The randomly recruited probability sample has a margin of error of +/-1.0% at a 95% confidence interval. Results are weighted to population proportions for region, age, and sex from the 2021 Census. Chi-square tests were used to compare subgroups to the remaining sample (ex. Ontario versus the rest of Canada; 16 to 19 years old versus the rest of Canada; women versus men).
All respondents self-administered the survey online. Please see Appendix A for the detailed methodology.
The contract value was $296,738.57 (HST included).
Supplier name: Nanos Research
PWGSC contract number: CW2242531
Original contract date: 2022-09-07
For more information, contact Department at HC.cpab.por-rop.dgcap.SC@canada.ca.
This certification is to be submitted with the final report submitted to the Project Authority.
I hereby certify, as a Representative of Nanos Research, that the deliverables fully comply with the Government of Canada political neutrality requirements outlined in the Government of Canada's Policy on Communications and Federal Identity and Directive on the Management of Communications. Specifically, the deliverables do not include information on electoral voting intentions, political party preferences, party standings with the electorate, or ratings of the performance of a political party or its leaders.
Nik Nanos
Chief Data Scientist and President
Nanos Research
nik@nanos.co
613‑234‑4666 x237
Respondents most often reported having seen or heard education campaigns, public health or safety messages about alcohol on TV/Radio in the past 12 months (59%), followed by social media (25%), print newspapers or magazines (25%), public display of posters or billboards (20%), in health care settings (17%), inside/outside stores that sell alcohol (16%), and through non-social media websites (11%). Nineteen per cent (19%) said they have not noticed any education campaigns or public health messages.
A majority reported that they have heard of or were aware of "Canada's Low-Risk Alcohol Drinking Guidelines" or "Canada's Guidance on Alcohol and Health" (59%), while three in ten (35%) reported they had not heard of them and seven per cent reported they didn't know.
Respondents who reported being aware of the guidelines most often said they first heard about these guidelines on TV/radio (61%), followed by print news or magazines (12%), social media (8%), non-social media websites (7%) and word of mouth (3%).
Over four in ten respondents (41%) selected wine as the alcohol they typically drink, while over one in four selected beer (27%), over one in five selected spirits (21%), and seven per cent selected ciders/coolers.
Three in five (60%) respondents reported they have heard of the term "standard drink".
When shown an image of a bottle of the alcohol they said they typically drink, beer drinkers on average correctly responded that the bottle contains one standard drink (mean of 1.2), while those who drink ciders/coolers on average said the cooler shown contains one and a half drinks (mean of 1.5 - correct response is 1 drink).Wine drinkers on average incorrectly said the bottle of wine they were shown contains six drinks (mean of 6.3 – correct response was 5 drinks), and those who said they typically drink spirits on average incorrectly said the bottle of spirits they were shown contains 22 drinks (correct response was 17 drinks).
In a typical week, respondents were more likely to report they drink more on the weekend rather than on weekdays. On average, they reported drinking the most on Saturday (mean of 1.6 drinks), followed by Friday (mean of 1.3 drinks), and Sunday (0.7 drinks). They reported drinking less than one drink on average on Monday (0.4 drinks), Tuesday (0.4 drinks), Wednesday (0.5 drinks) and Thursday (0.5 drinks) during a typical week.
Overall, more than eight in ten respondents think that drinking any number of standard drinks (at least 1 to 2 standard drinks of alcohol) per week increases the risk of harm to a fetus when pregnant (84%). A greater proportion of respondents think that risk of harm to a fetus when pregnant increases with 3 to 6 standard drinks of alcohol consumed per week (92%) or 7 or more standard drinks per week (95%).
About three in ten respondents thought drinking 1-2 standard drinks per week increased the risk of a number of cancers (colon, throat, breast and mouth). This increased to about four in ten for 3-6 drinks per week and to around one in two for 7 or more drinks per week.
Respondents were least likely to think alcohol increases risk of Arthritis for any number of standard drinks per week (1-2: 17%; 3-6: 31%; 7 or more: 43%) and were most likely to think alcohol decreases the risk of heart diseases compared to other health conditions (1-2 drinks: 6%; 3-6 drinks: 3%; 7 or more drinks: 1%).
Of note, health conditions which had a lower proportion of "increases risk" responses also had a higher proportion of respondents who were unsure. Over one in five were unsure on the impact of alcohol on colon cancer, high cholesterol, throat cancer, breast cancer, mouth cancer and arthritis for any number of drinks per week.
Risk Label
Close to six in ten respondents (55%) said warning labels stating the serious health risks of alcohol (including that it causes cancer) would make them think about the harms caused by alcohol either to a small (31%) or moderate extent (24%), while around one in five (19%) said to a large (13%) or an extremely large extent (6%), and around one in four say they would not think about it at all (23%). After being shown the label, an increasing proportion of respondents said they would think about the risks to a large extent (17%) or to an extremely large extent (10%) and 21 per cent continued to say it would not make them think about it at all.
One in two respondents (50%) said a label stating the health risks of alcohol would make them think about cutting back on their drinking or talking to others about cutting back on their drinking to a small (29%) or moderate extent (21%), while one in five said to a large (12%) or extremely large extent (6%), and 28 per cent say it would not make them think about cutting back on drinking at all. Once shown the label, a little under one in four (24%) said it would make them think about cutting back or speaking to others about cutting back to a large extent (15%) or to an extremely large extent (9%), which is a marginal increase. Twenty-five per cent continued to say the label would not make them think about it at all.
Standard Drink Label
When shown the label with the number of standard drinks displayed for a bottle of alcohol, close to six in ten respondents (57%) said they would use this information to help them track the number of drinks they consumed, while around one in three (30%) said they would not use this information and thirteen per cent were unsure.
Drink Limit Label
About one in two respondents (51%) said the warning label with drink limits would make them think about cutting back on their drinking or talking to others about cutting their drinking to a small extent (26%) or to a moderate extent (25%), while under one in four said the warning label would make them think about it to a large extent (16%) or to an extremely large extent (8%) and 22 per cent said they would not think about it at all.
Respondents most often strongly agreed (26%) or agreed (36%) that cans and bottles of alcoholic beverages should be labelled with the number of standard drinks per container to help consumers track how much they are drinking, followed by agreement that cans and bottles should be labelled with guidance to reduce health risks from alcohol to inform consumers of the level of risk associated with how much they are drinking (24% strongly agree; 36% agree). Just over one in two strongly agreed (23%) or agreed (31%) that cans and bottles should be labelled with health warning information describing the known link between alcohol and diseases to increase public awareness of the health harm caused by alcohol.
Respondents were three times more likely to strongly disagree (28%) or disagree (30%) that alcohol should continue to be exempt from health information labelling that is currently required of tobacco and cannabis packaging than to agree (13%) or strongly agree (9%).
This report begins with an executive summary outlining key findings and conclusions, followed by a detailed analysis of the results. A detailed dataset of "banner tables" is provided under separate cover; this presents results for all survey questions by key segments such as region, age and sex.
The quantitative results in the report are expressed as percentages unless otherwise noted. Base size is the sample of n=9,812 unless otherwise specified.
Detailed findings are presented in the sections that follow. Overall results are presented in the main portion of the narrative and are typically supported by a graphic or tabular presentation of results. Results for the proportion of respondents in the sample who either said "don't know" or did not provide a response may not be indicated in the graphic representation of the results in all cases, particularly where they are not sizable (e.g., 10% or less). Net results cited in the text may not exactly match individual results shown in the charts due to rounding. Results may not add to 100% due to rounding or multiple responses.
The bullets under the charts also note any significant differences between sub-groups of respondents in different demographic groups. Only demographic differences that are significantly different based on the margin of error of plus or minus 1.0 percentage points (95% confidence interval) and Chi Square tests are presented.
Please note throughout the report, the following definition is used for the research streams:
Key demographic patterns of interest are described throughout the report, in the following order: sex, age, province/territory, those who had and who had not consumed alcohol in the past 12 months, frequency of drinking, and health literacy).
Details of the methodology and sample characteristics can be found in Appendix A. The final survey instrument can be found in Appendix B.
The PAAHS recruitment target for sex was 50% males and 50% females based on the respondents' sex at birth. This target was based on the Canadian 2021 Census of Population which reported 49% of people in Canada as male and 51% as female[xi]. In the final PAAHS sample, 51% of respondents were male and 49% of respondents were female. A comparison of males and females is available throughout the report.
The PAAHS recruitment targeted four age groups (16-19 years old, 20-24 years old, 25-49 years old, and adults aged 50 years and older) based on their proportional representation in 2021 Census data[xii]. An oversample of 16-19 year olds was planned given known difficulties recruiting this age group. In the final PAAHS sample, 4% of respondents were aged 16 to 19 years old, nine per cent aged 20 to 24 years old, 38% aged 25 to 49 years old, and 48% were aged 50 plus. A comparison of age groups is available throughout the report.
The PAAHS recruitment targeted each province and territory based on proportional representation in 2021 Census data[xiii]. Given difficulties with recruitment in individual territories, this region is collectively referred to as "the North". In the final PHAAS sample, 4% of respondents were from Newfoundland & Labrador, 5% from New Brunswick, 5% from Nova Scotia, 4% from Prince Edward Island, 14% from Quebec, 28% from Ontario, 5% from Manitoba, 5% from Saskatchewan, 11% from Alberta, 15% from British Columbia, and four per cent from the Territories (Northwest Territories, Nunavut and the Yukon). A comparison of provinces and the North to the national overall results is available throughout the report.
The PAAHS recruitment quota for alcohol consumption was to recruit a sample where 75% of respondents reported consuming alcohol in the past 12 months and 25% had not consumed alcohol in the past 12 months. This target was based on the 2019 Canadian Alcohol and Drug Survey which reported 76% of Canadians reported consuming an alcohol beverage in the past year[xiv]. At the conclusion of recruitment, 95% of PAAHS respondents reported consuming alcohol in their lifetime (Stream A - Drinkers), with 90% of those in Stream A having consumed alcohol in the past 12 months, while 5% reported never having an alcoholic drink (Stream B – Non-drinkers). Overall, 85% of the total sample reported having consumed alcohol in the past 12 months and 15% had not consumed alcohol in the past 12 months or more. Estimates for the overall sample should be interpreted with caution as individuals who consumed alcohol in the past 12 months are overrepresented in the total sample. One possible reason for this volunteer bias may have been that the title of the survey revealed the subject matter to potential respondents which could have resulted in more participation among people who consume alcohol (i.e., people who are innately more interested in discussing alcohol-related topics because they consume alcohol). The study team attempted to encourage greater participation among individuals who had not consumed alcohol in the past 12 months by altering the telephone script on June 13th, 2023 to emphasize to potential respondents that participation was possible without being a consumer of alcohol. A comparison of people who consumed alcohol in the past 12 months and people who did not consume alcohol in the past 12 months is available throughout the report.
In the PAAHS sample, 20% of respondents were identified as having low or possibly low health literacy on the Canadian adaptation of the Newest Vital Sign health literacy assessment tool[xv]. However, previous research estimates 60% of Canadians have low levels of health literacy[xvi]. Estimates for the overall sample should be interpreted with caution as people with adequate health literacy are overrepresented in the total sample. A comparison of people with adequate health literacy and low health literacy is available throughout the report.
In the final PAAHS sample, 50% of respondents reside in a large urban centre (population of 100,000 or more people), 18% reside in a medium population centre (population of 30,000 to 99,999 people), 21% reside in a small population centre (population of 1,000 to 29,999 people) and 10% reside in a rural area (population of less than 1,000 people). Estimates for the overall sample should be interpreted with caution as individuals living in a rural area were underrepresented in the sample (approximately 18% of Canadians reside in a rural area per the 2021 Census compared to 10% of the PAAHS sample)[xvii] due to the difficulty in reaching individuals in these communities.
In terms of education level, about half of respondents in the final PAAHS sample report completing at least a Bachelor's Degree (25% have completed a Bachelor's and 22% have completed a University certificate, diploma, degree above the bachelor's level), while 19% report having completed College, CEGEP or other non-university certificate or diploma (other than trades certificates or diplomas) and 9% have completed a University certificate or diploma below the bachelor's level. Seven per cent of respondents in the final sample report they have completed up to a Trade certificate or diploma and 17% have completed either a high school diploma or equivalent or less than high school. Estimates for the overall sample should be interpreted with caution as individuals who have completed a high school education or less were underrepresented in the final sample (43% of Canadians), while those who completed a university education (University certificate or higher) were overrepresented (30%)[xviii].
In the final PAAHS sample, 80% of respondents self-identified as White (European descent), while 17 per cent self-identified as BIPOC. Specifically, 5% of respondents in the final sample self-identified as East/Southeast Asian (Chinese, Korean, Japanese, Taiwanese descent or Filipino, Vietnamese, Cambodian, Thai, Indonesian, other Southeast Asian descent), 4% self-identified as South Asian (e.g., East Indian, Pakistani, Bangladeshi, Sri Lankan, Indo-Caribbean), 3% as Black (African, Afro-Caribbean, African Canadian descent), and 2% as Indigenous (First Nations, Métis, Inuk/Inuit descent). One per cent each self-identified as Latino (Latin American, Hispanic descent) or Middle Eastern (Arab, Persian, West Asian descent (e.g., Afghan, Egyptian, Iranian, Lebanese, Turkish, Kurdish)). Estimates for the overall sample should be interpreted with caution as individuals who self-identify as BIPOC were slightly underrepresented in the final sample (27% of Canadians).[xix]
Fifty-two per cent of respondents in the final PAAHS sample who reported an income reported having an annual household income of $80,000 a year or more, while 24% report having a household income of $40,000 to just under $80,000 per year and 12% report having a household income of less than $40,000 per year. Estimates for the overall survey should be interpreted with caution as individuals with a household income of less than $40,000 per year were slightly underrepresented in the survey (19% of Canadians)[xx], though of note, 12% of respondents in the final sample opted not to report their household income.
More than eight in ten respondents in the final PAAHS sample have English as their first official language (88%), while 11% of the sample has French as their first official language, and 1% have a different language as their first official language. Estimates for the overall survey should be interpreted with caution as individuals with French as their first official language were underrepresented in the final sample (21% of Canadians).[xxi]
Respondents most often reported having seen or heard education campaigns, public health or safety messages about alcohol on TV/Radio in the past 12 months (59%), followed by social media (25%), print newspapers or magazines (25%), public display of posters or billboards (20%), in health care settings (17%), inside/outside stores that sell alcohol (16%), and through non-social media websites (11%). Nineteen per cent (19%) said they have not noticed any education campaigns or public health messages.
Q – In the past 12 months, have you seen/heard education campaigns, public health, or safety messages* about alcohol in any of the following places? [RANDOMIZE] [SELECT ALL THAT APPLY] *These campaigns and messages describe the risks of using alcohol and/or safer ways to use alcohol.
| Location of Education Campaign(s) | Total (n=9,812) |
|---|---|
| TV/radio | 59% |
| Social media (e.g., TikTok, Instagram, Facebook, Twitter, Snapchat, YouTube) | 25% |
| Print newspapers or magazines | 25% |
| Public display of posters or billboards (e.g., in public transit, at bars/restaurants) | 20% |
| Health care setting (e.g., pharmacy, doctors' office) | 17% |
| Inside/outside stores that sell alcohol | 16% |
| Non-social media websites | 11% |
| Events (e.g., sporting events, concerts, festivals) | 6% |
| School (e.g., university campus) | 5% |
| Community-based/not for profit organizations | 4% |
| Workplace | 4% |
| Kiosks or temporary sales locations (e.g., farmer's market) | 1% |
| I have not noticed any education campaigns or public health messages | 19% |
Base: All respondents, n=9,812.
Sex
Age
Province/territories
Alcohol consumption in last 12 months
Awareness of drinking guidelines
Health Literacy score
About three in five Canadians (59%) reported they had heard or were aware of "Canada's Low-Risk Alcohol Drinking Guidelines" or "Canada's Guidance on Alcohol and Health", while one in three (35%) reported they had not heard or are not aware, and seven per cent reported that they were unsure. Note: A soft launch of Canada's Guidance on Alcohol and Health occurred in November 2022 with the public release occurring in January 2023, immediately proceeding PAAHS' launch (mid-February 2023). This may have impacted awareness of guidelines.
Q - Have you heard of or are you aware of "Canada's Low-Risk Alcohol Drinking Guidelines" or "Canada's Guidance on Alcohol and Health"?
| Aware of Guidelines | Total (n=9,812) |
|---|---|
| Yes | 59% |
| No | 35% |
| Don't know | 7% |
Base: All respondents, n=9,812.
Sex
Age
Province/territories
Alcohol consumption in last 12 months
Health Literacy score
Respondents who reported being aware of the guidelines most often said they first heard about these guidelines on TV/radio (61%), followed by print news or magazines (12%), social media (8%), non-social media websites (7%) and word of mouth (3%).
Q – Where did you first hear about "Canada's Low-Risk Alcohol Drinking Guidelines" or "Canada's Guidance on Alcohol and Health"?
| Location | Total (n=5,758) |
|---|---|
| TV/radio | 61% |
| Print newspapers or magazines | 12% |
| Social media (e.g., TikTok, Instagram, Facebook, Twitter, Snapchat, YouTube) | 8% |
| Non-social media websites | 7% |
| Word of mouth | 3% |
| Health care setting (e.g., pharmacy, doctors' office) | 2% |
| CBC News | 1% |
| Inside/outside stores that sell alcohol | 1% |
| Public display of posters or billboards (e.g., in public transit, at bars/restaurants) | 1% |
| School (e.g., university campus) | 1% |
| Workplace | 1% |
| Community-based/not for profit organizations | <1% |
Base: Respondents aware of "Canada's Low-Risk Alcohol Drinking Guidelines" or "Canada's Guidance on Alcohol and Health", n=5,758.
Sex
Age
Province/territories
Alcohol consumption in last 12 months
Health Literacy score
Over four in ten Canadians who reported consuming alcohol (41%) selected wine as the alcohol they typically drink, while over one in four selected beer (27%), over one in five selected spirits (21%), and seven per cent selected ciders/coolers.
Q – [STREAM A – DRINKERS ONLY] When you drink alcohol, do you typically drink beer, cider, coolers, wine, or spirits (e.g., rum, whisky, vodka)? [SELECT ONE]
| Location | Total (n=9,377) |
|---|---|
| Wine | 41% |
| Beer | 27% |
| Spirits | 21% |
| Cider/coolers | 7% |
Base: Respondents who report ever having an alcoholic drink (not including having a few sips of wine for religious or other purposes), n=9,377
Sex
Age
Province/territories
Awareness of drinking guidelines
Health Literacy score
Three in five (60%) Canadians who reported consuming alcohol said they have heard of the term "standard drink".
Q - [STREAM A – DRINKERS ONLY] Have you heard of the term "standard drink"?
| Aware of term | Total (n=9,343) |
|---|---|
| Yes | 60% |
| No | 38% |
| No answer | 2% |
Base: Respondents who report ever having an alcoholic drink (not including having a few sips of wine for religious or other purposes), n=9,343
Sex
Age
Province/territories
Alcohol consumption in last 12 months
Awareness of drinking guidelines
Health Literacy score
When shown an image of a bottle of the alcohol they said they typically consume, beer consumers on average correctly responded that the bottle contains one standard drink (mean of 1.2), while those who consume ciders/coolers on average said the cooler shown contains one and a half drinks (mean of 1.5 - correct response is 1 drink). Wine consumers on average incorrectly said the bottle of wine they were shown contains six drinks (mean of 6.3 – correct response was 5 drinks), and those who said they typically consume spirits on average incorrectly said the bottle of spirits they were shown contains 22 drinks (correct response was 17 drinks).
Q - [STREAM A – DRINKERS ONLY] How many 'standard drinks' are in this bottle of [INSERT RESPONSE FROM Q6]? (image of their preferred drink type from Q6 shown on screen)
| Type of Drink | Mean |
|---|---|
| Beer | 1.2 |
| Cider/coolers | 1.5 |
| Wine | 6.3 |
| Spirits | 22.1 |
Base: Respondents who report ever having an alcoholic drink (not including having a few sips of wine for religious or other purposes), n=9,377.
Sex
Age
Province/territories
Alcohol consumption in last 12 months
Awareness of drinking guidelines
Health Literacy score
In a typical week, Canadians were more likely to report consuming more alcohol on the weekend rather than on weekdays. On average, they reported consuming the most alcohol on Saturday (mean of 1.6 drinks), followed by Friday (mean of 1.3 drinks), and Sunday (0.7 drinks). They reported consuming less than one drink on average on Monday (0.4 drinks), Tuesday (0.4 drinks),Wednesday (0.5 drinks) and Thursday (0.5 drinks) during a typical week.
Q – [STREAM A – DRINKERS ONLY] Consider the table (or the list) below with the days of the week. Thinking of a typical week, please enter how many drinks you would typically have on each day of the week:
| Day of the Week | Mean |
|---|---|
| Monday | 0.4 |
| Tuesday | 0.4 |
| Wednesday | 0.5 |
| Thursday | 0.5 |
| Friday | 1.3 |
| Saturday | 1.6 |
| Sunday | 0.7 |
Base: Respondents who report ever having an alcoholic drink (not including having a few sips of wine for religious or other purposes), n=9,377.
Sex
Age
Province/territories
Alcohol consumption in last 12 months
Awareness of drinking guidelines
Health Literacy score
Overall, respondents were most likely to think that consuming any number of standard drinks per week increases the risk of harm to a fetus when pregnant, though this increased in intensity from 1-2 standard drinks per week (84% increases risk), to 3-6 drinks per week (92%) and 7 or more standard drinks per week (95%).
About three in ten respondents thought consuming 1-2 standard drinks per week increased the risk of a number of cancers (colon, throat, breast and mouth). This increased to about four in ten for 3-6 drinks per week and to around one in two for 7 or more drinks per week.
Respondents were least likely to think alcohol increases risk of Arthritis for any number of standard drinks per week (1-2: 17%; 3-6: 31%; 7 or more: 43%) and were most likely to think alcohol decreases the risk of heart diseases compared to other health conditions (1-2 drinks: 6%; 3-6 drinks: 3%; 7 or more drinks: 1%).
Of note, health conditions which had a lower proportion of "increases risk" responses also had a higher proportion of respondents who were unsure. Over one in five were unsure on the impact of alcohol on colon cancer, high cholesterol, throat cancer, breast cancer, mouth cancer and arthritis for any number of drinks per week.
Sex
Age
Province/territories
Alcohol consumption in last 12 months
Awareness of drinking guidelines
Health Literacy score
Canadians were most likely to think consuming one to two standard drinks per week increases the risk of harm to a fetus when pregnant (84%), followed by liver disease (64%), being overweight or obese (57%) and diabetes (50%). They were less likely to think it increases the risk of arthritis (17%), mouth cancer (26%), throat cancer (27%) or breast cancer (28%).
Q – [STREAM A+B – ALL RESPONDENTS] Do you believe drinking 1 to 2 standard drinks of alcohol per week increases, decreases or has no impact on your risk of the following health conditions? [RANDOMIZE]
| Health Condition | Increases risk | Decreases risk | No impact on risk | Unsure |
|---|---|---|---|---|
| Harm to a fetus when pregnant | 84% | <1% | 8% | 7% |
| Liver disease | 64% | 1% | 26% | 10% |
| Being overweight or obese | 57% | 1% | 30% | 12% |
| Diabetes | 50% | 1% | 28% | 21% |
| Heart disease | 44% | 6% | 33% | 18% |
| Colon cancer | 34% | 1% | 35% | 30% |
| High cholesterol | 29% | 3% | 38% | 30% |
| Breast cancer | 28% | 1% | 38% | 34% |
| Mouth cancer | 26% | 1% | 39% | 34% |
| Throat cancer | 27% | 1% | 39% | 34% |
| Arthritis | 17% | 1% | 44% | 38% |
Base: All respondents, n=9,812
The proportion of Canadians who said consuming three to six standard drinks of alcohol per week increased across the board, while the proportion of those who said they are unsure is similar. The proportion that said three to six standard drinks increases the risk of heart disease went up by 22 percentage points (44% to 66%) compared to one to two drinks, while the proportion that said the same about being overweight or obese increased by 21 percentage points (57% to 78%).
Q – [STREAM A+B – ALL RESPONDENTS] Do you believe drinking 3 to 6 standard drinks of alcohol per week increases, decreases or has no impact on your risk of the following health conditions? [RANDOMIZE]
| Health Condition | Increases risk | Decreases risk | No impact on risk | Unsure |
|---|---|---|---|---|
| Harm to a fetus when pregnant | 92% | <1% | 3% | 5% |
| Liver disease | 84% | <1% | 9% | 7% |
| Being overweight or obese | 78% | <1% | 12% | 10% |
| Diabetes | 69% | <1% | 12% | 18% |
| Heart disease | 66% | 3% | 15% | 17% |
| Colon cancer | 50% | <1% | 20% | 30% |
| High cholesterol | 49% | 2% | 21% | 29% |
| Breast cancer | 43% | <1% | 22% | 35% |
| Throat cancer | 42% | <1% | 23% | 35% |
| Mouth cancer | 41% | <1% | 24% | 35% |
| Arthritis | 31% | <1% | 28% | 41% |
Base: All respondents, n=9,812
Canadians most often believed seven or more standard drinks of alcohol per week increases the risk of harm to a fetus when pregnant (95%), liver disease (92%), being overweight or obese (87%), diabetes (79%) and heart disease (87%), but a majority also believed seven or more standard drinks causes an increased risk for a variety of cancers, as well as diabetes, and high cholesterol. Canadians were less likely to think drinking alcohol increases the risk of arthritis than other health conditions.
Q – [STREAM A+B – ALL RESPONDENTS] Do you believe drinking 7 or more standard drinks of alcohol per week increases, decreases or has no impact on your risk of the following health conditions? [RANDOMIZE]
| Health Condition | Increases risk | Decreases risk | No impact on risk | Unsure |
|---|---|---|---|---|
| Harm to a fetus when pregnant | 95% | <1% | 1% | 4% |
| Liver disease | 92% | <1% | 3% | 5% |
| Being overweight or obese | 87% | <1% | 5% | 8% |
| Diabetes | 79% | <1% | 6% | 15% |
| Heart disease | 78% | 1% | 7% | 14% |
| High cholesterol | 62% | 1% | 12% | 25% |
| Colon cancer | 61% | <1% | 12% | 27% |
| Breast cancer | 54% | <1% | 15% | 32% |
| Mouth cancer | 52% | <1% | 16% | 32% |
| Throat cancer | 53% | <1% | 15% | 32% |
| Arthritis | 43% | <1% | 19% | 38% |
Base: All respondents, n=9,812
Of those who said consuming some amount of alcohol increases risk of cancer(s), over half (56%) said they became aware of this information more than a year ago. However, 16 per cent (16%) reported they became aware that alcohol increases the risk of cancer in the last year, eight per cent (8%) in the last month, and one per cent (1%) in the last week. Eighteen per cent (18%) did not recall when they became aware of this.
Q - [STREAM A+B – ALL RESPONDENTS] [IF "INCREASES RISK" TO ANY CANCER RESPONSE OPTION] When did you become aware that drinking alcohol increases your risk of cancer?
| Time | Total (n=6,731) |
|---|---|
| In the last week | 1% |
| In the last month | 8% |
| In the last year | 16% |
| More than a year ago | 56% |
| Don't know | 18% |
| Prefer not to say | 1% |
Base: Respondents who think alcohol causes an increased risk of cancer, n=6,731.
Sex
Age
Province/territories
Alcohol consumption in last 12 months
Awareness of drinking guidelines
Health Literacy score
Of those who thought that consuming alcohol increases the risk of cancer, four in ten reported they first heard this information on TV/Radio (39%), followed by print newspapers or magazine (13%) and a healthcare setting (10%).
Q – [STREAM A+B – ALL RESPONDENTS] [IF "INCREASES RISK" TO ANY CANCER RESPONSE OPTION] Where did you first hear information that drinking alcohol increases your risk of cancer? [RANDOMIZE]
| Location | Total (n=5,779) |
|---|---|
| TV/radio | 39% |
| Print newspapers or magazines | 13% |
| Health care setting (e.g., pharmacy, doctors' office) | 10% |
| School (e.g., university campus) | 8% |
| Non-social media websites | 6% |
| Social media (e.g., TikTok, Instagram, Facebook, Twitter, Snapchat, YouTube) | 5% |
| Public display of posters or billboards (e.g., in public transit, at bars/restaurants) | 2% |
| Workplace | 2% |
| Word of mouth | 1% |
| Common sense/my own knowledge | 1% |
| Inside/outside stores that sell alcohol | 1% |
| Community-based/not for profit organizations | 1% |
| Research studies | 1% |
| Was not aware/learned from this survey | 1% |
| Unsure | 8% |
Base: Respondents in who think alcohol increases risk of cancer(s), n=5,779.
Sex
Age
Province/territories
Alcohol consumption in last 12 months
Awareness of drinking guidelines
Health Literacy score
Close to six in ten Canadians (55%) said warning labels stating the serious health risks of alcohol (including that it causes cancer) would make them think about the harms caused by alcohol either to a small (31%) or moderate extent (24%), while around one in five said to a large (13%) or an extremely large extent (6%), and around one in four said they would not think about it at all (23%). After being shown the label, an increasing proportion of respondents said they would think about the risks to a large extent (17%) or to an extremely large extent (10%) and 21 per cent continued to say it would not make them think about it at all.
Q - [STREAM A+B – ALL RESPONDENTS] To what extent, if at all, would warning labels stating the serious health risks of alcohol use, such as cancer, on bottles and cans of alcoholic beverages make you think about harms caused by alcohol?
| Extent of impact | Total (n=9,812) |
|---|---|
| Not at all | 23% |
| To a small extent | 31% |
| To a moderate extent | 24% |
| To a large extent | 13% |
| To an extremely large extent | 6% |
| Unsure | 3% |
Base: All respondents, n=9,812.
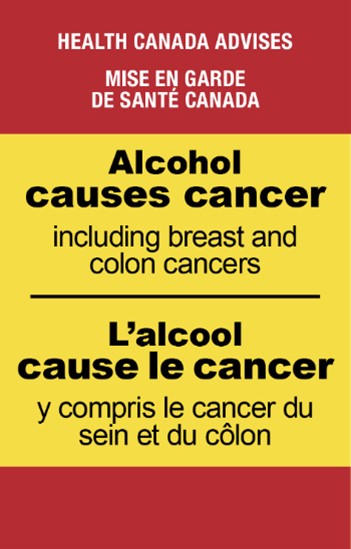
Q - [STREAM A+B – ALL RESPONDENTS] To what extent, if at all, would warning labels such as the one below, stating that alcohol causes cancer, on bottles and cans of alcoholic beverages, make you think about the health harms caused by alcohol?
HEALTH CANADA ADVISES
MISE EN GARDE DE SANTÉ CANADA
Alcohol causes cancer including breast and colon cancers
L'alcool case le cancer y compris le cancer du sein et du côlon
| Extent of impact | Total (n=9,812) |
|---|---|
| Not at all | 21% |
| To a small extent | 26% |
| To a moderate extent | 23% |
| To a large extent | 17% |
| To an extremely large extent | 10% |
| Unsure | 2% |
Base: All respondents, n=9,812.
Sex
Age
Province/territories
Alcohol consumption in last 12 months
Awareness of drinking guidelines
Health Literacy score
One in two Canadians (50%) said a label stating the health risks of alcohol would make them think about cutting back on their drinking or talking to others about cutting back on their drinking to a small (29%) or moderate extent (21%), while one in five said to a large (12%) or extremely large extent (6%), and 28 per cent said it would not make them think about cutting back on drinking at all. Once shown the label, a little under one in four (24%) said it would make them think about cutting back or speaking to others about cutting back to a large extent (15%) or to an extremely large extent (9%), which is a marginal increase. Twenty-five per cent continued to say the label would not make them think about it at all.
Q - [STREAM A+B – ALL RESPONDENTS] To what extent, if at all, would warning labels stating the serious health risks of alcohol use, such as cancer, on bottles and cans of alcoholic beverages make you think about cutting back on your drinking or talk to others about cutting back on their drinking?
| Extent of impact | Total (n=9,812) |
|---|---|
| Not at all | 28% |
| To a small extent | 29% |
| To a moderate extent | 21% |
| To a large extent | 12% |
| To an extremely large extent | 6% |
| Unsure | 4% |
Base: All respondents, n=9,812
Q - [STREAM A+B – ALL RESPONDENTS] To what extent, if at all, would warning labels such as the one below, stating that alcohol causes cancer, on bottles and cans of alcoholic beverages, make you think about cutting back on your drinking or talk to others about cutting back on their drinking?
HEALTH CANADA ADVISES
MISE EN GARDE DE SANTÉ CANADA
Alcohol causes cancer including breast and colon cancers
L'alcool case le cancer y compris le cancer du sein et du côlon
| Extent of impact | Total (n=9,812) |
|---|---|
| Not at all | 25% |
| To a small extent | 26% |
| To a moderate extent | 22% |
| To a large extent | 15% |
| To an extremely large extent | 9% |
| Unsure | 3% |
Base: All respondents, n=9,812
Sex
Age
Province/territories
Alcohol consumption in last 12 months
Awareness of drinking guidelines
Health Literacy
When shown the label with the number of standard drinks displayed for a bottle of alcohol, close to six in ten respondents (57%) said they would use this information to help them track the number of drinks they consumed, while around one in three (30%) said they would not use this information and thirteen per cent were unsure.
Q – If the number of standard drinks were displayed on the labels of bottles and cans of alcoholic drinks, such as the one below, would you ever use this information to help yourself or someone else track the number of drinks you or they consumed?.
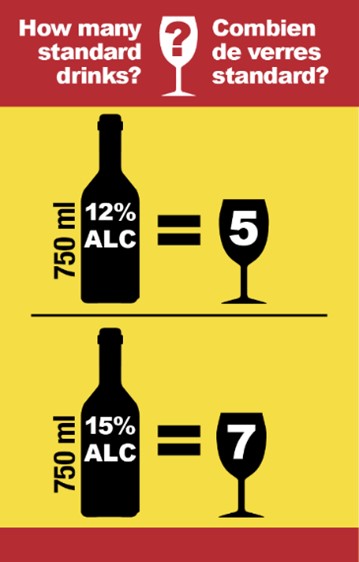
How many standard drinks? Combien de verre standards?
750 ml, 12% ALC = 5
750 ml, 15% ALC = 7
| Use of Information | Total (n=9,812) |
|---|---|
| Yes | 57% |
| No | 30% |
| Don't know | 13% |
Base: All respondents, n=9,812.
Sex
Age
Province/territories
Alcohol consumption in last 12 months
Awareness of drinking guidelines
Health Literacy score
Finally, respondents were asked to what extent a warning label with drink limits to reduce health risks, such as the one shown would make them think about cutting back on their drinking or talking to others about cutting their drinking. About one in two respondents (51%) said the warning label with drink limits would make them think about cutting back on their drinking or talking to others about cutting their drinking to a small extent (26%) or to a moderate extent (25%), while under one in four said the warning label would make them think about it to a large extent (16%) or to an extremely large extent (8%) and 22 per cent said they would not think about it at all.
Q – [STREAM A+B – ALL RESPONDENTS] To what extent, if at all, would labels with drink limits to reduce health risks from alcohol, such as the one below, on bottles and cans of alcoholic beverages make you think about cutting back on your drinking or talk to others about cutting back on their drinking?
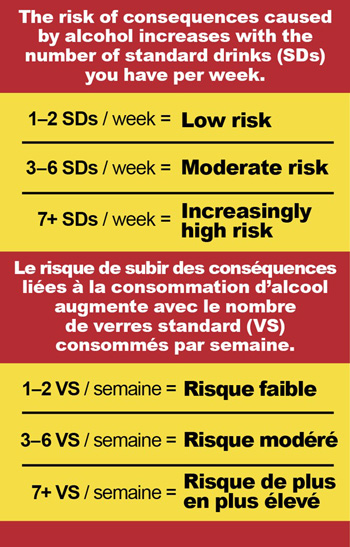
The risk of consequences caused by alcohol increases with the number of standard drinks (SDs) you have per week.
1-2 SDs / week = Low risk
3-6 SDs / week = Moderate risk
7+ SDs / week = Increasingly high risk
Le risque de subir des conséquences liées à la consommation d'alcool augmente avec le nombre de verres standard (VS) consommés par semaine.
1-2 VS / semaine = Risque faible
3-6 VS / semaine = Risque modéré
7+ VS / semaine = Risque de plus en plus élevé
| Extent of impact | Total (n=9,812) |
|---|---|
| Not at all | 22% |
| To a small extent | 26% |
| To a moderate extent | 25% |
| To a large extent | 16% |
| To an extremely large extent | 8% |
| Unsure | 3% |
Base: All respondents, n=9,812.
Sex
Age
Province/territories
Alcohol consumption in last 12 months
Awareness of drinking guidelines
Health Literacy score
Respondents most often strongly agreed (26%) or agreed (36%) that cans and bottles of alcoholic beverages should be labelled with the number of standard drinks per container to help consumers track how much they are drinking, followed by agreement that cans and bottles should be labelled with guidance to reduce health risks from alcohol to inform consumers of the level of risk associated with how much they are drinking (24% strongly agree; 36% agree). Just over one in two strongly agreed (23%) or agreed (31%) that cans and bottles should be labelled with health warning information describing the known link between alcohol and diseases to increase public awareness of the health harms caused by alcohol.
Respondents were three times more likely to strongly disagree (28%) or disagree (30%) that alcohol should continue to be exempt from health information labelling that is currently required of tobacco and cannabis packaging than to agree (13%) or strongly agree (9%).
Respondents were asked to rate their agreement with the statement that to increase public awareness of the health harm caused by alcohol, cans and bottles of alcoholic beverages should be labelled with health warning information describing the known link between alcohol and diseases, including cancer, such as the image shown with the question. Just over one in two said they strongly agreed (23%) or agreed (31%) with the statement, while 19 per cent (19%) neither agreed nor disagreed, and one in four either disagreed (12%), or strongly disagreed (12%).
Q - [STREAM A+B – ALL RESPONDENTS] To what extent do you agree or disagree with the following statement? To increase public awareness of the health harm caused by alcohol, cans and bottles of alcoholic beverages should be labelled with health warning information describing the known link between alcohol and diseases, including cancer, as in the image below.
HEALTH CANADA ADVISES
MISE EN GARDE DE SANTÉ CANADA
Alcohol causes cancer including breast and colon cancers
L'alcool case le cancer y compris le cancer du sein et du côlon
| Agreement with statement | Total (n=9,812) |
|---|---|
| Strongly disagree | 12% |
| Disagree | 12% |
| Neither agree nor disagree | 19% |
| Agree | 31% |
| Strongly agree | 23% |
| Don't know | 3% |
| Prefer not to say | <1% |
Base: All respondents, n=9,812.
Sex
Age
Province/territories
Alcohol consumption in last 12 months
Awareness of drinking guidelines
Health Literacy score
When shown a label outlining guidance to reduce the risk of health consequences caused by alcohol, the majority of respondents said they strongly agreed (24%) or agreed (36%) that cans and bottles of alcoholic beverages should be labelled with guidance to reduce health risks from alcohol, to inform consumers of the level of risk associated with how much they are drinking, while 16 per cent neither agreed or disagreed, and over one in five disagreed (11%) or strongly disagreed (10%).
[STREAM A+B – ALL RESPONDENTS] To what extent do you agree or disagree with the following statement? Cans and bottles of alcoholic beverages should be labelled with guidance to reduce health risks from alcohol, such as the one below, to inform consumers of the level of risk associated with how much they are drinking.
The risk of consequences caused by alcohol increases with the number of standard drinks (SDs) you have per week.
1-2 SDs / week = Low risk
3-6 SDs / week = Moderate risk
7+ SDs / week = Increasingly high risk
Le risque de subir des conséquences liées à la consommation d'alcool augmente avec le nombre de verres standard (VS) consommés par semaine.
1-2 VS / semaine = Risque faible
3-6 VS / semaine = Risque modéré
7+ VS / semaine = Risque de plus en plus élevé
| Agreement with statement | Total (n=9,812) |
|---|---|
| Strongly disagree | 10% |
| Disagree | 11% |
| Neither agree nor disagree | 16% |
| Agree | 36% |
| Strongly agree | 24% |
| Don't know | 2% |
| Prefer not to say | <1% |
Base: All respondents, n=9,812.
Sex
Age
Province/territories
Alcohol consumption in last 12 months
Awareness of drinking guidelines
Health Literacy score
Over six in ten Canadians strongly agreed (26%) or agreed (36%) with the statement "Cans and bottles of alcoholic beverages should be labelled with the number of standard drinks per container, such as the one below, to help consumers track how much they are drinking".
Q - [STREAM A+B – ALL RESPONDENTS] To what extent do you agree or disagree with the following statement? Cans and bottles of alcoholic beverages should be labelled with the number of standard drinks per container, such as the one below, to help consumers track how much they are drinking.
How many standard drinks? Combien de verre standards?
750 ml, 12% ALC = 5
750 ml, 15% ALC = 7
| Agreement with statement | Total (n=9,812) |
|---|---|
| Strongly disagree | 9% |
| Disagree | 10% |
| Neither agree nor disagree | 17% |
| Agree | 36% |
| Strongly agree | 26% |
| Don't know | 3% |
| Prefer not to say | <1% |
Base: All respondents, n=9,812
Sex
Age
Province/territories
Alcohol consumption in last 12 months
Awareness of drinking guidelines
Health Literacy score
A little under six in ten strongly disagreed (28%) or disagreed (30%) that alcohol should continue to be exempt from health information labelling, while 18 per cent said they neither agree nor disagree, over one in five said they strongly agree (9%) or agree (13%).
Q - [STREAM A+B – ALL RESPONDENTS] In Canada, tobacco and cannabis packages are required to have health information labels but alcohol containers are not required to have health information labels. To what extent do you agree or disagree with the following statement? Alcohol should continue to be exempt from health information labelling.
| Agreement with statement | Total (n=9,812) |
|---|---|
| Strongly disagree | 28% |
| Disagree | 30% |
| Neither agree nor disagree | 18% |
| Agree | 13% |
| Strongly agree | 9% |
| Don't know | 2% |
| Prefer not to say | <1% |
Base: All respondents, n=9,812
Sex
Age
Province/territories
Alcohol consumption in last 12 months
Awareness of drinking guidelines
Health Literacy score
The sample was drawn from two sources:
Nanos conducted a mixed-sample Random Digit Dialled (RDD) dual frame (land- and cell-lines) hybrid random telephone and online survey of 9,812 Canadians, 16 years of age or older, between February 13th and June 30th, 2023. Participants were randomly recruited by telephone using live agents and administered a survey online, with the sample recruited from the Nanos Online Probability Panel and recruited directly by a dual frame RDD sample of land- and cell-line numbers and administered the survey online.
With over 50,000 panelists, the Nanos Online Probability Panel consists of individuals randomly recruited by land-and cell-lines using live agents. As panelists are randomly recruited, this ensures the panel is representative of Canadians. In total, 7,663 Canadians were recruited through the Nanos Panel and 2,149 by were recruited by telephone.
The sampling method was designed to complete interviews with 9,950 Canadians 16 years of age and older. Soft quotas were set by age, sex, region, and alcohol consumption status. In the end, 9,812 interviews were completed in order to meet the soft targets where possible, especially those set for youth (16 to 19 years of age). Discussions were held throughout the fieldwork and adjustments were made to the soft target quotas, including reducing the target for the North and youth (16 to 19).This was due to continuous challenges recruiting for these groups, where the recruiting hit a saturation point after which very few new respondents in these groups were able to be recruited for the survey despite extensive efforts to do so.
The survey obtained the following distribution:
| Variable | % of population | Original Target (soft quota) |
% of sample | Adjusted Target (soft quota)[*] |
Actual Unweighted | Actual Weighted[*] | Margin of Error |
|---|---|---|---|---|---|---|---|
| Region | |||||||
| Newfoundland and Labrador | 1% | 450 | 5% | - | 438 | 140 | ±4.7 |
| Nova Scotia | 2% | 450 | 5% | - | 486 | 264 | ±4.5 |
| Prince Edward Island | <1% | 450 | 5% | 385 | 346 | 41 | ±5.3 |
| New Brunswick | 2% | 450 | 5% | - | 452 | 211 | ±4.7 |
| Quebec | 19% | 1,550 | 16% | - | 1,364 | 2,253 | ±2.7 |
| Ontario | 31% | 2,500 | 25% | - | 2,784 | 3,793 | ±1.9 |
| Manitoba | 3% | 450 | 5% | - | 499 | 344 | ±4.4 |
| Saskatchewan | 2% | 450 | 5% | - | 463 | 287 | ±4.6 |
| Alberta | 9% | 1,000 | 10% | - | 1,103 | 1,092 | ±3.0 |
| British Columbia | 11% | 1,200 | 12% | - | 1,456 | 1,358 | ±2.6 |
| Northwest Territories | <1% | 450 | 5% | 385 | 421 | 29 | ±4.8 |
| Yukon | <1% | 450 | 5% | ||||
| Nunavut | <1% | 100 | 1% | ||||
| Age | |||||||
| 16-19 | 5% | 700 | 7% | 385 | 368 | 517 | ±5.2 |
| 20-24 | 7% | 900 | 9% | - | 923 | 707 | ±3.2 |
| 25-49 | 40% | 3,750 | 38% | - | 3,763 | 3,900 | ±1.6 |
| 50+ | 48% | 4,600 | 46% | - | 4,758 | 4,688 | ±1.4 |
| Sex | |||||||
| Male | 49% | 4,975 | 50% | - | 5,005 | 4,792 | ±1.4 |
| Female | 51% | 4,975 | 50% | - | 4,807 | 5,020 | ±1.4 |
| Alcohol Consumption Status of those in Stream A | |||||||
| Has consumed alcohol in the last 12 months | 76% | 7,475 | 75% | - | 8,364 | 8,386 | ±1.1 |
| Has not consumed alcohol in the last 12 months | 24% | 2,475 | 25% | - | 1,013 | 956 | ±3.1 |
|
|||||||
As part of the sampling methodology, Nanos also included a dual frame Random Digit Dialed sample of land- and cell-line numbers to recruit participants. With this approach, a separate sampling frame was created for the land-line portion of the sample and for the cell-line portion of the sample. This approach ensured sample coverage for not only landlines but households with land and cell line and households which are cell-line only residences. The overlap resulted in a greater level of granularity. A decision was made to increase the proportion of cell lines to 85% (15% land lines) in order to better reach youth (16 to 19 years of age).
As part of the recruiting screener, participants were administered a set of screening questions to filter out anyone who was not eligible to participate in the study. For the purposes of this study the following screening criteria were applied:
As noted, respondents who fell into any of the above categories were immediately terminated from the research/prevented from proceeding any further and they were no longer eligible to participate in the study.
Readers should note that panel members have already been pre-screened for the industry specific criteria; however, as part of industry best practices, respondents are always screened on this question in case either their or an immediate family members' employment situation has changed, and they are now employed in an ineligible field. In that case the email is scrubbed from the panel and placed on a 'never contact' database.
As a best practice a screening question was added to ensure respondents had not participated in Government of Canada surveys in the last 30 days before being contacted.
Of note, a few changes were made to the recruiting script and screeners during the fieldwork in an effort to increase the conversion rate of the fieldwork.
Individuals cannot self-select to join the panel or to complete surveys once they are panelists. For each project the sample is randomly selected from the randomly recruited panel.
Individuals are randomly recruited for the panel by land- and cell-lines across Canada. They provide their consent on the call and voluntarily provide their email address to Nanos to be contacted for future online research. We recruit for the panel every week as we do a weekly national survey which is representative of Canada and includes recruitment for the panel. Panelists usually drop out of the panel after a few months.
Our sampling methodology stratified the population along three key variables which allowed triangulation of the weighting approach and yielded robust, geographic and demographic representation across the country.
The sample was stratified along three axes – by region/province, by sex and by age. Fixed completion quotas were assigned to each province, regionally in the Territories due to their relative size, which were anchored by their population distribution relative to the national total.
In order to ensure balanced representation within each province/region, the sample was further stratified by sub-regions. This prevented over/under-sampling of geographies (e.g., City of Toronto), within the provincial total.
Within each province soft sex quotas were then set which approximate that area's sex distribution. The data collection allowed for a variance of +/- 5% for sex within each region, again preventing over representation by either men or women. The third stratification axis was by age category. The age categories were used to group respondents and for weighting purposes.
Each of the age categories were weighted, within their sex and their province/region, the outcome of which yielded a dataset which accurately reflects the demographic composition of the population at large.
The survey methodology included a randomly selected probability sample. The sample was drawn from two sources:
Due to the large proposed target sample size and to compensate for the parameters of the Nanos Online Probability Panel, Nanos conducted a dual mode recruitment, which consisted of using our Nanos Online Probability Panel and interviews randomly recruited through a telephone interview (random digit dialed land- and cell-lines). All respondents self-administered the questionnaire online.
Accessibility is paramount during the questionnaire design process, where we ensured questions were not overly wordy or complex and that they will be easily understood.
Our online survey platform is designed to meet accessibility standards, including proper HTML format and tags, alternative text, proper contrast and other best practices to allow for ease of use of screen readers and other assistive technologies.
During fieldwork we ensured we accommodated the needs of all eligible respondents as required, including informing respondents of available accommodations or alternatives available, such as completing the survey by telephone instead of online and vice versa.
Fieldwork was conducted between February 13th to June 30th, 2023.
The average interview length was 22.0 minutes and ranged from 14 to 41 minutes.
An incentive of $5 (either via e-transfer or to a donation to a registered charity) was offered to all panelists who participated in the research. A minimum of three reminder emails were sent and up to three reminder calls were made to invitees to encourage their participation.
Prior to launching the survey, a pre-test was conducted online with 20 individuals (10 English, 10 French) from February 7th to 8th, 2023. The purpose of the pre-test was to ensure that the content of the questionnaire was understandable, that the duration of the interview fit the target, to ensure comparability between the French and the English, and to ensure that the logic of the survey flowed smoothly.
Upon completion of the pre-test, Nanos and Health Canada reviewed the findings and determined no modifications were needed and the survey was deployed to the full sample.
For our online surveys from our panel, we have a minimum field period of one week to give people a chance to complete the survey and for Nanos to send reminders to those who did not complete the survey (this limits the bias of only taking people who respond to the first invitation because they are free and/or have immediate access to a computer for online surveys).
The data file was checked on a number of elements to ensure accuracy and validity, both during and after the data collection as follows:
Nanos Research monitors 10% of all fieldwork for quality control and assurance in accordance with the standards of the Canadian Research Insights Council (CRIC), the European Society for Opinion and Marketing Research (ESOMAR) and the American Association for Public Opinion Research (AAPOR).
The following tables outline the contact disposition for the fieldwork.
| Total Invitations (a) | 43,929 |
|---|---|
| Total Completes (b) | 9,812 |
| Qualified Break-offs (c) | 142 |
| Disqualified (d) | 31 |
| No response (e) | 33,944 |
| Contact Rate (b+c+d)/a | 22.7% |
| Participation Rate (b+d)/a | 22.4% |
| Total | |
|---|---|
| Total Numbers Attempted | 589,203 |
| Out of scope - invalid | 440,566 |
| NIS, Business, etc | 440,566 |
| Unresolved ( U) | 25,748 |
| No answer/machine/etc | 25,748 |
| Busy | |
| In-scope Non-responding ( IS) | 117,693 |
| Language barrier | |
| Callback | 112 |
| Refusal | 117,581 |
| Termination | |
| In-scope Responding ( R) | 5,196 |
| Complete | 5,196 |
| Partials | |
| Response Rate | 3.5% |
The response rate for this survey was 3.5%. This was calculated using the Canadian Research Insights Council formula, which has been approved by the Government of Canada (Response Rate/Participation Rate = R/(U + IS + R).
First, there is potential non-response bias based on the profile of the responding sample. Based on our experience, using the Random Digit Dialed (RDD) dual frame land- and cell-line sample represents the optimal and most reliable form of research that requires the least amount of post fieldwork statistical weighting (both for the telephone sample and the online, as participants were recruited by land- and cell-lines). From a research perspective, the less weighting the better since the data remains random and in its raw form as shared with Nanos.
Non-response bias is managed primarily through the application of statistical weights. Another possible non-response bias would be individuals of a lower socio-economic status. These individuals may not have access to a land or cell-line to be included in the sample so there is the potential coverage issue from a sampling perspective. Nanos managed this non-response bias by statistically checking the demographics of the participating sample group with the Canadian population. Where a valid variance occurs, the dataset is weighted to be consistent with the profile of all Canadians including those, for example, of a lower socio-economic status. The estimated proportion of Canadians without access to internet to complete the survey is 6%[xxii].
Second, there is the potential non-response bias based on the answers themselves. Although the demographic profile of the sample reflects the Canadian population, hypothetically, the non-responding participants may have different opinions. Although this is a hypothetical possibility, the Nanos track record with respect to both economic and political sentiment which very accurately captures opinion and closely correlates to a number of external measures intended to be examined, suggests that there is little non-response bias in the Nanos methodology.
Third, as the recruiting screener mentioned the survey topic of alcohol, there is potential non-response bias in favour of those who consume alcohol. Nanos worked to manage this with Health Canada by adding a note to the recruiting script which informed potential respondents that their alcohol consumption (or lack thereof) had no bearing on their ability to respond to the survey questions.
Thank you for your interest in participating in this 20 minute research survey for Health Canada. All the views and information you share with Nanos Research will be confidential and protected in accordance with Canada's privacy laws. Thank you, in advance, for sharing your time.
This research project is registered with the CRIC Research Verification Service that allows you to verify its legitimacy and share your feedback. If you have feedback on this research, you can share it by going to https://canadianresearchinsightscouncil.ca/rvs and using the RVS code: XYZ.
Invitation to Participate: You are invited to participate in the above-mentioned research study conducted by Nanos Research on behalf of Health Canada.
Si vous préférez répondre au sondage en français, veuillez cliquer sur français
Purpose of the Study: From this research we wish to examine Canadians' awareness of specific harms related to alcohol. This study will serve as a benchmark for future waves of research.
Participation: If you wish to participate in this study, please click the invitation link. Your decision to complete and return this survey will be interpreted as an indication of your consent to participate. The survey should take you approximately 20 minutes to complete.
Confidentiality and Anonymity: The information that you will share will remain strictly confidential and will be used solely for the purposes of this research. The only people who will have access to the research data are Nanos Research and Health Canada. Results will be published in pooled (aggregate) format. Anonymity is guaranteed. Health Canada will only have access to de-identified data with no means of identifying participants.
Conservation of data: The surveys will be kept in a secure server in the Nanos Office in Toronto only accessible by the Nanos Chief Privacy Officer for a period of 5 years at which time they will be destroyed.
Voluntary Participation: You are under no obligation to participate and if you choose to participate, you may refuse to answer questions that you do not want to answer. You may choose to withdraw from the process at any time during or after the data collection process and any collected data will be destroyed upon request.
Contact: If you have any questions or require more information about the study itself, or for technical support with the survey, accessibility requirements, or to request to complete the survey over the phone you can contact jhenwood@nanosresearch.com.If you have any questions regarding the administration of this study, you may contact the Senior Researcher, Nik Nanos at nik@nanos.co or 613‑234‑4666 extension 237.
Thank you for your time and consideration.
A. In which age category do you fall? [GROUPINGS ARE FROM SAMPLING/CLIENT REQUEST FOR ANALYSIS]
B. Do you or does anyone in your immediate family, work in any of the following occupations?
C. Have you participated in any Government of Canada surveys or surveys about alcohol in the last 30 days?
D. What was your sex at birth? Sex refers to sex assigned at birth. [CAPTURED FOR QUOTA MANAGEMENT]
G. What is your gender? Refers to the gender that you identify with (which may be different from sex assigned at birth and may be different from what is indicated on legal documents) [OPEN]
H. In which province or territory do you currently live?
Our next few questions are about alcohol consumption.
1. Have you ever had an alcoholic drink? Drinking does not include having a few sips of wine for religious or other purposes.
2. During the past 12 months, how often did you drink alcoholic beverages? Was it:
3. In the past 12 months, have you seen/heard education campaigns, public health, or safety messages* about alcohol in any of the following places? [RANDOMIZE] [SELECT ALL THAT APPLY]
4. Have you heard of or are you aware of "Canada's Low-Risk Alcohol Drinking Guidelines" or "Canada's Guidance on Alcohol and Health"?
5. Where did you first hear about "Canada's Low-Risk Alcohol Drinking Guidelines" or "Canada's Guidance on Alcohol and Health"? [RANDOMIZE][SELECT ONE]
6. [STREAM A – DRINKERS ONLY] When you drink alcohol, do you typically drink beer, cider, coolers, wine, or spirits (e.g., rum, whisky, vodka)? [SELECT ONE]
7. [STREAM A – DRINKERS ONLY] Have you heard of the term "standard drink"?
8. [STREAM A – DRINKERS ONLY] How many 'standard drinks' are in this bottle of [INSERT RESPONSE FROM Q6]? (image of their preferred drink type from Q6 shown on screen)
The following questions are about your alcohol consumption.
For the purpose of this survey, a drink means:
Include light beer.
Exclude de-alcoholised beer or coolers (0.5% alcohol) or cocktails such as Virgin Mary or Shirley Temple.
ABV = Alcohol by volume
[INSERT IMAGE – DrinkInfoENG or DrinkInfoFR]
[STREAM A – DRINKERS ONLY] Consider the table (or the list) below with the days of the week. Thinking of a typical week, please enter how many drinks you would typically have on each day of the week:
[Min = 0; Max = 50 for each – DO NOT ADD UP/DISPLAY TOTAL]
[STREAM A+B – ALL RESPONDENTS] Do you believe drinking 3 to 6 standard drinks of alcohol per week increases, decreases or has no impact on your risk of the following health conditions? [RANDOMIZE]
[STREAM A+B – ALL RESPONDENTS] Do you believe drinking 3 to 6 standard drinks of alcohol per week increases, decreases or has no impact on your risk of the following health conditions? [RANDOMIZE]
[STREAM A+B – ALL RESPONDENTS] Do you believe drinking 7 or more standard drinks of alcohol per week increases, decreases or has no impact on your risk of the following health conditions? [RANDOMIZE]
49. [STREAM A+B – ALL RESPONDENTS] [IF "INCREASES RISK" TO ANY CANCER RESPONSE OPTION] When did you become aware that drinking alcohol increases your risk of cancer?
50. [STREAM A+B – ALL RESPONDENTS] [IF "INCREASES RISK" TO ANY CANCER RESPONSE OPTION] Where did you first hear information that drinking alcohol increases your risk of cancer? [RANDOMIZE]
51. [STREAM A+B – ALL RESPONDENTS] To what extent, if at all, would warning labels stating the serious health risks of alcohol use, such as cancer, on bottles and cans of alcoholic beverages make you think about harms caused by alcohol?
52. [STREAM A+B – ALL RESPONDENTS] To what extent, if at all, would warning labels stating the serious health risks of alcohol use, such as cancer, on bottles and cans of alcoholic beverages make you think about cutting back on your drinking or talk to others about cutting back on their drinking?
53. [STREAM A+B – ALL RESPONDENTS] To what extent, if at all, would warning labels such as the one below, stating that alcohol causes cancer, on bottles and cans of alcoholic beverages, make you think about the health harms caused by alcohol?
[INSERT IMAGE – AlcoholCancerImage]
54. [STREAM A+B – ALL RESPONDENTS] To what extent, if at all, would warning labels such as the one below, stating that alcohol causes cancer, on bottles and cans of alcoholic beverages, make you think about cutting back on your drinking or talk to others about cutting back on their drinking?
[INSERT IMAGE – AlcoholCancerImage]
[STREAM A+B – ALL RESPONDENTS] The label below states that a 750mL bottle of wine at 12% alcohol by volume (ABV) contains 5 standard drinks and a 750mL bottle of wine at 15% ABV contains 7 standard drinks.
55. If the number of standard drinks were displayed on the labels of bottles and cans of alcoholic drinks, such as the one below, would you ever use this information to help yourself or someone else track the number of drinks you or they consumed?
[INSERT IMAGE – NumberofSDImage]
56. [STREAM A+B – ALL RESPONDENTS] To what extent, if at all, would labels with drink limits to reduce health risks from alcohol, such as the one below, on bottles and cans of alcoholic beverages make you think about cutting back on your drinking or talk to others about cutting back on their drinking?
[INSERT IMAGE – AlcoholRiskLevelImage]
57. [STREAM A+B – ALL RESPONDENTS] To what extent do you agree or disagree with the following statement? To increase public awareness of the health harm caused by alcohol, cans and bottles of alcoholic beverages should be labelled with health warning information describing the known link between alcohol and diseases, including cancer, as in the image below.
[INSERT IMAGE – AlcoholCancerImage]
58. [STREAM A+B – ALL RESPONDENTS] To what extent do you agree or disagree with the following statement? Cans and bottles of alcoholic beverages should be labelled with guidance to reduce health risks from alcohol, such as the one below, to inform consumers of the level of risk associated with how much they are drinking.
[INSERT IMAGE – AlcoholRiskLevelImage]
59. [STREAM A+B – ALL RESPONDENTS] To what extent do you agree or disagree with the following statement? Cans and bottles of alcoholic beverages should be labelled with the number of standard drinks per container, such as the one below, to help consumers track how much they are drinking.
[INSERT IMAGE – NumberofSDImage]
60. [STREAM A+B – ALL RESPONDENTS] In Canada, tobacco and cannabis packages are required to have health information labels but alcohol containers are not required to have health information labels. To what extent do you agree or disagree with the following statement? Alcohol should continue to be exempt from health information labelling.
[STREAM A+B – ALL RESPONDENTS] Newest Vital Sign – Health Literacy (NVS)
We are asking participants to help us learn how well people can understand the health information in our environments. The next set of questions will ask you to look at some health information and then answer a few questions about that information. Your answers will help us learn how to provide health information in ways that people will understand. This part will only take about 3 minutes.
This nutritional fact information table (NFT) is on the back of a 500-ml container of ice cream. You can refer to this table while answering the questions below.
[INSERT IMAGE – NutritionFactsENG or NutritionFactsFR]
[ENSURE IMAGE IS VISIBLE FOR EACH QUESTION]
61. [STREAM A+B – ALL RESPONDENTS] If you eat the entire container, how many calories will you eat?
62. [STREAM A+B – ALL RESPONDENTS] If you are allowed to eat 60 grams of carbohydrates as a snack, how much ice cream could you have?
63. [STREAM A+B – ALL RESPONDENTS] Your doctor advises you to reduce the amount of saturated fat in your diet. You usually have 42 grams of saturated fat each day, which includes one serving of ice cream. If you stop eating ice cream, how many grams of saturated fat would you be eating each day?
64. [STREAM A+B – ALL RESPONDENTS] If you usually eat 2,500 calories in a day, what percentage of your daily value of calories will you be eating if you eat one serving of ice cream?
65. [STREAM A+B – ALL RESPONDENTS] Pretend that you are allergic to the following substances: penicillin, peanuts, latex gloves and bee stings. Is it safe for you to eat this ice cream?
66. [IF NO] Why not? [RANDOMIZE]
Our last few questions will help us group your responses and help us determine how representative of the Canadian population our sample of survey respondents is.
67. Which of the following best describes where you live?
68. What is the highest certificate, diploma or degree that you have completed?
69. Are you:
70. [IF SELECTED INDIGENOUS] Which Indigenous group(s) do you identify as? [select all that apply]
71. In which of the following groups did your total household income fall for the year ending December 31, 2021?
72. [IF SEX in D = FEMALE] Are you currently pregnant?
73. [IF SEX in D = FEMALE] Are you currently breastfeeding?
74. Can you speak English or French well enough to conduct a conversation?
75. What language do you speak most often at home?
76. What is the language that you first learned at home in childhood and still understand?
77. For verification purposes only, please enter the first three digits of your postal code:
78. In what year were you born?
Thank you for taking part in this survey. Your answers will remain anonymous and will only be reported in the aggregate. We very much appreciate your time and honesty.
If you would like to withdraw from the study, please email the senior researcher at Nanos, Jennifer Henwood at jhenwood@nanosresearch.com.
If you have any further questions or want clarification regarding this research and/or your participation, please contact: Nik Nanos at nik@nanos.co.
If you have any concerns about the way you have been treated as a participant, please contact the Health Canada-PHAC Research Ethics Board Secretariat at reb-cer@hc-sc.gc.ca.
If the survey makes you feel like you would like to talk to someone about your own alcohol use or someone else's alcohol use, please visit Wellness Together Canada, Mental Health and Substance Use Support or look for health and support services specific to the Province or Territory where you live.