POR Number: 090-09
Contract Number: G9178-090003/001/CY
Award Date: February 16, 2010
Fieldwork Completion Date: March 31, 2010
Contract amount: $72,030.00 (inc. GST)
FINAL REPORT
Prepared for Human Resources and Skills Development Canada
nc-por-rop-gd@hrsdc-rhdcc.gc.ca
« Ce rapport est disponible dans l’autre langue officielle. »
April 2010
Phoenix Strategic Perspectives Inc.
1678 Bank Street, Ste. 2, Ottawa, Ontario K1V 7Y6
Tel: (613) 260-1700 Fax: (613) 260-1300 Email: info@phoenixspi.ca
www.phoenixspi.ca
Phoenix SPI was commissioned by Human Resources and Skills Development Canada (HRSDC) to conduct a survey with Canadians 18 years and older, to explore issues related to the Employment Insurance (EI) Program. This study, which tracks data from similar surveys conducted from 1998 to 2009, was undertaken in order to explore public perceptions of the EI program and related matters. The telephone survey was completed by 1,508 respondents March 15-31, 2010. Based on a sample of this size and structure, the overall results can be considered to be accurate to within +/- 2.7%, 19 times out of 20.
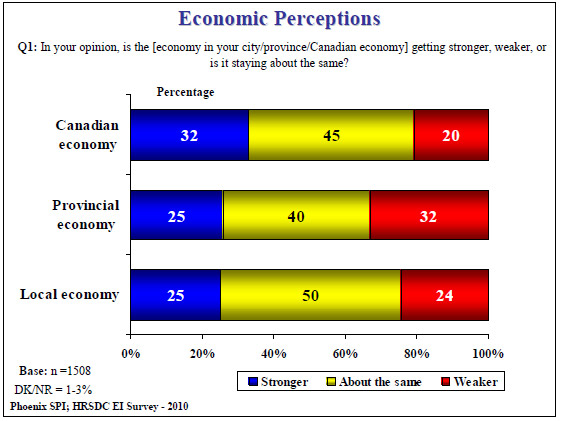
Canadians have mixed views on the economy. The largest proportion (40-50%) feel that the economy is staying about the same at each level (local, provincial, and national). Half feel that their local economy is stable, with the other half almost evenly split between optimistic and pessimistic assessments. Close to half (45%) feel that the national economy is stable, with the remainder more likely to think it is getting stronger (32%) than weaker (20%). Assessments of provincial economies are most likely to be mixed: 40% describing theirs as stable, one-third as getting stronger, and one-quarter as getting weaker. Assessments of the national economy are in sharp contrast to last year’s. The proportion who think the national economy is weakening has decreased significantly since last year (20% vs. 77% in 2009), with corresponding sharp increases in the proportions who think it is stable (45% vs. 19% in 2009) or getting stronger (32% vs. 2% in 2009).
Despite mixed assessments, a strong majority of employed and self-employed respondents (78%) think it is unlikely that they will lose their jobs in the coming year. However, as was the case last year, fewer than half the employed respondents are categorical about their job security (i.e. that they are not at all likely to lose their job).
Over three-quarters of all respondents (78%) agree that the EI program should offer longer benefits to those who have contributed to the program for many years (with two-thirds expressing strong agreement). Over two-thirds (68%) of employed respondents are confident they could access EI benefits if they were to lose their job. The proportion of employed respondents expressing confidence in this has declined gradually since 2007, from 74% to 68%. Just over one-third of respondents (36%) believe the EI program is being abused by seasonal workers. This represents a slight increase since last year.
Close to half (46%) feel the EI program is fair, with the rest almost equally divided between neutrality (26%) and the perception that the program is unfair (25%). The proportion of Canadians that think the EI program is fair has declined gradually since 2007, from 51% to 46%. Those who described the EI program as unfair most often pointed to eligibility rules to explain why (27%).
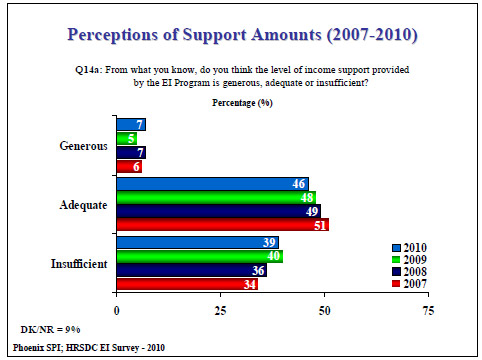
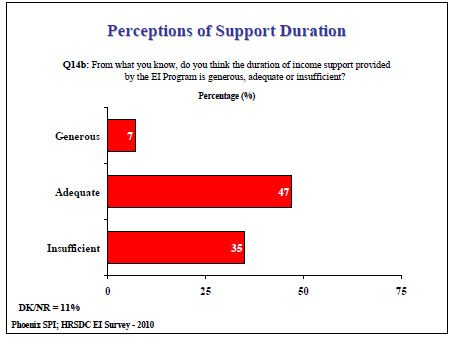
Close to half (46%) think the level of income support provided by the EI program is adequate, with an additional 7% describing it as generous, while 39% think it is insufficient. When it comes to the duration of income support provided by the EI program for loss of employment, close to half of those surveyed (47%) think this is adequate, with an additional 7% describing it as generous. Most of the rest think it is insufficient (35%), while 11% said they did not know.
A majority of Canadians say that the current EI program works well and needs only minor adjustments as problems arise (56%). However, just over one-third (35%) see a need for major reforms. Those who think the EI program would benefit from changes (major or minor) were most likely to say that the benefit period should be expanded (19%).
Close to half of Canadians (47%) say they are not at all aware that additional benefits were available through the EI program for low-income families with children. While the proportion of Canadians at least somewhat aware of such benefits remains relatively low and has changed little since 2001 (31-36%), this year is the first time since tracking of this issue began that the proportion totally unaware of these benefits has dropped below half.
A majority of those who work for an employer indicated that they are very (34%) or somewhat aware (23%) of short-term illness benefits available through the EI program, while one-third said they were not at all aware of this, and 9% said they were not very aware of it. Awareness of short-term illness benefits is at the highest level it has been since tracking began (57% vs. 49% in 2009, 52% in 2008 and 47% in 2007).
One-quarter of respondents indicated that over the past ten years they have been absent from work for more than two weeks due to a short-term illness or injury that required a doctor’s certificate. Two-thirds (65%) of these indicated that they have received income support during their absence, while 35% said they did not. Income support during absence from work due to illness or injury came primarily from EI Sickness benefits (36%) and an employer’s disability plan (30%)
A majority of Canadians (57%) say they are somewhat or very aware of income benefits available to individuals who need to take time off work to care for a gravely ill or dying family member. Of the rest, 36% are not at all aware, while 7% are not very aware of the availability of such benefits. Just over half of Canadians (51%) say they would be very likely to apply for Compassionate Care benefits if they were faced with a situation in which the need for such benefits arose. Another quarter said they would be somewhat likely to do so.
Close to three-quarters of Canadians (72%) are unaware that the Government of Canada has passed legislation providing EI Maternity, Parental, Sickness, and Compassionate Care benefits to self-employed Canadians on a voluntary basis. Sixteen percent claim to be definitely aware of this, and a further 11% claim to be vaguely aware of it.
A majority of self-employed individuals (57%) said they do not intend to opt into the EI program to take advantage of this new measure for the self-employed. The rest were almost evenly divided between those who said they would and those who did not know. Those intending to opt into the EI program were most likely to express interest in compassionate care benefits (63%) and sickness benefits (54%). Approximately onequarter (24%) expressed interest in Parental benefits, and one-in-five expressed interest in Maternity benefits. Extreme caution should be exercised in interpreting these results due to the very small number of self-employed respondents who intend to opt into the EI program (i.e. between 24-62 respondents depending on the question asked).
Among self-employed respondents who do not intend to opt into the EI program (n = 125), the main reason given to explain why is lack of need (54%).
The vast majority of Canadians (91%) are unaware of the creation of the Canada Employment Insurance Financing Board (CEIFB) – virtually identical to 2009 numbers.
A majority of Canadians (70-78%) were unaware of various measures undertaken by the government to enhance Employment Insurance and provide additional funding for skills development and training.
I hereby certify as a Senior Officer of Phoenix Strategic Perspectives that the deliverables fully comply with the Government of Canada political neutrality requirements outlined in the Communications Policy of the Government of Canada and Procedures for Planning and Contracting Public Opinion Research. Specifically, the deliverables do not contain any reference to electoral voting intentions, political party preferences, standings with the electorate, or ratings of the performance of a political party or its leader.
Philippe Azzie, Vice-President, Phoenix Strategic Perspectives Inc.
Supplier Name: Phoenix Strategic Perspectives Inc.
PWGSC Contract Number: G9178-090003/001/CY
POR Number: 090-09
Award Date: February 16, 2010
Fieldwork Completion Date: March 31, 2010
Contract amount: $72,030.00 (inc. GST)
To obtain more information on this study, please e-mail
nc-por-rop-gd@hrsdc-rhdcc.gc.ca.
Ressources humaines et Développement des compétences Canada (RHDCC) a retenu les services de Phoenix SPI pour réaliser une enquête auprès des Canadiens de 18 ans et plus sur le régime d’assurance-emploi (AE). Ce sondage, qui reprend des questions posées de 1998 à 2009, dans le cadre d’enquêtes similaires, a été entrepris afin de connaître l’opinion publique concernant le programme d’AE et d’autres dossiers s’y rapportant. Le questionnaire a été administré par téléphone à 1 508 répondants, du 15 au 31 mars 2010. Les résultats obtenus d'un échantillon de cette taille et de cette nature comportent une marge d'erreur de plus ou moins 2,7 %, 19 fois sur 20.
Les Canadiens sont d’avis partagés en ce qui concerne l’économie. La plus forte proportion (40 %-50 %) des répondants estiment que l’économie demeure sensiblement la même à tous les niveaux (local, provincial et national). La moitié des répondants sont d’avis que la santé de leur économie locale se maintient, tandis que l’autre moitié est autant partagée entre des avis optimistes et pessimistes. Près de la moitié (45 %) des répondants sont d’avis que la santé de l’économie nationale se maintient, tandis que les autres répondants sont plus susceptibles de penser qu’elle s’améliore (32 %) au lieu de s’affaiblir (20 %). Les opinions sur la santé des économies provinciales sont les plus diverses: 40 % des répondants estimant que l’économie de leur province se maintient, un tiers qu’elle s’améliore, et le quart qu’elle s’affaiblit. Les opinions sur l’économie du pays sont en fort contraste avec celles de l’année dernière. La proportion des répondants qui sont d’avis que l’économie nationale s’affaiblit a fortement baissé par rapport à l’année dernière (20 % c. 77 % en 2009), avec de nettes augmentations dans les proportions de répondants qui sont d’avis que l’économie se maintient (45 % c. 19 % en 2009) ou qu’elle s’améliore (32 % c. 2 % en 2009).
Malgré la diversité des opinions, une forte majorité (78 %) des répondants occupant un emploi et des travailleurs autonomes ne craignaient pas de perdre leur emploi au cours de la prochaine année. Toutefois, comme c’était le cas l’an dernier, moins de la moitié des répondants occupant un emploi considéraient qu’il n’était pas du tout probable qu’ils perdent leur emploi.
Plus des trois quarts de l’ensemble des répondants (78 %) étaient d’avis que le régime d’AE devrait offrir de plus longues périodes de prestations à ceux qui ont cotisé au programme pendant de nombreuses années (avec les deux tiers étant d’un fort niveau d’accord avec cet énoncé). Plus des deux tiers (68 %) des répondants occupant un emploi étaient confiants qu’ils seraient admissibles aux prestations d’AE s’ils perdaient leur emploi. La proportion des répondants occupant un emploi et ainsi confiants a baissé progressivement depuis 2007, passant de 74 % à 68 %. Tout juste plus d’un tiers des répondants (36 %) étaient d’avis que les travailleurs saisonniers abusent du programme d’AE. Ceci représente une légère augmentation par rapport à l’an dernier.
Près de la moitié des répondants (46 %) étaient d’avis que le programme d’AE est équitable, les autres le trouvant dans des proportions presqu’égales soit ni équitable ni inéquitable (26 %) ou inéquitable (25 %). La proportion de Canadiens qualifiant le programme d’AE d’équitable a baissé progressivement depuis 2007, passant de 51 % à 46 %. Ceux qualifiant le régime d’AE d’inéquitable ont, le plus souvent, pointé les règles d’admissibilité comme raison (27 %).
Près de la moitié des répondants (46 %) étaient d’avis que le niveau de soutien financier procuré par le régime d’AE est adéquat, un autre 7 % le considéraient généreux, tandis que 39 % des répondants étaient d’avis qu’il est insuffisant. Quant à la durée du soutien financier prévue par le régime d’AE en cas de perte d’emploi, près de la moitié des personnes sondées (47 %) étaient d’avis qu’elle est adéquate, et un autre 7 % la considérant généreuse. La plupart des autres étaient d’avis que la durée prévue est insuffisante (35 %), tandis que 11 % des répondants ont indiqué ne pas savoir.
Une majorité des Canadiens était d’avis que le régime actuel d’AE fonctionne bien et ne nécessiterait que de légers changements au besoin (56 %). Toutefois, un peu plus du tiers des répondants (35 %) était d’avis que des réformes importantes sont nécessaires. Les répondants qui étaient d’avis que des changements (importants ou mineurs) devraient être apportés au régime d’AE ont surtout proposé d’accroître la durée de la période de prestations (19 %).
Près de la moitié des Canadiens (47 %) n’étaient pas du tout au courant que le régime d’AE augmente les prestations versées aux familles à faible revenu ayant des enfants. Bien que la proportion de Canadiens disant être assez ou très au courant de ces prestations demeure relativement faible et n’a pas beaucoup changé depuis 2001 (variant entre 31 % et 36 %), c’est la première fois cette année depuis que les résultats de cette question sont suivis par le sondage-ci que la proportion des répondants n’étant pas du tout au courant de cette mesure est inférieure à un taux de 50 %.
Une majorité des répondants occupant un emploi étaient très au courant (34 %) ou assez au courant (23 %) des prestations pour maladie de courte durée offertes par le régime d’AE, tandis qu’un tiers n’étaient pas du tout au courant de ces prestations, et un 9 % étaient peu au courant de ces prestations. La proportion de répondants occupant un emploi et étant (assez ou très) au courant des prestations de maladie a atteint un sommet depuis le début du suivi (57 % c. 49 % en 2009, 52 % en 2008 et 47 % en 2007).
Un quart des répondants ont indiqué qu’au cours des 10 dernières années, ils ont dû s’absenter du travail pendant plus de deux semaines en raison d’une maladie de courte durée ou d’une blessure pour laquelle ils devaient fournir un certificat médical. Les deux tiers (65 %) de ces répondants ont indiqué avoir bénéficié d’un soutien du revenu durant cette période, tandis que 35 % n’ont pas bénéficié d’un tel soutien. Les sommes reçues à titre de soutien du revenu durant une absence liée à une maladie de courte durée ou à une blessure provenaient pour la plupart des prestations de maladie du régime d’AE (36 %) ou du régime pour invalidité de l’employeur (30 %).
Une majorité (57 %) des Canadiens ont dit être assez au courant ou très au courant que des prestations de revenu sont offertes aux personnes qui doivent s’absenter temporairement de leur emploi afin de prodiguer des soins à un membre de leur famille gravement malade ou mourant. Des autres répondants, 36 % ont dit qu’ils n’étaient pas du tout au courant de ces prestations, tandis que 7 % ont dit qu’ils étaient peu au courant de ces prestations. Un peu plus de la moitié des Canadiens (51 %) ont dit qu’à l’avenir, ils demanderaient très probablement des prestations de compassion si, un jour, la situation l’exigeait. De plus, un quart des répondants ont jugé assez probable leur recours à de telles prestations, à l’avenir.
Près des trois quarts des Canadiens (72 %) ont dit ne pas être au courant du fait que le gouvernement du Canada a adopté un projet de loi qui vise à offrir, sur une base volontaire, les prestations de maternité, parentales, de maladie et de compassion aux travailleurs autonomes canadiens. Seize pourcent ont affirmé être très au courant de cette mesure, en plus de 11 % qui ont affirmé être vaguement au courant.
Une majorité (57 %) des travailleurs autonomes ont dit ne pas avoir l’intention de participer au régime d’AE en vue de tirer profit de cette nouvelle mesure pour les travailleurs autonomes. Les autres personnes interviewées ont indiqué, dans des proportions presqu’égales, qu’elles participeraient au régime ou qu’elles ne savent pas si elles le feront. Les travailleurs autonomes qui ont l’intention de participer au régime d’AE étaient plus enclins à exprimer de l’intérêt à l’égard des prestations de compassion (63 %) et des prestations de maladie (54 %). Environ un quart (24 %) ont exprimé de l’intérêt pour les prestations parentales, et une personne sur cinq a exprimé de l’intérêt pour les prestations de maternité. Compte tenu du très faible nombre de travailleurs autonomes ayant indiqué avoir l’intention de participer au régime d’AE (c.-à-d. entre 24 et 62 répondants, selon la question), il faut faire preuve d’une très grande précaution en interprétant ces résultats.
La principale raison invoquée par les travailleurs autonomes qui n’ont pas l’intention de participer au régime d’AE (n = 125) est de ne pas avoir besoin des prestations (54 %).
La grande majorité des Canadiens (91 %) ont dit ne pas être au courant de la création de l’Office de financement de l’assurance-emploi du Canada (OFAEC). Ce résultat est presqu’identique à celui de 2009.
Une majorité des Canadiens (entre 70 % et 78 %) ont dit ne pas être au courant des diverses mesures que le gouvernement a mises en place pour améliorer l’assurance-emploi et pour augmenter les fonds destinés au développement des compétences et à la formation.
En ma qualité d’Agent principal de Phoenix Strategic Perspectives, je certifie par la présente que les produits livrés sont en tout point conformes aux exigences du gouvernement du Canada en matière de neutralité politique qui sont décrites dans la Politique de communication du gouvernement du Canada et dans la Procédure de planification et d'attribution de marchés de services de recherche sur l'opinion publique. Plus particulièrement, les produits livrés ne contiennent aucune référence sur les intentions de vote électoral, les préférences quant aux partis politiques, les positions des partis ou l'évaluation de la performance d'un parti politique ou de ses dirigeants.
Philippe Azzie, vice-président, Phoenix Strategic Perspectives Inc.
Nom du fournisseur : Phoenix Strategic Perspectives Inc.
Numéro du contrat conclu avec TPSGC : G9178-090003/001/CY
Numéro ROP : 090-09
Date d’attribution du contrat : 16 février 2010
Date d’achèvement du travail sur le terrain : 31 mars 2010
Montant du contrat : 72 030,00 $ (avec TPS)
Pour de plus amples renseignements sur cette étude, prière d’en faire la demande par
courriel à cette adresse : nc-por-rop-gd@hrsdc-rhdcc.gc.ca.
Human Resources and Skills Development Canada (HRSDC) commissioned Phoenix Strategic Perspectives to conduct a survey among the general public on issues related to the Employment Insurance program.
The Department has conducted a survey exploring public perceptions of the Employment Insurance (EI) program and related issues on an almost annual basis for the last 12 years. Given the changing nature of work occurring in the Canadian labour market, there is a need to continue annual tracking of public attitudes on various aspects and elements of the EI program to ensure the program remains responsive to the needs of workers. In particular, evidence obtained is used to support and develop policy recommendations and considerations. The annual nature of the survey allows for longitudinal insight to help identify emerging policy issues by tracking incremental changes in the perspectives of Canadians.
The tracking of EI issues has been an ongoing HRSDC research activity since 1998. The survey was last conducted in February-March 2009 using a regionally-stratified probability sample of 1,515 Canadians. The surveys conducted in January-February 2008 (n = 1,511), and January 2007 survey (n = 1,500) also used regionally-stratified probability samples of Canadians. The March 2005 survey used a sample of 1,752 adult Canadians, including an over-sample of 426 Canadians who have been in a situation where the demands of their jobs were in conflict with the need to provide care for a gravely ill family member. Previously, surveys of 1,500 adult Canadians were conducted in January 2001 and December 2001. In 2003, the EI Tracking Survey was conducted among 1,500 adult Canadians, with an over-sample of 200 self-employed workers. In 2004, the survey was conducted among 1,500 adult Canadians in March, followed by a sample of 1,652 self-employed workers in April.
The 2010 EI Tracking Survey focussed on the following topics:
Results of the survey will be used by EI Policy as part of its ongoing monitoring of the program, as well as for communications purposes. In addition, the survey results may provide direction for future research on EI program elements and other related issues. Finally, the survey will also provide an opportunity to analyse findings following recent EI initiatives alongside normal EI operations.
To address the research objectives, a telephone survey was conducted among 1,508 Canadian residents, aged 18 years and over. The national findings based on the sample used in this study are accurate to within ± 2.7%, 19 times out of 20. The fieldwork for this study took place March 15-31, 2010.
A disproportionately stratified sample was used in order to improve the accuracy of regional and provincial results. The survey sample frame is presented in the table below:
| Area | Sample Frame | |
|---|---|---|
| # of Interviews | Margin of Error | |
| Atlantic Provinces | 202 | +/- 6,9 |
| Quebec | 354 | +/- 5,2 |
| Ontario | 400 | +/- 4,9 |
| Prairie Provinces | 352 | +/- 5,6 * |
| Manitoba | 100 | +/- 9,8 |
| Saskatchewan | 100 | +/- 9,8 |
| Alberta | 152 | +/- 7,9 |
| British Columbia | 200 | +/- 6,9 |
| Canada | 1,508 | +/- 2,7 * |
* Note: The margin of error on findings for Canada and the Prairie region has been adjusted to take into account sample stratification.
Before undergoing analysis, the survey results were weighted to ensure that they accurately reflect the actual distribution of Canadians across the country and to allow the data to be treated as a regionally proportional random sample. Statistics Canada data were used to develop the weighting scheme to bring the results in line with the national distribution of Canadians. For the Prairie region, the component provinces were first weighted internally, and then the region was weighted with other provinces as an aggregate. This was done to ensure that when the region is looked at as a whole, the findings accurately reflect the geographic distribution of Canadians within that region. The survey data were also weighted by gender and age.
In addition, the following specifications applied to this study:
The following table presents information about the call disposition for this survey, as well as the response rate calculation (using the MRIA formula):
| Total Numbers Accepted | 23,632 | |
|---|---|---|
| Total out of scope | 6474 | |
| Numbers not in service | 6376 | |
| Business, non-residential | 98 | |
| Duplicates | ||
| Blocked by telephone company | ||
| Unresolved | 7454 | |
| Busy, no answers, answering machines | 7454 | |
| Retired, called 8 times without success | ||
| In-scope Non-responding | 7750 | |
| Unavailable | 844 | |
| Household refusal | 6767 | |
| Break offs | 139 | |
| In-scope Responding units | 1954 | |
| Completes | 1508 | |
| Ineligible | 94 | |
| Quota filled | 0 | |
| Language disqualified | 352 | |
| Response Rate | 9 % | |
Throughout this report, the terms ‘respondents’ and ‘Canadians’ are used interchangeably to designate survey participants.
Appended to this report are copies of the questionnaire in English and French.
This section explores Canadians’ perceptions of the economy at this point in time.
Canadians had mixed views on the economy, with no more than half pronouncing themselves one way or another regarding the economic outlook at any level (i.e. local, provincial, and national).
The largest proportion felt that the economy is staying about the same at each level. This assessment was most widespread regarding the local economy. Exactly half of Canadians felt that their local economy is stable, with the other half almost evenly split between optimistic and pessimistic assessments. Close to half (45%) felt that the national economy is staying about the same, with the remainder more likely to think it is getting stronger (32%) than weaker (20%). Assessments of provincial economies were most likely to be mixed, with 40% thinking their provincial economy is about the same, one-third thinking it is getting stronger, and one-quarter thinking it is getting weaker.
Text description of Figure 1: Economic Perceptions
Assessments of the national economy are in sharp contrast to those that accompanied last year’s economic downturn. The proportion who think the national economy is weakening has decreased significantly compared to last year (20% vs. 77% in 2009), and there has been a corresponding sharp increase in the proportions who think the economy is stable or getting stronger. Current perceptions of the national economy are more in line with what they were between 2003 and 2008.
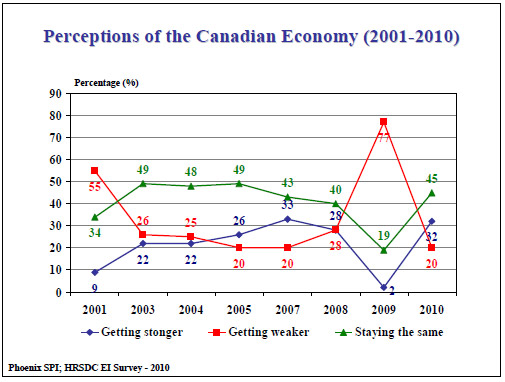
Text description of Figure 2: Perceptions of the Canadian Economy (2001-2010)
A strong majority (78%) of employed and self-employed respondents1 (n = 698) think it unlikely that they will lose their job in the next year (with close to half describing this as not at all likely). Conversely, 18% viewed this as somewhat or very likely.
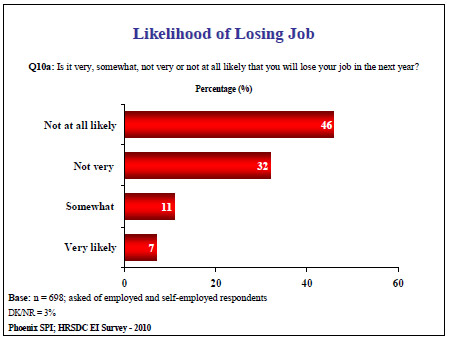
Text description of Figure 3: Likelihood of Losing Job
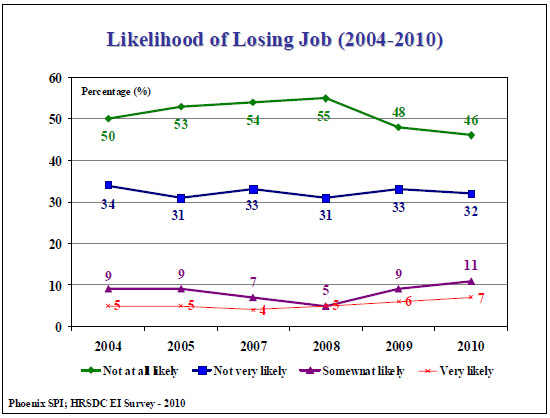
As was the case last year, fewer than half the employed respondents are definite about their job security (i.e. that they are not at all likely to lose their job). Moreover, there has been an increase since 2008 in the proportion of respondents who think their job is not secure (18% thinking they are ‘somewhat’ or ‘very’ likely to lose their job in the next year vs. 15% in 2009 and 10% in 2008).
Text description of Figure 4: Likelihood of Taking Action if Job Lost (2004-2010)
Of those who think it at least somewhat likely that they will lose their jobs in the next year (n = 114), a majority (54%) think that if this were to happen, it would be within the next six months. Thirty-nine percent think it would be in the latter half of the next year.
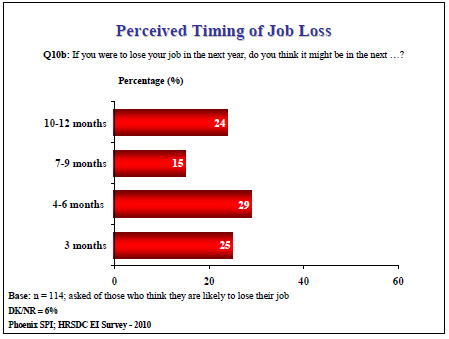
Text description of Figure 5: Perceived Timing of Job Loss
Employed Canadians who said they were at least somewhat likely to lose their jobs during the next year (n = 114)2 were asked how likely they would be to do each of the following if they did lose their job:
No more than one-third, or thereabouts, indicated that they would be likely to undertake any of these measures. Just over one-third (35%) said they would be likely to try to start their own business or become self-employed. Slightly fewer said they would be likely to find a new job where they live, as good as or better than their current job within 12 months (33%), or move to seek employment in their occupation in another location in Canada (31%). Just over one-quarter (28%) said they would be likely to move to seek employment in a different occupation in another location in Canada.
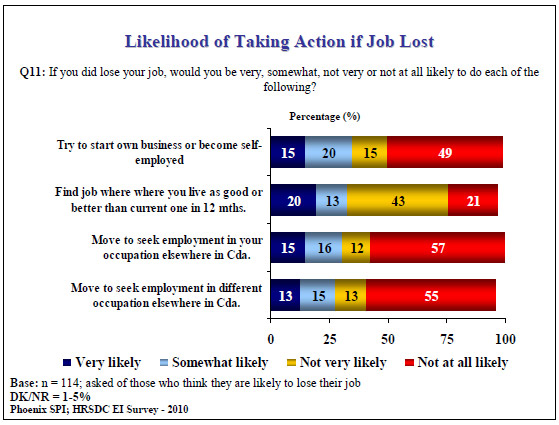
Text description of Figure 6: Likelihood of Taking Action if Job Lost
Looked at another way, majorities said they were unlikely to take any of these measures. Over two-thirds said they would be unlikely to move, whether to seek employment in their occupation (69%) or in a different occupation (68%) in another location in Canada. Moreover, majorities were definite that they would not undertake either of these measures. Almost two-thirds (64%) said they would be unlikely to try to start their own business or become self-employed, or find a new job where they live, as good as or better than their current job within 12 months. Nearly half (49%) said it was not at all likely that they would start their own business or become self-employed.
The proportion that thinks it likely that they will find a new job where they live (should they lose their current job) as good or better than their current job is virtually identical to what it was last year, and the second time since tracking began that fewer than half the respondents concerned indicated that this is likely. The proportion that thinks it is likely to start its own business or become self-employed is virtually identical to what it was last year, the first time this issue was explored.
The proportion that thinks it is likely to move to find employment in a different occupation is the lowest it has been since tracking began, while there continues to be fluctuation in the perceived likelihood of moving in order to find employment in the same occupation (31% vs. 46% in 2009, 33% in 2008, and 45% in 2007).
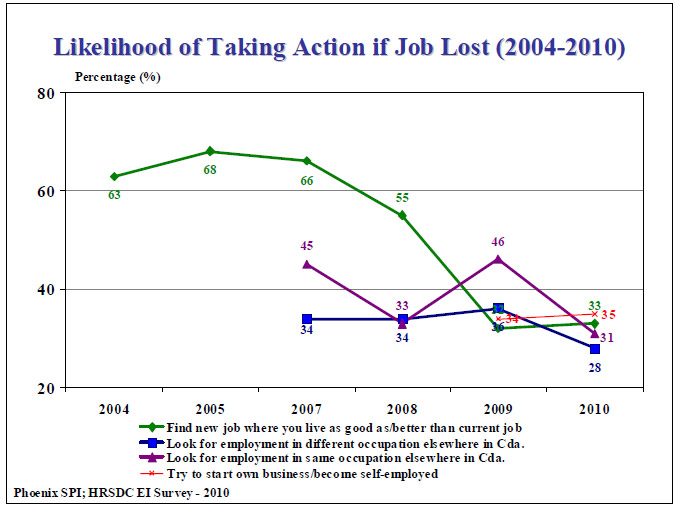
Text description of Figure 7: Likelihood of Taking Action if Job Lost (2004-2010)
This section explores respondents’ use, perceptions, and knowledge of the Employment Insurance program.
In total, just over one-quarter of surveyed Canadians said they received EI benefits at some point in the last five years, while the rest have not.
Of those who received benefits, 14% received them once in the past five years, 9% received them 2-3 times, and 5% received them 4 or more times.
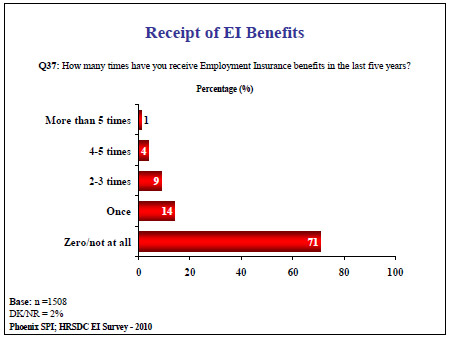
Text description of Figure 8: Receipt of EI Benefits
Among those who received EI benefits in the last five years (n = 380), job loss was the reason cited most often (49%). This was followed, at a distance, by maternity leave (19%), illness (13%), lay-off/shortages of work due to the nature of employment and parental leave (9% each), seasonal work (7%), returning to school or an apprenticeship program (5%), and contract termination and Compassionate Care benefits (2% each). Included in the ‘other’ category are moving and injury/disability.
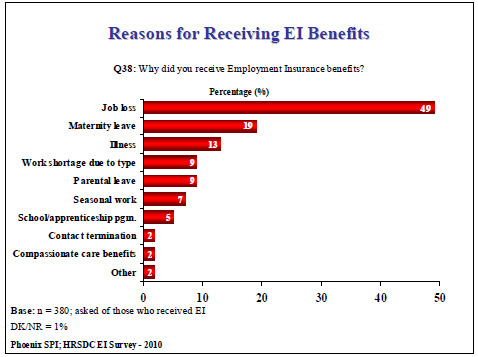
Text description of Figure 9: Reasons for Receiving EI Benefits
Job loss remains the most frequently identified reason for receiving EI benefits, and the likelihood of identifying it has increased since tracking began (49% vs. 45% in 2009, and 42% in 2008).
The vast majority (87%) of those who received EI benefits within the last five years due to job-loss (including work shortage, seasonal work, or contract termination) said they did not move to try to find work while receiving benefits. Conversely, 13% said they did.
Results are virtually identical to those from 2009 and 2008.
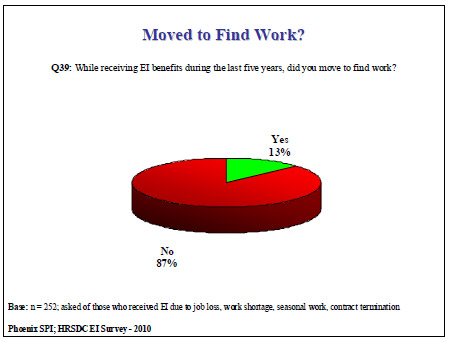
Text description of Figure 10: Moved to Find Work?
Seventeen percent of respondents reported that someone else in their household received EI benefits during the last five years. Nearly all the rest (80%) said no one received these benefits, while 3% did not provide a response or said the question did not apply to them.
Results are virtually identical to those from 2009 and 2008.
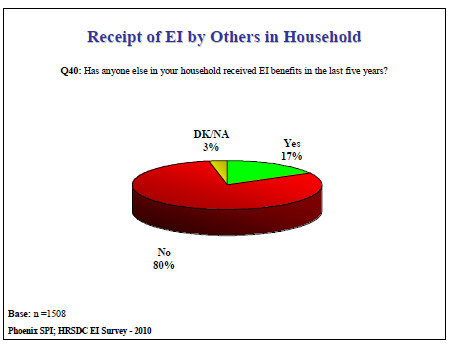
Text description of Figure 11: Receipt of EI by Others in Household
Job loss also emerged as the most likely reason for others in the household receiving EI benefits. Forty-one percent of respondents who said someone else in their home had received EI benefits (n = 234) said it was because of job loss. This was followed, in declining order of frequency, by maternity leave (20%), illness and seasonal work (11% each), lay-off/shortage of work due to type of employment (9%), parental leave (7%), Compassionate Care benefits (3%), and returning to school or an apprenticeship program (2%).
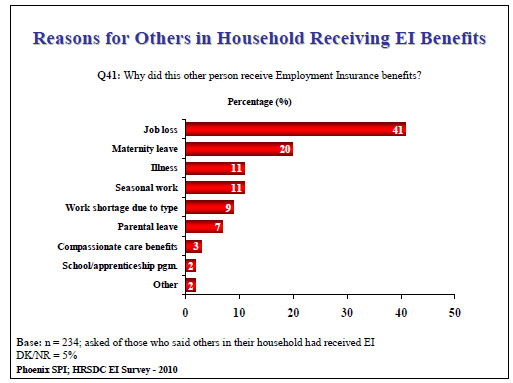
Text description of Figure 12: Reasons for Others in Household Receiving EI Benefits
Included in the ‘other’ category are injury/disability, bankruptcy, and contract termination. Results are very similar to those of 2009 and 2008.
Respondents were asked to rate their level of agreement with the following three statements about the EI program (using a 7 point scale where 1 = strongly disagree, 4 = neutral and 7 = strongly agree):
Over three-quarters of all respondents (78%) agreed that the EI program should offer longer benefits to those who have contributed to the program for many years (with twothirds expressing strong agreement). The rest were equally divided between neutrality and disagreement in response to this statement (11% each). Among employed respondents (n =698), over two-thirds (68%) agreed that they are confident they could access EI benefits if they were to lose their jobs (60% expressing strong agreement). Conversely, 18% disagreed, while 12% were neutral. Perceptions were mixed in reaction to the statement that too many people stay in seasonal jobs to collect benefits: 36% agreed, 30% disagreed, and 30% provided a neutral response to this statement.
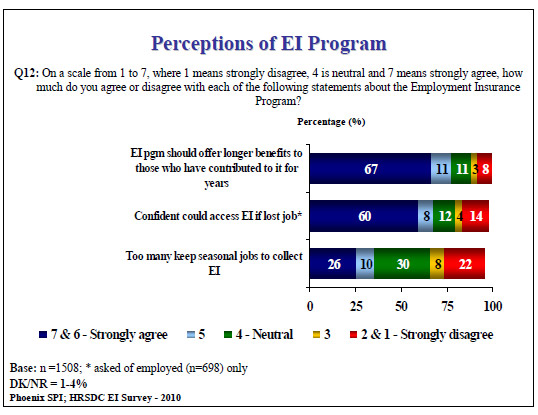
Text description of Figure 13: Perceptions of EI Program
Between two-thirds and three-quarters of Canadians (68-74%) have expressed confidence in their ability to access EI benefits in each of the studies conducted since 2001. The level of strong confidence shows a marginal decrease since 2008, halting the slight gradual increase evident since 2005. That said, the level of strong confidence has varied by no more than 6 percentage points since tracking began (i.e. between 60% and 66%).
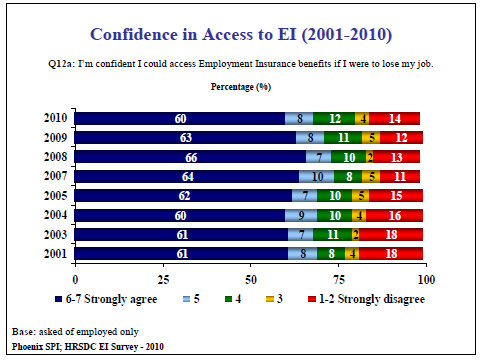
Text description of Figure 14: Confidence in Access to EI (2001-2010)
There has been a slight increase since last year in the proportion of Canadians who think that too many people stay in seasonal jobs because they are able to collect the benefits in the off-season. This halts the gradual decline since 2007 in the proportion of Canadians who think this (36% vs. 34% in 2009, 38% in 2008, and 42% in 2007). The proportion that disagrees with this (30%) has declined slightly after remaining unchanged since 2004.
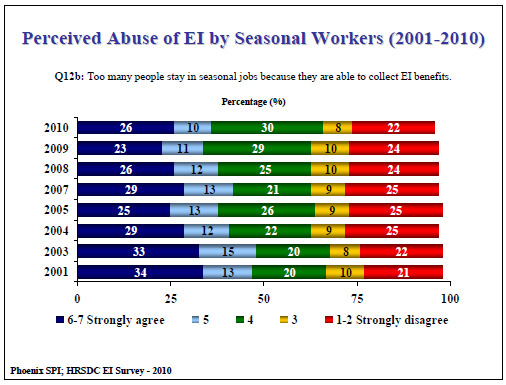
Text description of Figure 15: Perceived Abuse of EI by Seasonal Workers (2001-2010)
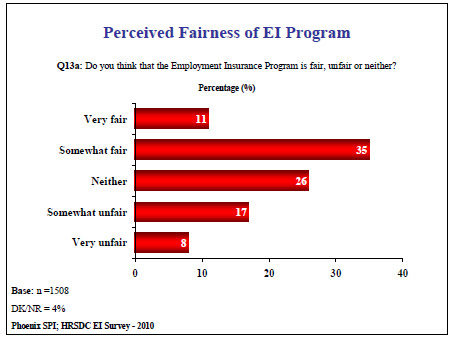
Just under half of respondents said they feel the EI program is somewhat (35%) or very fair (11%). The rest were almost equally divided between neutrality (26%) and the perception that the program is unfair (25%).
Text description of Figure 16: Perceived Fairness of EI Program
The proportion of Canadians that thinks the EI program is fair has declined gradually since 2007, from 51% to 46%. The proportion that perceives the EI program to be unfair has increased by 6% during this same period.
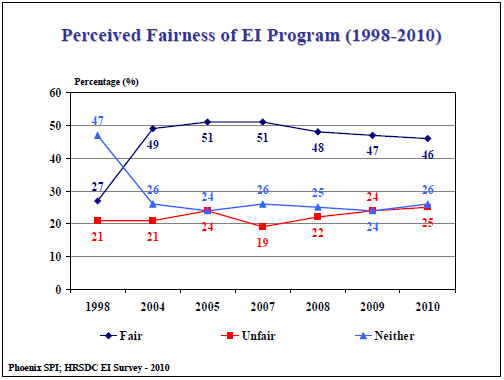
Text description of Figure 17: Perceived Fairness of EI Program (1998-2010)
Respondents who described the EI program as unfair (n = 393), most often pointed to eligibility rules to explain why (27%). This was followed by insufficient benefits and the length of time during which one can receive benefits (13% each), the two-week waiting period (10%), the perception that some people have to pay premiums but cannot collect benefits (9%), and the impression that the system is easy to abuse (6%).
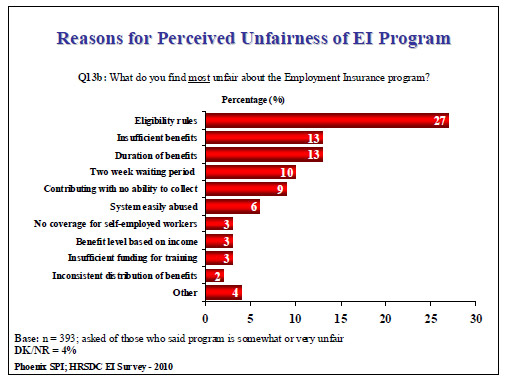
Text description of Figure 18: Reasons for Perceived Unfairness of EI Program
Small numbers (2-3%) identified absence of coverage for self-employed workers, determining benefits based on level of income, insufficient funding for training considerations, and inconsistent distribution of benefits across provinces. Included in the ‘other’ category is the size of the surplus maintained and individual circumstances not being taken into account when assessing claims.
Close to half of those surveyed (46%) said the level of income support provided by the EI program is adequate, with an additional 7% describing it as generous. Most of the rest identified the level of income support as insufficient (39%), while 9% said they did not know or did not provide a response.
Text description of Figure 19: Perceptions of Support Amounts (2007-2010)
Since 2007, the number of Canadians who think the level of support is at adequate to generous has remained relatively consistent, ranging from 53-57%.
Perceptions of the duration of income support for loss of employment provided by the EI program were similar to perceptions of the level of support. Close to half of those surveyed (47%) said the duration of income support provided by the EI program is adequate, with an additional 7% describing it as generous. Most of the rest identified the duration of income support as insufficient (35%), while 11% said they did not know or did not provide a response.
Text description of Figure 20: Perceptions of Support Duration
Just under half of surveyed Canadians (47%) said they are not at all aware that additional benefits are available through the EI program for low-income families with children. A further 15% said they are not very aware of this. Those who claimed to be aware of this were more likely to describe themselves as somewhat aware (22%) than very aware (14%).
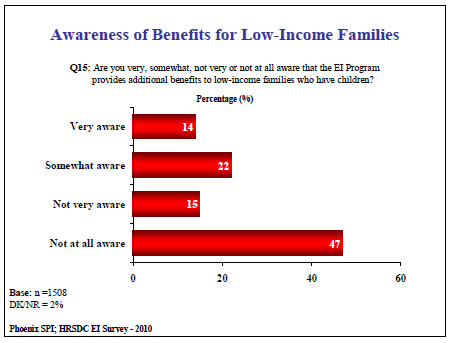
Text description of Figure 21: Awareness of Benefits for Low-Income Families
The proportion of Canadians at least somewhat aware of additional benefits provided by the EI program to low-income families with children remains relatively low and has changed little since 2001 (31-36%). That said, for the first time since tracking of this issue began, the proportion of those totally unaware of these benefits has dropped below half.
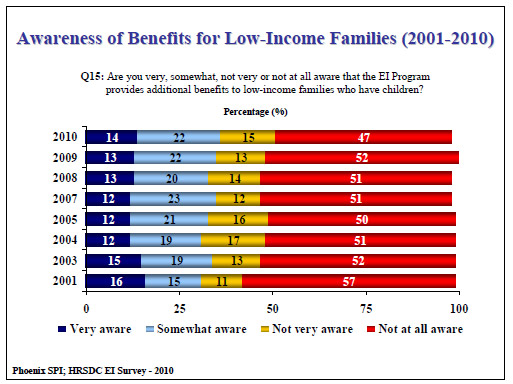
Text description of Figure 22: Awareness of Benefits for Low-Income Families (2001-2010)
A majority of respondents think that the current EI program works well and needs only minor adjustments as needs arise (56%). However, just over one-third (35%) see a need for major reforms. Three percent said it needs neither.
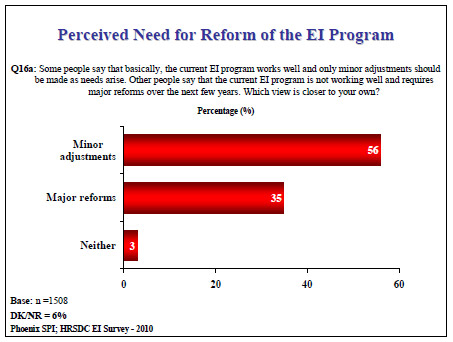
Text description of Figure 23: Perceived Need for Reform of the EI Program
Perceptions regarding the need for changes to the EI program have changed little since last year. That said, there has been a slight increase in the proportion saying the program is working well and in need of only minor adjustments (56% vs. 54% in 2009), and a corresponding slight decrease in the proportion feeling the EI program requires major reforms (35% vs. 37% in 2009). This halts the trend since 2007 which saw an increase in the proportion feeling the EI program requires major reforms, and a decrease in the proportion saying the program is working well and in need of only minor adjustments.
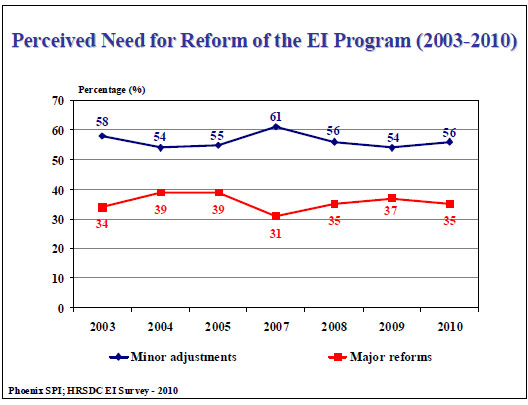
Text description of Figure 24: Perceived Need for Reform of the EI Program (2003-2010)
Respondents who think the EI program would benefit from changes (major or minor) were most likely to say that the benefit period should be expanded (19%), and the level of benefits should be increased (15%) (multiple responses accepted). This was followed by suggestions for expanding eligibility (10%), reducing wait times, cracking down on abuse, and providing more/better training and re-training programs (8% each), providing more benefits to those who have contributed longer (7%), and providing help/incentives to get people back to work (6%).
Smaller and similar numbers (3-4%) see a need to increase benefits for part-time and seasonal workers, review each claimant’s situation individually to better meet his/her needs, provide benefits in proportion to amount paid into the program, restrict eligibility, increase the EI surplus, and increase Parental Leave benefits,
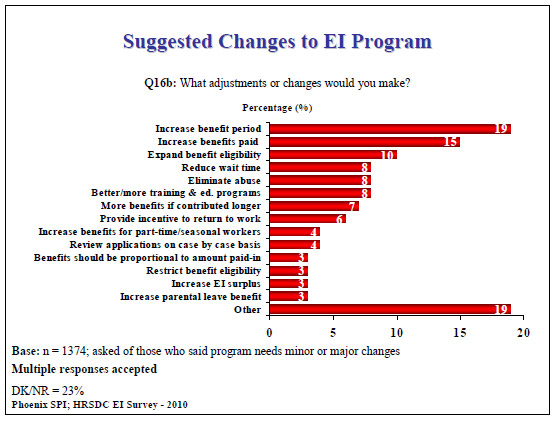
Text description of Figure 25: Suggested Changes to EI Program
Included in the ‘other’ category are ensuring consistency in benefits across regions, taking other aspects into consideration when assessing claims, ensuring benefit levels are proportionate to income level, increasing benefits for people who have lost their job, and increasing the amount of premiums paid by employers.
Almost one-quarter of these respondents (23%) said they do not know what changes should be made.
Overall, suggested adjustments have not changed much since 2005. The most noticeable change is the increase in the proportion suggesting increasing/expanding the benefit period (19% vs. 6% in 2009 and 3% in 2008). Conversely, the likelihood of identifying expanding eligibility has declined (10% vs. 14% in 2009 and 16% in 2008). Increasing the amount of benefits has fluctuated since 2008, as has reducing wait times.
| 2005 % |
2007 % |
2008 % |
2009 % |
2010 % |
|
|---|---|---|---|---|---|
| Increased benefits | 17 | 17 | 15 | 21 | 15 |
| Expand eligibility | 16 | 15 | 16 | 14 | 10 |
| Eliminate abuse | 13 | 13 | 13 | 7 | 8 |
| Reduce wait time | - | 8 | 8 | 13 | 8 |
| Better/more training & ed. programs | - | 8 | 7 | 4 | 8 |
| Provide back-to-work incentives | - | 8 | 7 | 5 | 6 |
| Ristrict eligilility | 10 | 6 | 6 | 7 | 3 |
| Assesments and adjustments* | - | 5 | 6 | - | - |
| Improve service | - | 5 | 3 | - | - |
| Reduce employee/employer premiums | - | - | 3 | - | 2 |
| Increase claim duration | - | - | 3 | 6 | 19 |
Base: asked of those who said program needs minor or major changes
* Note: “personal adjustments” in 2007
Phoenix SPI; HRSDC EI Survey - 2010
This section presents respondent perceptions of issues related to Sickness benefits.
A majority of respondents who work for an employer (57%) indicated that they are at least somewhat aware of short-term illness benefits available through the EI program (34% indicating that they are very aware of such benefits). Conversely, 42% indicated that they have little or no awareness of such benefits.
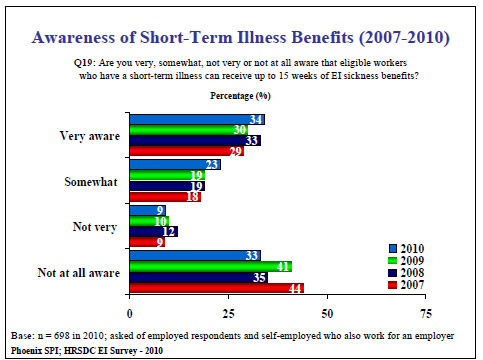
Text description of Figure 26: Awareness of Short-Term Illness Benefits (2007-2010)
Awareness of short-term illness benefits has fluctuated over the past few years, and is at the highest level it has been since tracking began (57% vs. 49% in 2009, 52% in 2008 and 47% in 2007).
One-quarter of respondents indicated that over the past ten years they have been absent from work for more than two weeks due to a short-term illness or injury that required a doctor’s certificate. Results remain virtually unchanged since 2007.
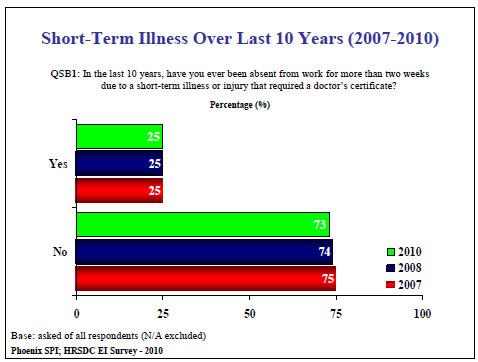
Text description of Figure 26: Short-Term Illness Over Last 10 Years (2007-2010)
The length of time respondents who have taken such absences were away from work varied. Half of them were away from work for at least 7 weeks, with one-in-five absent for over 25 weeks. Most of the rest, 28%, were away for 3-4 weeks. A small number (5%) indicated that they have not yet returned to work.
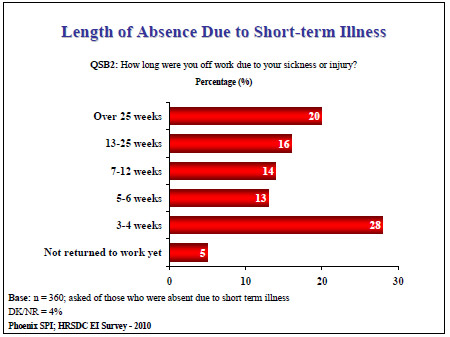
Text description of Figure 28: Length of Absence Due to Short-term Illness
Two-thirds (65%) of those who have been absent from work for more than two weeks due to an illness or injury indicated that they received income support during their absence. Conversely, 35% said they did not.
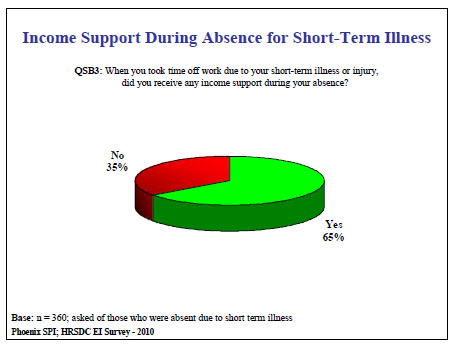
Text description of Figure 29: Income Support During Absence for Short-Term Illness
Compared to 2008, slightly fewer respondents absent from work for more than two weeks due to an illness or injury said they received income support during their absence (65% vs. 70% in 2008).
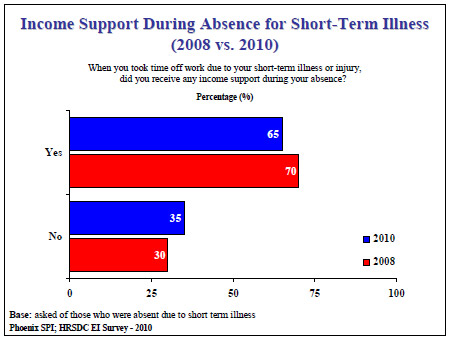
Text description of Figure 30: Income Support During Absence for Short-Term Illness (2008 vs. 2010)
Income support during absence from work due to illness or injury came primarily from EI Sickness benefits (36%) and an employer’s disability plan (30%) (multiple responses accepted). This was followed, in descending order of frequency, by sick leave with pay (20%), Worker’s Compensation (19%), regular pay continued by employer (11%), leave without pay (8%), a personal disability plan (7%), an informal arrangement with an employer (6%), working fewer hours (5%), and CPP disability benefits (3%). Included in the ‘other’ category are personal savings, financial support from family, and insurance plans (unspecified).
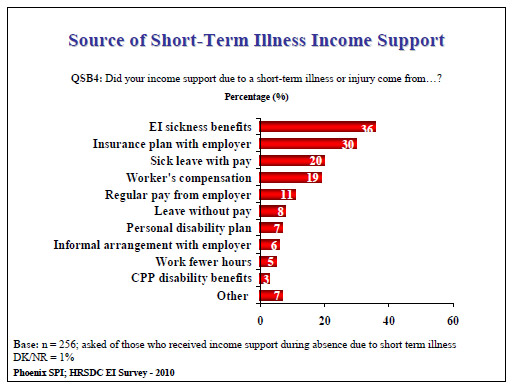
Text description of Figure 31: Source of Short-Term Illness Income Support
This section presents respondent perceptions of issues related to Compassionate Care benefits.
A majority of surveyed Canadians (56%) said they are at least somewhat aware of income benefits available to individuals who need to take time off work to care for a gravely ill or dying family member. Of the rest, 36% said they are not at all aware of such benefits, and 7% said they are not very aware of them.
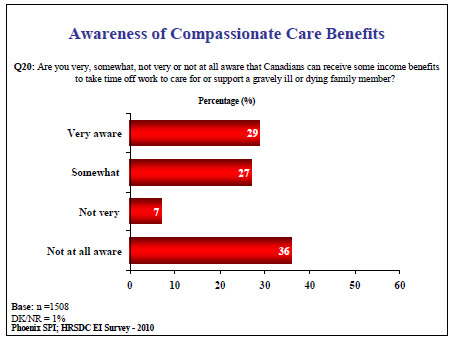
Text description of Figure 32: Awareness of Compassionate Care Benefits
Awareness of Compassionate Care benefits is higher than it was last year, when fewer than half of the respondents claimed to be at least somewhat aware of them. This year’s results are more in line with results prior to 2009 when majorities claimed at least moderate awareness of these benefits (56% vs. 49% in 2009, 51% in 2008, 52% in 2007, and 55% earlier).
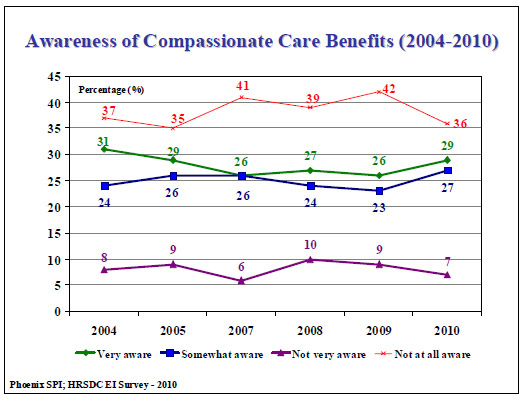
Text description of Figure 33: Awareness of Compassionate Care Benefits (2004-2010)
The large majority of respondents have never been in a situation in which their job demands came into conflict with the need to provide care for a family member. Among those who have, this most often involved one-time medical emergencies (14%), followed closely by being called upon to provide care or support for someone who was gravely ill or dying (12%), and having to take care of someone with a chronic or long-term illness (11%).
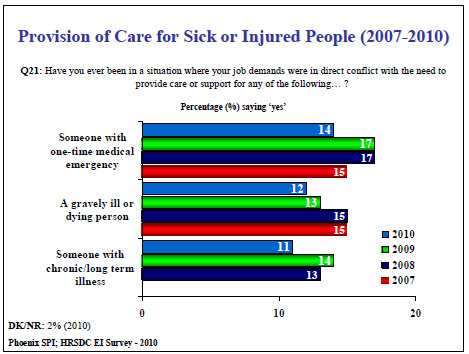
Text description of Figure 34: Provision of Care for Sick or Injured People (2007-2010)
Results have changed little since 2007, though the proportion of respondents reporting involvement in any of these situations is the smallest it has been since tracking began.
Of those who had experienced conflicts between job demands and the need to care for a very ill or dying person (n = 190), two-thirds said they took time off work to accommodate that need while one-third did not.
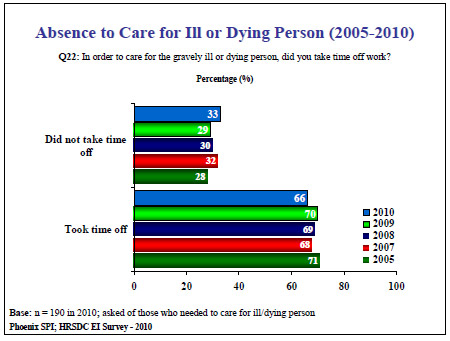
Text description of Figure 35: Absence to Care for Ill or Dying Person (2005-2010)
The proportion of Canadians who reported taking time off work in order to care for a very ill or dying person is the lowest it has been since tracking began in 2005. That said, it has varied by only 5% over this period (i.e. between 66-71%).
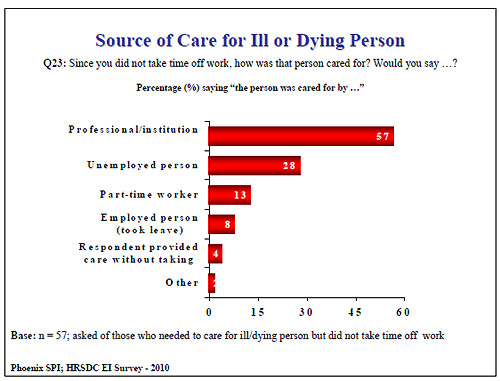
Respondents who have been in a situation where they needed to care for an ill or dying person but who did not take time off work (n = 57) were most likely to say that the ill person was cared for by professional caregivers (57%). This was followed by 28% who said that an unemployed person provided care, 13% who said someone working part-time provided care, and 8% who said that someone else took time off from their work to care for this person (multiple responses accepted).
Four percent said they found time to care for this person even though they did not take time off work.
Text description of Figure 36: Source of Care for Ill or Dying Person
Tracking of this question over time is difficult due to the relatively low incidence of respondents who have found themselves in this situation. However, the data has been consistent insofar as care by a professional or through an institution is the most common solution found by those who did not take time off work for this (57% in 2010, 47% in 2009, 51% in 2008, 48% in 2007, and 58% in 2005).
Among those who took time off to care for a gravely ill or dying person (n = 131), a majority took at least two weeks away from work (37% took 2-6 weeks, and 21% took 7 weeks or more). Just over one-third (35%) took less than two weeks. Two percent volunteered that care is still ongoing.
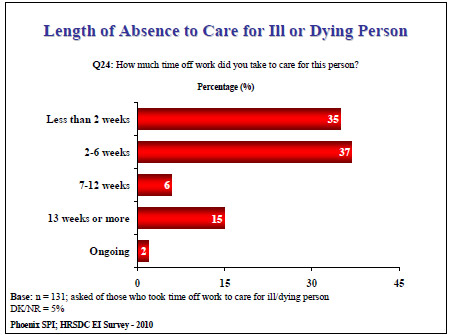
Text description of Figure 37: Length of Absence to Care for Ill or Dying Person
Given the relatively small number of respondents who faced such a situation, the accuracy of conclusions drawn from the tracking data is limited. However, data for the period between 2005 and 2010 indicates that most people who find themselves in this situation end up taking less than seven weeks off work.
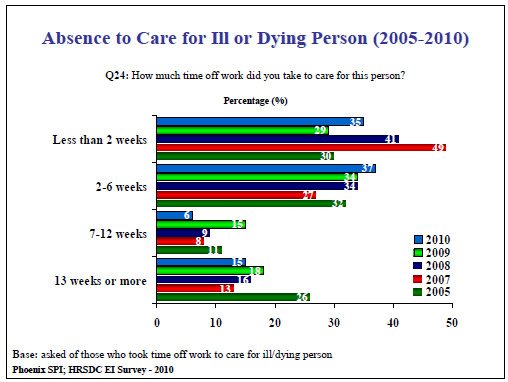
Text description of Figure 38: Absence to Care for Ill or Dying Person (2005-2010)
A majority of those who took time off to care for an ill or dying person (54%) took some form of paid leave, including vacation time (22%), general leave with pay (21%), family leave (6%), or sick leave (5%) (multiple responses accepted).
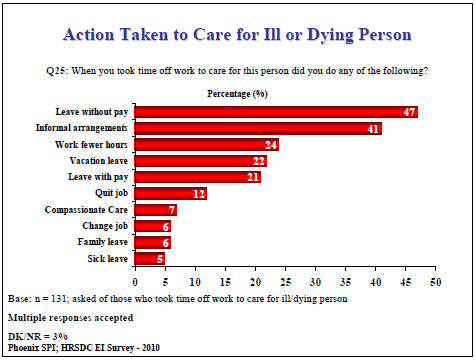
Text description of Figure 39: Action Taken to Care for Ill or Dying Person
Not surprisingly given that most respondents’ absences from work were fairly short, the largest single proportion of those who did take time off took leave without pay (47%), while almost as many (41%) made informal arrangements with their employer. Almost one-quarter (24%) worked fewer hours, while small numbers applied for and received Compassionate Care benefits under the EI program (7%) or changed their jobs (6%).
The likelihood of taking leave without pay has increased (47% vs. 43% in 2009 and 40% in 2008), as has working fewer hours (24% vs. 19% in 2009 and 18% in 2008). Conversely, the likelihood of taking family leave has decreased (6% vs. 15% in 2008-09).
| Action Taken | 2008 % |
2009 % |
2010 % |
|---|---|---|---|
| Leave without pay | 40 | 43 | 47 |
| Informal arragements | 37 | 30 | 41 |
| Vacation leave | 28 | 35 | 22 |
| Leave with pay | 21 | 15 | 21 |
| Work fewer hours | 18 | 19 | 24 |
| Family leave | 15 | 15 | 6 |
| Quit job | 12 | 14 | 12 |
| Seak leave | 8 | 19 | 5 |
| Cahnge job | 5 | 3 | 6 |
| Compassionate care | 5 | 3 | 7 |
Base: asked of those who took time off work to care for ill/dying person
Phoenix SPI; HRSDC EI Survey - 2010
Of those who did not use Compassionate Care benefits during their time away from work to care for a gravely ill or dying person, a majority (52%) said they did not use them because they did not know about them. This was identified four times more often than any other reason. Other reasons include the impression that the benefits were unnecessary (13%), the fact that their situation occurred before such benefits were available (12%), applying but being ineligible (9%), the impression that these benefits would not arrive in time (7%), and uncertainty about qualifying for these benefits (6%).
| Arrangement | 2007 % |
2008 % |
2009 % |
2010 % |
|---|---|---|---|---|
| Unware of benefits | 56 | 47 | 62 | 52 |
| happened before CC available | 17 | 19 | 12 | 12 |
| Unnecessary | 6 | 8 | 6 | 13 |
| Unsure would qualify | 6 | 8 | 4 | 6 |
| Tried, did not qualify | 2 | 4 | 4 | 9 |
| Would not arrive in time | 4 | 3 | 4 | 7 |
| Benefits inadequate | - | 2 | 1 | 1 |
| Employer not supportive | - | 2 | 1 | 1 |
Base: n = 121 in 2010; asked of those who did not use Compassionate Care benefits
Phoenix SPI; HRSDC EI Survey - 2010
Very small numbers identified benefits being inadequate and unsupportive employers.
Lack of awareness of these benefits has fluctuated considerably over time (52% vs. 62% in 2009, 47% in 2008 and 56% in 2007).
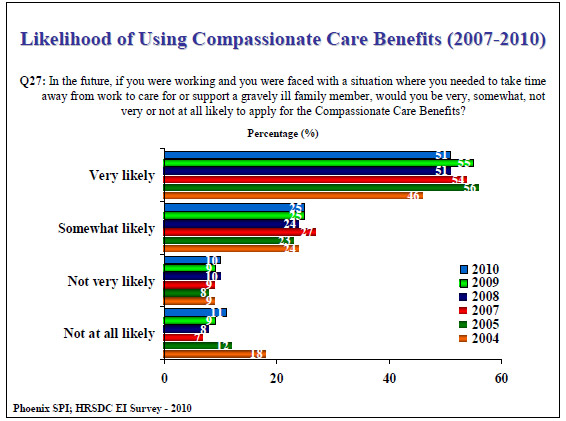
Just over half of surveyed Canadians (51%) said they would be very likely to apply for Compassionate Care benefits if they were faced with a situation in which the need for such benefits arose. Another quarter said they would be somewhat likely to do so. Of the rest, 10% said they would not be very likely to apply for such benefits, and 11% said they would be not at all likely to apply for them.
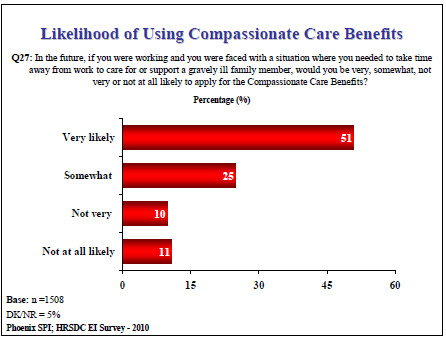
Text description of Figure 40: Likelihood of Using Compassionate Care Benefits
The proportion of respondents saying they would be at least somewhat likely to do this has fluctuated since 2005, but not varied widely (from 75-81%). As well, majorities have said they would be very likely to do this since tracking began.
Text description of Figure 41: Likelihood of Using Compassionate Care Benefits (2007-2010)
Respondents who said they would not apply for Compassionate Care benefits in the future (n = 326) most often explained why by saying that the benefits are not necessary (16%). This was followed by 11% who said that they are not paying EI, 9% who said that their employee benefits would provide sufficient coverage or that they did not want to take time off, and 8% who said that it would be too much of a hassle.
A host of reasons were identified by smaller numbers including the following: the impression that such benefits are not financially necessary and being at retirement age (6% each), uncertainty about qualifying (5%), and being against the idea in principle (4%).
Very small numbers (3%) felt that such benefits would be inadequate or said there was no reason, while 10% said they did not know or did not provide a response.
The likelihood of saying that they do not pay EI as a reason for not applying continues to be lower than in 2007 and 2008 (11% in 2010 and 10% in 2009 vs. 16% in 2008 and 2007). The likelihood of saying that they are against such benefits has declined since 2008 (4% vs. 6% in 2009 and 12% in 2008). The impression that they are not financially necessary, and that it would be too much of a hassle has fluctuated over time.
| Reason | 2007 % |
2008 % |
2009 % |
2010 % |
|---|---|---|---|---|
| Do not pay EI | 16 | 16 | 10 | 11 |
| Not necessary | 13 | 16 | 15 | 16 |
| Employee benefits would cover* | 10 | 16 | 13 | 9 |
| Against it | 4 | 12 | 6 | 4 |
| Unsure would qualify | - | 10 | 5 | 5 |
| Too much hassle | 15 | 8 | 3 | 8 |
| $ not necessary | 10 | 3 | 9 | 6 |
| Could not take time off | 6 | 3 | 6 | 9 |
| Inadequate | 2 | 3 | 6 | 3 |
| Age/would retire | 2 | 2 | 5 | 6 |
| Family responsibility | 3 | - | - | - |
| No reason | 4 | 2 | 4 | 3 |
Base: n = 326 in 2010; asked of those who would not apply for Compassionate Care benefits
Phoenix SPI; HRSDC EI Survey - 2010
* Note: “have other coverage” in 2007
This section explores issues related to the provision of EI benefits to the self-employed. Most of the questions were asked only of self-employed respondents.
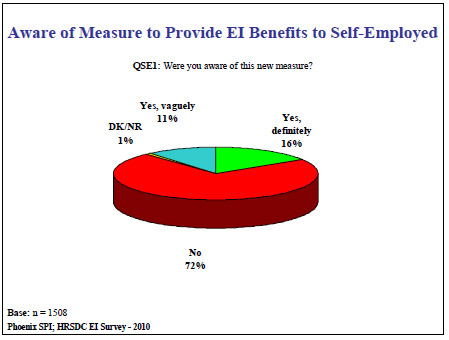
Close to three-quarters of Canadians (72%) were unaware that the Government of Canada had passed legislation providing EI Maternity, Parental, Sickness, and Compassionate Care benefits to self-employed Canadians on a voluntary basis. Sixteen percent claimed to be definitely aware of this, and a further 11% claimed to be vaguely aware of it.
Text description of Figure 42: Aware of Measure to Provide EI Benefits to Self-Employed
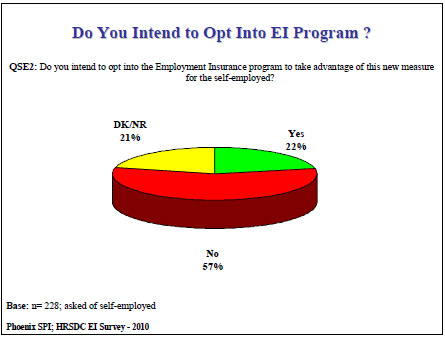
A majority of self-employed individuals (57%) said they do not intend to opt into the EI program to take advantage of this new measure for the self-employed. The rest were almost evenly divided between those who said they would and those who did not know.
Text description of Figure 43: Do You Intend to Opt Into EI Program?
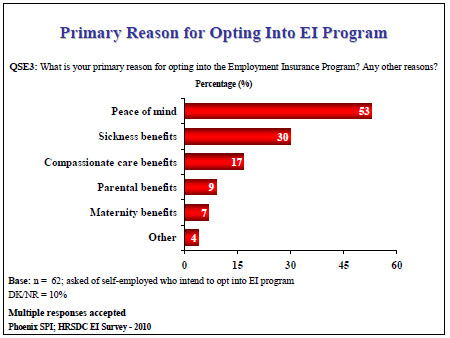
Among self-employed respondents who said they intend to opt into the EI program (n = 62), the main reason given to explain why was the peace of mind that comes from having insurance (53%). Other reasons focused on the ability to access specific benefits. Leading the way was access to Sickness benefits (30%), followed by Compassionate Care benefits (17%), Parental benefits (9%), and Maternity benefits (7%) (multiple responses accepted). Included in the ‘other’ category are the precariousness of the employment situation, and a desire for benefits (unspecified). Ten percent did not know or did not provide an answer.
Text description of Figure 44: Primary Reason for Opting Into EI Program
Self-employed respondents who said they intend to opt into the EI program were asked which of the following types of benefits they are particularly interested in:
Self-employed individuals intending to opt into the EI program were most likely to express interest in Compassionate Care benefits (63%) and Sickness benefits (54%). Approximately onequarter (24%) expressed interest in Parental benefits, and one-in-five expressed interest in Maternity benefits.
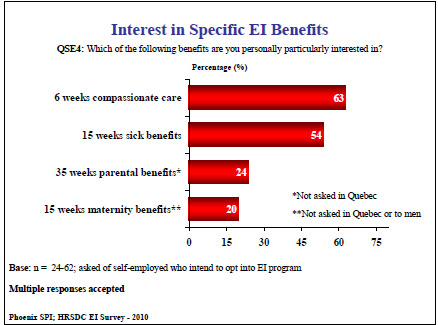
Text description of Figure 45: Interest in Specific EI Benefits
Extreme caution should be exercised in interpreting these results due to the very small number of self-employed respondents who intend to opt into the EI program (i.e. between 24-62 respondents depending on the question asked).
Among self-employed respondents who said they do not intend to opt into the EI program (n = 125), the main reason given to explain why was lack of need (54%). This was the only reason identified by a majority of respondents, and it was identified more than three times as often as any other reason. It was followed at a distance by insufficient information about these measures (16%), and the perception that premiums are too high (10%) (multiple responses accepted). Small numbers (5% each) pointed to the inability to opt out once a claim is made and pre-existing coverage. Included in the ‘other’ category is the perception that benefits are inadequate and being against it in principle.
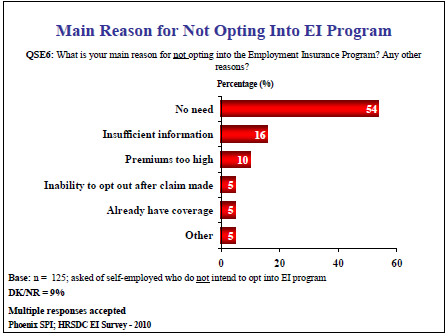
Text description of Figure 46: Main Reason for Not Opting Into EI Program
This section explores awareness of the Canada Employment Insurance Financing Board, created in 2008.
The vast majority of respondents (91%) are not aware of the creation of the Canada Employment Insurance Financing Board (CEIFB). Those who said they are aware of the CEIFB were more likely to be vaguely aware (5%) than definitely aware (3%) of it. Respondents were informed that the CEIFB is designed to manage a reserve and implement a new mechanism to determine the premium rate for Employment Insurance.
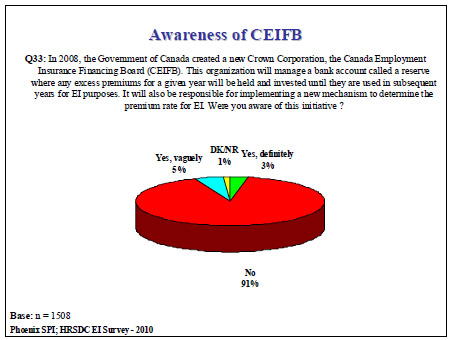
Text description of Figure 47: Awareness of CEIFB
Awareness of the CEIFB is virtually identical to what it was in 2009.
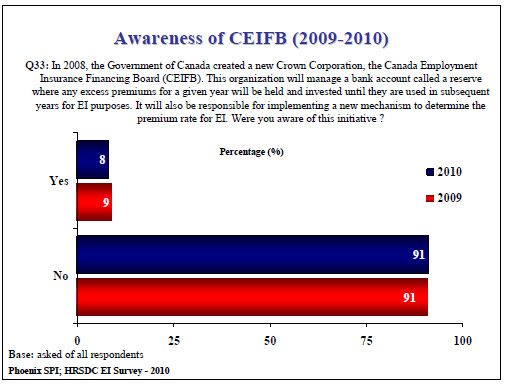
Text description of Figure 48: Awareness of CEIFB (2009-2010)
This section explores the awareness and perspectives of all respondents as they pertain to new initiatives related to the EI program.
A large majority of respondents (70-78%) were unaware of various measures undertaken by the government to enhance Employment Insurance and provide additional funding for skills development and training. Over one-quarter said they were definitely (17%) or vaguely (12%) aware of the measure to increase the maximum duration of benefits available under the EI program by 5 weeks.
One-quarter claimed to be definitely (13%) or vaguely (12%) aware of the measure to provide 5-20 weeks of additional benefits to workers who have worked and paid EI premiums for a significant period of time but who have made limited use of EI regular benefits. Similarly, one-quarter claimed to be definitely (12%) or vaguely (13%) aware of the measure to provide $500 million over two years to extend EI income benefits to Canadians participating in longer-term training and allow earlier access to Employment Insurance benefits for individuals purchasing their own training using earnings resulting from a lay-off. Finally, one-in-five said they were definitely (11%) or vaguely (10%) aware of the measure to maintain Employment Insurance premium rates for 2010.
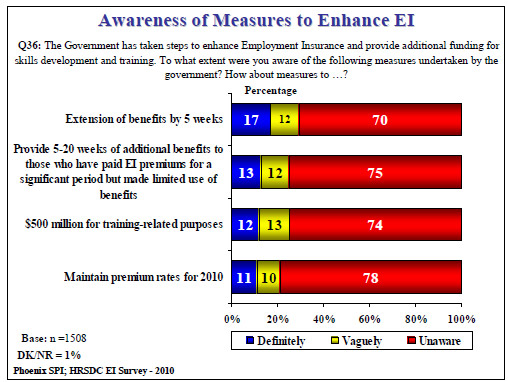
Text description of Figure 49: Awareness of Measures to Enhance EI
Awareness of the measure to increase the maximum duration of benefits available under the EI program by 5 weeks is lower than it was last year (29% vs. 35% in 2009). Awareness of the measure to provide $500 million for training-related purposes is slightly lower than it was last year, while awareness of the measure to maintain premium rates is unchanged.
| Measure | 2009 % |
2010 % |
|---|---|---|
| Increase maximum duration of benefits available by 5 weeks | 35 | 29 |
| Provide $500 million for training-related purposes | 27 | 25 |
| Maintain premium rates Provide $500 million for training | 21 | 21 |
Base: asked of all respondents
Phoenix SPI; HRSDC EI Survey - 2010
This section presents information about the employment status of survey respondents and explores related issues.
Well over half of those surveyed (61%) were employed at the time of the survey. Of those, 44% were employed workers, 11% were self-employed, and 6% were employed students. Of the rest, 19% were retired, 9% were unemployed, 4% were unemployed students, 4% said they are on disability, sick or maternity leave, and 3% were homemakers.
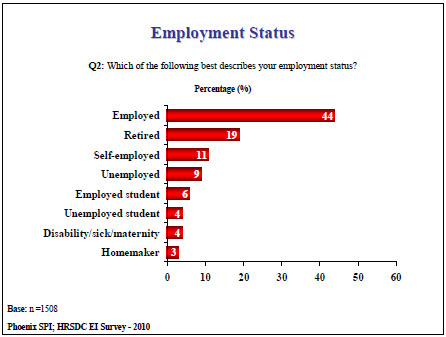
Text description of Figure 50: Employment Status
Please note that the determination of respondents’ employment status for the purpose of analysis included responses to multiple questions.3
Of respondents who identified themselves as self-employed (n = 193), approximately one-in-five (19%) said their employment was seasonal. Just over onethird (34%) said they had employees working for them.
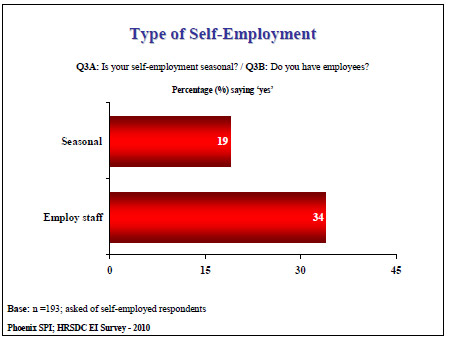
Text description of Figure 51: Type of Self-Employment
Over two-thirds of self-employed respondents (68%) said they work fulltime, while most of the rest do so part-time (31%).
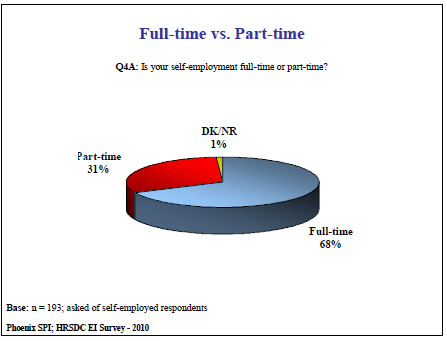
Text description of Figure 52: Full-time vs. Part-time
Although indicating that they work part-time, 14% of respondents who identified themselves as self-employed also said that they work 35 or more hours per week. That said, given the very small sample size available for this group (n = 57) it is not possible to confidently identify the number of hours worked per week by parttime self-employed.
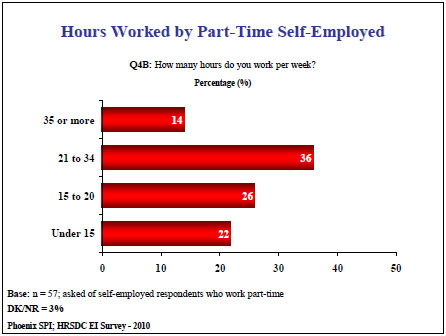
Text description of Figure 53: Hours Worked by Part-Time Self-Employed
The large majority of self-employed respondents said they did not have another job apart from their selfemployment (83%), while the rest said they did (17%).
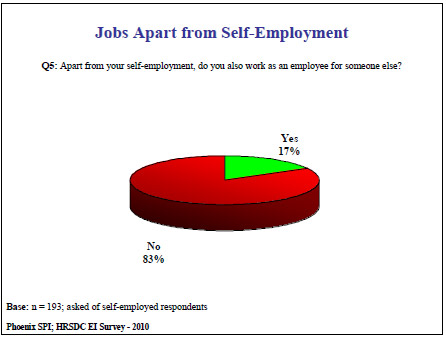
Text description of Figure 54: Jobs Apart from Self-Employment
The vast majority of employed respondents (including self-employed respondents who also work for an employer) were not seasonal workers (88%); only 11% percent said they were.
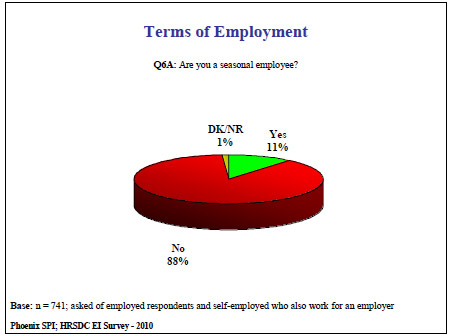
Text description of Figure 55: Terms of Employment
The vast majority of employed respondents (91%) said their employer deducts EI and CPP amounts from their pay.
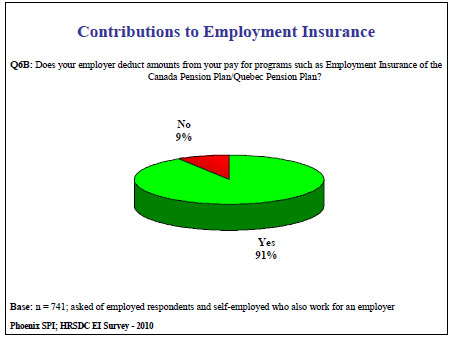
Text description of Figure 56: Contributions to Employment Insurance
Three-quarters of employed respondents, excluding the self-employed who do not also work for an employer, said they were not responsible for managing other employees as part of their job. Nearly all the rest (24%) said that they do have such responsibilities.
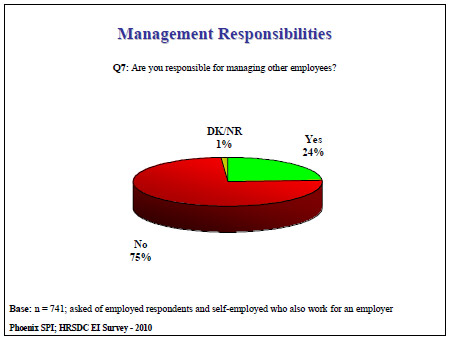
Text description of Figure 57: Management Responsibilities
Nearly three-quarters of employed respondents (73%) said they work 35 hours or more per week. Of the rest, 10% worked between 21 and 34 hours, and 15% worked less than this.
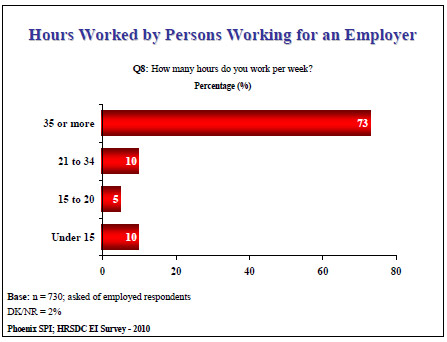
Text description of Figure 58: Hours Worked by Persons Working for an Employer
Well over half of all unemployed respondents and homemakers (61%) said they are looking for work, while most of the rest (36%) indicated that they are not seeking employment.
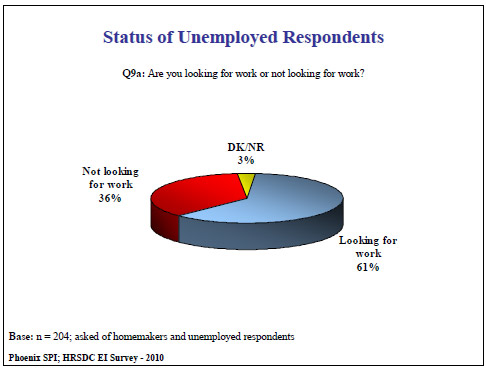
Text description of Figure 59: Status of Unemployed Respondents
A majority of unemployed respondents and homemakers looking for work (57%) estimated that they would be able to find work within three months. Most of the rest (26%) estimated that they could find work within 4-6 months, while 13% felt it would take at least 7 months.
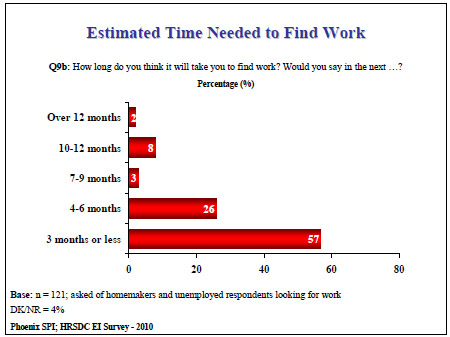
Text description of Figure 60: Estimated Time Needed to Find Work
This section presents subgroup differences for key issues explored in this survey. This includes variations based on gender, language, age, education, region, rural-urban locations, status regarding receipt of EI, and employment status. In addition to these demographic variables, this section also presents relevant variations based on perceptions of the Canadian economy. For the analysis, characteristics have been grouped as follows:
Gender Language:
Age:
Education:
Region
Rural-Urban Location
Receipt of EI
Employment Status
State of the Economy
Only in the Atlantic region did a majority of respondents think the national economy is stable (52%). Residents of B.C. (44%) and the Prairies (41%) were most likely to think the national economy is strengthening, while residents of Quebec were most likely to think it is weakening (31%). Residents of Quebec were also most likely to think their provincial economy is weakening (49%), while residents of the Prairies were most likely to think theirs is getting stronger (41%). Residents of the Prairies (32%) were more likely to think their local economy is getting stronger than those in Ontario (23%) and the Atlantic region (18%).
In addition,
Perceptions of the economy at the national and provincial levels were correlated in the sense that those who thought the economy is getting stronger, staying the same, or weakening at the national level also had the same assessment of the economy at the level of their province.
Likelihood of Job Loss
Canadians who have not received EI benefits in the last 5 years were more likely than those who have to be certain that they will not lose their job in the next year (51% vs. 38%). On the other hand, Canadians who have received EI benefits in the last five years were more likely than those who have not to think it very likely that they will lose their job in the next year (12% vs. 4%).
Only in the Prairies were a majority of respondents (56%) certain that they will not lose their job in the next year.
Previous use of EI Benefits
The following were most likely to say they received EI benefits during the past five years:
The likelihood of having received such benefits over the last five years was higher among those under 55 (36% of those under 35 and 33% of those 35-54 vs. 13% of those 55 and older).
As respondents increased in age, they were less likely to say that other members of their household received EI benefits in the last five years (from 22% of those under 35 to 11% of those 55 and older). Those with a high school education or less were more likely than those with a university degree to say that other members of their household received EI benefits in the last five years (20% vs. 13%).
When it came to reasons for receiving EI benefits, the likelihood of citing job loss was highest among the unemployed (55% vs. 46% of the employed). The likelihood of citing maternity leave decreased with age (from 34% of those under 35, to 15% of those 35-54, to 0% of those 55 and older), but increased with education (from 3% of those with high school education or less to 40% of those with a university degree).
Illness was more likely to be cited by the employed than the unemployed as a reason for receiving such benefits (16% vs. 7%). It was also most likely to be cited by those 55 and older (26% vs. 12% of those 35-54 and 8% of those under 35). The likelihood of citing seasonal work decreased with education (from 14% of those with high school education or less to 1% of those with a university degree). It was also more likely to be identified by men (11% vs. 4% of women).
Confidence in Availability of EI
Among Canadians who work for an employer, the following were most likely to be very confident that they could access EI benefits if they were to lose their job: those who have received EI in the past 5 years (70% vs. 55% of those who have not), Francophones (81% vs. 53% of Anglophones), and residents of Quebec compared to residents of other regions (79% vs. 50-57% elsewhere).
Perceived Abuse of EI Program by Seasonal Workers
Canadians who have received EI benefits in the last five years were more likely than those who have not to strongly disagree that too many people stay in seasonal jobs because they are able to collect EI benefits (26% vs. 19%). Francophones were also more likely than Anglophones to strongly disagree with this (28% vs. 21%). Finally, those who think the Canadian economy is weakening were more likely to strongly disagree with this than those who think the economy is getting stronger (27% vs. 19%).
Perceptions regarding EI benefits for those who have contributed for many years
Canadians who have received EI benefits in the last five years were more likely than those who have not to think that the EI program should offer longer benefits to those who have contributed to the program for many years (72% vs. 65%). Employed Canadians were more likely to think this than self-employed Canadians (72% vs. 55%), and 35-54 year olds were more likely to think this than those 55 and older (72% vs. 65%).
Perceived Fairness of EI Program
Canadians who have received EI benefits in the last five years were more likely than those who have not to think that the EI program is fair (52% vs. 41%). Those who think the Canadian economy is getting stronger were also more likely to think the EI program is fair than those who think the economy is weakening (52% vs. 37%).
Canadians 35 and older were most likely to think the EI program is not fair (29% vs. 18% of those under 35). Canadians with a high school education or less were more likely than those with a university degree to think the EI program is not fair (29% vs. 20%).
Perceptions of Support Amounts
Canadians under 35 were more likely than those 35-54 to describe the level of income support provided by the EI program as adequate (53% vs. 41%). Regionally, only in the Atlantic region did a majority think this (53% vs. 43-50% elsewhere). Those who think the Canadian economy is getting stronger (53%) were also more likely to think this than those who think the economy is weakening (38%) or staying the same (44%).
On the other hand, Canadians who have received EI in the last five years were more likely than those who have not to describe the level of income support as insufficient (47% vs. 35%). Employed Canadians were also more likely than self-employed Canadians to describe the level of income support as insufficient (43% vs. 31%).
Perceptions of Support Duration
Only in the Atlantic region and the Prairies did a majority describe the duration of income support provided by the EI program as adequate (61% in the Atlantic region and 54% in the Prairies vs. 42-46% elsewhere). Canadians living in rural areas were more likely to think this than those living in urban areas (57% vs.45%), and those under 35 were more likely to think this than those 55 and older (56% vs. 43%).
Conversely, Francophones were more likely than Anglophones to describe the duration of income support as insufficient (41% vs. 33%), as were those 35 and older (40% vs. 22% of those under 35). As well, those who think the Canadian economy is weakening (45%) were also more likely to think this than those who think the economy is getting stronger (32%) or staying the same (33%).
Awareness of Extra Benefits for Low-Income Families
Awareness of additional EI benefits available to low-income families with children was higher among the following:
Perceptions of Need for Reforming EI Program
Employed Canadians were more likely than self-employed Canadians to think that the EI program works well enough as it is, and that only minor adjustments would be needed if problems were to arise (60% vs. 47%). Canadians with at least some post-secondary education were also most likely to think this (61% of those who completed some postsecondary education and 57% of those with a university degree vs. 50% of those with high school education or less).
On the other hand, perceptions that major reforms to the EI program are needed were highest among the following:
Of those who think that changes are required, the following were most likely to suggest increasing the amount of benefits paid:
Regionally, the likelihood of suggesting increases in the amount of benefits paid was similar everywhere except Quebec (16-19% vs. 7% in Quebec).
Expanding eligibility/making it easier to claim benefits was more likely to be identified by the employed than the self-employed (13% vs. 5%), while getting rid of abuse in the system was most likely to be identified by the self-employed (17% vs. 7% of employed and 6% of unemployed), and those who have not received EI in the last five years (11% vs. 5% of those who have).
Awareness of EI Sick Leave Benefits
The following were most likely to be at least somewhat aware of short-term illness benefits:
Absence from Work due to Short-term Illness
In the last 10 years, the following have been most likely to be absent from work for more than two weeks due to a short-term illness or injury that required a doctor’s certificate:
Among those who were absent from work, the following were most likely to have received income support during their absence:
Among those who received income support during their absence from work, those 35 and older were most likely to receive income support from an employer’s disability plan (38% of those 35-54 and 29% of those 55 and older vs. 9% of those under 35). The likelihood of taking sick leave with pay increased with education (from 9% of those with high school education or less to 33% of those with a university degree).
Awareness of Compassionate Care Benefits
Canadians who received EI benefits in the last five years were more likely to be at least somewhat aware of Compassionate Care benefits than those who have not (61% vs. 53%). Anglophones were more likely to be aware of this benefit (62% vs. 36% of Francophones), as were Canadians with at least some post-secondary education (60% of those with some post-secondary education and 58% of those with a university degree vs. 50% of those with high school education or less). Regionally, a majority of residents in all regions except Quebec were aware of this benefit (54-65% s. 37% in Quebec).
Women were more likely to be very aware of this benefit (34% vs. 23% of men).
Incidence of Situations Requiring Time Off Work for Compassionate Care
Anglophones were more likely to say they have been in a situation where their job demands were in direct conflict with the need to provide care for someone with a one-time medical emergency or injury (16% vs. 9% of Francophones). Anglophones were also more likely to say they have been in a situation dealing with someone with a chronic or long-term illness (12% vs. 8% of Francophones).
Likelihood of Using Compassionate Care Benefit in Future
The following were most likely to say that should a situation arise in the future where they needed to take time away from work to care for a gravely ill family member, they would be very likely to take advantage of Compassionate Care benefits:
A majority of Canadians in all regions of the country except Quebec and the Prairies said they would be very likely to do this (57-61% vs. 44% in the Prairies and 38% in Quebec).
On the other hand, the following were most likely to say they were not at all likely to take advantage of Compassionate Care benefits: self-employed Canadians (22% vs. 6% of employed and 13% of unemployed Canadians), Canadians who have not received EI in the past five years (13% vs. 6% of those who have), Canadians 55 and older (13%) compared to those under 35 (7%), and men (13% vs. 8% of women).
Awareness of EI Benefits for the Self-Employed
The following were most likely to claim definite awareness of measures providing EI benefits for self-employed Canadians:
Regionally, definite awareness of these measures ranged from 23% in B.C. to 11% in Quebec.
Interest in EI Benefits for the Self-Employed
Among self-employed Canadians, those 35 and older were most likely to say they intend to opt into the EI program (27% of those 35-54 and 26% of those 55 and older vs. 12% of those under 35). Caution should be exercised in interpreting interest among self-employed in EI benefits because of the relatively limited number of self-employed respondents (n = 228).
Awareness of the Canada Employment Insurance Financing Board (CEIFB) was slightly higher among Canadians 55 and older than among those under 35 (5% vs. 2%).
Awareness of Temporary EI-Related Measures
Definite awareness of the five week increase in the duration of EI benefits was highest among the following:
Definite awareness of the provision of $500 million to the EI program for training-related purposes was highest among Canadians who have received EI in the past five years (16% vs. 10% of those who have not).
Definite awareness of the measure to maintain EI premium rates for 2010 was highest among Canadians with a university education (16% vs. 9% of those with some postsecondary education and 7% of those with a high school education or less), and Anglophones (12% vs. 6% of Francophones).
Definite awareness of the measure to provide 5-20 weeks of additional benefits for those who have paid EI premiums for a significant period while making limited use of benefits did not vary significantly across sub-groups.
Differences in definite awareness of these four measures were evident regionally but followed no pattern.
This section presents the demographic characteristics of survey respondents, including gender, age, region, language, urban-rural location, income (household and personal), education, marital status, and whether there are children or others living in their household. The data were weighted by region, age and gender to reflect the actual distribution of Canadians (using Statistics Canada data). The first three graphs present both weighted and unweighted data, the rest present weighted data only. The last two graphs in this section identify the sector and the size of the business or organization in which employed and selfemployed respondents work.
Before weighting, the gender composition of the sample was an even split: 50% male (weighted to 48%) and 50% female (weighted to 52%).
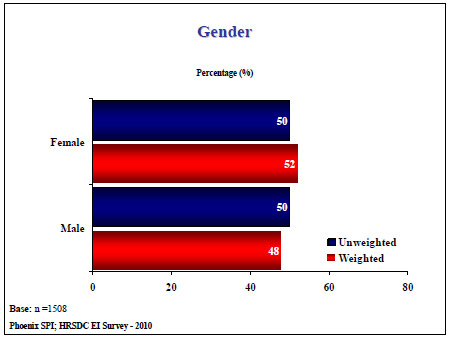
Text description of Figure 61: Gender
The sample’s age distribution was more likely to approximate the actual population of Canadians aged 25-34 and 35-54 than Canadians under 25 and 55 and older. As noted, weights were applied to ensure correct proportions.
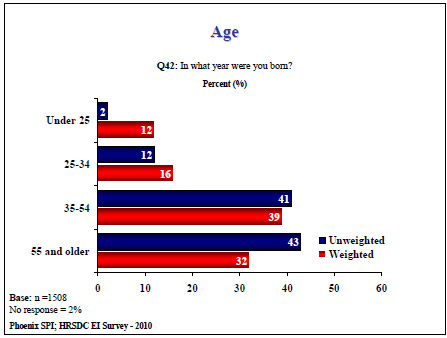
Text description of Figure 62: Age
In order to obtain better accuracy of findings for smaller provinces, the survey used a disproportionately stratified sample approach. As noted, weights were applied to bring the regional distribution in line with the population of Canada.
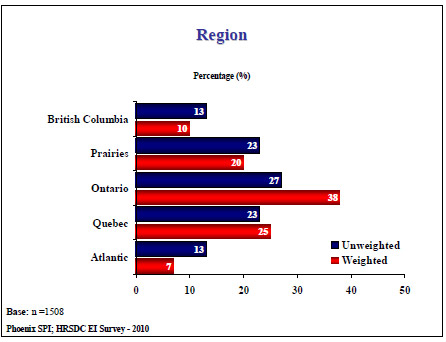
Text description of Figure 63: Region
Twenty-three percent of respondents completed the survey in French.
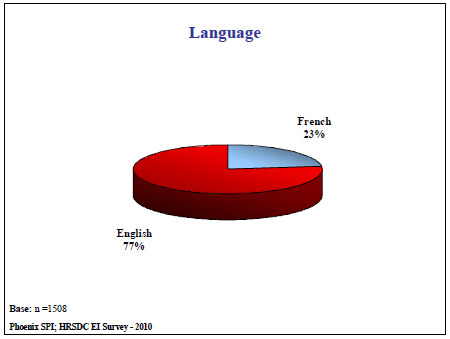
Text description of Figure 64: Language
The large majority of those surveyed were from urban areas (77%), while the remaining 23% were from rural regions.
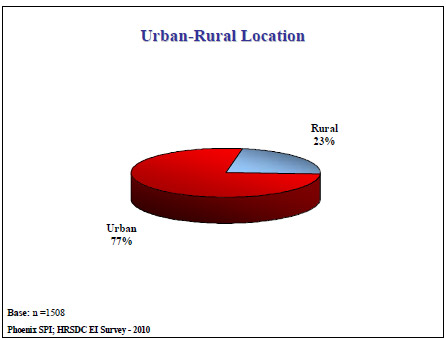
Text description of Figure 65: Urban-Rural Location
When looking at the respondents’ 2009 household incomes, onequarter earned less than $40,000, while just over one-quarter (28%) made between $60,000 and $99,000. Fourteen percent made between $40,000 and $59,000, and one-fifth earned $100,000 or more. Thirteen percent chose not to provide an answer to this question.
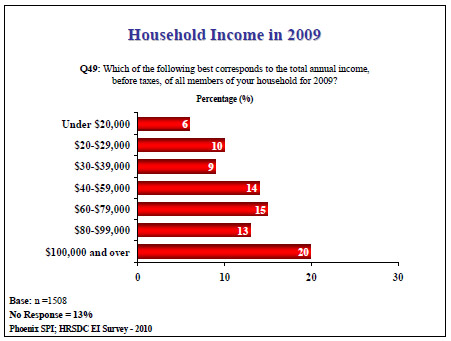
Text description of Figure 66: Household Income in 2009
When it came to respondents’ 2009 personal incomes, half earned less than $40,000. Seventeen percent made between $40,000 and $59,000, and approximately one-fifth earned $60,000 or more. Fifteen percent chose not to provide an answer to this question.
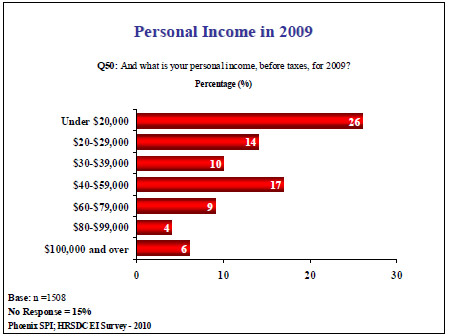
Text description of Figure 67: Personal Income in 2009
A majority of those surveyed (51%) completed some form of postsecondary education. Conversely, one-fifth completed high school, while 12% had less than a high school education. Eighteen percent had enrolled in, but had not completed a college (9%) or university program (9%).
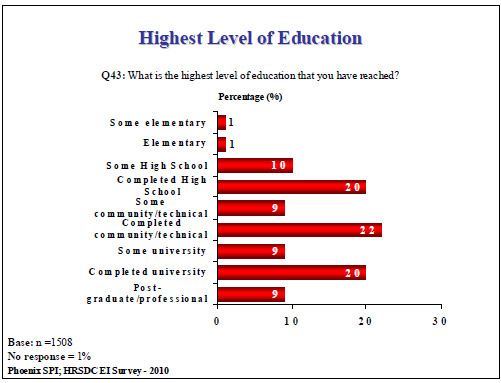
Text description of Figure 68: Highest Level of Education
Almost two-thirds of those surveyed were married or living as a couple (63%), while 23% said they were single. Of the rest, 5% were divorced, 5% were widowed, and 3% were separated from their spouse.
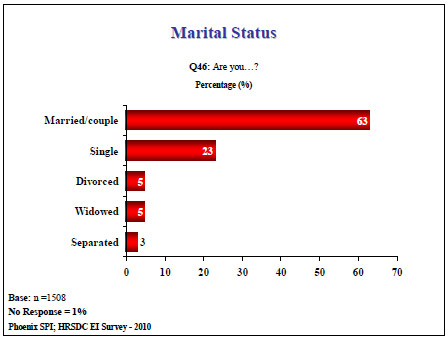
Text description of Figure 69: Marital Status
Over one-third of survey respondents (37%) had children under the age of 18 living in their household, while most of the rest (62%) did not.
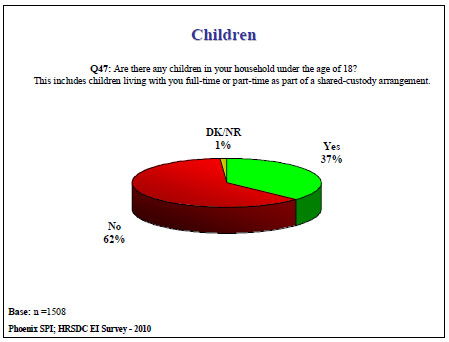
Text description of Figure 70: Children
The vast majority of respondents (86%) said they did not have any relatives over the age of 65 living in their household, while 13% indicated that they did.
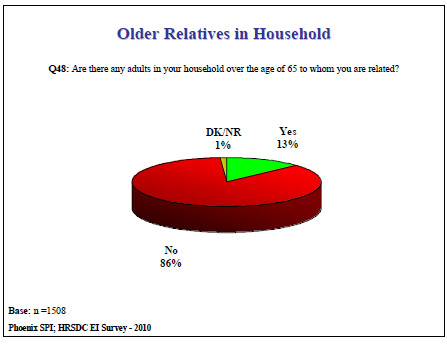
Text description of Figure 71: Older Relatives in Household
Employed and selfemployed respondents work in a variety of sectors/industries.
| Industry | % | Industry | % |
|---|---|---|---|
| Health/social services | 12 | Professional/Scientific/tech. services | 5 |
| Retail trade | 10 | Manufacturing | 4 |
| Educational services | 9 | Utilities | 3 |
| Construction | 8 | Information/Cultural industries | 3 |
| Finance and insurance | 7 | Accommodation/Food services | 3 |
| Public administration | 7 | Oil, gas, mining | 3 |
| Transportation and warehousing | 6 | Other | 12 |
| Agriculture/Fishing/Hunting/Forestry | 6 | No Response | 1 |
Base: n = 901; asked of employed and self-employed
Phoenix SPI; HRSDC EI Survey - 2010
The largest proportion of employed and self-employed respondents (43%) work for small firms or organizations (i.e. under 50 employees). Just over one-third work for large firms or organizations (i.e. 500 or more employees), and 18% work for medium-sized firms or organizations (i.e. 50-500 employees).
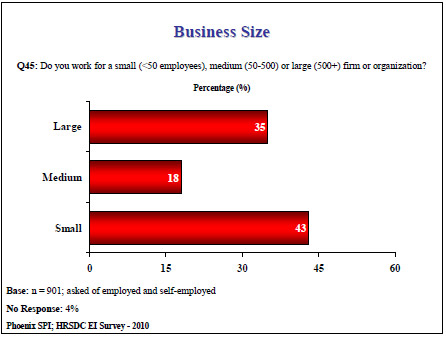
Text description of Figure 72: Business Size
Hello, my name is . I’m calling on behalf of Phoenix, a public opinion research firm. We’re conducting a survey for the Government of Canada to explore the attitudes of Canadians concerning Employment Insurance or EI§. The survey is registered with the national survey registration system.
A. We choose telephone numbers at random, then select one person from a household to be interviewed. May I please speak to the person in the household, 18 years of age or older, who has had the most recent birthday? Would that be you? (IF NOT, ASK TO SPEAK TO THAT PERSON AND START AGAIN)
IF NOT AVAILABLE NOW, ASK:
B. When would it be more convenient for me to call back?
Schedule callback if possible (time/day):
C. Do you or does anyone in your household work for any of the following types of organizations: an advertising or market research firm, the media, or an elected official?
D. Your participation in this survey is voluntary, but would be extremely helpful. All responses will be kept confidential. The call may be monitored for quality control purposes. Would you be willing to take part in this survey? We can do it now, or is there a better time?
SURVEY LENGTH: IF RESPONDENT ASKS ABOUT THE LENGTH OF THE SURVEY, INFORM HIM/HER THAT IT AVERAGES 15 MINUTES, SOMETIME LESS. THE LENGTH VARIES DEPENDING ON RESPONSES TO SOME OF THE QUESTIONS.
RESEARCH VALIDITY: IF RESPONDENT QUESTIONS THE VALIDITY OF THE RESEARCH, INVITE HIM/HER TO: 1) CALL THE NATIONAL SURVEY REGISTRATION SYSTEM, OR 2) DEANNA JAMIESON OF THE GOVERNMENT OF CANADA 1-819-994-2710 OR HAVE DEANNA CALL THE RESPONDENT.
SURVEY REGISTRATION SYSTEM: IF RESPONDENT ASKS ABOUT NATIONAL SURVEY REGISTRATION SYSTEM, SAY:
The registration system has been created by the survey research industry to allow the public to verify that a survey is legitimate, get information about the survey industry or register a complaint. The registration system’s toll-free phone number is 1-800-554-9996.
PRIVACY: PARTICIPANTS’ COMMENTS WILL BE PROTECTED IN ACCORDANCE WITH THE PROVISIONS OF THE PRIVACY ACT. INDICATE THIS IF RELEVANT. ALSO SAY IF RELEVANT: “YOUR REPONSES TO THIS SURVEY WILL HAVE NO IMPACT ON YOUR DEALINGS WITH THE FEDERAL GOVERNMENT.”
HEADINGS IN BLUE SHOULD NOT BE READ TO RESPONDENTS.
UNLESS OTHERWISE SPECIFIED, ALL QUESTIONS IN THE SURVEY WILL ALLOW FOR ‘DON’T KNOW/NO RESPONSE’ OPTION. DK/NR IS ONLY SPECIFIED WHERE IT RELATES TO SKIP LOGIC.
1. In your opinion, is… (INSERT FROM BELOW) getting stronger, weaker, or is it staying about the same? (READ/RANDOMIZE LIST)
2. Which of the following best describes your employment status? Are you …? [READ LIST; ACCEPT ONE RESPONSE]
ASK SELF-EMPLOYED ONLY:
3. a) Is your self-employment seasonal?
b) Do you have employees?
4. a) Is your self-employment full-time or part-time?
b) How many hours do you work per week?
5. Apart from your self-employment, do you also work as an employee for someone else?
6. a) Are you a seasonal employee?
b) Does your employer deduct amounts from your pay for programs such as Employment Insurance or the Canada Pension Plan/Quebec Pension Plan*?
*USE QUEBEC PENSION PLAN IN QUEBEC AND CANADA PENSION PLAN IN ALL OTHER LOCATIONS.
7. Are you responsible for managing other employees?
8. How many hours do you work per week? [SKIP IF RESPONDENT ASKED Q.4b]
ASK ALL ‘UNEMPLOYED’ AND ‘HOMEMAKERS’:
9. a) Are you …? [READ; ACCEPT ONE RESPONSE]
ASK UNEMPLOYED AND HOMEMAKERS LOOKING FOR WORK:
9. b) How long do you think it will take you to find work? Would you say in the next…? (READ LIST. ACCEPT ONE RESPONSE)
ASK ‘EMPLOYED’:
10. a) Is it very, somewhat, not very or not at all likely that you will lose your job in the next year?
10 b) If you were to lose your job in the next year, do you think it might be in the next…? (READ LIST. ACCEPT ONE RESPONSE)
11. If you did lose your job, would you be very, somewhat, not very or not at all likely to do each of the following? READ/DO NOT ROTATE LIST
12. On a scale from 1 to 7, where 1 means strongly disagree, 4 is neutral and 7 means strongly agree, how much do you agree or disagree with the following statement(s)* about the Employment Insurance Program? [READ AND ROTATE. MAKE PLURAL FOR EMPLOYED RESPONDENTS]
13. a) Do you think that the Employment Insurance Program is (ROTATE) fair, unfair or neither? [PROBE FOR VERY OR SOMEWHAT]
ASK THOSE WHO SAID ‘SOMEWHAT/VERY UNFAIR’:
13 b) What do you find most unfair about the Employment Insurance program? [DO NOT READ; ACCEPT ONE RESPONSE]
14. From what you know, do you think the (INSERT FROM BELOW/RANDOMIZE ORDER) provided by the Employment Insurance Program is generous, adequate or insufficient? (REPEAT FOR SECOND OPTION)
a) … level of income support…
b) …duration of income support for loss of employment...
15. Are you very, somewhat, not very or not at all aware that the Employment Insurance Program provides additional benefits to low-income families who have children?
16. a) Some people say that [ROTATE] basically, the current Employment Insurance program works well and only minor adjustments should be made as needs arise. Other people say that [ROTATE] the current Employment Insurance program is not working well and requires major reforms over the next few years. Which view is closer to your own?
b) What adjustments or changes would you make? [DO NOT READ; ACCEPT ALL THAT APPLY]
ASK ‘EMPLOYED’:
19. Are you very, somewhat, not very or not at all aware that eligible workers who have a short-term illness can receive up to 15 weeks of EI sickness benefits?
ASK ALL:
SB1 In the last 10 years, have you ever been absent from work for more than two weeks due to a short-term illness or injury that required a doctor’s certificate? ACCEPT ‘DOES NOT APPLY’ AS SEPARATE RESPONSE FROM ‘DON’T KNOW’ (Q22 IN 2008)
NOTE TO INTERVIEWER: IF RESPONDENT INDICATES THAT THEY HAVE BEEN IN THIS SITUATION ON MORE THAN ONE OCCASION IN THE LAST 10 YEARS, ASK THEM TO FOCUS ON THEIR MOST RECENT ABSENCE FROM WORK WHEN ANSWERING QS. SB2-SB4
IF YES, ASK:
SB2 How long were you off work due to your sickness or injury? (Q23 IN 2008)
SB3 When you took time off work due to your illness or injury, did you receive any income support during your absence? (Q24 IN 2008)
IF YES, ASK:
SB4 Did the income support during your absence from work due to an illness or injury come from…? (READ LIST; ACCEPT MULTIPLE RESPONSES) (NEW)
20. Are you very, somewhat, not very or not at all aware that eligible workers can receive some income benefits to take time off work to care for or support a gravely ill or dying family member?
21. Have you ever been in a situation where your job demands were in direct conflict with the need to provide care or support for any of the following… ? [READ/ROTATE]
a) A gravely ill or dying person?
b) Someone with a one-time medical emergency or injury?
c) Someone with a chronic or long term illness?
IF YES IN Q.21a CONTINUE; OTHERS GO TO Q.27
22. In order to care for the gravely ill or dying person, did you take time off work?
23. Since you did not take time off work, how was that person cared for? Would you say …? [READ LIST; ACCEPT ALL THAT APPLY]
IF YES IN Q.22 CONTINUE / OTHERS GO TO Q.27
24. How much time off work did you take to care for this person? Was it …? [READ LIST; ACCEPT ONE RESPONSE]
25. When you took time off work to care for this person did you do any of the following? [READ LIST; ACCEPT ALL THAT APPLY]
ASK IF RESPONDENT DOES NOT MENTION Q.25 CODE 6:
26. Why did you not use the Compassionate Care benefits? [DO NOT READ; ACCEPT ALL THAT APPLY]
Since January, 2004, the Government of Canada has been providing Compassionate Care Benefits to eligible workers under the Employment Insurance Program. This allows Canadians to take a temporary leave of absence from work to provide care or support to a gravely ill family member facing a significant risk of death within 6 months. The 6 weeks of benefits can be shared among family members and can be taken consecutively, concurrently or one week at a time by family members over a 26-week period.
27. In the future, if you were working and you were faced with a situation where you needed to take time away from work to care for or support a gravely ill family member, would you be very, somewhat, not very or not at all likely to apply for the Compassionate Care Benefits?
IF NOT VERY LIKELY OR NOT AT ALL LIKELY, ASK:
28. What would be the main reason you would not apply? [DO NOT READ; ACCEPT ONE RESPONSE]
READ PREAMBLE EVERYWHERE EXCEPT IN QUEBEC
The Government of Canada passed legislation which provides Employment Insurance maternity, parental, sickness and compassionate care benefits to self-employed Canadians on a voluntary basis. As of January 31, 2010, the self-employed are able to opt into the Employment Insurance program by registering through Service Canada. If they opt in on or before April 1, an individual will be able to make a claim for Employment Insurance benefits as early as January 2011. The premiums will be the equivalent rate that salaried employees currently pay.
READ PREAMBLE IN QUEBEC ONLY
The Government of Canada passed legislation which provides Employment Insurance maternity, parental, sickness and compassionate care benefits to self-employed Canadians on a voluntary basis. The self-employed living in Quebec will continue to receive maternity and parental benefits through the Quebec Parental Insurance Plan, and as of January 31, 2010, will be eligible to opt into the Employment Insurance program for sickness and compassionate care benefits by registering through Service Canada. If they opt in on or before April 1, an individual will be able to make a claim for Employment Insurance benefits as early as January 2011. The premiums will be the equivalent rate that salaried employees currently pay.
SE1 Were you aware of this new measure? (READ LIST)
ASK SELF-EMPLOYED
The next few questions are for people like you who are self-employed.
SE2 Do you intend to opt into the Employment Insurance program to take advantage of this new measure for the self-employed? (READ LIST)
IF YES, ASK NEXT TWO (OR THREE) QUESTIONS:
SE3 What is your primary reason for opting into the Employment Insurance program? Any other reasons (DO NOT READ LIST. ACCEPT ALL THAT APPLY)
SE4 Which of the following benefits are you personally particularly interested in? (READ LIST. ACCEPT ALL THAT APPLY)
* DO NOT ASK 29 ii) or iii) IN QUEBEC
IF INTERESTED IN MATERNITY OR PARENTAL BENEFITS, ASK NEXT QUESTION (NOT IN QUEBEC):
SE5 If you opted into the Employment Insurance program for the self-employed, how much time, in months, could you afford to take away from your work for…?
i) maternity benefits (ask women only)
ii) parental benefits to care for a newborn or newly adopted child?
[DO NOT READ LIST; ACCEPT ONE RESPONSE]
IF NO, ASK:
SE6 What is your main reason for not opting into the Employment Insurance program? Any other reasons (DO NOT READ LIST. ACCEPT ALL THAT APPLY)
In 2008, the Government of Canada created a new Crown Corporation, the Canada Employment Insurance Financing Board (CEIFB). This organization will manage a bank account called a reserve where any excess premiums from a given year will be held and invested until they are used in subsequent years for Employment Insurance purposes. It will also be responsible for implementing a new mechanism to determine the premium rate for Employment Insurance.
33. Were you aware of this initiative? (READ LIST)
36. The Government has taken steps to enhance Employment Insurance and provide additional funding for skills development and training. To what extent were you aware of the following measures undertaken by the government? How about the measure to… (READ/ROTATE A-D)? Were you aware of this? (READ LIST)
a) Increase the maximum duration of benefits available under the Employment Insurance program by five weeks.
b) Provide $500 million over two years to extend Employment Insurance income benefits to Canadians participating in longer-term training and to allow earlier access to Employment Insurance benefits for individuals purchasing their own training using earnings resulting from a lay-off.
c) Maintain Employment Insurance premium rates for 2010.
d) Provide 5 to 20 weeks of additional benefits to workers who have worked and paid Employment Insurance premiums for a significant period of time but who have made limited use of Employment Insurance regular benefits.
37. How many times have you received Employment Insurance benefits in the last five years?
38. Why did you receive Employment Insurance benefits? Was it …? [READ LIST; ACCEPT MULTIPLE RESPONSES]
39. While receiving Employment Insurance benefits during the last five years, did you move to find work?
ASK ALL:
40. Has anyone else in your household received Employment Insurance benefits in the last five years?
41. Why did this other person receive Employment Insurance benefits? Was it …? [READ LIST; ACCEPT MULTIPLE RESPONSES]
Now, I would like to get some information to help us group your answers with others that we will receive in this survey.
42. In what year were you born?
43. What is the highest level of education that you have reached? [DO NOT READ; ACCEPT ONE RESPONSE]
*NOTE: INCLUDES LEGAL, MEDICAL, ACCOUNTING AND SIMILAR OCCUPATIONS.
ASK EMPLOYED AND SELF-EMPLOYED:
44. In what industry do you work? [DO NOT READ; ACCEPT ONE RESPONSE]
45. Do you work for a small (<50 employees), medium (50-500) or large (500+) firm or organization?
ASK ALL:
46. Are you …? [READ LIST; ACCEPT ONE RESPONSE]
47. Are there any children in your household under the age of 18? This includes children living with you full-time or part-time as part of a shared-custody arrangement. [READ LIST; ACCEPT ONE RESPONSE]
48. Are there any adults in your household over the age of 65 to whom you are related? [READ LIST; ACCEPT ONE RESPONSE]
49. Which of the following best corresponds to the total annual income, before taxes, of all members of your household for 2009? Please stop me once your category is reached. [READ LIST; ACCEPT ONE RESPONSE]
50. And what is your personal income, before taxes, for 2009? Please stop me once your category is reached. Is it…? [READ LIST; ACCEPT ONE RESPONSE]
51. For verification purposes, what are the first three digits of your postal code?
That concludes the survey. Thank you very much for your thoughtful feedback.
It is much appreciated.
Bonjour, je suis , de Phoenix, une maison de recherche sur l’opinion publique. Nous réalisons un sondage pour le gouvernement du Canada sur les attitudes des Canadiens et Canadiennes au sujet de l’assurance-emploi ou l’AE**. Le sondage est enregistré auprès du système national d’enregistrement des sondages.
A. Nous choisissons des numéros de téléphone au hasard, puis nous sélectionnons une personne du foyer pour l'interviewer. J’aimerais parler à la personne qui a été la dernière à célébrer son anniversaire et qui est âgée de 18 ans ou plus. Est-ce vous ? (SI NON, DEMANDER À PARLER À CETTE PERSONNE ET REPRENDRE DEPUIS LE DÉBUT.)
SI LA PERSONNE N’EST PAS DISPONIBLE, POSER LA QUESTION SUIVANTE :
B. Quand devrais-je rappeler ?
C. Est-ce que vous ou un membre de votre foyer, travaillez pour une agence de publicité, une firme d’études de marché, les médias ou un(e) élu(e) politique?
D. Vous êtes tout à fait libre de participer ou non au sondage. Votre participation nous serait néanmoins extrêmement utile. Toutes les réponses seront traitées de manière confidentielle. L’appel pourrait être mis sous écoute pour les besoins du contrôle de la qualité. Accepteriez-vous de participer à ce sondage? Nous pouvons faire l’entrevue maintenant ou y a-t-il un moment qui vous conviendrait mieux?
DURÉE DE L’ENTREVUE : SI LE/LA RÉPONDANT(E) VEUT CONNAÎTRE LA DURÉE DE L’ENTREVUE, LUI DIRE QU’ELLE DURE EN MOYENNE 15 MINUTES MAIS QU’ELLE PREND PARFOIS MOINS DE TEMPS. LA DURÉE VARIE EN FONCTION DES RÉPONSES À CERTAINES QUESTIONS.
VALIDITÉ DE LA RECHERCHE : SI LE/LA RÉPONDANT(E) S’INTERROGE SUR LA VALIDITÉ DE LA RECHERCHE, L’INVITER À 1) TÉLÉPHONER AU SYSTÈME NATIONAL D’ENREGISTREMENT DES SONDAGES OU À 2) COMMUNIQUER AVEC MME DEANNA JAMIESON, DU GOUVERNEMENT DU CANADA, AU 1-819-994-2710 OU DEMANDER À MME JAMIESON DE RAPPELER LE RÉPONDANT.
SYSTÈME D’ENREGISTREMENT DES SONDAGES : SI LE/LA RÉPONDANT(E) VEUT SAVOIR CE QU’EST LE SYSTÈME D’ENREGISTREMENT DES SONDAGES, LUI DIRE :
Le système d’enregistrement des sondages a été créé par l’industrie de la recherche par sondage afin que le public puisse vérifier la légitimité d’un sondage, se renseigner sur l’industrie du sondage ou déposer une plainte. Le numéro sans frais du système d’enregistrement est le 1-800-554-9996.
PROTECTION DES RENSEIGNEMENTS PERSONNELS : LES PROPOS TENUS PAR LES PARTICIPANTS SERONT PROTÉGÉS CONFORMÉMENT AUX DISPOSITIONS DE LA LOI SUR LA PROTECTION DES RENSEIGNEMENTS PERSONNELS. APPORTER CETTE PRÉCISION, SI ELLE EST PERTINENTE. DIRE ÉGALEMENT, SI LA CHOSE EST PERTINENTE : « VOS RÉPONSES À CE SONDAGE N’AURONT AUCUN EFFET SUR VOS RELATIONS AVEC LE GOUVERNEMENT FÉDÉRAL ».
LES TITRES DE SECTION EN BLEU NE DOIVENT PAS ÊTRE LUS AUX RÉPONDANTS.
À MOINS D’INDICATION CONTRAIRE, IL SERA POSSIBLE DE RÉPONDRE PAR L’OPTION « JE NE SAIS PAS / JE PRÉFÈRE NE PAS RÉPONDRE » À TOUTES LES QUESTIONS DU SONDAGE. L’OPTION NSP/NPR N’APPARAÎT QUE POUR LA LOGIQUE DE SAUTS DE QUESTIONS.
Inscrire selon vos observations/la liste de l’échantillon :
1. Selon vous… (INSÉRER UN ÉLÉMENT DE LA LISTE) devient-elle plus forte, plus faible ou demeure-t-elle sensiblement la même? (LIRE / RANDOMISER LA LISTE)
2. Laquelle des catégories suivantes décrit le mieux votre situation professionnelle? Estce que vous êtes… [LIRE LA LISTE; ACCEPTER UNE SEULE RÉPONSE]
POSER LES QUESTIONS SUIVANTES AUX TRAVAILLEURS AUTONOMES SEULEMENT :
3. a) Est-ce que ce travail autonome est saisonnier?
b) Est-ce que vous avez des employés?
4. a) Est-ce que ce travail autonome est à temps plein ou à temps partiel?
b) Combien d’heures travaillez-vous par semaine?
5. À part votre travail autonome, est-ce que vous travaillez comme employé pour quelqu’un d’autre?
6. a) Est-ce que vous avez un emploi saisonnier?
b) Est-ce que votre employeur déduit des sommes de votre salaire comme des cotisations à l’assurance-emploi et au Régime de pensions du Canada / Régime de rentes du Québec*?
*UTILISER « RÉGIME DE RENTES DU QUÉBEC » AU QUÉBEC ET « RÉGIME DE PENSIONS DU CANADA » AILLEURS.
7. Est-ce que vous êtes responsable de la gestion d’autres employés ?
8. Combien d’heures travaillez-vous par semaine? [SAUTER SI LE RÉPONDANT A RÉPONDU À LA Q.4b]
POSER À TOUS LES RÉPONDANTS SANS EMPLOI OU AU FOYER :
9. a) Est-ce que vous… [LIRE; ACCEPTER UNE SEULE RÉPONSE]
POSER AUX RÉPONDANTS SANS EMPLOI OU AU FOYER À LA RECHERCHE D’UN EMPLOI :
9. b) Selon vous, combien de temps vous faudra-t-il pour trouver du travail? Diriez-vous que vous allez en trouver…? (LIRE LA LISTE. ACCEPTER UNE SEULE RÉPONSE)
POSER AUX EMPLOYÉS :
10. a) Est-ce qu’il est très probable, assez probable, peu probable ou pas du tout probable que vous perdiez votre emploi au cours de la prochaine année?
10. b) Si vous perdiez votre emploi au cours de la prochaine année, cette perte d’emploi aurait-elle lieu, selon vous, dans… (LIRE LA LISTE. ACCEPTER UNE SEULE RÉPONSE)
11. Si vous perdiez votre emploi, est-ce que les dénouements suivants seraient très probables, assez probables, peu probables ou pas du tout probables? LIRE / NE PAS FAIRE LA ROTATION
12. Voici quelques énoncés relatifs à l’assurance-emploi. À l’aide d’un chiffre de 1 à 7, où « 1 » signifie que vous êtes entièrement en désaccord, « 4 » que vous êtes ni d’accord ni en désaccord et « 7 », que vous êtes entièrement d’accord, dans quelle mesure êtes-vous d’accord ou en désaccord avec [l’énoncé suivant / les énoncés suivants]* ? [LIRE ET FAIRE UNE ROTATION. UTILISER LE PLURIEL EN S’ADRESSANT AUX RÉPONDANTS AYANT UN EMPLOI.]
13. a) Pensez-vous que le programme d’assurance-emploi est [FAIRE UNE ROTATION] juste, injuste ou ni l’un ni l’autre? [SONDER POUR SAVOIR DANS QUELLE MESURE – TRÈS OU PLUTÔT]
SI LE/LA RÉPONDANT(E) A RÉPONDU « PLUTÔT OU TRÈS INJUSTE » :
13. b) Que trouvez-vous le plus injuste du programme d’assurance-emploi? [NE PAS LIRE LA LISTE. ACCEPTER UNE SEULE RÉPONSE]
14. En vous fondant sur ce que vous savez du programme, est-ce que vous pensez que (AJOUTER L’UN DES ÉNONCÉS CI-DESSOUS/RÉPARTIR ALÉATOIREMENT L’ORDRE DE PRÉSENTATION) qu’offre le programme d’assurance-emploi est généreux/généreuse, adéquat(e) ou insuffisant(e)?
c) …le niveau de soutien du revenu…
d) …la durée du soutien du revenu en cas de perte d’emploi...
15. Est-ce que vous êtes très au courant, assez au courant, peu au courant ou pas du tout au courant du fait que le programme d’assurance-emploi augmente les prestations versées aux familles à faibles revenus ayant des enfants?
16. a) Certaines personnes disent que [FAIRE UNE ROTATION] fondamentalement, le régime actuel d’assurance-emploi fonctionne bien et ne nécessiterait que de légers changements, au besoin. D’autres personnes disent que [FAIRE UNE ROTATION] le régime actuel d’assurance-emploi ne fonctionne pas bien et qu’il est nécessaire d’y apporter des réformes importantes au cours des prochaines années. Lequel de ces points de vue correspond davantage au vôtre?
b) Quels changements apporteriez-vous? [NE PAS LIRE; ACCEPTER TOUTES LES RÉPONSES DONNÉES]
POSER AUX EMPLOYÉS :
19. Êtes-vous très au courant, assez au courant, peu au courant ou pas du tout au courant que les travailleurs admissibles qui ne peuvent pas travailler en raison d’une maladie de courte durée peuvent recevoir jusqu’à 15 semaines de prestations de maladie du régime d’assurance-emploi?
QUESTION POUR TOUS :
SB1 Au cours des derniers 10 ans, vous êtes-vous absenté(e) de votre travail pendant plus de deux semaines en raison d’une maladie de courte durée ou d’une blessure pour laquelle vous deviez fournir un certificat médical ? ACCEPTER « SANS OBJET » COMME RÉPONSE DISTINCTE DE « JE NE SAIS PAS » (Q22 EN 2008)
SI C’EST OUI, POSER LA QUESTION SUIVANTE :
SB2 Pendant combien de temps vous êtes-vous absenté(e) de votre travail en raison de cette maladie ou blessure ? (Q23 EN 2008)
SB3 Quand vous vous êtes absenté(e) de votre travail en raison de cette maladie ou blessure, avez-vous reçu des sommes à titre de soutien du revenu ? (Q24 EN 2008)
SI C’EST « OUI », POSER:
SB4 Les sommes que vous avez reçues à titre de soutien du revenu quand vous vous êtes absenté(e) du travail en raison de cette maladie de courte durée ou de cette blessure provenaient-elles …? (LIRE LA LISTE; RÉPONSES MULTIPLES ACCEPTÉES) (NOUVEAU)
20. Est-ce que vous êtes très au courant, assez au courant, peu au courant ou pas du tout au courant du fait que les travailleurs éligibles peuvent recevoir des prestations de compassion s’ils doivent s’absenter temporairement de leur emploi afin de prodiguer des soins ou offrir un soutien à un membre de leur famille gravement malade ou mourant?
21. Vous êtes-vous déjà retrouvé(e) dans une situation où les exigences de votre emploi entraient directement en conflit avec le besoin de prodiguer des soins ou d’offrir un soutien dans l’une ou l’autre des circonstances suivantes? [LIRE / FAIRE UNE ROTATION]
a) Une personne gravement malade ou mourante?
b) Une personne traversant une urgence médicale ponctuelle ou blessée dans un accident?
c) Une personne atteinte d’une maladie chronique ou de longue durée?
SI C’EST « OUI » À Q.21a CONTINUER; AUTREMENT, ALLER À Q.27
22. Pour prendre soin de cette personne gravement malade ou mourante, vous êtes-vous absenté(e) du travail?
23. Puisque vous ne vous êtes pas absenté(e) du travail, comment cette personne a-t-elle reçu les soins dont elle avait besoin ? Est-ce que… [LIRE LA LISTE; ACCEPTER TOUTES LES RÉPONSES DONNÉES]
SI C’EST « OUI » À Q.22, CONTINUER; AUTREMENT, ALLER À Q.27
24. Combien de temps vous êtes-vous absenté(e) de votre travail pour prendre soin de cette personne? Était-ce… [LIRE LA LISTE; ACCEPTER UNE SEULE RÉPONSE]
25. Quand vous vous êtes absenté(e) du travail pour prendre soin de cette personne, avezvous fait l’une ou l’autre des choses suivantes? [LIRE LA LISTE; ACCEPTER TOUTES LES RÉPONSES DONNÉES]
POSER LA QUESTION SUIVANTE SI LE RÉPONDANT N’A PAS RETENU LA RÉPONSE 6 À LA Q.25 :
26. Pourquoi n’avez-vous pas eu recours aux prestations de compassion? [NE PAS LIRE; ACCEPTER TOUTES LES RÉPONSES DONNÉES]
Depuis janvier 2004, le gouvernement du Canada offre des prestations de compassion à des travailleurs admissibles dans le cadre du programme de l’assurance-emploi. Ceci permet aux Canadiens et Canadiennes de s’absenter temporairement du travail pour prodiguer des soins ou offrir un soutien à un membre de la famille gravement malade ou qui risque de mourir dans un délai de six mois. Les six semaines de prestations peuvent être partagées entre des membres de la famille et elles peuvent être prises consécutivement, concurremment ou une semaine à la fois par des membres de la famille au cours d’une période de 26 semaines.
27. Dans l’avenir, si vous travailliez et que vous faisiez face à une situation où vous deviez vous absenter du travail pour prodiguer des soins ou offrir un soutien à un membre de la famille gravement malade, serait-il très, assez, peu ou pas du tout probable que vous présentiez une demande pour recevoir des prestations de compassion?
SI C’EST « PEU PROBABLE » OU « PAS DU TOUT PROBABLE », POSER LA QUESTION SUIVANTE :
28. Quelle serait votre raison principale pour ne pas présenter de demande de prestations? [NE PAS LIRE; ACCEPTER UNE SEULE RÉPONSE]
LIRE CETTE INTRODUCTION À TOUS LES RÉPONDANTS SAUF CEUX DU QUÉBEC
Le gouvernement du Canada a adopté un projet de loi qui vise à offrir, sur une base volontaire, les prestations d’assurance-emploi de maternité, parentales, de maladie et de compassion aux travailleurs autonomes canadiens. Depuis le 31 janvier 2010, les travailleurs autonomes peuvent participer au régime d’assurance-emploi en s’inscrivant auprès de Service Canada. Ceux qui s’inscrivent au plus tard le 1er avril pourront établir une demande de prestations d’assurance-emploi dès janvier 2011. Les cotisations seront équivalentes au taux de cotisation que les salariés paient actuellement.
LIRE L’INTRODUCTION QUI SUIT AUX RÉPONDANTS DU QUÉBEC SEULEMENT
Le gouvernement du Canada a adopté un projet de loi qui vise à offrir, sur une base volontaire, les prestations d’assurance-emploi de maternité, parentales, de maladie et de compassion aux travailleurs autonomes canadiens. Les travailleurs autonomes résidant au Québec continueront de toucher des prestations de maternité et parentales en vertu du Régime québécois d’assurance parentale et, à compter du 31 janvier 2010, peuvent participer au régime d’assurance-emploi afin de recevoir des prestations de maladie et de compassion en s’inscrivant auprès de Service Canada. Ceux qui s’inscrivent au plus tard le 1er avril pourront présenter une demande de prestations de l’assurance-emploi dès janvier 2011. Les cotisations seront équivalentes au taux de cotisation que les salariés paient actuellement.
SE1 Étiez-vous au courant de cette nouvelle mesure? (LIRE LA LISTE)
POSER AUX TRAVAILLEURS AUTONOMES
Les prochaines questions s’adressent uniquement aux personnes qui, comme vous, sont travailleurs autonomes.
SE2 Avez-vous l’intention de participer au régime d’assurance-emploi afin de tirer profit de cette nouvelle mesure pour les travailleurs autonomes? (LIRE LE LISTE)
SI C’EST OUI, POSER LES DEUX (OU TROIS) PROCHAINES QUESTIONS :
SE3 Quelle est la principale raison pour laquelle vous participeriez au régime d’assuranceemploi? Y a-t-il d’autres raisons (NE PAS LIRE LA LISTE. ACCEPTER TOUTES LES RÉPONSES PERTINENTES)
SE4 Personnellement, en laquelle ou lesquelles des prestations suivantes êtes-vous particulièrement intéressé(e)? (LIRE LA LISTE. ACCEPTER TOUTES LES RÉPONSES PERTINENTES)
* NE PAS POSER LES QUESTIONS SE4 ii) ou iii) AUX RÉPONDANTS DU QUÉBEC
SI LE/LA RÉPONDANT(E) EST INTÉRESSÉ(E) AUX PRESTATIONS DE MATERNITÉ OU AUX PRESTATIONS PARENTALES, POSER LA PROCHAINE QUESTION (SAUF AUX RÉPONDANTS DU QUÉBEC) :
SE5 Si vous participiez au régime d’assurance-emploi pour les travailleurs autonomes, combien de temps, en mois, pourriez-vous vous permettre de vous absenter du travail pour recevoir…?
i) des prestations de maternité [QUESTION POUR LES FEMMES SEULEMENT]
ii) des prestations parentales pour vous occuper d’un nouveau-né ou d’un enfant récemment adopté?
[NE PAS LIRE LA LISTE; ACCEPTER UNE SEULE RÉPONSE]
SI C’EST « NON », POSER :
SE6 Quelle est la principale raison pour laquelle vous ne souhaiteriez pas participer au régime d’assurance-emploi? Y a-t-il d’autres raisons (NE PAS LIRE LA LISTE. ACCEPTER TOUTES LES RÉPONSES PERTINENTES)
En 2008, le gouvernement du Canada a créé une nouvelle société d’État, l’Office de financement de l'assurance-emploi du Canada (OFAEC). Cette organisation sera responsable de la gestion d'un compte bancaire appelé « réserve » où tout excédent en matière de cotisations d'une année donnée sera retenu et investi jusqu'à ce qu'il soit utilisé par le programme d’assurance-emploi au cours des années suivantes. Elle sera aussi responsable de la mise en oeuvre d’un nouveau mécanisme pour l’établissement des taux de cotisation à l'assurance-emploi.
33. Étiez-vous au courant de cette initiative? (LIRE LA LISTE)
36. Le Gouvernement a mis en place des mesures pour améliorer l’assurance-emploi et augmenter les fonds destinés au développement des compétences et à la formation. À quel point êtes-vous au courant des mesures suivantes adoptées par le gouvernement? Concernant la mesure de/d’… (LIRE/ASSURER UNE ROTATION A-D)? Étiez-vous au courant de cette mesure? (LIRE LA LISTE)
e) Augmenter la période maximale des prestations d’assurance-emploi de cinq semaines.
f) Consacrer 500 millions de dollars sur deux ans pour prolonger les prestations d’assurance-emploi pour les Canadiens qui suivent une formation de longue durée et pour permettre un accès plus rapide aux prestations d’assurance-emploi aux personnes qui paient elles-mêmes leur formation à partir des sommes obtenues à la suite d’une mise à pied.
g) Geler les taux de cotisation d’assurance-emploi de 2010.
h) Offrir de 5 à 20 semaines supplémentaires de prestations aux individus qui ont travaillé et versé des cotisations d’assurance-emploi pendant une longue période mais qui ont eu un recours limité aux prestations régulières d’assurance-emploi.
37. Combien de fois avez-vous reçu des prestions d’assurance-emploi au cours des cinq dernières années ?
38. Pour quelle(s) raison(s) avez-vous reçu des prestations d’assurance-emploi ? Est-ce que vous… [LIRE LA LISTE; RÉPONSES MULTIPLES ACCEPTÉES]
39. Pendant que vous receviez des prestations d’assurance-emploi, au cours des cinq dernières années, avez-vous déménagé pour trouver du travail ?
POSER À TOUS LES RÉPONDANTS :
40. Est-ce qu’un autre membre de votre foyer a reçu des prestations d’assurance-emploi au cours des derniers cinq ans ?
41. Pour quelle(s) raison(s) cette autre personne a-t-elle reçu des prestations d’assuranceemploi ? Est-ce qu’elle… [LIRE LA LISTE; RÉPONSES MULTIPLES ACCEPTÉES]
À présent, j’aimerais obtenir des renseignements qui nous permettront de regrouper les réponses de tous les participants à ce sondage.
42. En quelle année êtes-vous né(e) ?
43. Quel est le niveau de scolarité le plus élevé que vous ayez atteint ? [NE PAS LIRE; ACCEPTER UNE SEULE RÉPONSE]
*NOTA : COMME LES PROFESSIONS DES DOMAINES JURIDIQUE, MÉDICAL ET COMPTABLE.
POSER AUX EMPLOYÉS ET AUX TRAVAILLEURS AUTONOMES :
44. Dans quel secteur travaillez-vous ? [NE PAS LIRE; ACCEPTER UNE SEULE RÉPONSE]
45. Êtes-vous employé(e) dans une petite (<50 employés), moyenne (50-500) ou grande (500+) entreprise ou organisation ?
POSER À TOUS LES RÉPONDANTS :
46. Est-ce que vous êtes… [LIRE LA LISTE; ACCEPTER UNE SEULE RÉPONSE]
47. Est-ce que des enfants âgés de moins de 18 ans habitent avec vous ? Il s’agit ici des enfants qui vivent chez vous en permanence ou en alternance, dans le cas d’une garde partagée. [LIRE LA LISTE; ACCEPTER UNE SEULE RÉPONSE]
48. Est-ce que des adultes âgés de plus de 65 ans, avec qui vous avez un lien de parenté, habitent avec vous ? [LIRE LA LISTE; ACCEPTER UNE SEULE RÉPONSE]
49. Laquelle des catégories suivantes correspond le mieux au revenu total annuel, avant impôt, de tous les membres de votre foyer, en 2009 ? Arrêtez-moi lorsque j’aurai identifié votre catégorie. [LIRE LA LISTE; ACCEPTER UNE SEULE RÉPONSE]
50. Et quel était votre revenu personnel, avant impôt, en 2009? Arrêtez-moi lorsque j’aurai identifié votre catégorie. [LIRE LA LISTE; ACCEPTER UNE SEULE RÉPONSE]
51. À des fins de vérification seulement, veuillez me donner les trois premiers caractères de votre code postal.
Voilà qui conclut l’entrevue. Merci beaucoup de vos commentaires réfléchis.
Nous apprécions votre collaboration.
1 Please note that throughout the report the category "employed" refers to persons working for an employer, employed students, and persons on temporary leave, while the term "self-employed" refers to persons who are self-employed, as well as self-employed persons who are also working for an employer.
2 Please note the relatively small base (n= 114) and exercise caution when interpreting these data.
3 Please see Footnote 1 for definition of the terms employed and self-employed used elsewhere in this report.
§ If respondent appears confused about this program, or asks for clarification, please say that Employment Insurance was previously called Unemployment Insurance or UI.
** Si le/la répondant(e) semble confus(e) à propos de ce programme ou s’il/si elle demande des précisions, lui dire que l’assurance-emploi s’appelait autrefois l’assurance-chômage ou l’AC.