This public opinion research report presents the results of an online survey conducted by Ekos Research Associates Inc. on behalf of Indigenous Services Canada (ISC). The research study was conducted with 340 nurses between March 20 and May 3, 2023.
Cette publication est aussi disponible en français sous le titrenbsp;: Sondage 2023 sur la main d'oeuvre en soins infirmiers de Services aux Autochtones Canada (SAC).
This publication may be reproduced for non-commercial purposes only. Prior written permission must be obtained from Public Services and Procurement Canada. For more information on this report, please contact Public Services and Procurement Canada at tpsgc.questions-questions.pwgsc@tpsgc-pwgsc.gc.ca or at:
Table 3: Degree and Nature of Payroll Issues Experienced
Table 4: Methods of Communicating About Work-Related Issues
Table 5: Nature of Safety & Security Concerns
Table 6: Participation in & Impact of NSAT
Table 7: Participation in & Satisfaction with OCISM
Table 8: Participation in & Satisfaction with NSRC
Table 9: Awareness of TRC Calls to Action
Table 10: Use of Indigenous Traditional Health at Work
Table 11: Sample Characteristics
Table 12: Response Rate Details
Table 13: Key Regional Results by Thematic Area
List of Charts
Chart 1: Current Nursing-Related Education
Chart 2: Employment History
Chart 3: Area of Responsibility
Chart 4: Workplace
Chart 5: Nurse Practitioner
Chart 6: Motivation for Joining / Staying
Chart 7: Impact of Staff Turnover
Chart 8: Perceived Value
Chart 9: Satisfaction with Quality of Care
Chart 10: Satisfaction with Job Support
Chart 11: Satisfaction with Level of Influence
Chart 12: Satisfaction with Work-Life Balance
Chart 13: Degree of Work-Related Stress
Chart 14: Sources of Stress
Chart 15: Satisfaction with Stress Relief Efforts
Chart 16: Suggested Areas for Stress Relief Efforts
Chart 17: Satisfaction with Training and Orientation
Chart 18: Satisfaction with Professional Development
Chart 19: Satisfaction with Leadership Development
Chart 20: Satisfaction with Pay and Benefits
Chart 21: Adequacy of Communications
Chart 22: Degree of Issues with IM/IT
Chart 23: Satisfaction with IM/IT Service and Support
Chart 24: Ease of Access to IM/IT Support
Chart 25: Responsiveness of IM/IT Support Services
Executive Summary
A. Background and Objectives
Indigenous Services Canada's (ISC) vision is to support Indigenous peoples to independently deliver services and address the socio-economic conditions in their communities. This includes the delivery of sustainable, quality healthcare services to Indigenous communities. This is only possible in community healthcare if the department can stabilize its nursing workforce. Stabilizing this workforce is essential to improve First Nations communities' continuity and quality of care. Supporting and growing Indigenous nurses' representation is also essential to a stable and sustainable nursing workforce to position these services for transfer to First Nations management and control.
Indigenous Services Canada (ISC) conducted the current nursing workforce survey in follow-up to surveys conducted in 2002, 2006 and 2020. The 2023 survey provides an opportunity to compare results with 2020 and provide data concerning the impact of the pandemic, which is particularly important considering the global nursing shortage and the reported increased vacancy rates in remote and isolated First Nations communities. The specific objectives of the 2023 nurses' workforce survey were to:
Gather current information, using survey questions, on the existing ISC nurses' demographics, job satisfaction and future employment intentions to:
Improve upon the current Nursing Health Human Resource Framework (NHHRF) initiatives, including targeted marketing strategies;
Inform human resource planning over the next three to five years; and,
Inform the process for transfer of healthcare delivery.
Determine the impact of retention and recruitment initiatives on nurses' job satisfaction based on the following criteria: healthy workplace, workload, work-life balance, career progression, professional development, safety and security, and leadership training;
Compare the ISC nursing workforce to the national nursing workforce statistics (i.e. Canadian Institute for Health Information) for nurses working in:
rural, remote and/or isolated communities; and
Indigenous communities across Canada.
Utilize previous survey data to describe the impact of the pandemic on the nursing workforce, comparing indicators (as outlined), highlighting changes which have occurred as a result, and,
To outline key findings and recommendations for future nursing human resource planning.
B. Methodology
The 2023 survey was finalized after an extensive review by the ISC Workforce Survey Advisory Committee. As the goal was to allow for a direct comparison of results to the 2020 survey, the 2020 survey was essentially unchanged except for removing several lower-priority questions to add several new questions. Following the programming and translation of the survey, an invitation to participate was sent to 10 cases in English and 10 cases in French to participate in a pretest online. There were 12 cases completed in the pretest, seven in English and five in French. Some minor changes were subsequently made to clarify a few questions, and the survey was launched online on March 20, 2023, and closed on May 3, 2023.
During data collection, weekly reminders were sent by Ekos, as well as a minimum of four reminder calls where a telephone number was listed, to all non-responding nurses. ISC took a multi-pronged approach to communicate with nurses and build awareness of the survey. Before the launch of the survey, an email was sent jointly by the First Nations and Inuit Health Branch (FNIHB), Senior Assistant Deputy Minister (SADM) and Assistant Deputy Minister Regional Operations (ADM-RO) to inform all nursing staff of the upcoming census survey. Messaging to alert nurses to the survey was also included in The Express and Nursing Services Response Centre (NSRC) newsletters. A reminder to participate was sent by the Office of Primary Health Care Director General Office to all ISC nurse employees at the mid-point of the field duration. Communication was sent by email in the last week of fieldwork to nurses by the ISC FNIHB Senior Director of Primary Health Care Services to Directors of Nursing and Regional Executives to encourage participation among nurses and remind them that Ekos is conducting the survey with associated email and call display details.
340 of the 758 nurses at ISC participated in the survey. Of these, 289 participated online. The overall response rate was 45%. Of the 340 responding nurses, 67 identified as Indigenous. Appendix A provides details of the response rate by region. The survey questionnaire can be found in Appendix B.
C. Key Findings
Education
Most of the 340 nurses responding to the survey have an undergraduate degree as their highest nursing education level, including a Bachelor of Science in nursing (BScN) or a Bachelor of Nursing (BN) (59%). The remainder primarily have a Masters in nursing (19%) or an RN College Diploma (11%).
Employment
Nearly one in three have been nurses for 25 years or more. Another 26% have been a nurse for 15 to 25 years, and 33% have been employed for 5 to 15 years. Only 10% have worked as a nurse for less than five years. Regarding employment with ISC specifically, 48% of respondents have been with ISC for fewer than five years, a notable increase from 36% in 2020.
Similar to 2020, three in five (60%) nurses responding to the survey are working full-time, more than 30 hours per week. Three in ten (29%) are working part-time, while one in ten is in either a casual position (7%) or another (4%) employment arrangement. Over half of the nurses responding to the survey are employed as a clinician or in clinical care, while 17% are practice advisors and 15% are in management.
Workplace
Most nurses responding to the survey work at a nursing station (44%) or a regional, zone, or branch office (32%). Far fewer are located in a health centre either with a treatment component (9%) or without a treatment component (6%). One in ten is registered as a Nurse Practitioner (NP).
Recruitment and Retention
The majority were first attracted to their job because of the opportunity to work with a diverse culture (73%). Over half were first attracted by the job because of the autonomy in nursing practice. Nearly half (47%) were attracted to the job because of a desire to work in remote or rural settings, and 29% continue to stay for this reason. Most motivations experienced a decrease from 2020.
One in three nurses in the survey plan to leave their current employer in the next three years, unchanged from 2020. Of those planning to leave, 36% expect to leave within the year. The primary reasons for those planning to leave include retirement (38%) or a different job (22%). Three in five nurses (61%) responding to the survey agree the quality of their work suffers because of high staff turnover, an increase from 54% in 2020.
Job Satisfaction
Just over half (51%) of the nurses responding to the survey agree that they feel valued at work; one in three (33%) disagree. Half also agree that they are satisfied with their ability to deliver quality care. Fewer nurses responding to the survey are satisfied with their support on the job, a decrease from 2020. Less than half are satisfied with the feedback and support they receive from nursing management (44%) or the physical maintenance at their work facility (34%). Fewer are satisfied with the number of allied health professionals or support staff at their workplace, including technical staff (25%), or the number of healthcare and paraprofessional staff on duty to provide quality care (17%), with considerably larger proportions who are dissatisfied. Across these areas, results are weaker among clinicians, those working in nursing stations, and those working part-time or casual.
About half (52%) of nurses participating in the survey agree they have opportunities to provide input into decisions affecting their work. Satisfaction with the opportunities to participate in policy and practice decisions is even lower, with nearly as many nurses indicating they are dissatisfied (35%) as are satisfied (33%). Again, employees working in clinical care, nursing stations, and working part-time or casual express less satisfaction in these areas.
Two in five (39%) nurses participating in the survey say they regularly have a high level of work-related stress, an increase from 33% in 2020. The top sources of stress are not enough employees to do the work (66%) and heavy workload (61%). Six in ten are satisfied with their family and work-life balance, consistent with 2020.
Slightly over half of nurses in the survey are satisfied with the current opportunities for professional development or continuing education, although 25% are dissatisfied. Only one in three (33%) nurses are satisfied with the amount of pay, including base pay and allowances, a notable decrease from 51% in 2020. Nearly half (47%) are satisfied with the benefits, including health and dental coverage they receive; however, this has also decreased from 59% in 2020. Nearly two in three (64%) have experienced pay or other compensation issues within the past three years. Nurses working in clinical care, at a nursing station or health centre with treatment, or are part-time or casual expressed less satisfaction in these areas.
Adequacy of Communications
There is modest satisfaction with the communication received, including being informed by the immediate supervisor (57%), regional office (38%), or national office (28%). About four in five (80%) say they currently communicate in their preferred method of communication, notably through work email (71%, an increase from 57% in 2020).
Information Management and Technology
Satisfaction with IT-related issues has increased since 2020. While two in five (42%) nurses agree their quality of work suffers due to a lack of access to technology, this decreased from 54% in 2020. More nurses responding to the survey are satisfied with the reliability of access to the internet (53%, a notable increase from 36% in 2020), IT equipment (40%, up from 27%), training to use computers or software (28%) or medical or diagnostic equipment (23%). Twice as many nurses say it is easy (61%) to submit a request for IT support as in 2020 (30%). Results are higher among practice advisors or educators, in management or leadership positions, working in a regional, zone or branch office, or working full time. Three in five (61%) nurses say IT support staff is responsive to a submitted request, a vast increase from 24% in 2020.
Safety and Security
There is a list of factors that have negatively impacted nurses' sense of safety and security at work. These primarily include not enough staff (55%), the level or quality of staff (46%), the physical work environment (41%), verbal (32%) or physical (18%) threats from patients or family members.
Just over half (53%) of nurses have participated in Nursing Safety Awareness Training (NSAT), and 20% feel this has positively contributed to their workplace safety and security. Both results have experienced a decline from 2020.
Most nurses (81%) say they are aware of the Occupational and Critical Incident Stress Management (OCISM) resources, and 46% indicate they have participated in OCISM training. Over one in four (28%) feel their work environment allows them to practice the skills obtained through OCISM, while one in five (19%) say access to OCISM services has increased their intention to stay.
Three in four (75%) nurses responding to the survey are aware of the Nursing Services Response Centre (NSRC). Of these, nearly three in four (72%) said they had used the services of the NSRC in the last year. Satisfaction with the NSRC is relatively high, with 84% of those who have used the services indicating satisfaction; only 4% are dissatisfied. Nine in ten (90%) would recommend the services of the NSRC to colleagues.
TRC Calls to Action
Two in three nurses responding to the survey have been informed about the Truth and Reconciliation (TRC) Calls to Action. However, only 17% feel they have experienced any changes to their workplace due to the TRC Calls to Action.
Indigenous Traditional Health Knowledge Exchange
Nearly three in four nurses responding to the survey strongly understand Indigenous cultural awareness, safety and humility, which is higher among Indigenous nurses. Nearly one in three (23%) have access to language interpreters all or most of the time, and 14% have access some of the time, although access is much greater among nurses in clinical care, at a nursing station or health centre with treatment, or are part-time or casual. Less than one in five (16%) are satisfied with the opportunities and support to incorporate traditional medicine into their nursing practice.
D. Note to Readers
Detailed findings are presented in the following sections. Overall results are presented in the central portion of the narrative and are typically supported by graphic or tabular presentation. Bulleted text is used to point out any statistically and substantively significant differences between sub-groups of responding nurses.
The study attempted to include all ISC-employed nurses in the study. Therefore, since no random sample was selected, no margin of error should be applied to the final sample in describing the results. To preserve confidentiality, study results were not reported for groups smaller than 20, nor were individual results reported where they represented fewer than ten nurses (i.e., cell sizes smaller than 10). If sub-group differences are not noted in the report, it can be assumed they are either not substantively significant in their variation from the overall result or the difference was deemed to be substantively too small to be noteworthy.
Results for the proportion of respondents in the sample who either said “don't know” or did not provide a response are not indicated in the graphic representation of the results in all cases, mainly where they are not sizable (e.g., 10% or greater). Results may also not total 100% due to rounding.
Results are compared with the 2006 survey findings (n=222) when appropriate. Maintaining a fulsome comparison of results with 2006 is impossible due to changes in question-wording and rating scales in some instances.
E. Contract Value
The contract value for the POR project is $48,951.60 (including HST).
I hereby certify as Senior Officer of Ekos Research Associates Inc. that the deliverables fully comply with the Government of Canada political neutrality requirements outlined in the Policy on Communications and Federal Identity and the Directive on the Management of Communications. Specifically, the deliverables do not include information on electoral voting intentions, political party preferences, standings with the electorate, or ratings of the performance of a political party or its leaders.
Signed by Susan Galley (Vice President)
Detailed Findings
A. Education
Current Nursing-Related Education
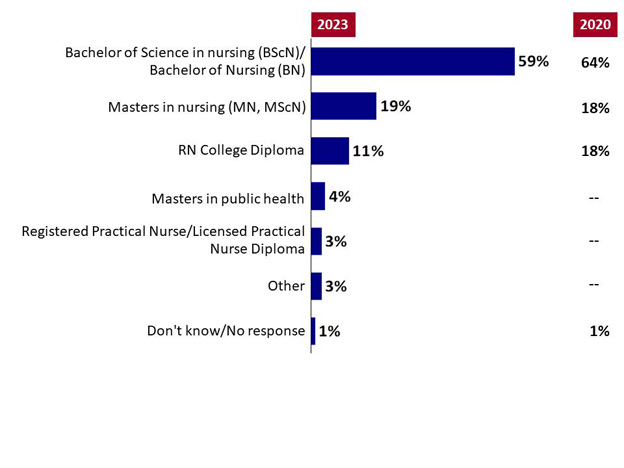
Most of the 340 nurses responding to the survey have an undergraduate degree as their highest nursing education qualification. Nearly three in five (59%) have either a Bachelor of Science in Nursing (BScN) or a Bachelor of Nursing (BN). Nearly one in five respondents have a Masters in Nursing (MN, MScN) (19%), while 11% have an RN college diploma. This 2023 survey question allowed respondents to state any other education qualification level; 4% have a Masters in public health, 3% are Registered Practical Nurses or have a Licensed Practical Nurse Diploma, and 3% indicated some other level of education.
Education qualification levels have changed significantly from the 2006 survey when 41% held an RN diploma.
Chart 1: Current Nursing-Related Education
Chart 1: Current Nursing-Related Education - Text Version
This chart of single bars shows the percentage of results for responses to seven statements for 2023. On the side, one column shows the percentage of results for 2020.
Respondents were asked: "What is your highest nursing education qualification level?"
Respondents selected:
Bachelor of Science in nursing (BScN)/Bachelor of Nursing (BN): 59%; 2020: 64%
Q31. What is your highest nursing education qualification level?
Base: n=340
Responding nurses in the Saskatchewan (61%) or Alberta (57%) regions are more likely than those in other regions to have a Bachelor of Science in Nursing (BScN) degree. Those in Manitoba are more likely to say they have a Bachelor of Nursing (BN) (37%) or RN College Diploma (22%) than other regions.
Those who are 40 and younger are more apt to have a Bachelor of Science in Nursing (57% of those aged 31 – 40, and 80% of those aged 30 and under), while those aged 51 and over are more apt to have an RN College Diploma (22% to 24%).
Respondents with a Masters in nursing are apt to be in a management or leadership position (35%) and work in regional, zone or branch offices (28%). Those with an RN college diploma are more likely to work at a nursing station or health centre with treatment (16%).
B. Employment
Employment History
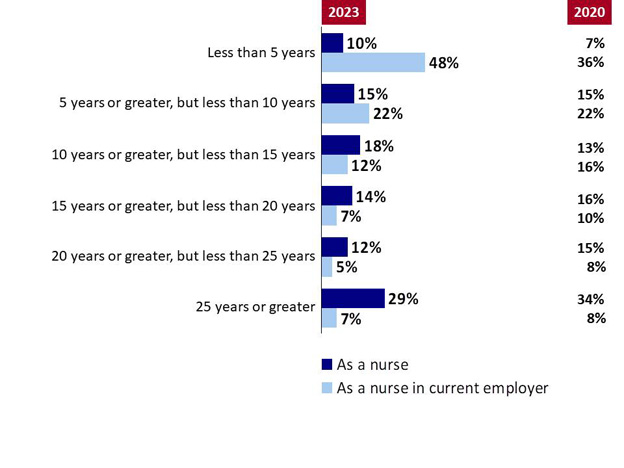
Regarding overall employment history in nursing, 29% of nurses responding to the survey have been employed for 25 years or more, a decrease from 34% in 2020. Another 26% have been a nurse for 15 to 25 years, and 33% have been employed for 5 to 15 years. Only 10% have worked as a nurse for less than five years.
Regarding employment with ISC specifically, 48% of respondents have been with ISC for fewer than five years, an increase from 36% in 2020. Another 34% have been with ISC for five to 15 years, 12% have been with the department for 15 to 25 years, and 7% have been with ISC for 25 years or more.
Compared with the 2006 Survey of Nurses, there are fewer longer-term nurses in 2023. The 2023 results of up to ten years of nursing experience are virtually unchanged from the 2006 survey, which reported that 10% were employed as a nurse for fewer than five years and 14% from five to ten years. However, 2006 results demonstrated that 64% of respondents had been employed as a nurse for 15 or more years, compared with 55% in 2023. In terms of working as a nurse, specifically with their current employer, there are more ‘newer' employees in 2023 (48% employed with ISC for fewer than five years) compared to 2006 (40% employed by FNIHB for fewer than five years). The remainder of 2006 findings were similar to 2023 in terms of length of time as a nurse with current employer: 22% (22% in 2023) were employed with FNIHB for five to ten years, 12% (12% in 2023) for 10 to 15 years, and 20% (19% in 2023) for 15 years or more.
Chart 2: Employment History
Chart 2: Employment History - Text Version
This chart of double bars shows the percentage of results for responses to six statements across two categories “As a nurse” and “As a nurse in current employer” for 2023. On the side, one column shows the percentage of results for each category for 2020.
Respondents were asked two questions: “For how many years have you been employed as a nurse?” AND “For how many years have you been employed as a nurse in your current employer?”
Respondents selected:
Less than 5 years:
As a nurse: 10%; 2020: 7%
As a nurse in current employer: 48%; 2020: 36%
5 years or greater, but less than 10 years:
As a nurse: 15%; 2020: 15%
As a nurse in current employer: 22%; 2020: 22%
10 years or greater, but less than 15 years:
As a nurse: 18%; 2020: 13%
As a nurse in current employer: 12%; 2020: 16%
15 years or greater, but less than 20 years:
As a nurse: 14%; 2020: 16%
As a nurse in current employer: 7%; 2020: 10%
20 years or greater, but less than 25 years:
As a nurse: 12%; 2020: 15%
As a nurse in current employer: 5%; 2020: 8%
25 years or greater:
As a nurse: 29%; 2020: 34%
As a nurse in current employer: 7%; 2020: 8%
Base: n=340
Q1. For how many years have you been employed as a nurse?
Q1a. For how many years have you been employed as a nurse in your current employer?
Base: n=340
Survey respondents with an RN college diploma are likelier to have been employed as a nurse for 25 years or more (58%). Therefore, they are almost exclusively 51-60 years of age (60%) or 61 and older (84%).
Nurses in management or leadership positions tend to have been nurses for 15-25 years (23%).
Indigenous respondents are more likely to have been employed as a nurse by their current employer for 20-25 years (10%) or 25 years or more (13%) compared with non-Indigenous respondents (3% and 5%, respectively).
Just under two in three (60%) nurses responding to the survey work full-time, more than 30 hours per week. Three in ten (29%) are working part-time, while one in ten is in either a casual position (7%) or another (4%) employment arrangement. Over four in five of those responding to the survey (84%) are in an indeterminate position. Results are very similar to 2020, except those in term positions increased to 13% from 7%.
In 2006, only a slightly higher proportion (65%) of nurses said they were in a full-time position, although 21% were part-time, and 14% were in a casual position. Similar to current results in 2006, 86% of participating nurses were indeterminate.
Table 1: Employment Status
Response
Total 2023
Total 2020
Q2. Which of these best describes your current employment status with your current employer?
n=340
n=322
Full-time: regularly working 30 or more hours a week
60%
61%
Part-time: regularly working less than 30 hours a week
29%
30%
Casual position (employment that doesn't exceed 120 hours a year)
7%
4%
Other
4%
5%
Q3. Are you considered to be in an indeterminate, or term position?
n=340
n=322
Indeterminate
84%
89%
Term
13%
7%
Other
2%
2%
Don't know/No response
2%
2%
The incidence of full-time employment is higher among responding nurses from the Saskatchewan, Quebec-Atlantic and NCR Regions (93%-100%) and lowest in Manitoba (37%) and Ontario (49%).
Nurses working as practice advisors (94%), management and leadership (94%) tend to be employed full-time. Those in clinical care are more likely to report being part-time (50%) or in a casual position (13%). Nurses in a nursing station or health center with treatment also are apt to be part-time (52%) or casual (11%).
Area of Responsibility
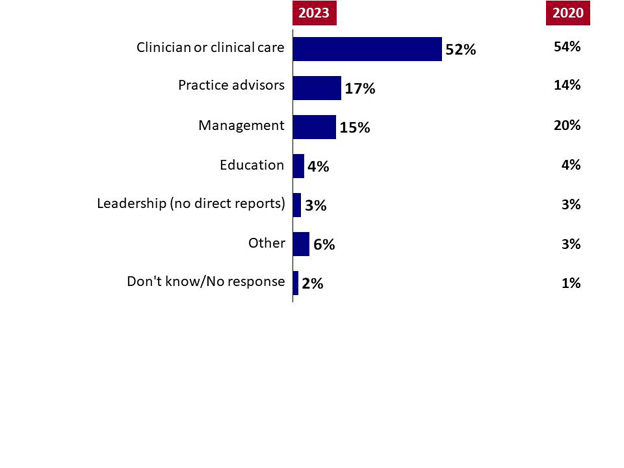
Over half (52%) of nurses responding to the survey are employed as clinicians or in clinical care. Nearly two in five are practice advisors (17%), while 15% are in management. Results are relatively similar to 2020.
In 2006, more nurses were in clinical practice (63%) and education (10%).
Chart 3: Area of Responsibility
Chart 3: Area of Responsibility - Text Version
This chart of single bars shows the percentage of results for responses to seven statements for 2023. On the side, one column shows the percentage of results for 2020.
Respondents were asked: "Which of the following areas best describes your primary area of responsibility?"
Respondents selected:
Clinician or clinical care: 52%; 2020: 54%
Practice advisors: 17%; 2020: 14%
Management: 15%; 2020: 20%
Education: 4%; 2020: 4%
Leadership (no direct reports): 3%; 2020: 3%
Other: 6%; 2020: 3%
Don't know/No response: 2%; 2020: 1%
Base: n=340
Q4. Which of the following areas best describes your primary area of responsibility?
Base: n=340
Responding nurses working in Manitoba (68%) are more likely to be in clinical care than in other regions—those working part-time or casual to be in clinical care (89%).
Younger nurses (age 30 and under) are more likely than older cohorts to be in clinical care (82%). Those aged 41-50 tend to be practice advisors (24%) or in management (25%).
Workplace
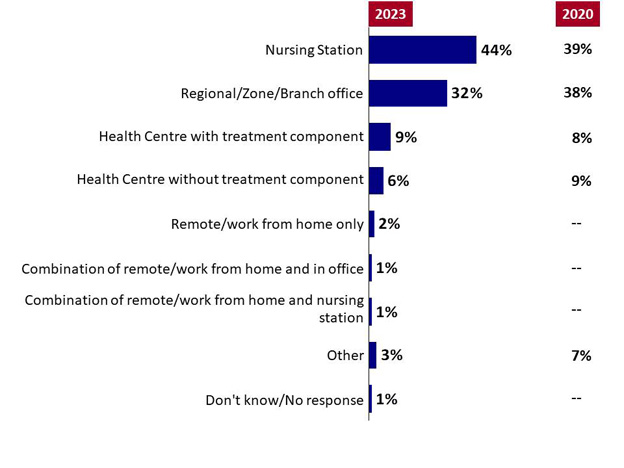
Over two in five nurses responding to the survey work at a nursing station (44%, an increase from 39% in 2020). About one in three are in a Regional, Zone, or Branch Office (32%, a decrease from 38% in 2020). The remainder are located in a health centre either with a treatment component (9%) or without a treatment component (6%).
In 2006, a similar proportion (43%) reported working at a nursing station, although only 23% worked at a regional, zone or branch office. Far more work at a health centre without a treatment component (24%), and 7% worked at a health centre with a treatment component.
Chart 4: Workplace
Chart 4: Workplace - Text Version
This chart of single bars shows the percentage of results for responses to nine statements for 2023. On the side, one column shows the percentage of results for 2020.
Respondents were asked: "Which of the following types of facilities best describes your primary place of work?"
Respondents selected:
Nursing Station: 44%; 2020: 39%
Regional/Zone/Branch office: 32%; 2020: 38%
Health Centre with treatment component: 9%; 2020: 8%
Health Centre without treatment component: 6%; 2020: 9%
Remote/work from home only: 2%; 2020: N/A
Combination of remote/work from home and in office: 1%; 2020: N/A
Combination of remote/work from home and nursing station: 1%; 2020: N/A
Other: 3%; 2020: 7%
Don't know/No response: 1%; 2020: N/A
Base: n=340
Q5. Which of the following types of facilities best describes your primary place of work?
Base: n=340
Responding nurses working at a nursing station are considerably more likely than others to work part-time or casual (84%).
Those working in a regional/zone or branch office are more likely to work full-time (53%).
Nursing station workers are more likely to be in Manitoba (74%) or Ontario (58%). Nurses in Alberta (26%) or Saskatchewan (20%) are apt to work in a health center with a treatment component. In comparison, Saskatchewan (34%) is the only region with nurses reporting working in a health center without a treatment component.
Indigenous respondents are more likely than non-Indigenous to say they work in a health center with (15%) or without (16%) a treatment option.
Nurse Practitioner
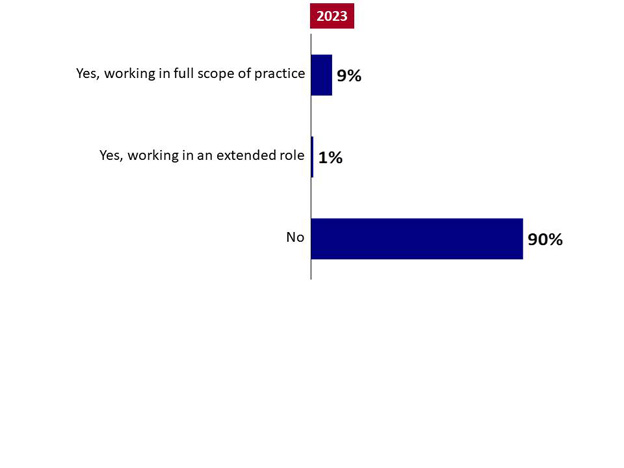
One in ten responding nurses works as a Nurse Practitioner in a full scope of practice (9%) or in an extended role (1%).
Chart 5: Nurse Practitioner
Chart 5: Nurse Practitioner - Text Version
This chart of single bars shows the percentage of results for responses to three statements for 2023.
Respondents were asked: "Are you registered as a Nurse Practitioner?"
Respondents selected:
Yes, working in full scope of practice: 9%
Yes, working in an extended role: 1%
No: 90%
Base: n=340
Q37d. Are you registered as a Nurse Practitioner?
Base: n=340
Of all responding nurses with an MN or greater, 33% are registered as Nurse Practitioners.
C. Recruitment and Retention
Motivation for Joining / Staying
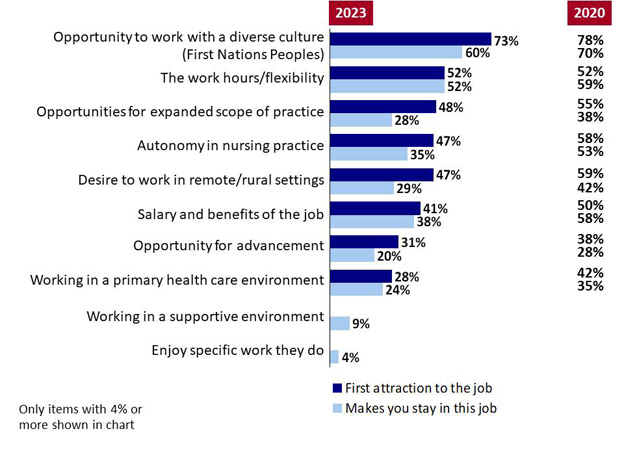
Most nurses responding to the survey were first attracted to their job because of the opportunity to work with a diverse culture (73%); 60% continue to stay with the job for this reason, a decrease from 70% who stayed in their job for this reason in 2020. Just over half were attracted (52%) and stayed (52%) because of the work hours and flexibility, similar to 2020 results. As the chart below demonstrates, all other motivations experienced a decrease from 2020. A significant divide is seen with the opportunities and expanded scope of practice (this first attracted 48%, but only 28% stayed for this reason, likely because their employment lifecycle has progressed).
Less than half were first attracted by (47%) and continue to stay (35%) with the job because of the autonomy it affords. In comparison, 47% were attracted to the job because of a desire to work in remote or rural settings; far fewer (29%) continue to stay for this reason. Two in five (41%) were first attracted to the job because of the salary and benefits; a similar proportion (38%) stayed for this reason. Just under one in three nurses said this about opportunities for advancement (31% were first attracted to the opportunities, but only 20% stayed for this reason).
Over one in four (28%) were first attracted to the job to work in a primary healthcare environment, and 24% continue.
The motivation to work with a diverse culture remains up considerably from 2006 when 54% were attracted, and 49% stayed for it.
Chart 6: Motivation for Joining / Staying
Chart 6: Motivation for Joining / Staying - Text Version
This chart of double bars shows the percentage of results for responses to ten statements across two categories "First attraction to the job" and "Makes you stay in this job" for 2023. On the side, one column shows the percentage of results for each category for 2020.
Respondents were asked two questions: "What aspects of your current job first attracted you to it?" AND "What aspects keep you working as an employee in this job?"
Respondents selected:
Opportunity to work with a diverse culture (First Nations Peoples):
First attraction to the job: 73%; 2020: 78%
Makes you stay in this job: 60%; 2020: 70%
The work hours/flexibility:
First attraction to the job: 52%; 2020: 52%
Makes you stay in this job: 52%; 2020: 59%
Opportunities for expanded scope of practice:
First attraction to the job: 48%; 2020: 55%
Makes you stay in this job: 28%; 2020: 38%
Autonomy in nursing practice:
First attraction to the job: 47%; 2020: 58%
Makes you stay in this job: 35%; 2020: 53%
Desire to work in remote/rural settings:
First attraction to the job: 47%; 2020: 59%
Makes you stay in this job: 29%; 2020: 42%
Salary and benefits of the job:
First attraction to the job: 41%; 2020: 50%
Makes you stay in this job: 38%; 2020: 58%
Opportunity for advancement:
First attraction to the job: 31%; 2020: 38%
Makes you stay in this job: 20%; 2020: 28%
Working in a primary health care environment:
First attraction to the job: 28%; 2020: 42%
Makes you stay in this job: 24%; 2020: 35%
Working in a supportive environment:
Makes you stay in this job: 9%
Enjoy specific work they do:
Makes you stay in this job: 4%
Base: n=340
Q1a5. What aspects of your current job first attracted you to it?
Q1a6. What aspects keep you working as an employee in this job?
Base: n=340
Responding nurses currently working in clinical care, at a Nursing station or Health center with treatment, as well as those working part-time, are more likely than other nurses in the survey to have been attracted or kept their position because of the ability to work in a primary health care environment (35%-37%), the desire to work in remote or rural settings (58%-61%), or opportunities for expanded scope of practice (56%-64%).
Those in management or leadership positions, working in a Regional, Zone or Branch office, or employed full-time are more apt to have been attracted or stay for opportunities for advancement (39%-46%).
Nurses in Manitoba (62%) or Ontario (56%) are more likely than those in other regions to say the opportunities for expanded scope of practice attracted them. Those in Ontario (59%) were apt to cite their desire to work in remote/rural settings.
Men (44-52%) are more likely than women (21-25%) to say they were attracted to or stay in their job because of the opportunity to work in a primary health care environment.
Indigenous nurses are more likely to say they were attracted to (13%) or stay (10%) in their job because of their ability to work in their home community, First Nation, or close to their partner, compared to non-Indigenous nurses (0% to 2%).
Unchanged from 2020, over one in three nurses responding to the survey (35%) plan to leave their current employer in the next three years. However, fewer have no plans to leave their employer (36% compared to 46% in 2020), and more are unsure (29% compared to 18% in 2020). Of those planning to leave, over one in three (36%) expect to leave within the year, an increase from 23% in 2020. Another 38% expect to leave within one or two years, and 18% say it will be three years. Although 38% plan to retire, about one in five intend to leave for a different job (22%). Other reasons indicated by about one in ten include poor management practices (13%) or poor working conditions (11%).
Table 2: Seeking Changes
Response
Total 2023
Total 2020
Q7. Do you currently have any plans to leave your current employment within the next three years, either to retire or for other reasons?
n=340
n=322
Yes
35%
36%
No
36%
46%
Don't know/No response
29%
18%
Q7b. What is your expected timeframe for leaving?
n=114
n=109
Less than 1 year
36%
23%
1 year
19%
13%
2 years
19%
25%
3 years
18%
19%
Don't know/No response
8%
20%
Q7c. What is the main reason you intend to leave?
n=114
n=109
Retirement
38%
44%
Different job
22%
17%
Poor management practices
13%
--
Poor working conditions
11%
--
Issues with salary/pay
6%
--
Stay at home/parental leave
4%
--
Attend school/returning to studies
3%
--
Term assignment/contract ending
2%
--
Relocation
1%
--
Dissatisfied with current position
--
21%
Other
1%
16%
Don't know/No response
--
1%
Responding nurses currently working in clinical care, at a Nursing station or Health center with treatment, or working part-time are more likely to say they have plans to leave within three years (41% - 45%). Congruently, nurses aged 61 and over (72%) are more likely to have plans to leave in the next three years, with those in a Regional, Zone or Branch office more likely to say they intend to leave due to retirement.
Nurses in Manitoba (44%) are more likely than those in other regions to say they plan to leave in the next three years. Although a low sample size, those in Ontario (17%, 6 out of 35 nurses in Ontario responding to the follow-up question) are more likely than those in other regions (0 – 8%) to say they intend to leave due to issues with salary, pay, unpaid work, or missing pay.
Impact of Staff Turnover
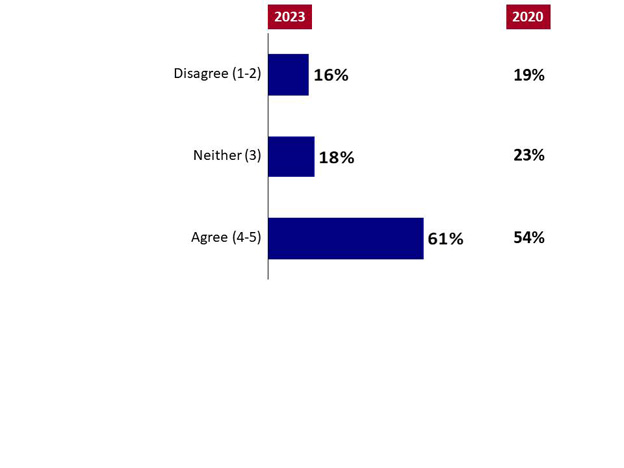
Three in five nurses responding to the survey (61%) agree the quality of their work suffers because of high staff turnover. This result is a notable increase from 54% in 2020. Less than one in five (16%) disagree, and another 18% indicated a more neutral response.
Chart 7: Impact of Staff Turnover
Chart 7: Impact of Staff Turnover - Text Version
This chart of single bars shows the percentage of results for responses to three statements for 2023. On the side, one column shows the percentage of results for 2020.
Respondents were asked: "Please indicate whether you agree or disagree with the following: I feel the quality of my work suffers because of high staff turnover."
Respondents selected:
Disagree (1-2): 16%; 2020: 19%
Neither (3): 18%; 2020: 23%
Agree (4-5): 61%; 2020: 54%
Base: n=340
QJS17. Please indicate whether you agree or disagree with the following: I feel the quality of my work suffers because of high staff turnover.
Base: n=340
Nurses currently working in clinical care (66%), at a nursing station or health center with treatment (69%), or are not employed full-time (68%), are more likely than other nurses in the sample to feel the quality of work suffers because of high staff turnover.
D. Job Satisfaction
Perceived Value
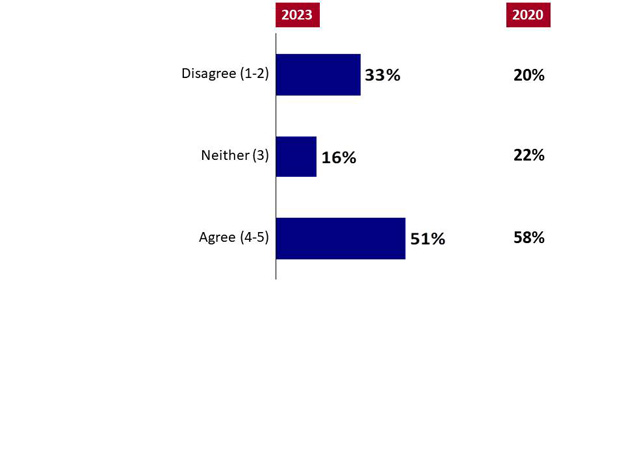
Just over half (51%) of the nurses responding to the survey feel valued at work, compared to 58% in 2020. One in three (33%) disagree that they feel valued.
Chart 8: Perceived Value
Chart 8: Perceived Value - Text Version
This chart of single bars shows the percentage of results for responses to three statements for 2023. On the side, one column shows the percentage of results for 2020.
Respondents were asked: "Please indicate whether you agree or disagree with the following: Overall, I feel valued at work."
Respondents selected:
Disagree (1-2): 33%; 2020: 20%
Neither (3): 16%; 2020: 22%
Agree (4-5): 51%; 2020: 58%
Base: n=340
QJS18. Please indicate whether you agree or disagree with the following: Overall, I feel valued at work.
Base: n=340
Responding nurses working in clinical care (37%), at a nursing station or treatment center (40%), or not working full time (43%) are less likely than others to feel valued at work.
Regionally, those in the NCR (68%) are more likely to say they feel valued; those in Manitoba (41%) are least likely.
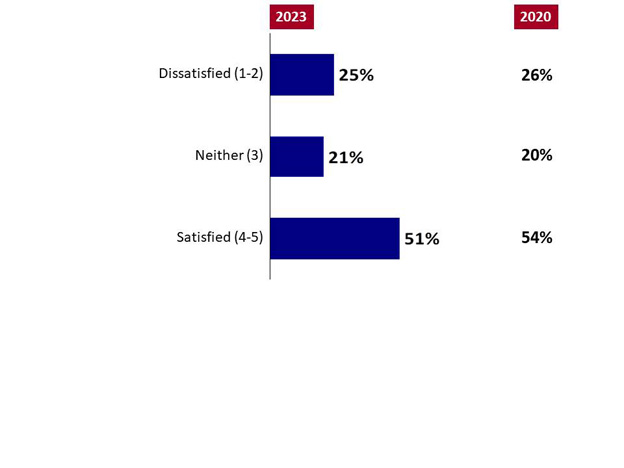
Satisfaction with Quality of Care
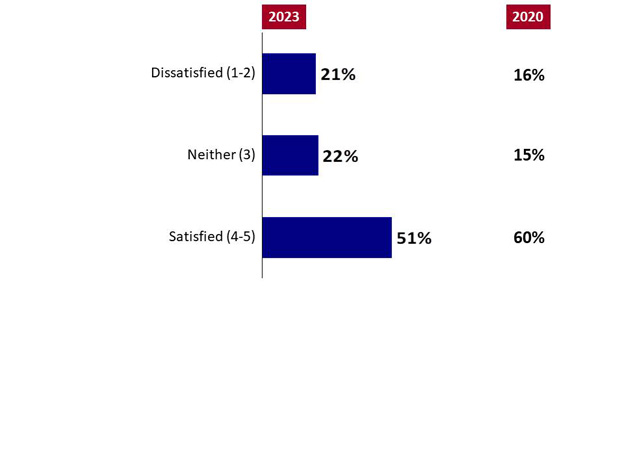
Half (51%) of responding nurses are satisfied with their ability to deliver quality care. This result is a decrease from 60% in 2020 and a further downward trend from 2006 when 69% of nurses were satisfied with their ability to deliver quality care.
Chart 9: Satisfaction with Quality of Care
Chart 9: Satisfaction with Quality of Care - Text Version
This chart of single bars shows the percentage of results for responses to three statements for 2023. On the side, one column shows the percentage of results for 2020.
Respondents were asked: "Please rate the extent to which you are satisfied or dissatisfied with each of the following aspects of your current workplace: Your ability to deliver quality care."
Respondents selected:
Dissatisfied (1-2): 21%; 2020: 16%
Neither (3): 22%; 2020: 15%
Satisfied (4-5): 51%; 2020: 60%
Base: n=340
QJS4. Please rate the extent to which you are satisfied or dissatisfied with each of the following aspects of your current workplace: Your ability to deliver quality care.
Base: n=340
Dissatisfaction with the ability to deliver quality care is higher among nurses currently working in clinical care (30% dissatisfied), at a nursing station or health center with treatment (31%), and those who are not full-time (36%), compared with other nurses in the sample.
Regionally, dissatisfaction is higher in Manitoba (34% dissatisfied). Those in Alberta (74%) and Saskatchewan (71%) are most satisfied.
Indigenous nurses are more likely to be satisfied with their ability to provide quality care (71%) than non-Indigenous nurses (46%).
Satisfaction with Job Support
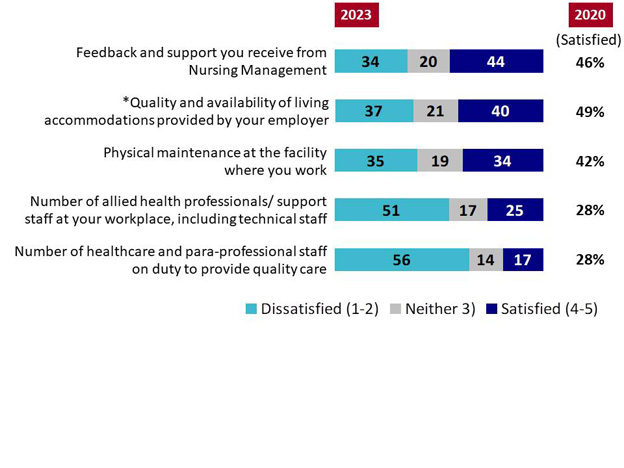
Satisfaction with various aspects of job support was measured. Fewer than half of the nurses responding to the survey are satisfied with the feedback and support they receive from nursing management (44%). One in three are satisfied with the physical maintenance at their work facility (34%), a decrease from 42% in 2020. Only one-quarter of nurses indicate they are satisfied with the number of allied health professionals or support staff at their workplace, including technical staff (25%). Fewer nurses are satisfied with the number of healthcare and paraprofessional staff on duty to provide quality care (17%, down from 28% in 2020), with a considerably large proportion dissatisfied (56%).
Among only nurses working in Nursing stations, two in five (40%) are satisfied with the quality and availability of living accommodations provided by their employer, a decrease from 49% in 2020.
Chart 10: Satisfaction with Job Support
Chart 10: Satisfaction with Job Support - Text Version
This stacked chart shows the percentage of results (2023) for responses to five statements across five categories: Dissatisfied, neither, and satisfied. On the side, one column shows the percentage of results (satisfied) for 2020.
Respondents were asked: "Please rate the extent to which you are satisfied or dissatisfied with each of the following aspects of your current workplace."
Respondents selected:
Feedback and support you receive from Nursing Management:
Category "Dissatisfied (1-2)": 34%
Category "Neither (3)": 20%
Category "Satisfied (4-5)": 44%; 2020: 46%
*Quality and availability of living accommodations provided by your employer:
Category "Dissatisfied (1-2)": 37%
Category "Neither (3)": 21%
Category "Satisfied (4-5)": 40%; 2020: 49%
Physical maintenance at the facility where you work:
Category "Dissatisfied (1-2)": 35%
Category "Neither (3)": 19%
Category "Satisfied (4-5)": 34%; 2020: 42%
Number of allied health professionals/ support staff at your workplace, including technical staff:
Category "Dissatisfied (1-2)": 51%
Category "Neither (3)": 17%
Category "Satisfied (4-5)": 25%; 2020: 28%
Number of healthcare and para-professional staff on duty to provide quality care:
Category "Dissatisfied (1-2)": 56%
Category "Neither (3)": 14%
Category "Satisfied (4-5)": 17%; 2020: 28%
Base: n=340 – * n=109
QJS5,7,8,12,13. Please rate the extent to which you are satisfied or dissatisfied with each of the following aspects of your current workplace.
Base: n=340 – * n=109
Consistent with other results, dissatisfaction rates are generally higher among nurses responding to the survey who currently work in clinical care, at a nursing station or health center with treatment, and are employed part-time or casual.
Among those working in nursing stations, those in Ontario (49%) express higher dissatisfaction with living accommodations than those in Manitoba (24%) or Alberta (20%).
Indigenous nurses are more likely to be satisfied with the physical maintenance at the facility where they work (51%), the number of allied health professionals and support staff at their workplace (36%), and the number of healthcare and para-professional staff on duty to provide quality care (34%) compared with non-Indigenous nurses.
Satisfaction with Level of Influence
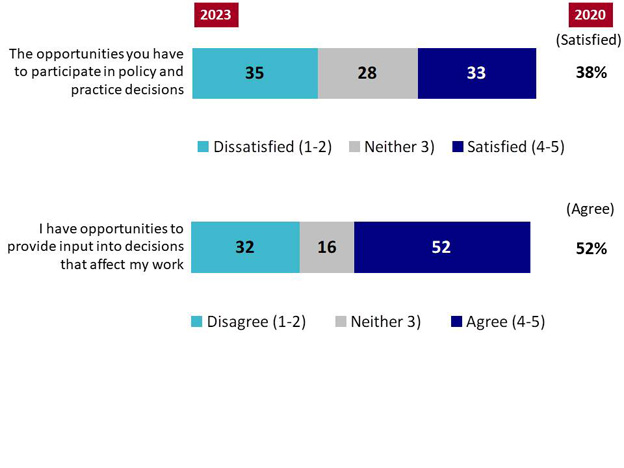
Over half (52%) of nurses participating in the survey agree they have opportunities to provide input into decisions affecting their work, although nearly one in three (32%) disagree.
Satisfaction with the opportunities to participate in policy and practice decisions is lower, with as many nurses indicating they are dissatisfied as satisfied. Satisfaction in this area decreased from 38% in 2020 to 33%. However, fewer nurses were satisfied in 2006 when 24% of nurses were satisfied, but 51% were dissatisfied.
Chart 11: Satisfaction with Level of Influence
Chart 11: Satisfaction with Level of Influence - Text Version
This stacked chart shows the percentage of results (2023) for responses to two statements. First statement is across three categories: dissatisfied, neither, and satisfied and the second statement is across three different categories: disagree, neither, and agree. One column on the side shows the percentage for responses for "satisfied" and "agree" for 2020.
Respondents were asked two questions: "Please rate the extent to which you are satisfied or dissatisfied with each of the following aspects of your current workplace." AND "Please indicate whether you agree or disagree with the following."
Respondents selected:
The opportunities you have to participate in policy and practice decisions:
Category "Dissatisfied (1-2)": 35%
Category "Neither (3)": 28%
Category "Satisfied (4-5)": 33%; 2020: 38%
I have opportunities to provide input into decisions that affect my work:
Category "Disagree (1-2)": 32%
Category "Neither (3)": 16%
Category "Agree (4-5)": 52%; 2020: 52%
Base: n=340
QJS9. Please rate the extent to which you are satisfied or dissatisfied with each of the following aspects of your current workplace.
QJS19. Please indicate whether you agree or disagree with the following.
Base: n=340
Responding nurses working as practice advisors or educators (59%), in management or leadership positions (55%), working in a regional, zone or branch office (58%), in the NCR (65%) or working full-time (48%) tend to be more satisfied with the opportunities to participate in policy and practice decisions. Those in clinical care (14%), at a nursing station or health center with treatment (18%) or working part-time or casual (11%) are least satisfied. Regionally, those in Manitoba are less satisfied (16%) than those in other regions.
This pattern is repeated for satisfaction with opportunities to provide input to decisions.
Satisfaction with Work-Life Balance
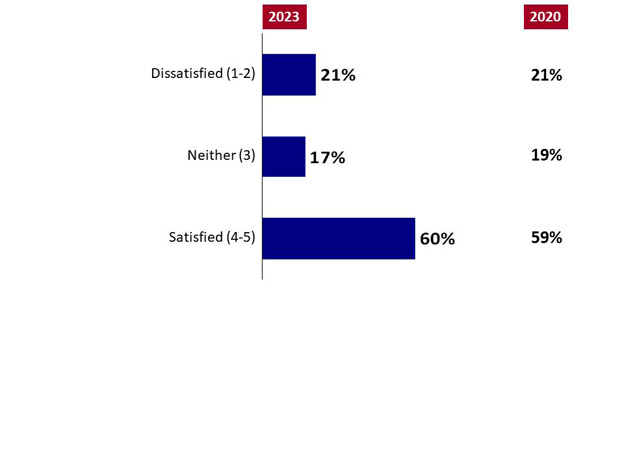
Six in ten (60%) nurses responding to the survey are satisfied with their family and work-life balance, while one in five are neutral (17%) or dissatisfied (21%). This is consistent with the 2020 results. By comparison, in 2006, 46% of nurses were satisfied with their family and work-life balance, and 38% were dissatisfied.
Chart 12: Satisfaction with Work-Life Balance
Chart 12: Satisfaction with Work-Life Balance - Text Version
This chart of single bars shows the percentage of results for responses to three statements for 2023. On the side, one column shows the percentage of results for 2020.
Respondents were asked: "Please rate the extent to which you are satisfied or dissatisfied with the following aspects of your current workplace: your family/work-life balance."
Respondents selected:
Dissatisfied (1-2): 21%; 2020: 21%
Neither (3): 17%; 2020: 19%
Satisfied (4-5): 60%; 2020: 59%
Base: n=340
QJS1. Please rate the extent to which you are satisfied or dissatisfied with the following aspects of your current workplace: your family/work-life balance.
Base: n=340
Responding nurses who are currently working in clinical care (27% dissatisfied), at a Nursing station or Health center with treatment (32% dissatisfied) or employed part-time or casual (26% dissatisfied) are less likely to be satisfied than other nurses in the survey.
Degree of Work-Related Stress
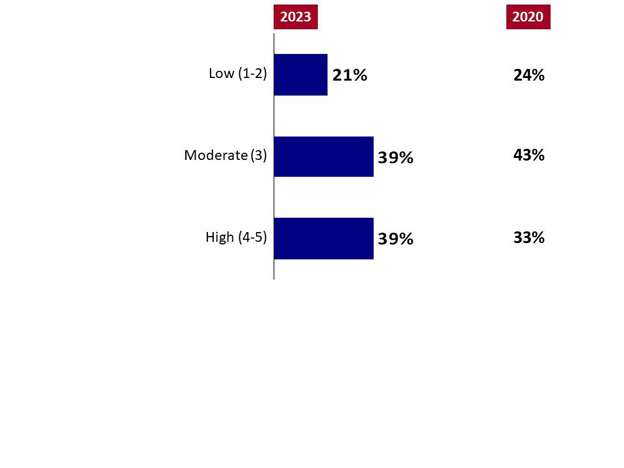
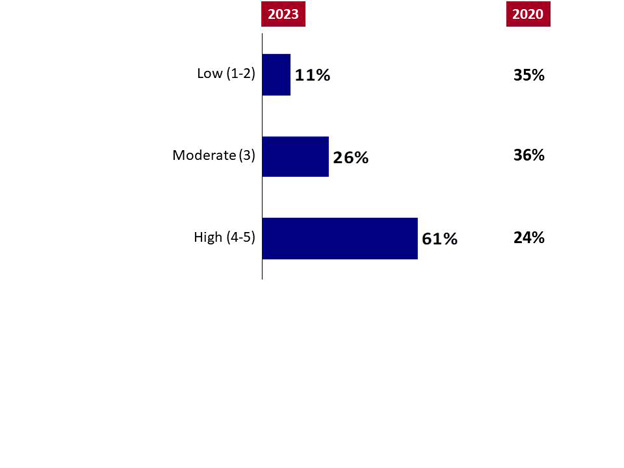
Nearly two in five (39%) nurses participating in the survey say they regularly have a high level of work-related stress. This is an increase from 33% in 2020. An equal proportion (39%) report a moderate stress level, while one in five (21%) say their stress level is low.
Chart 13: Degree of Work-Related Stress
Chart 13: Degree of Work-Related Stress - Text Version
This chart of single bars shows the percentage of results for responses to three statements for 2023. On the side, one column shows the percentage of results for 2020.
Respondents were asked: "All things considered, how would you rate your level of regular work-related stress?"
Respondents selected:
Low (1-2): 21%; 2020: 24%
Moderate (3): 39%; 2020: 43%
High (4-5): 39%; 2020: 33%
Base: n=340
QST2. All things considered, how would you rate your level of regular work-related stress?
Base: n=340
Nurses responding to the survey who are working in clinical care (47% high stress), at a nursing station or health center with treatment (47%) or are employed part-time or casual (50%) are more likely than other nurses to rate their stress high.
Additionally, nurses in Manitoba (55%) are more likely than nurses in any other region to say they regularly have high stress.
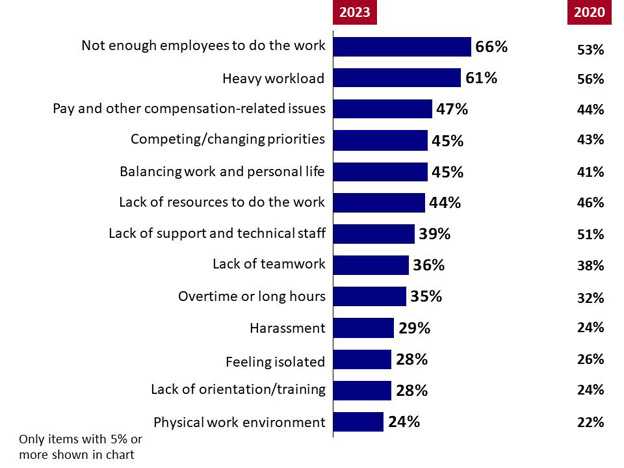
Sources of Stress
All nurses responding to the survey were asked to indicate sources of their workplace stress. The top sources identified are not enough employees to do the work (66%, an increase from 53% in 2020), and heavy workload (61%, up from 56% in 2020). Just less than half cite pay and other compensation issues (47%), competing or changing priorities (45%), or lack of resources to do the work (44%). Roughly one in three identify a lack of support and technical staff (39%, a decrease from 51% in 2020), lack of teamwork (36%), or overtime or long hours (35%) as a source of stress. About one in four report harassment (29%), feeling isolated (28%), lack of orientation and training (28%) or the physical work environment (24%) as sources of stress on a regular basis.
Chart 14: Sources of Stress
Chart 14: Sources of Stress - Text Version
This chart of single bars shows the percentage of results for responses to thirteen statements for 2023. On the side, one column shows the percentage of results for 2020.
Respondents were asked: "Which of the following factors, if any, causes you stress on a regular basis at work?"
Respondents selected:
Not enough employees to do the work: 66%; 2020: 53%
Heavy workload: 61%; 2020: 56%
Pay and other compensation-related issues: 47%; 2020: 44%
Competing/changing priorities: 45%; 2020: 43%
Balancing work and personal life: 45%; 2020: 41%
Lack of resources to do the work: 44%; 2020: 46%
Lack of support and technical staff: 39%; 2020: 51%
Lack of teamwork: 36%; 2020: 38%
Overtime or long hours: 35%; 2020: 32%
Harassment: 29%; 2020: 24%
Feeling isolated: 28%; 2020: 26%
Lack of orientation/training: 28%; 2020: 24%
Physical work environment: 24%; 2020: 22%
Only items with 5% or more shown in chart.
Base: n=340
QST1. Which of the following factors, if any, cause you stress on a regular basis at work?
Base: n=340
Responding nurses who work in clinical care, at a nursing station or health center with treatment, along with those who are part-time or casual, are more likely than other nurses to cite most of the listed factors as sources of stress.
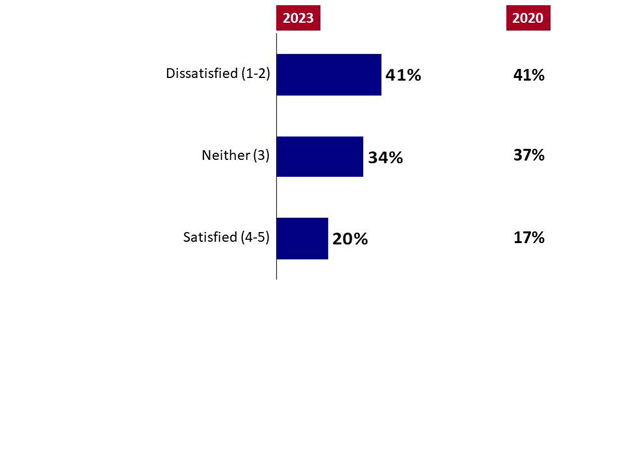
Satisfaction with Stress Relief Efforts
Only one in four nurses responding to the survey (20%) say they are satisfied with the quality and availability of resources to help relieve stress at their workplace. More than double the number (41%) rate themselves as dissatisfied, and one in three are neutral (34%). Results are relatively consistent with the 2020 survey.
Chart 15: Satisfaction with Stress Relief Efforts
Chart 15: Satisfaction with Stress Relief Efforts - Text Version
This chart of single bars shows the percentage of results for responses to three statements for 2023. On the side, one column shows the percentage of results for 2020.
Respondents were asked: "How satisfied are you with the quality and availability of resources to help relieve stress at your workplace?"
Respondents selected:
Dissatisfied (1-2): 41%; 2020: 41%
Neither (3): 34%; 2020: 37%
Satisfied (4-5): 20%; 2020: 17%
Base: n=340
QST3. How satisfied are you with the quality and availability of resources to help relieve stress at your workplace?
Base: n=340
More than half of participating nurses who are currently working in clinical care (51% dissatisfied), work at a nursing station or health center with treatment (53%), or are part-time or casual (55%) are dissatisfied.
Regionally, those in Manitoba are more likely to be dissatisfied (53%) than those in other regions.
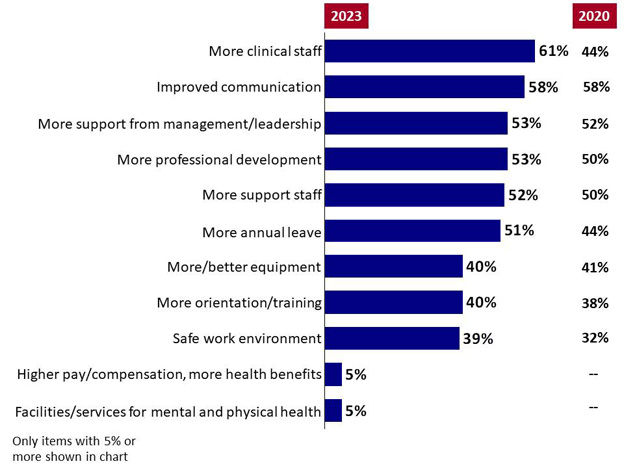
Suggested Areas for Stress Relief Efforts
Nurses responding to the survey often point to increasing the number of clinical staff as the most useful effort to relieve stress (61%, an increase from 44% in 2020), along with improved communication (58%). About half also report support needed from management or leadership (53%), professional development (53%), more support staff (52%), or more annual leave (51%, an increase from 44% in 2020) would help to relieve stress. Two in five suggest more or better equipment (40%), more orientation or training (40%), or a safe work environment (39%). Other suggestions to relieve stress were described verbatim in comments and were related to higher pay, more health benefits (5%) or facilities or services for mental and physical health (5%).
Chart 16: Suggested Areas for Stress Relief Efforts
Chart 16: Suggested Areas for Stress Relief Efforts - Text Version
This chart of single bars shows the percentage of results for responses to eleven statements for 2023. On the side, one column shows the percentage of results for 2020.
Respondents were asked: "Which of the following would be useful to you in helping to relieve stress?"
Respondents selected:
More clinical staff: 61%; 2020: 44%
Improved communication: 58%; 2020: 58%
More support from management/leadership: 53%; 2020: 52%
More professional development: 53%; 2020: 50%
More support staff: 52%; 2020: 50%
More annual leave: 51%; 2020: 44%
More/better equipment: 40%; 2020: 41%
More orientation/training: 40%; 2020: 38%
Safe work environment: 39%; 2020: 32%
Higher pay/compensation, more health benefits: 5%
Facilities/services for mental and physical health: 5%
Only items with 5% or more shown in chart.
Base: n=340
QST4. Which of the following would be useful to you in helping to relieve stress?
Base: n=340
Responding nurses who are currently working in clinical care, work at a nursing station or health center with treatment, or are part-time or casual are more likely than others to suggest most supports to relieve stress.
Regionally, nurses in Manitoba are more likely to suggest the most support than those in any other region.
Indigenous nurses are apt to indicate they would like more orientation/training to relieve stress (55%) compared with non-Indigenous nurses (36%).
Satisfaction with Training and Orientation
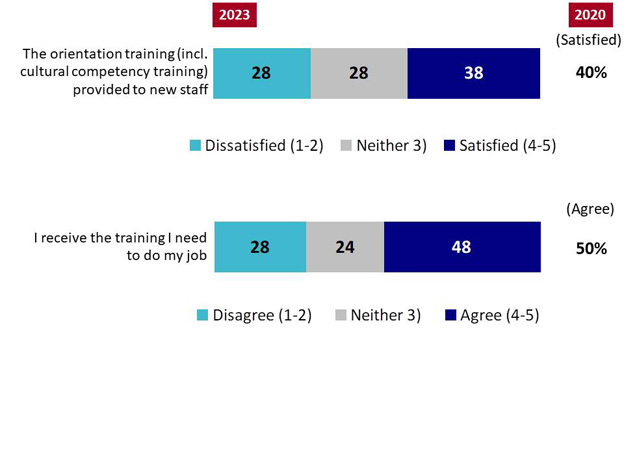
Almost half (48%) of nurses responding to the survey agree they receive the training they need to do their job, although 28% disagree. Even fewer (38%) nurses are satisfied with the orientation training they receive, including cultural competency training provided to new staff. Satisfaction with training and orientation is relatively similar to 2020 results.
Chart 17: Satisfaction with Training and Orientation
Chart 17: Satisfaction with Training and Orientation - Text Version
This stacked chart shows the percentage of results (2023) for responses to two statements. First statement is across three categories: dissatisfied, neither, and satisfied and the second statement is across three different categories: disagree, neither, and agree. One column on the side shows the percentage for responses for "satisfied" and "agree" for 2020.
Respondents were asked: two questions "Please rate the extent to which you are satisfied or dissatisfied with each of the following aspects of your current workplace." AND "Please indicate whether you agree or disagree with the following."
Respondents selected:
The orientation training (incl. cultural competency training) provided to new staff:
Category "Dissatisfied (1-2)": 28%
Category "Neither (3)": 28%
Category "Satisfied (4-5)": 38%; 2020: 40%
I receive the training I need to do my job:
Category "Disagree (1-2)": 28%
Category "Neither (3)": 24%
Category "Agree (4-5)": 48%; 2020: 50%
Base: n=340
QJS11. Please rate the extent to which you are satisfied or dissatisfied with each of the following aspects of your current workplace.
QJS20: Please indicate whether you agree or disagree with the following.
Base: n=340
Nurses in Atlantic Canada (54%) and Ontario (50%) are more likely to be satisfied with their orientation training than those in other regions.
Those in Manitoba expressed the lowest satisfaction (38%) of any region in receiving the training needed to do their job.
Indigenous nurses are less satisfied with the orientation training provided to new staff (25%) than non-Indigenous nurses (41%).
Satisfaction with Professional Development
Just over half (51%) of nurses are satisfied with the current opportunities for professional development or continuing education, and 25% are dissatisfied. This remains slightly higher, however than in 2006, when 48% of nurses were satisfied and 38% were dissatisfied.
Chart 18: Satisfaction with Professional Development
Chart 18: Satisfaction with Professional Development - Text Version
This chart of single bars shows the percentage of results for responses to three statements for 2023. On the side, one column shows the percentage of results for 2020.
Respondents were asked: "Please rate the extent to which you are satisfied or dissatisfied with each of the following aspects of your current workplace: Your current opportunities for professional development/continuing education."
Respondents selected:
Dissatisfied (1-2): 25%; 2020: 26%
Neither (3): 21%; 2020: 20%
Satisfied (4-5): 51%; 2020: 54%
Base: n=340
QJS2. Please rate the extent to which you are satisfied or dissatisfied with each of the following aspects of your current workplace: Your current opportunities for professional development/continuing education.
Base: n=340
Women (54%) are more likely than men (40%) to be satisfied with professional development.
Responding non-Indigenous nurses (56%) are more likely to be satisfied with professional development than Indigenous nurses (39%).
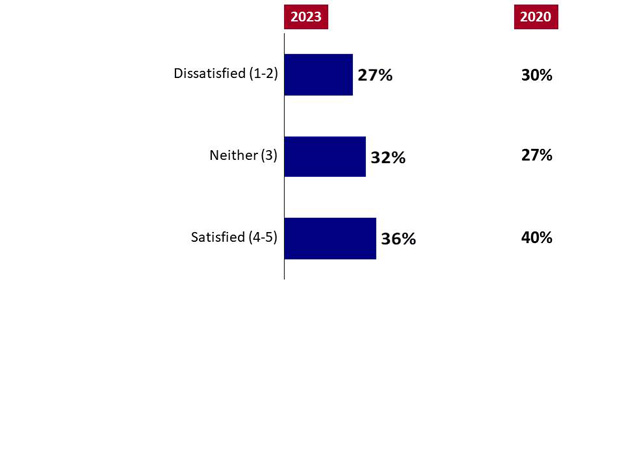
Satisfaction with Leadership Development
Nearly four in ten (36%) are satisfied with the current opportunities for nursing leadership development, although 27% are dissatisfied. In 2020 and 2006, a similar proportion (40%) also reported satisfaction.
Chart 19: Satisfaction with Leadership Development
Chart 19: Satisfaction with Leadership Development - Text Version
This chart of single bars shows the percentage of results for responses to three statements for 2023. On the side, one column shows the percentage of results for 2020.
Respondents were asked: "Please rate the extent to which you are satisfied or dissatisfied with each of the following aspects of your current workplace: Your current opportunities for nursing leadership development."
Respondents selected:
Dissatisfied (1-2): 27%; 2020: 30%
Neither (3): 32%; 2020: 27%
Satisfied (4-5): 36%; 2020: 40%
Base: n=340
QJS3. Please rate the extent to which you are satisfied or dissatisfied with each of the following aspects of your current workplace: Your current opportunities for nursing leadership development.
Base: n=340
Nurses who are in management or leadership (60%); work in a regional, zone or branch office (44%); or are employed full-time (42%) are more likely to be satisfied.
Indigenous nurses are less satisfied with their current opportunities for nursing leadership development (26% satisfied) than non-Indigenous nurses (39%).
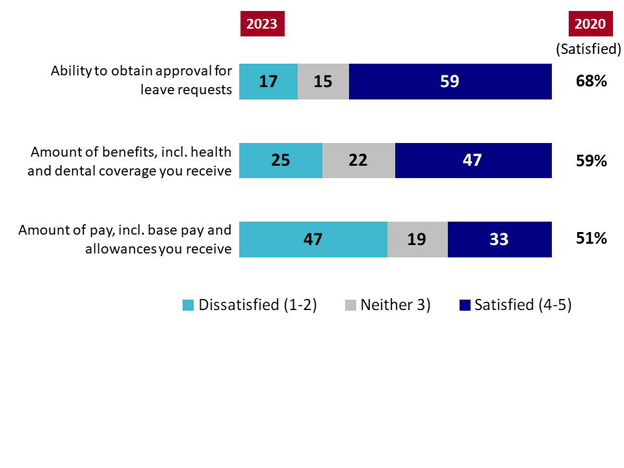
Satisfaction with Pay and Benefits
Three in five (59%, a decrease from 68% in 2020) responding nurses are satisfied with their ability to obtain approval for leave requests in their current workplace. Nearly six in ten (47%, down from 59% in 2020) are satisfied with the benefits, including health and dental coverage they receive. One in three (33%, a notable decrease from 51% in 2020) of the nurses responding to the survey indicated they are satisfied with the amount of pay, including base pay and allowances, and a higher proportion, 47%, are dissatisfied.
In 2006, 72% were satisfied with the amount of pay they received[1]. In 2006, 70% were satisfied with the benefits they received[2].
Chart 20: Satisfaction with Pay and Benefits
Chart 20: Satisfaction with Pay and Benefits - Text Version
This stacked chart shows the percentage of results (2023) for responses to three statements across three categories: dissatisfied, neither, and satisfied. On the side, one column shows the percentage of results (satisfied) for 2020.
Respondents were asked: "Please rate the extent to which you are satisfied or dissatisfied with each of the following aspects of your current workplace."
Respondents selected:
Ability to obtain approval for leave requests:
Category "Dissatisfied (1-2)": 17%
Category "Neither (3)": 15%
Category "Satisfied (4-5)": 59%; 2020: 68%
Amount of benefits, incl. health and dental coverage you receive:
Category "Dissatisfied (1-2)": 25%
Category "Neither (3)": 22%
Category "Satisfied (4-5)": 47%; 2020: 59%
Amount of pay, incl. base pay and allowances you receive:
Category "Dissatisfied (1-2)": 47%
Category "Neither (3)": 19%
Category "Satisfied (4-5)": 33%; 2020: 51%
Base: n=340
QJS14,15,16. Please rate the extent to which you are satisfied or dissatisfied with each of the following aspects of your current workplace.
Base: n=340
Responding nurses who are practice advisors/educators; in management or leadership; work in a regional, zone or branch office; or are employed full-time are more likely to be satisfied with both the benefits and ability to receive leave requests. Nurses currently working in clinical care (56% dissatisfied), at a nursing station or health center with treatment (57%), or who are part-time or casual (58%) express the highest dissatisfaction with the amount of pay they receive.
Nurses in Saskatchewan are least satisfied (33%) with their ability to obtain approval for leave requests.
Indigenous nurses report higher satisfaction with the benefits, including health and dental coverage, they receive (60%) compared with non-Indigenous respondents (45%).
Payroll Issues
Nearly two in three (64%) nurses participating in the survey have experienced pay or other compensation issues within the past three years, a decrease from 70% in 2020. The types of issues reported by this 64% include errors in processing pay information (53%), being underpaid (47%, a decrease from 60% in 2020), missing regular payments (34%, down from 42% in 2020), being overpaid (33%), or errors related to a change in position or department (32%). Over one in ten experienced errors in leave credits (18%), missing or long delays in receiving funds (11%) or complex pay (10%).
The compensation issues have been resolved for only 30% of nurses reporting payroll issues. The issue is unresolved for 28%, and another 41% are unsure or indicate it is in progress. Half (51%, down from 64% in 2020) are dissatisfied with the support they received to resolve the compensation issues.
Table 3: Degree and Nature of Payroll Issues Experienced
Response
Total 2023
Total 2020
QPS1. Have you experienced any pay or other compensation issues within the past three years?
n=340
n=322
Yes
64%
70%
No
30%
23%
Unsure, it depends
6%
7%
QPS2. What type of issues have you experienced?
n=340
n=247
Errors in processing pay information
53%
51%
Underpaid
47%
60%
Missing regular payment
34%
42%
Overpaid
33%
31%
Errors related to change in position/department
32%
33%
Errors in leave credits
18%
18%
Missing/extremely long delays receiving reimbursements/allowances
11%
--
Complex/lack of transparency of pay
10%
--
Missing/extremely long delays in receiving over time payment
9%
--
Extremely long delays to receive payment, takes months to resolve issues (general)
6%
--
Errors in pension deductions
6
10%
Lack of access/ transparency (pay stub information)
--
8%
Late payments, long waits for compensation
--
6%
Other
5%
4%
No response
3%
5%
QPS3. Have these issues been resolved?
n=340
n=247
Yes
30%
30%
No
28%
36%
Unsure, in progress
41%
33%
QPS4. How satisfied are you with the support you have received in trying to resolve these issues?
n=340
n=247
Dissatisfied (1-2)
52%
64%
Neither (3)
28%
22%
Satisfied (4-5)
16%
11%
Not applicable
2%
3%
Don't know/ No response
3%
1%
Responding nurses who are currently working in clinical care (70%), work at a Nursing station or Health center with treatment (73%), or are part-time or casual (77%) are more likely than others to say they experienced compensation issues.
Those in Ontario (74%) are more likely to say they have experienced pay or compensation issues than those in other regions.
Those working in clinical care are more likely to say the errors are in processing pay information (60%) than those with other areas of responsibility (38%-50%).
Nurses with an MN or greater are apt to have been underpaid (62%) or missed a regular payment (50%) than those with other nursing education levels.
E. Adequacy of Communications
Adequacy of Communications
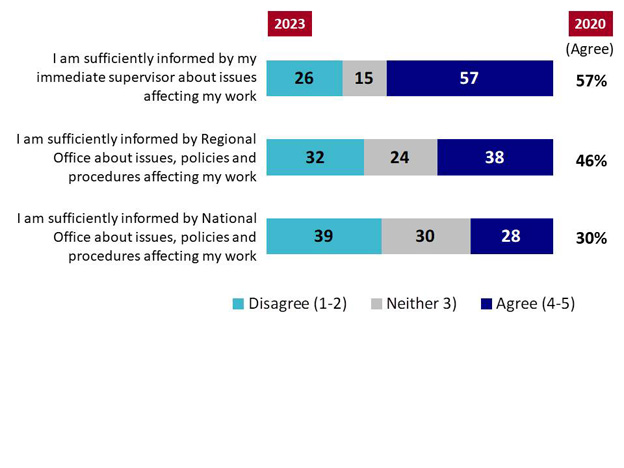
Satisfaction with communication decreases with the distance from the source. Just over half of nurses (57%) participating in the survey agree their immediate supervisors sufficiently inform them about issues affecting their work, although 26% disagree. Fewer feel adequately informed by policy or procedural information coming from the Regional Office, with a decrease in agreement from 46% in 2020 to 38%. Regarding information from the National Office, slightly more than one in four respondents agree they are informed (28%), and a higher proportion disagrees (39%).
Chart 21: Adequacy of Communications
Chart 21: Adequacy of Communications - Text Version
This stacked chart shows the percentage of results (2023) for responses to three statements across three categories: disagree, neither, and agree. On the side, one column shows the percentage of results (agree) for 2020.
Respondents were asked: "Please indicate whether you agree or disagree with the following."
Respondents selected:
I am sufficiently informed by my immediate supervisor about issues affecting my work:
Category "Disagree (1-2)": 26%
Category "Neither (3)": 15%
Category "Agree (4-5)": 57%; 2020: 57%
I am sufficiently informed by Regional Office about issues, policies and procedures affecting my work:
Category "Disagree (1-2)": 32%
Category "Neither (3)": 24%
Category "Agree (4-5)": 38%; 2020: 46%
I am sufficiently informed by National Office about issues, policies and procedures affecting my work:
Category "Disagree (1-2)": 39%
Category "Neither (3)": 30%
Category "Agree (4-5)": 28%; 2020: 30%
Base: n=340
QJS21,22,23. Please indicate whether you agree or disagree with the following.
Base: n=340
Responding nurses who are currently working in clinical care (35% disagree), work at a nursing station or health center with treatment (33%), or are part-time or casual (34%) are more likely to disagree that their immediate supervisor sufficiently informs them.
Barriers to Communicating At Work
Nearly three in four participating nurses (71%) report using a work email as their primary communication method, a notable increase from 57% in 2020. One in five (18%) say they use personal email, an observed decline from 24% in 2020. Most nurses (80%, an increase from 69%) responding to the survey agree the tool they currently use is their preferred method to receive policy updates and announcements from their employer.
Of the 9% indicating they would prefer to communicate through an alternative method, these methods primarily include personal e-mail (37%), work e-mail (36%), or a work phone (17%).
Table 4: Methods of Communicating About Work-Related Issues
Response
Total 2023
Total 2020
QCM1. What is the primary method you use to communicate with your workplace?
n=340
n=322
Work e-mail
71%
57%
Personal e-mail
18%
24%
Work phone
4%
9%
Personal phone
3%
6%
MS Teams
1%
--
Other method
3%
4%
QCM2. Is this your preferred method of communication with your employer regarding new / changes in policies, events/announcements?
n=340
n=322
Yes
80%
69%
No
9%
20%
Unsure, it depends
11%
11%
QCM3. How would you prefer to communicate with your workplace to obtain information?
n=31
n=59
Personal e-mail
37%
--
Work e-mail
36%
47%
Work phone
17%
--
In person, face to face/meetings
6%
20%
Other method
4%
27%
No response
0%
6%
Those working as practice advisors or educators (90%), in management or leadership positions (87%), working in a regional, zone or branch office (93%) or working full-time (85%) are more likely to say their primary method to communicate with their workplace is work e-mail.
Responding nurses who are currently working in clinical care (33%), work at a nursing station or health center with treatment (33%), or are part-time or casual (41%) are more likely to use personal e-mail as their primary method.
F. Issues Related to Information Management and Technology
Degree of Issues with IM/IT
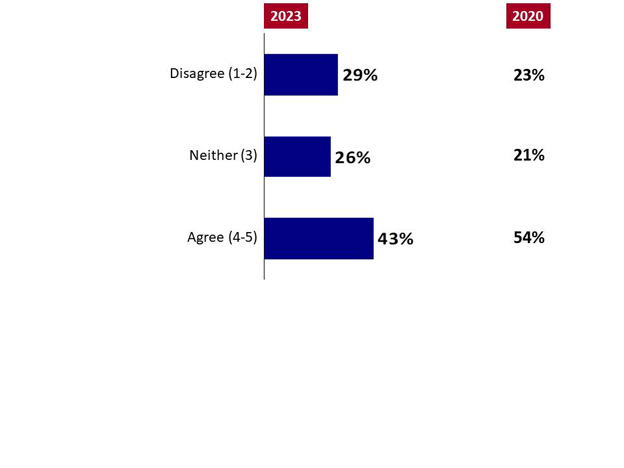
Over two in five (43%) responding to the survey agree their quality of work suffers due to a lack of access to technology. This level of agreement has decreased from 54% in 2020. Over one in four provided either a neutral rating (26%) or said the quality of their work does not suffer due to lack of access (29%).
Chart 22: Degree of Issues with IM/IT
Chart 22: Degree of Issues with IM/IT - Text Version
This chart of single bars shows the percentage of results for responses to three statements for 2023. On the side, one column shows the percentage of results for 2020.
Respondents were asked: "Please indicate whether you agree or disagree with the following: The quality of my work suffers because of lack of access to technology."
Respondents selected:
Disagree (1-2): 29%; 2020: 23%
Neither (3): 26%; 2020: 21%
Agree (4-5): 43%; 2020: 54%
Base: n=340
QJS24. Please indicate whether you agree or disagree with the following: The quality of my work suffers because of lack of access to technology.
Base: n=340
Responding nurses who are currently working in clinical care (54%), work at a Nursing station or Health center with treatment (56%), or are part-time or casual (55%) are more likely to agree with this statement.
Satisfaction with IM/IT Service and Support
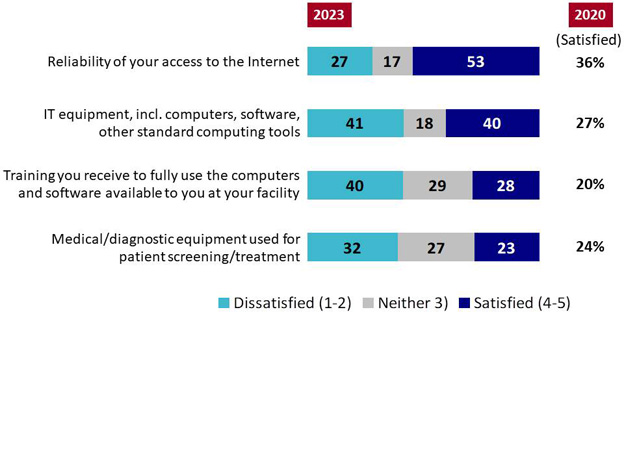
Participating nurses rated their satisfaction with various aspects of existing IT services and support at their workplace. Overall, satisfaction has increased since 2020 for three out of the four aspects. Over half (53%) of nurses responding to the survey say they are content with the reliability of their internet access, an increase from 36% in 2020. Two in five are satisfied with their IT equipment, such as computers or software (40%, an increase from 27%); however, a similar proportion remains dissatisfied. Only about one in four are satisfied with the training they receive to use these tools (28%, an increase from 20% in 2020) and the medical diagnostic equipment used for patient screening and treatment (23%, essentially unchanged from 24% in 2020).
Chart 23: Satisfaction with IM/IT Service and Support
Chart 23: Satisfaction with IM/IT Service and Support - Text Version
This stacked chart shows the percentage of results (2023) for responses to four statements across three categories: dissatisfied, neither, and satisfied. On the side, one column shows the percentage of results (satisfied) for 2020.
Respondents were asked: "Please rate the extent to which you are satisfied or dissatisfied with each of the following aspects of IT at your work."
Respondents selected:
Reliability of your access to the Internet:
Category "Dissatisfied (1-2)": 27%
Category "Neither (3)": 17%
Category "Satisfied (4-5)": 53%; 2020: 36%
IT equipment, incl. computers, software, other standard computing tools:
Category "Dissatisfied (1-2)": 41%
Category "Neither (3)": 18%
Category "Satisfied (4-5)": 40%; 2020: 27%
Training you receive to fully use the computers and software available to you at your facility:
Category "Dissatisfied (1-2)": 40%
Category "Neither (3)": 29%
Category "Satisfied (4-5)": 28%; 2020: 20%
Medical/diagnostic equipment used for patient screening/treatment:
Category "Dissatisfied (1-2)": 32%
Category "Neither (3)": 27%
Category "Satisfied (4-5)": 23%; 2020: 24%
Base: n=340
QIT1,2,3,4. Please rate the extent to which you are satisfied or dissatisfied with each of the following aspects of IT at your work.
Base: n=340
Dissatisfaction with IT equipment is highest among participating nurses employed at a nursing station or health center with treatment (51%), among those working in clinical care (53%), and those employed part-time or casual (52%). Dissatisfaction with internet reliability is also highest among these segments (34% to 38% dissatisfied).
Conversely, satisfaction with IT equipment is comparatively greater among participating nurses working in regional, zone or branch offices (46%), in management (45%) or practice advisory roles (41%), along with full-time employees (37%). Satisfaction with internet reliability also follows a similar pattern (55% to 61%).
Regionally, those in Atlantic Canada (85% satisfied) and Saskatchewan (68%) are more likely to be satisfied with IT equipment than those in other regions. Satisfaction with the reliability of internet access is lowest in Ontario (38% dissatisfied). Nurses in Manitoba are more likely to be dissatisfied with their training (56% dissatisfied) than those in any other region.
Ease of Access to IM/IT Support
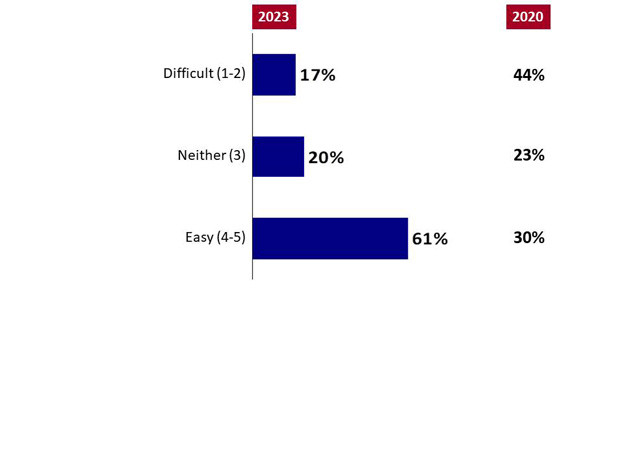
More than three in five (61%) nurses responding to the survey say it is easy to submit a request for IT support at their workplace. This represents a two-fold increase from 2020, when 30% said it was easy.
Chart 24: Ease of Access to IM/IT Support
Chart 24: Ease of Access to IM/IT Support - Text Version
This chart of single bars shows the percentage of results for responses to three statements for 2023. On the side, one column shows the percentage of results for 2020.
Respondents were asked: "How easy or difficult is the process for submitting a request for IT support in your workplace?"
Respondents selected:
Difficult (1-2): 17%; 2020: 44%
Neither (3): 20%; 2020: 23%
Easy (4-5): 61%; 2020: 30%
Base: n=340
QIT5. How easy or difficult is the process for submitting a request for IT support in your workplace?
Base: n=340
Those working as practice advisors or educators (72%), in management or leadership positions (72%), working in a regional, zone or branch office (70%) or working full time (67%) are more likely to say it is easy.
Responsiveness of IM/IT Support Services
Regarding the responsiveness of IT staff when addressing a submitted request, three in five (61%) nurses responding to the survey described it as high. This suggests a vast improvement from 2020, when only 24% said IT support staff was highly responsive.
Chart 25: Responsiveness of IM/IT Support Services
Chart 25: Responsiveness of IM/IT Support Services - Text Version
This chart of single bars shows the percentage of results for responses to three statements for 2023. On the side, one column shows the percentage of results for 2020.
Respondents were asked: "How responsive is IT support staff once you have submitted a request?"
Respondents selected:
Low (1-2): 11%; 2020: 35%
Moderate (3): 26%; 2020: 36%
High (4-5): 61%; 2020: 24%
Base: n=340
QIT6. How responsive is IT support staff once you have submitted a request?
Base: n=340
Responsiveness of IT staff does not vary significantly by subgroup.
G. Issues Related to Safety and Security
Nurses had the opportunity to identify multiple safety and security concerns that have had a negative impact on their sense of personal safety at the workplace. Results highlight that over half of nurses responding to the survey are negatively impacted by insufficient staff (55%, an increase from 46% in 2020). Slightly fewer feel that the level or quality of staff (46%) or physical work environment (41%) has an adverse impact. One in three (32%) say they have received verbal threats from patients or their family members, and nearly one in five (18%) have encountered physical threats from patients or their family members. A similar proportion (17%) voiced concern over the location of their facility within the community. One in ten (10%) report verbal threats from other staff members. One in five (21%) report no security concerns.
Table 5: Nature of Safety & Security Concerns
Response
Total 2023
Total 2020
QSS1. Which of the following, if any, have had an adverse impact on your sense of personal safety and security at work?
n=340
n=322
Not enough staff
55%
46%
The level or quality of staff
46%
41%
The physical work environment
41%
47%
Verbal threats from patients/family members
32%
30%
Physical threats from patients/family members
18%
16%
The location of the facility in the community
17%
15%
Verbal threats from other staff
10%
9%
Security staff do not show up for shifts/leave during their shifts
4%
--
Physical threats from other staff
3%
4%
Bullying/intimidation/harassment/discrimination/micro aggressions by staff/management
3%
--
Lack of maintenance/upkeep of facilities
2%
--
Lack of support from management/regional office
2%
--
Travel issues
2%
--
Security issues with nursing residences
2%
--
Security does not address concerns/disregard complaints, no one accountable
1%
--
Slow/no response from police
1%
--
Wild dogs/animals
1%
--
Parking lots are dangerous
1%
--
They were physically assaulted, not only threatened
1%
--
Location hazards (e.g., distance to parking, outside lighting)
--
6%
More effective response from management
--
4%
Other safety/security concerns
1%
1%
No safety and security issues
21%
8%
Don't know/No response
6%
17%
Responding nurses who are currently working in clinical care, work at a nursing station or health center with treatment, or are part-time or casual are more likely to say most factors have had an adverse impact on their sense of personal safety and security at work.
Nurses in Manitoba are more likely than those in other regions to say most of the main factors have had an adverse impact.
Fewer nurses say they have participated in Nursing Safety Awareness Training (NSAT) in 2023 (53%), compared with 2020 (72%) and 2006 (62%). In terms of the degree of the positive contribution this has made to their sense of safety and security at work, however, results are varied. One in five responding nurses who took the training described the impact as positive (20%, compared with 29% in 2020), and a higher proportion describes there being little (29%) or moderate (39%) impact.
Table 6: Participation in & Impact of NSAT
Response
Total 2023
Total 2020
QSS2. Have you participated in Nursing Safety and Awareness Training (NSAT)?
n=340
n=322
Yes
53%
72%
No
33%
24%
Do not recall / No response
14%
5%
QSS3. Do you feel that this has made a positive contribution to your personal safety and security at work?
n=340
n=230
Low (1-2)
29%
29%
Moderate (3)
39%
36%
High (4-5)
20%
29%
Don't know/ No response
12%
6%
Participating nurses working full-time (60%) are more likely to say they participated in NSAT training than those who work part-time or casual (43%).
Regionally, nurses in Saskatchewan (93%) are much more likely to say they participated in training than those in other regions; those in Ontario are least likely to say they have participated (37%).
Nurses aged 51-60 (63%) and 61 and over (78%) are more likely to say they have participated in NSAT training than their younger counterparts. Only 10% of those aged 30 or younger have participated.
Indigenous nurses are more likely to have participated in NSAT (63%) than non-Indigenous respondents (50%).
Responding nurses who are currently working in clinical care (38% low), work at a nursing station or health centre with treatment (38%), or are part-time or casual (42%) are more likely to feel the training has had a low positive impact.
Awareness of Occupational and Critical Incident Stress Management (OCISM) resources available at their workplace is high (81%, although a decrease from 91% in 2020) among nurses responding to the survey. A new question in 2023, nearly half (46%) of nurses indicate they have participated in OCISM training. Of those who participated, just over one in four (28%) say their work environment allows them to practice the skills obtained from the OCISM training. One in five (19%) indicate that access to OCISM services has increased their intention to stay.
Table 7: Participation in & Satisfaction with OCISM
Response
Total 2023
Total 2020
QSS4. Are you aware of Occupational and Critical Incident Stress Management (OCISM) resources at your place of work?
n=340
n=322
Yes
81%
91%
No
10%
7%
Do not recall / No response
9%
2%
QSS2B. Have you participated in Occupational and Critical Incident Stress Management (OCISM) training, like resilience training?
n=340
n=322
Yes
46%
--
No
41%
--
Do not recall / No response
13%
--
QSS3B. To what extent do you feel your work environment allows you to practice the skills you obtained in your OCISM training?
n=159
n=322
Low (1-2)
17%
--
Somewhat (3)
46%
--
High (4-5)
28%
--
Don't know/ No response
10%
--
QSS6. Has access to OCISM services ever increased your intention to stay?
n=340
n=322
Yes
19%
--
No
56%
--
Not sure
25%
--
Those in management or leadership positions (67%) are more likely than others to say they have participated in OCISM training.
Three in four (75%) nurses responding to the survey said they are aware of the Nursing Services Response Centre (NSRC) and its services to ISC Nurses. Of these, nearly three in four (72%) said they had used the services of the NSRC in the last year. Satisfaction with the NSRC is relatively high, with 84% of those who have used the services indicating satisfaction; only 4% are dissatisfied. Nine in ten (90%) would recommend the services of the NSRC to colleagues.
Table 8: Participation in & Satisfaction with NSRC
Response
Total 2023
QSS7. Are you aware of the Nursing Services Response Centre (NSRC) and its services to ISC Nurses?
n=340
Yes
75%
No
17%
Not sure
8%
QSS8. Have you used the services of the NSRC in the last year?
n=254
Yes
72%
No
27%
Not sure
2%
QSS9. How satisfied are you with the services you received from the NSRC?
n=179
Dissatisfied (1-2)
4%
Neither (3)
11%
Satisfied (4-5)
84%
QS108. Would you recommend the services of the NSRC to your colleagues?
n=179
Yes
90%
No
5%
Not sure
5%
Indigenous nurses are less likely to be aware of the NSRC (66%) or satisfied with the services received from the NSRC (78%) compared to non-Indigenous nurses (78% and 89%, respectively).
H. Awareness of trc Calls to Action
Two in three nurses responding to the survey (66%) have been informed by their employer about the TRC Calls to Action. The remainder have either not been informed (14%) or are unsure (20%). In terms of the result of any positive changes to their workplace, fewer than one in five (17%) report a high impact, one-third (30%) report a moderate impact, and less than one-quarter (23%) describe the impact as low.
Table 9: Awareness of TRC Calls to Action
Response
Total 2023
Total 2020
QCM5. Have you been informed by your employer about the Truth and Reconciliation (TRC) Calls to Action?
n=340
n=322
Yes
66%
60%
No
14%
19%
Unsure/Do not recall
20%
21%
QCM6. Have you experienced any changes in your workplace as a result of the Truth and Reconciliation (TRC) Calls to Action?
n=340
n=203
Low (1-2)
23%
27%
Moderate (3)
30%
37%
High (4-5)
17%
15%
Don't know/ No response
30%
21%
Responding nurses working in management or leadership roles (82%), those in regional, zone or branch offices (81%), along with those working full-time (73%), are more likely to report having been informed about the TRC Calls to Action.
Regionally, those in Manitoba are least likely to have been informed of this initiative (47%).
Indigenous nurses are less likely to say their employer informed them about the TRC Calls to Action (51%) than non-Indigenous nurses (69%).
Nurses working as practice advisors or educators (33%) and those working in regional, zone or branch offices (27%) are more likely to say the TRC Calls to Action have resulted in positive changes in their workplace.
I. Indigenous Traditional Health Knowledge Exchange
According to survey results, nearly three in four nurses responding to the survey (71%) have a strong understanding of the terms Indigenous cultural awareness, safety and humility. The remainder rate their understanding as moderate (25%) or low (3%). Nearly one in four nurses (23%) report frequent access to language interpreters to provide Indigenous client care. Fewer than one in five say they have access to interpreters some of the time (14%), occasionally (14%) or rarely (17%). Responses are varied in terms of satisfaction with the degree of opportunity and support for using traditional medicine in their practice. Less than one in five are satisfied (16%), and one in three (32%) are dissatisfied.
Table 10: Use of Indigenous Traditional Health at Work
Response
Total 2023
Total 2020
QIK1. To what extent would you say you are aware of (i.e., have an understanding of) the terms Indigenous cultural awareness, safety humility?
n=340
n=322
Low (1-2)
3%
5%
Moderate (3)
25%
22%
High (4-5)
71%
72%
QIK2. How often do you have access to language interpreters when required to provide client care?
n=340
n=322
All or most of the time
23%
28%
Some of the time
14%
16%
Occasionally
14%
7%
Rarely or never
17%
15%
Not applicable
28%
27%
Don't know/prefer not to say
5%
6%
QIK3. How satisfied are you with number of opportunities and degree of support in your work environment to incorporate traditional medicine into your nursing practice?
n=340
n=322
Dissatisfied (1-2)
32%
27%
Neither (3)
26%
28%
Satisfied (4-5)
16%
21%
Not applicable
17%
17%
Don't know/ No response
9%
7%
Indigenous nurses (88%) are more likely than non-Indigenous nurses (66%) to say they are aware of the terms Indigenous cultural awareness, safety, and humility.
Responding nurses who are currently working in clinical care (31%), work at a Nursing station or Health center with treatment (33%), or are part-time or casual (36%) are more likely to say they have access to language interpreters when required to do patient care.
Appendices
A. Methodological Details
Following is a breakdown of the 340 nurses responding to the survey by region and age group, as well as by gender and Indigenous status. Results presented in this table and the remainder of the report are weighted by region to reflect the distribution of the 758 nurses at ISC. Results presented for the region in the table below are unweighted (i.e., reflecting the actual proportion of nurses responding to the survey before weighting).
Compared to the results of the 2020 survey, there are slightly more younger nurses in the current results (9% compared to 5% of age 30 and younger, 22% compared to 18% aged 31-40). Slightly fewer nurses aged 61 years and older cohort (down to 11% from 17%) demonstrate the most notable difference (4% or more) between the two data collection periods.
Table 11: Sample Characteristics
Response
2023 Total
2020 Total
Region (unweighted)
n=340
n=340
Atlantic
4%
4%
Quebec
4%
5%
NCR
11%
10%
Ontario
33%
30%
Manitoba
21%
19%
Saskatchewan
12%
15%
Alberta
14%
17%
QAGE. What is your age group?
n=340
n=340
30 or younger
9%
5%
31-40
22%
18%
41-50
27%
25%
51-60
28%
31%
61 or older
11%
17%
Prefer not to specify
3%
3%
QGEND. What is your gender?
n=340
n=340
Male
10%
13%
Female
85%
84%
Prefer not to specify
4%
2%
QABO. Do you self-identify as an Aboriginal person?
n=340
n=340
Yes
20%
21%
No
76%
74%
Prefer not to specify
4%
4%
Following is the response rate for the survey by region:
Table 12: Response Rate Details
Region
Population
Completed
Response %
Atlantic
17
13
2.2%
Quebec
22
13
2.9%
National Capital Region (NCR)
64
37
8.4%
Ontario
264
112
34.8%
Manitoba
209
73
27.6%
Saskatchewan
77
41
10.2%
Alberta
105
47
13.9%
Prefer not to specify
N/A
4
N/A
Total
758
340
45%
B. Survey Questionnaire
Telephone Introduction
Name:
Primary:
Secondary:
Good morning/afternoon, my name is [name of interviewer] and I'm calling from Ekos Research Associates. We have been commissioned by Indigenous Services Canada (ISC) to conduct a telephone survey of all nurses currently employed by ISC who are currently working in nursing stations, health centres, First Nations and Inuit Health Branch (FNIHB) hospitals, regional, zone, and branch offices. The purpose of the survey is to gather important information concerning the current nursing workforce demographics, work environment and job satisfaction to allow ISC to focus on key human resources management priorities and strategies needed to build a healthy, productive workplace and workforce.
You should have recently received a letter from ISC informing you of the survey and the reasons for undertaking this initiative. The survey will take about 30 minutes to complete and your responses will be kept strictly confidential.
Please be assured that the information you provide will be administered in accordance with the Privacy Act of Canada regarding the protection of personal information. Your responses will remain confidential and no identifiable individual responses will appear in the report or sent to ISC in a way that will allow responses to be linked with individuals.
The survey is voluntary, and by taking part in the survey consent to collect this information is implied.
Did you receive this letter?
If asked: The collection, use and disclosure of personal information by the Primary Health Care Systems Division is authorized under Department of Indigenous Services Act, and is in accordance with the requirements of Privacy Act. Information collected will be used exclusively to gather information needed to aid in retention and recruitment purposes. Personal information will be retained pursuant to the Privacy Act and its Regulations. The information collection is described in Info Source (PIB PSU 938), located in the departmental Info Source publication. Individuals have the right to the protection of, access to and request the correction of their personal information under the Privacy Act. If you require clarification concerning the Privacy Notice Statement, please contact the Departmental Access to Information and Privacy Office at 1-819-997-8277 or by email at aadnc.upvp-ppu.aandc@canada.ca. For more information on privacy issues, your right to file a complaint and the Privacy Act in general, you can consult the Privacy Commissioner at 1-800-282-1376.
Yes: 1
No: 2
PRE1
Yes telephone introduction
Would you be willing to take part in the survey? We could do the interview now over the telephone, or schedule an appointment for a time that works for you or you could go online to complete the survey on your own, if you prefer?
(If prefer online) We would have sent you an email invitation to the survey on [date], but I will also send you one now and you can use either one to go to the link in the email.
Telephone now: 1
Telephone, but not now (make appointment, click continue to return to telephone introduction): 2
Would you prefer to wait until you receive the letter before taking part in the survey?
Yes, wait until letter received (Click continue to return to telephone introduction): 1
No, prefer to continue: 2
SCRN2
No SCRN1
The survey will take about 30 minutes to complete and your responses will be kept strictly confidential. Would you be available now to take part in the survey?
Yes: 1
No (make appointment, click continue to return to telephone introduction): 2
SCRN3
An invitation email has been sent, it should be received shortly. Thank you for your time and cooperation.
Click "continue" to return to introduction: 1
Online Introduction
Ekos Research Associates has been commissioned by Indigenous Services Canada (ISC) to conduct a survey of all nurses employed by ISC who are currently working in nursing stations, health centres, First Nations and Inuit Health Branch (FNIHB) hospitals, regional, zone, and branch offices. The purpose of the survey is to gather important information concerning the current nursing workforce demographics, work environment and job satisfaction to allow ISC to focus on key human resources management priorities and strategies needed to build a healthy, productive workplace and workforce.
You should have recently received a letter from ISC informing you of the survey and the reasons for undertaking this initiative. The survey will take about 24 minutes to complete and your responses will be kept strictly confidential. You can start the survey and come back to it later if you don’t have enough time right now.
The collection, use and disclosure of personal information by the Primary Health Care Systems Division is authorized under Department of Indigenous Services Act, and is in accordance with the requirements of Privacy Act. Information collected will be used exclusively to gather information needed to aid in retention and recruitment purposes. Personal information will be retained pursuant to the Privacy Act and its Regulations. The information collection is described in Info Source (PIB PSU 938), located in the departmental Info Source publication. Individuals have the right to the protection of, access to and request the correction of their personal information under the Privacy Act. If you require clarification concerning the Privacy Notice Statement, please contact the Departmental Access to Information and Privacy Office at 1-819-997-8277 or by email at aadnc.upvp-ppu.aandc@canada.ca>. For more information on privacy issues, your right to file a complaint and the Privacy Act in general, you can consult the Privacy Commissioner at 1-800-282-1376.
The survey is voluntary, and by taking part in the survey consent to collect this information is implied.
A few reminders before beginning:
Definitions to some terms are provided. Hover your mouse over the underlined terms as you move through the survey in order to see the definition.
On each screen, after selecting your answer, click on the "Next" button at the bottom of the screen to move forward in the questionnaire.
If you leave the survey before completing it, you can return to the survey URL later, and you will be returned to the page where you left off. Your answers up to that point in the survey will be saved.
If you have any questions about how to complete the survey, please call Ekos at 1-800-388-2873 or send an email to ISCnurses@ekos.com Thank you in advance for your participation.
Privacy policy
This call may be recorded for quality control or training purposes.
1 - Employment profile
Q1
The first questions are about your employment history. For how many years have you been employed as a nurse?
[Phone] Prompt if needed
Less than 1 year: 1
1 year or greater, but less than 2 years: 2
2 years or greater, but less than 3 years: 3
3 years or greater, but less than 5 years: 4
5 years or greater, but less than 10 years: 5
10 years or greater, but less than 15 years: 6
15 years or greater, but less than 20 years: 7
20 years or greater, but less than 25 years: 8
25 years or greater: 9
Don't know/No response: 99
Q1A
For how many years have you been employed as a nurse by your current employer?
[Phone] Prompt if needed
Q1 >= 1
Less than 1 year: 1
Q1 >= 2
1 year or greater, but less than 2 years: 2
Q1 >= 3
2 years or greater, but less than 3 years: 3
Q1 >= 4
3 years or greater, but less than 5 years: 4
Q1 >= 5
5 years or greater, but less than 10 years: 5
Q1 >= 6
10 years or greater, but less than 15 years: 6
Q1 >= 7
15 years or greater, but less than 20 years: 7
Q1 >= 8
20 years or greater, but less than 25 years: 8
Q1 >= 9
25 years or greater: 9
Don't know/No response: 99
Q1A5 [1,12]
What aspects of your current job first attracted you to it?
[Phone] Read list [Phone] Prompt if needed (Select all that apply)
Opportunities for expanded scope of practice: 1
Opportunity for advancement: 2
Desire to work in remote/rural settings: 3
Opportunity to work with a diverse culture (First Nations Peoples): 4
Working in a primary health care environment: 5
Autonomy in nursing practice: 6
Salary and benefits of the job: 7
The work hours/flexibility: 8
Other, specify: 77
Don't know/No response: 99
Q1A6 [1,12]
What aspects keep you working as an employee in this job
[Phone] Read list [Phone] Prompt if needed (Select all that apply)
Opportunities for expanded scope of practice: 1
Opportunity for advancement: 2
Desire to work in remote/rural settings: 3
Opportunity to work with a diverse culture (First Nations Peoples): 4
Working in a primary health care environment: 5
Autonomy in nursing practice: 6
Salary and benefits of the job: 7
The work hours/flexibility: 8
Other, specify: 77
Don't know/No response: 99
Q2
Which of these best describes your current employment status with your current employer.
[Phone] Read list NOTE: Relief nurse is the same as casual
Full-time: regularly working 30 or more hours a week: 1
Part-time: regularly working less than 30 hours a week: 2
Casual position (employment that doesn't exceed 120 hours a year): 3
Other, specify: 77
Don't know/No response: 99
Q3
Are you considered to be in an indeterminate, or term position?
Indeterminate: 1
Term: 2
Other, specify: 77
Don't know/No response: 99
Q4
Which of the following areas best describes your primary area of responsibility?
[Phone] Read list (If more than one, please select the one that you consider to be your main responsibility)
Clinician or clinical care: 1
Practice advisors: 2
Management: 3
Leadership (no direct reports): 4
Education: 5
Other, specify: 77
Don't know/No response: 99
Q5
Which of the following types of facilities best describes your primary place of work?
[Phone] Read list (If more than one, please select the one that you consider to be your main place of work)
Nursing Station: 1
Health Centre with treatment component: 2
Health Centre without treatment component: 3
Regional/Zone/Branch office: 4
Other, specify: 77
Don't know/No response: 99
Q37D
Are you registered as a Nurse Practitioner?
Yes, working in full scope of practice: 1
Yes, working in an extended role: 2
No: 3
Don't know/No response: 99
Q7
Do you currently have any plans to leave your current employment within the next three years, either to retire or for other reasons?
Yes: 1
No: 2
Don't know/No response: 99
Q7B
Yes Q7
What is your expected timeframe for leaving?
(Please select to response that is closest to your plans)
Less than 1 year: 1
1 year: 2
2 years: 3
3 years: 4
Don't know/No response: 99
Q7C
Yes Q7
What is the main reason you intend to leave?
[Phone] Read list [Phone] Prompt if needed
Retirement: 1
Different job: 2
Stay at home/parental leave: 3
Relocation: 4
Other, specify: 77
Don't know/No response: 99
2 - Education Profile
Q31
The following questions are about your educational background.
What is your highest nursing education qualification level?
[Phone] Read list if necessary
RN College Diploma: 1
Bachelor of Nursing (BN): 2
Bachelor of Science in nursing (BScN): 3
Masters in nursing (MN, MScN): 4
Ph.D. in nursing: 5
Don't know/No response: 99
3 - Job Satisfaction
PJS1
The next questions look at aspects of your current work situation that most contribute to your sense of job satisfaction. [Phone] For each one tell me if you are very dissatisfied, somewhat dissatisfied, neither satisfied nor dissatisfied, somewhat satisfied or very satisfied with [Else] Please rate the extent to which you are satisfied or dissatisfied with> each of the following aspects of your current workplace.
Very dissatisfied 1: 1
2: 2
Neither satisfied nor dissatisfied 3: 3
4: 4
Very satisfied 5: 5
Not applicable: 98
Don't know/ No response: 99
JS1
Your family/work life balance
JS2
Your current opportunities for professional development/continuing education
JS3
Your current opportunities for nursing leadership development
JS5
The feedback and support you receive from Nursing Management
JS9
The opportunities you have to participate in policy and practice decisions
JS11
The orientation training (including cultural competency training) provided to new staff
JS4
Your ability to deliver quality care
JS7
The number of healthcare and para-professional staff on duty to provide quality care
JS8
The number of allied health professionals and support staff at your workplace, including technical staff
JS12
The physical maintenance at the facility where you work
JS13
Nursing Station Q5
The quality and availability of living accommodations provided by your employer
JS14
The amount of pay, including base pay and allowances you receive
JS15
The amount of benefits, including health and dental coverage you receive
JS16
The ability to obtain approval for leave requests
PJS17
[Phone] For each of the following please tell me if you strongly disagree, somewhat disagree, neither agree nor disagree, somewhat agree or strongly agree.[ELSE]Please indicate whether you agree or disagree with the following.
Strongly disagree 1: 1
2: 2
Neither agree nor disagree 3: 3
4: 4
Strongly agree 5: 5
Don’t know/No response: 99
JS18
Overall, I feel valued at work
JS19
I have opportunities to provide input into decisions that affect my work
JS20
I receive the training I need to do my job
JS21
I am sufficiently informed by my immediate supervisor about issues affecting my work
JS22
I am sufficiently informed by Regional Office about issues, policies and procedures affecting my work
JS23
I am sufficiently informed by National Office about issues, policies and procedures affecting my work
JS17
I feel the quality of my work suffers because of high staff turnover
JS24
The quality of my work suffers because of lack of access to technology
4 – Information Technology (IT)
PIT1
The following questions focus on information technology (IT) at your workplace.
[Phone] For each one tell me if you are very dissatisfied, somewhat dissatisfied, neither satisfied nor dissatisfied, somewhat satisfied or very satisfied with[ELSE]Please rate the extent to which you are satisfied or dissatisfied with> each of the following aspects of IT at your work.
IT1
The IT equipment, including computers, software, other standard computing tools
IT2
Clinician or clinical care Q4
The medical/diagnostic equipment used for patient screening/treatment such as telehealth, or x-ray machines
IT3
The reliability of your access to the Internet
IT4
The training you receive to fully use the computers and software available to you at your facility
Very dissatisfied 1: 1
2: 2
Neither satisfied nor dissatisfied 3: 3
4: 4
Very satisfied 5: 5
Not applicable: 98
Don't know/ No response: 99
IT5
How easy or difficult is the process for submitting a request for IT support in your workplace? [Phone] Would you say it is (read list)>
Very difficult 1: 1
2: 2
Neither easy nor difficult 3: 3
4: 4
Very easy 5: 5
Don't know/ No response: 99
IT6
How responsive is IT support staff once you have submitted a request? [Phone] Would you say (read list)
Not at all responsive 1: 1
2: 2
Moderately responsive 3: 3
4: 4
Very responsive 5: 5
Don't know/ No response: 99
5 - Payroll System
PS1
Have you experienced any pay or other compensation issues within the past three years?
Yes: 1
No: 2
Unsure, it depends: 99
PS2 [1,9]
What type of issues have you experienced?
[Phone] Read list if necessary [Phone] Prompt if needed (Select all that apply)
Missing regular payment: 1
Underpaid: 2
Overpaid: 3
Errors in processing pay information: 4
Errors in pension deductions: 5
Errors in leave credits (e.g., vacation, compensation time, family leave): 6
Errors related to change in position/department (e.g., acting pay): 7
Other, specify: 77
No response: 99
PS3
Have these issues been resolved?
Yes: 1
No: 2
Unsure, in progress: 99
PS4
How satisfied are you with the support you have received in trying to resolve these issues? [Phone] Would you say you are (read list)>
Very dissatisfied 1: 1
2: 2
Neither satisfied nor dissatisfied 3: 3
4: 4
Very satisfied 5: 5
Not applicable: 98
Don't know/ No response: 99
6 – Communications & Policy Awareness
CM1
What is the primary method you use to communicate with your workplace?
[Phone] Prompt if needed
Work Email: 1
Personal e-mail: 2
Work phone: 3
Personal phone: 4
Other method (specify): 77
No response: 99
CM2
Is this your preferred method of communication with your employer regarding new / changes in policies, events / announcements?
Yes: 1
No: 2
Unsure, it depends: 99
CM3
Not preferred method of communicating, QCM2
How would you prefer to communicate with your workplace to obtain information?
[Phone] Prompt if needed
Work Email: 1
Personal e-mail: 2
Work phone: 3
Personal phone: 4
Other method (specify): 77
No response: 99
CM5
Have you been informed by your employer about the Truth and Reconciliation (TRC) Calls to Action?
Yes: 1
No: 2
Unsure/Do not recall: 99
CM6
Yes were informed of TRC Calls to Action, CM5
Have you experienced any changes in your workplace as a result of the Truth and Reconciliation (TRC) Calls to Action? [Phone] Would you say (read list)
No positive impact at all 1: 1
2: 2
A moderate positive impact 3: 3
4: 4
A strong positive impact 5: 5
Don't know/ No response: 99
7 - Safety & Security
QSS1 [1,12]
Which of the following, if any, have had an adverse impact on your sense of personal safety and security at work?
[Phone] Read list (Select all that apply)
Not enough staff: 1
The level or quality of staff: 2
The physical work environment (e.g., layout and security features): 3
The location of the facility in the community: 4
Verbal threats from other staff: 5
Physical threats from other staff: 6
Verbal threats from patients/family members: 7
Physical threats from patients/family members: 8
Other safety/security concerns (specify): 77
No safety and security issues: 98
Don't know/No response: 99
QSS2
Have you participated in Nursing Safety and Awareness Training (NSAT)?
Yes: 1
No: 2
Do not recall / No response: 99
QSS3
Yes QSS2
Do you feel that this has made a positive contribution to your personal safety and security at work? [Phone] Would you say (read list)
No positive impact at all 1: 1
2: 2
A moderate positive impact 3: 3
4: 4
A strong positive impact 5: 5
Don't know/ No response: 99
QSS2b
Have you participated in Occupational and Critical Incident Stress Management (OCISM) training, like resilience training?
Yes: 1
No: 2
Do not recall / No response: 99
QSS3b
Yes QSS2b
To what extent do you feel your work environment allows you to practice the skills you obtained in your OCISM training? [Phone] Would you say (read list)
Not at all: 1
2: 2
Somewhat: 3
4: 4
To a great extent: 5
Don't know/ No response: 99
QSS4
Are you aware of Occupational and Critical Incident Stress Management (OCISM) resources at your place of work?
Yes: 1
No: 2
Not sure: 99
QSS6
Has access to OCISM services ever increased your intention to stay?
Yes: 1
No: 2
Not sure: 99
QSS7
Are you aware of the Nursing Services Response Centre (NSRC) and its services to ISC Nurses?
Yes: 1
No: 2
Not sure: 99
QSS8
Yes QSS7
Have you used the services of the NSRC in the last year?
Yes: 1
No: 2
Not sure: 99
QSS9
Yes QSS8
How satisfied are you with the services you received from the NSRC? [Phone] Would you say (read list)
Very dissatisfied 1: 1
2: 2
Neither satisfied nor dissatisfied 3: 3
4: 4
Very satisfied 5: 5
Don't know/ No response: 99
QSS9
Yes QSS8
Would you recommend the services of the NSRC to your colleagues?
Yes: 1
No: 2
Not sure: 99
8 - Stress
QST1 [1,15]
Which of the following factors, if any, cause you stress on a regular basis at work?
[Phone] Read list. Select all that apply
Pay and other compensation-related issues: 1
Heavy workload: 2
Feeling isolated: 3
Lack of teamwork: 4
Not enough employees to do the work: 5
Overtime or long hours: 6
Physical work environment: 7
Balancing work and personal life: 8
Competing/changing priorities: 9
Harassment (from management, co-workers, or patients): 10
Lack of resources to do the work (e.g., supplies, equipment, access to computers/Internet): 11
Lack of support and technical staff: 12
Lack of orientation/training: 13
Other, specify: 77
No issues related to stress: 98
Don't know/No response: 99
QST2
All things considered, how would you rate your level of regular work-related stress? [Phone] Would you say (read list)
Very low: 1
Low: 2
Moderate: 3
High: 4
Very high: 5
Don't know/prefer not to say: 99
QST3
How satisfied are you with the quality and availability of resources to help relieve stress at your workplace? [Phone] Would you say (read list)
Very dissatisfied 1: 1
2: 2
Neither satisfied nor dissatisfied 3: 3
4: 4
Very satisfied 5: 5
Don't know/ No response: 99
QST4 [1,10]
Which of the following would be useful to you in helping to relieve stress?
[Phone] Read list Select all that apply
More support staff: 1
More clinical staff: 2
More/better equipment: 3
Improved communication: 4
Safe work environment: 5
More support from management/leadership: 6
More annual leave: 7
More professional development: 8
More orientation/training: 9
Other, specify: 77
Nothing necessary: 98
Don't know/No response: 99
9 – Indigenous Traditional Health Knowledge
QIK1
To what extent would you say you are aware of (i.e., have an understanding of) the terms Indigenous cultural awareness, safety & humility? [Phone] Would you say (read list)
Not at all 1: 1
2: 2
Moderately 3: 3
4: 4
Very 5: 5
Don't know/ No response: 99
QIK2
How often do you have access to language interpreters when required to provide client care? [Phone] Would you say (read list)
All or most of the time: 1
Some of the time: 2
Occasionally: 3
Rarely or never: 4
Not applicable: 98
Don't know/prefer not to say: 99
QIK3
How satisfied are you with number of opportunities and degree of support in your work environment to incorporate traditional medicine into your nursing practice? [Phone] Would you say (read list)
Very dissatisfied 1: 1
2: 2
Neither satisfied nor dissatisfied 3: 3
4: 4
Very satisfied 5: 5
Not applicable: 98
Don't know/ No response: 99
10 – Socio-demographics
QAGE
Finally, the following questions will be used for statistical purposes only. What is your age group?
30 or younger: 1
31-40: 2
41-50: 3
51-60: 4
61 or older: 5
Prefer not to specify: 99
QGEND
What is your gender?
Male: 1
Female: 2
Other (please specify): 77
Prefer not to specify: 99
QABO
Do you self-identify as an [hover="A person that is a North American Indian or a member of a First Nation, a Métis, or Inuit. North American Indians or members of a First Nation include status, treaty or registered Indians, as well as non-status and non-registered Indians"] Aboriginal person?
Yes: 1
No: 2
Prefer not to specify: 99
Thank You
Thank you for taking the time to participate! Your input will be very helpful in future planning and policy decisions to build a healthy, productive workplace and workforce.
C. Key Regional Results by Thematic Area
Following are results for survey items where there are significant and substantive differences in one or more region(s). Questions are organized by thematic area, following the same flow as presented in the body of the report. In each cell, the top number is the number of employees providing this response in a given region. The bottom number represents the percentage of all employees in that region who responded to the question. In some cases where fewer than ten employees responded, no results can be provided, indicated with NA (Not Available), to preserve confidentiality. Results for Quebec and Atlantic were combined for this reason. Four respondents declined to indicate their region. The bold font has been used in cells where the result for a specific region is significantly and substantively different from the overall results.
Table 13: Key Regional Results by Thematic Area
Response
Total
AB
SK
MB
ON
NCR
QC/ATL
n=
340
47
41
73
112
37
26
Education
Q31 What is your highest nursing education qualification level?
RN College Diploma
34 (11%)
NA
NA
16 (22%)
10 (9%)
NA
NA
Bachelor of Nursing (BN)
58 (18%)
NA
NA
27 (37%)
12 (11%)
NA
NA
Bachelor of Science in nursing (BScN)
142 (41%)
27 (57%)
25 (61%)
18 (25%)
52 (46%)
14 (38%)
NA
Employment
Q2 Which of these best describes your current employment status with your current employer.
Full-time: regularly working 30 or more hours a week
216 (60%)
33 (70%)
38 (93%)
27 (37%)
55 (49%)
36 (97%)
25 (97%)
Q4 Which of the following areas best describes your primary area of responsibility?
Clinician or clinical care
168 (52%)
23 (49%)
19 (46%)
50 (68%)
65 (58%)
NA
NA
Q5 Which of the following types of facilities best describes your primary place of work?
Nursing Station
135 (44%)
10 (21%)
NA
54 (74%)
65 (58%)
NA
NA
Recruitment & retention
Q1A5. What aspects of your current job first attracted you to it?
Opportunities for expanded scope of practice
155 (48%)
17 (36%)
NA
45 (62%)
63 (56%)
15 (41%)
NA
Desire to work in remote/rural settings
156 (47%)
16 (34%)
17 (41%)
37 (51%)
66 (59%)
15 (41%)
NA
Q7 Do you currently have any plans to leave your current employment within the next three years, either to retire or for other reasons?
Yes
114 (35%)
17 (36%)
10 (24%)
32 (44%)
35 (31%)
12 (32%)
NA
Job satisfaction
Please indicate whether you agree or disagree with the following.
QJS18 Overall, I feel valued at work - Agree (4-5)
177 (51%)
30 (64%)
19 (46%)
30 (41%)
53 (47%)
25 (68%)
18 (70%)
Please rate the extent to which you are satisfied or dissatisfied with each of the following aspects of your current workplace:
QJS4 Your ability to deliver quality care - Satisfied (4-5)
175 (51%)
35 (74%)
29 (71%)
33 (45%)
48 (43%)
15 (41%)
14 (53%)
Please rate the extent to which you are satisfied or dissatisfied with each of the following aspects of your current workplace:
QJS5 The feedback and support you receive from Nursing Management - Satisfied (4-5)
154 (44%)
21 (45%)
16 (39%)
20 (27%)
62 (55%)
18 (49%)
17 (67%)
QJS7 The number of healthcare and para-professional staff on duty to provide quality care - Satisfied (4-5)
61 (17%)
14 (30%)
14 (34%)
10 (14%)
15 (13%)
NA
NA
QJS8 The number of allied health professionals and support staff at your workplace, including technical staff - Satisfied (4-5)
88 (25%)
18 (38%)
16 (39%)
12 (16%)
21 (19%)
NA
12 (47%)
QJS12 The physical maintenance at the facility where you work - Satisfied (4-5)
117 (34%)
24 (51%)
25 (61%)
27 (37%)
20 (18%)
NA
15 (59%)
Please rate the extent to which you are satisfied or dissatisfied with each of the following aspects of your current workplace:
QJS9 The opportunities you have to participate in policy and practice decisions - Satisfied (4-5)
119 (33%)
17 (36%)
11 (27%)
12 (16%)
43 (38%)
24 (65%)
12 (46%)
Please indicate whether you agree or disagree with the following.
QJS19 I have opportunities to provide input into decisions that affect my work - Agree (4-5)
183 (52%)
25 (53%)
23 (56%)
27 (37%)
63 (56%)
24 (65%)
19 (74%)
QST2 All things considered, how would you rate your level of regular work-related stress?
High (4-5)
126 (39%)
20 (43%)
10 (24%)
40 (55%)
41 (37%)
NA
NA
QST4 Which of the following would be useful to you in helping to relieve stress?
More support staff
172 (52%)
23 (49%)
18 (44%)
50 (68%)
57 (51%)
NA
NA
More clinical staff
196 (61%)
24 (51%)
17 (41%)
56 (77%)
78 (70%)
16 (43%)
NA
More/better equipment
130 (40%)
18 (38%)
NA
37 (51%)
52 (46%)
12 (32%)
NA
Improved communication
194 (58%)
25 (53%)
22 (54%)
50 (68%)
63 (56%)
20 (54%)
12 (44%)
Safe work environment
124 (39%)
16 (34%)
NA
38 (52%)
50 (45%)
NA
NA
More support from management/ leadership
176 (53%)
24 (51%)
19 (46%)
52 (71%)
50 (45%)
19 (51%)
NA
Please rate the extent to which you are satisfied or dissatisfied with each of the following aspects of your current workplace:
QJS11 The orientation training (including cultural competency training) provided to new staff - Satisfied (4-5)
129 (38%)
13 (28%)
10 (24%)
23 (32%)
56 (50%)
14 (38%)
13 (50%)
QJS20 I receive the training I need to do my job - Agree (4-5)
167 (48%)
21 (45%)
20 (49%)
28 (38%)
58 (52%)
17 (46%)
21 (81%)
QPS1 Have you experienced any pay or other compensation issues within the past three years?
Yes
215 (64%)
26 (55%)
19 (46%)
48 (66%)
83 (74%)
19 (51%)
17 (66%)
IM/IT
Please rate the extent to which you are satisfied or dissatisfied with each of the following aspects of IT at your work
QIT1 The IT equipment, including computers, software, other standard computing tools - Satisfied (4-5)
146 (40%)
22 (47%)
28 (68%)
19 (26%)
39 (35%)
20 (54%)
16 (59%)
QIT3X The reliability of your access to the Internet - Satisfied (4-5)
183 (53%)
30 (64%)
28 (68%)
35 (48%)
51 (46%)
21 (57%)
16 (60%)
QIT4 The training you receive to fully use the computers and software available to you at your facility
97 (28%)
17 (36%)
10 (24%)
15 (21%)
33 (29%)
11 (30%)
10 (35%)
QSS1 Which of the following, if any, have had an adverse impact on your sense of personal safety and security at work?
Not enough staff
176 (55%)
25 (53%)
NA
53 (73%)
73 (65%)
11 (30%)
NA
The level or quality of staff
144 (46%)
18 (38%)
NA
49 (67%)
56 (50%)
NA
NA
The physical work environment
130 (41%)
14 (30%)
12 (29%)
44 (60%)
47 (42%)
10 (27%)
NA
Verbal threats from patients/ family members
99 (32%)
15 (32%)
NA
40 (55%)
31 (28%)
NA
NA
Physical threats from patients/ family members
53 (18%)
NA
NA
27 (37%)
13 (12%)
NA
NA
QSS2 Have you participated in Nursing Safety and Awareness Training (NSAT)?
Yes
182 (53%)
27 (57%)
38 (93%)
42 (58%)
41 (37%)
16 (43%)
16 (63%)
QCM5 Have you been informed by your employer about the Truth and Reconciliation (TRC) Calls to Action?