EXECUTIVE
SUMMARY
Earnscliffe Strategy Group (Earnscliffe) is pleased to present
this report to the Department of National Defence (DND) summarizing the results
of quantitative research to inform the recruitment marketing and advertising
strategies of the Canadian Armed Forces.
The Department
of National Defence is focused on ensuring the diversity of Canadian society is
reflected in the Canadian Armed Forces (CAF). The CAF wanted to better
understand how to reach potential recruits with messages that resonate. Past
research efforts have not been specific to this target demographic: potential
recruits, aged 17-23. One of the primary objectives of the research was to
create psychographic profiles of potential recruits. This analysis could be
used to inform recruitment efforts by exploring lifestyle values, preferences,
attitudes, motivations, behaviours, and barriers to joining. Further, the
research set out to determine information sources, influencers, and how to best
resonate with visible minorities, Indigenous groups, and women. The total cost
to conduct this research was $74,263.60 including HST.
Earnscliffe
used a quantitative approach to meet these objectives. We conducted an online
survey of 2,031 Canadians. The survey was conducted with respondents aged 17 to
23, half self-identified as visible minority
or Indigenous and the other half self-identified as neither visible minority
nor Indigenous. The research was conducted using
our data collection partner, Léger’s, proprietary online panel. The surveys
were conducted online from March 5 to 24, 2019 and averaged 14
minutes. The data was weighted to reflect the demographic composition of the
Canadian population aged 17 to 23.
The key
findings from the research are presented below.
§ The elements that the most respondents seek in a career
are good pay (51%), work-life balance (28%), a positive work environment (24%),
job security (22%) and benefits (22%).
§ Many of the things respondents look for in a career are
reflected in the importance they place on certain life goals. For example, well
over two-thirds (69%) rate having good work-life balance as very important to
them. Over half of respondents also prioritize goals related to job security
and pay, including having a full-time job (63%) and being financially successful
(61%).
o Over 40% are very confident they will have a career that
offers them intellectual and physical challenges, training, competition,
respect, and opportunities for advancement and to get jobs in their field.
o About a third are very confident that they will find a
career that provides many of the elements they seek in a career, including a
positive work environment (36%), benefits (34%), job security (31%) and good
pay (31%). Fewer (25%) are very confident they will find work-life balance.
o The aspects of a career that matter least are physical
challenge (40%), prestige (34%) and a competitive environment (25%).
§ A fulfilling career (42%), having a family (33%) and
being happy (25%) are the top three things respondents want to achieve in life,
followed by financial stability (19%) and travel (18%).
§ Under half (40%) are familiar with the CAF, but their
opinion of the CAF is mostly favourable (68%).
o Overall, respondents who are visible minorities,
Indigenous, male or from Atlantic Canada are more familiar with the CAF.
o Those who have a very favourable view of the CAF hold
this view out of respect for the sacrifices its members make (26%), the
protection the CAF offers our country (25%), the CAF’s reputation (11%) and its
members’ service to our country (11%).
o Those with a very negative impression tend to associate
the CAF with war or violence (28%).
§ Fewer respondents (53%) have a favourable opinion of the
CAF as an employer than do in general, but the lower rating could stem from
unfamiliarity with the CAF in this context, as 26% do not offer an opinion on
the subject.
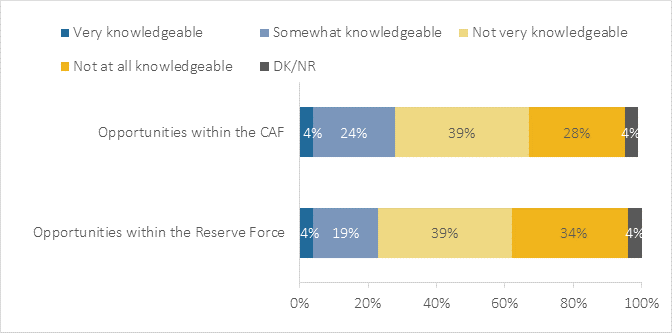
§ Under a third (28%) are knowledgeable of career
opportunities within the CAF, and fewer (23%) are knowledgeable with
opportunities within the Reserve Force.
§ One-in-five are either very likely (4%) or somewhat
likely (16%) to consider a career in the CAF.
o Interest in joining the Reserves is higher (45%).
o Few (17%) of those who are unlikely to consider a career
in the CAF have thought about it before.
§ Likelihood of considering joining the CAF rises to 52%
when respondents are told they could have a career in one of their preferred
fields. The possibility of a career in a field that interests them appears
compelling even to those who were less interested in joining the CAF to begin
with. Among those who initially said they
would not be very likely to consider a career in the CAF, over half would be
very or somewhat likely to consider it if it meant working in a field that
interests them.
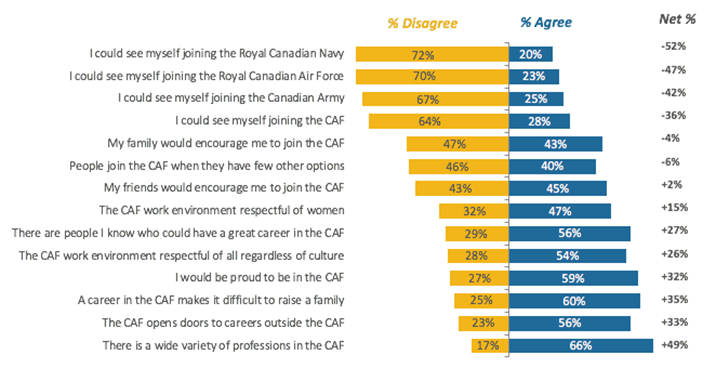
§ Significantly fewer agree (28%) than disagree (65%) that
they could see themselves joining the CAF. This pattern extends to the Royal
Canadian Navy (20% agree, 72% disagree), the Royal Canadian Air Force (RCAF) (22%
agree, 70% disagree) and the Canadian Army (25% agree, 67% disagree).
o Though they are not enthusiastic about joining, more
would be proud to serve (59%) than would not (27%).
§ More agree than disagree with a number of positive
aspects of a career in the CAF including that it offers a wide variety of
professions (66% agree, 17% disagree), opens doors to work outside the CAF (56%
agree, 23% disagree), and that the work environment is respectful of all
cultures (54% agree, 28% disagree) and women (47% agree, 32% disagree).
o Opinion is more evenly split over whether one’s family (43%
agree, 47% disagree) or friends (45% agree, 43% disagree) would encourage them
to join.
§ Respondents feel the most compelling reasons to consider
a career in the CAF are paid education (37% place it in the top three),
salary/benefits (35%) and helping others (30%).
o Exposure to danger (38%), being away from home and family
(34%), and the possibility of combat (33%) are the greatest deterrents to
joining the CAF.
o Those who are likely to join the CAF believe serving the
country is a more compelling argument (26%), along with training (18%) than
those who are less interested in serving.
§ Half (52%) agree that “physically challenging” describes
a career in the CAF very well. The plurality of respondents believe “offers
training” (42%) is an apt description. Respect (35%) and the offer of
adventure (31%) follow as the most accurate terms to describe a military career.
o Fewer believe a positive work environment (9%), freedom/flexibility
(8%), not having to move (8%) and work/life balance (6%) describe a career in
the CAF very well.
§ Both the Navy and Army videos elicit similar reactions.
Over half say the videos are appealing to watch and are compelling. Over half
also agree that they made them at least a little more interested in a career in
the CAF and that the videos seemed in some way meant for them.
o The videos had an impact on those who said they are not
very likely to consider a career in the CAF. In both cases, large majorities
said that they made them at least a little more likely to consider a career in
the CAF.
Research Firm:
Earnscliffe
Strategy Group Inc. (Earnscliffe)
Contract
Number: W8484-181041/001/CY
Contract award
date: January 23, 2019
I hereby
certify as a Representative of Earnscliffe Strategy Group that the final
deliverables fully comply with the Government of Canada political neutrality
requirements outlined in the Communications Policy of the Government of Canada
and Procedures for Planning and Contracting Public Opinion Research. Specifically,
the deliverables do not include information on electoral voting intentions,
political party preferences, standings with the electorate or ratings of the
performance of a political party or its leaders.
Signed: Date:
March 31, 2019
Doug Anderson
Principal, Earnscliffe
INTRODUCTION
Earnscliffe Strategy Group (Earnscliffe) is pleased to present
this report to the Department of National Defence (DND) summarizing the results
of quantitative research to inform the recruitment, marketing and advertising
strategies of the Canadian Armed Forces.
The Department
of National Defence is focused on ensuring the diversity of Canadian society is
reflected in the Canadian Armed Forces (CAF). The CAF wanted to better
understand how to reach potential recruits with messages that resonate. Past
research efforts have not focussed specifically on potential recruits; those
aged 17-23. One of the primary objectives of the research was to create
psychographic profiles of potential recruits. This analysis could be used to
inform recruitment efforts by exploring lifestyle values, preferences, attitudes,
motivations, behaviours, and barriers to joining. Further, the research set
out to determine information sources, influencers, and how to best resonate
with visible minorities, Indigenous groups, and women.
The specific objectives
of the research included:
§ Create a demographic and psychographic profile of
potential recruits within the target age range;
§ Determine the lifestyle values, preferences, and
attitudes they have, based on factors, such as: happiness, success, career
paths and goals, leisure activities and hobbies, self-confidence, health, and
family;
§ Determine how these lifestyle values affect attitudes
towards joining the CAF and perceptions of the CAF;
§ Determine reasons and motivations to join;
§ Determine barriers to overcome to join;
§ Determine the sources of information they use to make
informed life decisions and the impact they have;
§ Determine influencers that they use to make informed life
decisions and the impact they have; and
§ Target recruit profiles must consider how the CAF can
resonate with visible minorities, Indigenous groups, and women.
To
meet these objectives, Earnscliffe used a quantitative approach. We conducted
an online survey of 2,031 Canadians. The survey was conducted with respondents
aged 17 to 23; half self-identified as
visible minority or Indigenous and the other half self-identified as neither
visible minority nor Indigenous. The
research was conducted for the most part using our data collection partner,
Léger’s, proprietary online panel. In order to achieve the desired number of
visible minority respondents, Léger partnered with Decision Point Research to
make use of the latter’s proprietary
multicultural research panel. For more comprehensive details on the nature of
the opt-in panels used, the Government of Canada is already in possession of
each company’s responses to the ESOMAR28 questions. In total, 406 completes
were from Decision Point’s panel. The
surveys were conducted online from March 5 to 24, 2019 and averaged
14 minutes. The data was weighted to reflect the demographic composition of the
Canadian population aged 17 to 23.
To
ensure sufficient representation of Canadians at all age levels and across all
provinces, quotas were set as outlined in the table below.
The
original sampling frame was as follows:
|
Region/Province
|
%
|
Visible Minority/Indigenous
(17-23)
|
Rest of Canadians
(17-23)
|
|
Atlantic Canada
|
6.8%
|
68
|
68
|
|
Quebec
|
23.4%
|
234
|
234
|
|
Ontario
|
38.3%
|
383
|
383
|
|
Prairies
|
6.5%
|
66
|
66
|
|
Alberta
|
11.2%
|
113
|
113
|
|
British Columbia
|
13.5%
|
136
|
136
|
|
TOTAL
|
100%
|
1,000
|
1,000
|
Bolded results in the tables presented in this report indicate
that the difference between the demographic groups analysed are significantly
higher than results found in other columns in the table. In the text of the
report, unless otherwise noted, demographic differences highlighted are
statistically significant at the 95% confidence level. The statistical test
used to determine the significance of the results was the Z-test.
The detailed findings from this research are presented in
subsequent sections of this report. Appended to this report are the methodology
report, survey instrument, and data tables (presented under a separate cover).
DETAILED FINDINGS
The following research results are presented in seven sections:
career outlook and aspirations; values and goals; thoughts on a career in the
Canadian Armed Forces; communications testing; civics; employment profile; and,
the segmentation analysis.
These
findings focus primarily on the differences across the three target samples:
the general population as a whole; those who self-identify as a visible minority
(including Indigenous persons); and, those who self-identify as non-visible
minority (including non-Indigenous persons). Appended data tables provide
results of findings across a much broader range of demographics, characteristics,
and attitudes.
When
asked to choose from a list which three elements they expect from a career, half
(51%) prioritize good pay. Around one in four seek either work-life balance
(28%), a positive work environment (24%), job security (22%) and benefits (22%).
Respondents from visible minority groups are less concerned about having a positive
work environment (16%) than non-visible minorities (26%), and more likely than
those who are not members of a visible minority group to prioritize job
security (28% vs 20%) and respect (17% vs 12%). Other notable differences
between demographic groups include:
§ Female respondents are more likely than male respondents
to seek work-life balance (33% vs 24% of men), a positive work environment (28%
vs 19%), benefits (27% vs 16%) and adventure (15% vs 11%).
§ Respondents aged 17-18 rank job opportunities in the
field (18%) higher than those in the older age categories (13% among those ages
19-20 and 11% among those ages 21-23).
o Along with those ages 19-20 (11%), 17-18 year-olds also
find free job training more appealing (9%) than those aged 21-23 (5%).
o The oldest age group is more likely to prioritize
work-life balance (31%) and benefits (24%) than the youngest age groups (23%
and 17%, respectively).
§ Good pay (62%) and lots of job and career opportunities
in the field (26%) are more important to Atlantic Canadians than those in other
regions, particularly when compared to BC (41% prioritize good pay and 13% job
opportunities), as well as Quebec (11% prioritize job opportunities) and
Ontario (12% prioritize job opportunities).
Exhibit
A1: Q12: From the list below, which three do you most want out of a career?
|
Career
Expectations
|
|
|
Gen Pop
(n=2031)
|
Visible Minority
(n=1,008)
|
Non-Visible Minority (n=1,023)
|
|
Good
pay
|
51%
|
48%
|
52%
|
|
Work-life
balance
|
28%
|
28%
|
29%
|
|
Positive
work environment
|
24%
|
16%
|
26%
|
|
Job
security
|
22%
|
28%
|
20%
|
|
Benefits
|
22%
|
18%
|
23%
|
|
Freedom/Flexibility
|
17%
|
16%
|
18%
|
|
Intellectual
challenge
|
15%
|
13%
|
16%
|
|
Job
opportunities in the field
|
14%
|
14%
|
13%
|
|
Adventure
(opportunity to travel)
|
13%
|
13%
|
14%
|
|
Respect
|
13%
|
17%
|
12%
|
|
Opportunity
for advancement
|
11%
|
12%
|
11%
|
|
No
requirement to move far away
|
9%
|
8%
|
9%
|
|
A
pension
|
8%
|
7%
|
9%
|
|
Free
job training
|
8%
|
7%
|
8%
|
|
Competition
|
6%
|
7%
|
5%
|
|
Prestige
|
5%
|
7%
|
4%
|
|
Equal
opportunity employer
|
5%
|
7%
|
4%
|
|
Flexibility
to change careers
|
5%
|
6%
|
4%
|
|
Paid
university education
|
5%
|
7%
|
5%
|
|
Training
|
5%
|
7%
|
4%
|
|
Physical
challenge
|
4%
|
4%
|
4%
|
|
Mentorship
|
4%
|
4%
|
4%
|
|
Don’t
know/Prefer not to answer
|
1%
|
2%
|
1%
|
Respondents
were asked if they were confident that they will find a career that meets the
three expectations they selected. Over 40% of those who selected one of the
following career expectations are very confident they will have a career that meets
their expectations: intellectual and physical challenges, training,
competition, respect, and opportunities for advancement and to find jobs in
their field. Slightly fewer respondents are very confident that they will have
a career that offers them the financial and economic benefits they are looking
for, including 31% of those who selected good pay and 35% of those who expect a
pension. Visible minorities are less confident than non-visible minority
respondents that they will find a career with plenty of job opportunities (38%
vs 49%), opportunities for advancement (33% vs 44%), prestige (31% vs 40%) and
a positive work environment (28% vs 37%). Non-visible minorities are less
certain they will find a job with benefits (32% vs 42%), good pay (29% vs 37%),
free job training (24% vs 31%) and mentorship (21% vs 39%). It should be noted
that the differences between visible and non-visible minority respondents are
not statistically significant for this series of questions, with the exception
their expectations around good pay.
There
are several other notable demographic differences, including:
§ Respondents aged 19-20 are the least confident they will
have a job with a pension (42% not confident) compared to 17-18 year-olds (18%)
and 21-23 year-olds (21%).
§ Women are also less confident than men that they will
have a pension (31% not confident compared to 18%, but the difference is not statistically
significant).
§ Those with a household income of between $40K to $80K are
less confident (35%) than those with a household income of less than $40K (18%)
and over $80K (20%) that they will have a pension (the differences are not
statistically significant).
§ Respondents aged 21-23 are more likely than younger
respondents to be very confident they will find an intellectually challenging
career (69%), compared to those aged 19-20 (51%) and 17-18 (50%).
Exhibit
A2: Q13: And how confident are you that you will have a career that
offers…?
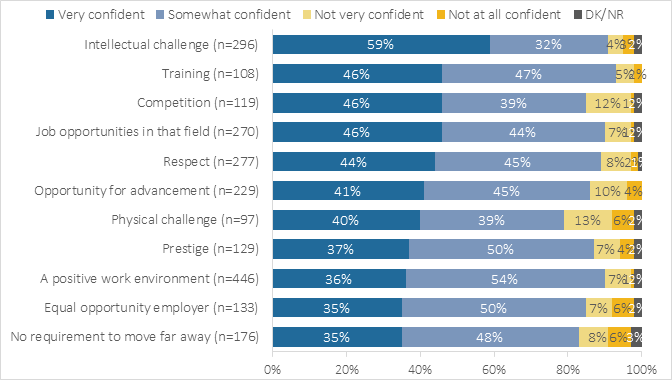
Exhibit
A3: Q13: And how confident are you that you will have a career that
offers…?
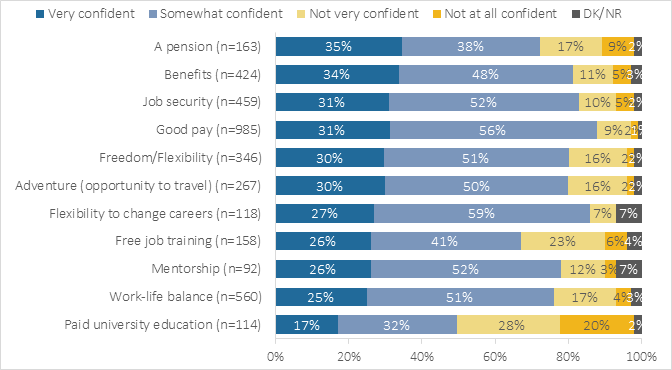
Exhibit
A4: Q13: And how confident are you that you will have a career that
offers…?
|
Confidence
in Fulfilling Expectations - % Very Confident
|
|
|
Gen Pop
|
Visible Minority
|
Non-Visible Minority
|
|
Intellectual
challenge (n=296/125/171)
|
59%
|
58%
|
59%
|
|
Training
(n=108/71/37)
|
46%
|
46%
|
46%
|
|
Competition
(n=119/63/56)
|
46%
|
43%
|
48%
|
|
Job
opportunities in that field (n=270/125/145)
|
46%
|
38%
|
49%
|
|
Respect
(n=277/156/121)
|
44%
|
44%
|
44%
|
|
Opportunity
for advancement (n=229/122/107)
|
41%
|
33%
|
44%
|
|
Physical
challenge (n=97/53/44)
|
40%
|
40%
|
40%
|
|
Prestige
(n=129/84/45)
|
37%
|
31%
|
40%
|
|
A
positive work environment (n=446/186/260)
|
36%
|
28%
|
37%
|
|
Equal
opportunity employer (n=133/85/48)
|
35%
|
34%
|
36%
|
|
No
requirement to move far away (n=176/89/87)
|
35%
|
35%
|
36%
|
|
A
pension (n=163/74/89)
|
35%
|
35%
|
35%
|
|
Benefits
(n=424/186/238)
|
34%
|
42%
|
32%
|
|
Job
security (n=459/254/205)
|
31%
|
30%
|
32%
|
|
Good
pay (n=985/457/528)
|
31%
|
37%
|
29%
|
|
Freedom/Flexibility
(n=346/166/180)
|
30%
|
33%
|
29%
|
|
Adventure (opportunity to
travel) (n=267/130/137)
|
30%
|
31%
|
29%
|
|
Flexibility
to change careers (n=118/70/48)
|
27%
|
32%
|
25%
|
|
Free
job training (n=158/76/82)
|
26%
|
31%
|
24%
|
|
Mentorship
(n=92/51/41)
|
26%
|
39%
|
21%
|
|
Work-life
balance (n=560/265/295)
|
25%
|
25%
|
25%
|
|
Paid
university education (n=114/68/46)
|
17%
|
22%
|
14%
|
When
asked which three attributes matter the least when choosing a career, physical
challenge (40% say it matters least) and prestige (34%) matter the least when
respondents are making career decisions, followed by competition (25%) and
avoiding moving (24%). More non-visible minorities feel prestige matters least
(36%) compared to visible minority respondents (27%). Other notable differences
are:
§ More women do not prioritize physical challenge (47% say
it is one of the least important attributes) compared to men (33%), along with
prestige (39% vs 28%). Men are less concerned with finding an equal opportunity
employer (17% vs 7% of women) or an intellectually challenging job (15% vs 12%
of women).
§ Older respondents aged 19-20 and 21-23 are less
interested in prestige (35% and 37% respectively) than the youngest group (27%).
§ More respondents from BC are less concerned about good
pay (13%) and job security (10%) than those from other regions, particularly
when compared to Atlantic Canada (2% say good pay is among the least important),
Quebec (4% say good pay and job security are among the least important), and
Alberta (3% say job security is among the least important).
Exhibit
A5: Q14: And, can you identify which three matter the least to you in
making career decisions?
|
Least
Important Career Motivations
|
|
|
Gen Pop
(n=1995)
|
Visible Minority
(n=987)
|
Non-Visible Minority (n=1008)
|
|
Physical
challenge
|
40%
|
37%
|
41%
|
|
Prestige
|
34%
|
27%
|
36%
|
|
Competition
|
25%
|
23%
|
26%
|
|
No
requirement to move away
|
24%
|
22%
|
24%
|
|
Mentorship
|
19%
|
18%
|
19%
|
|
Adventure
(opportunity to travel)
|
19%
|
20%
|
18%
|
|
Paid
university education
|
18%
|
17%
|
19%
|
|
Intellectual
challenge
|
13%
|
14%
|
13%
|
|
Equal
opportunity employer
|
12%
|
11%
|
12%
|
|
Flexibility
to change careers
|
11%
|
10%
|
11%
|
|
Respect
|
11%
|
10%
|
11%
|
|
A
pension
|
9%
|
11%
|
8%
|
|
Free
job training
|
9%
|
8%
|
9%
|
|
Training
|
7%
|
7%
|
7%
|
|
Freedom/Flexibility
|
6%
|
8%
|
5%
|
|
Good
pay
|
5%
|
9%
|
4%
|
|
Work-life
balance
|
5%
|
7%
|
4%
|
|
Job
security
|
5%
|
6%
|
5%
|
|
Opportunity
for advancement
|
5%
|
4%
|
5%
|
|
Job
opportunities in that field
|
5%
|
6%
|
4%
|
|
Positive
work environment
|
5%
|
6%
|
4%
|
|
Benefits
|
4%
|
5%
|
4%
|
|
None
of the above
|
2%
|
2%
|
2%
|
|
Don’t
know/Prefer not to answer
|
2%
|
2%
|
2%
|
Over
half (59%) are satisfied with their life right now, while 21% are dissatisfied
and 20% are neither satisfied nor dissatisfied. There are only small
differences between demographic groups, if at all.
Exhibit
A6: Q15: How satisfied would you say you are with your life right now?
|
Current
Life Satisfaction
|
|
|
Gen Pop
(n=2031)
|
Visible Minority
(n=1008)
|
Non-Visible Minority (n=1023)
|
|
Very
satisfied
|
15%
|
14%
|
16%
|
|
Somewhat
satisfied
|
44%
|
42%
|
44%
|
|
Neither
|
20%
|
24%
|
18%
|
|
Somewhat
dissatisfied
|
16%
|
15%
|
16%
|
|
Very
dissatisfied
|
5%
|
5%
|
5%
|
|
Don’t
know/Prefer not to answer
|
1%
|
1%
|
0%
|
When
asked to choose from a list the top five most important values or character
traits to them, respondents most often selected being of good character (43%), successful
(39%), learning continuously (38%), loyalty (37%) and compassion (37%).
Heroism (7%), respecting tradition (11%) and community service (14%) are the
least important. Of note, respecting tradition is more important to visible
minorities (17%) than non-visible minorities (9%). Being successful (44%) is
also slightly more important to visible minorities (44%) than non-visible
minorities (37%). There are other notable differences based on gender, age and
region:
§ Women place greater importance on good character (47% vs
39%), continuous learning (42% vs 33%), compassion (42% vs 30%) and loyalty (41%
vs 33%). Men, in comparison, more often prioritize success (44% vs 34%),
tackling important challenges (23% vs 15%), being proud to be Canadian (22% vs
12%), respecting tradition (13% vs 9%) and being heroic (10% vs 4%).
§ The 21-23 age group is more likely to prioritize
continuous learning (40%) and being fun-loving (32%) than the younger age
groups: 38% of those 19-20 and 33% of those 17-18 prioritize continuous
learning, and 27% of both age categories prioritize being fun-loving.
§ Quebecers have a different set of important values than
respondents from the rest of the regions: determination (49%), freedom (42%)
and being fun-loving (40%) make up their top three.
Exhibit
B1: Q16: Below is a list of values or character traits that may be
important to some people and unimportant to others. Please rank the five that
are most important to you personally?
|
Importance
of Values / Character Traits – Among Top Five
|
|
|
Gen Pop
(n=2031)
|
Visible Minority
(n=1008)
|
Non-Visible Minority (n=1023)
|
|
Being
of good character
|
43%
|
44%
|
42%
|
|
Being
successful
|
39%
|
44%
|
37%
|
|
Continuous
learning
|
38%
|
38%
|
37%
|
|
Being
loyal
|
37%
|
35%
|
37%
|
|
Being
compassionate
|
37%
|
33%
|
38%
|
|
Thinking
independently
|
36%
|
35%
|
36%
|
|
Freedom
to choose one’s path
|
34%
|
31%
|
35%
|
|
Being
determined/perseverant
|
33%
|
31%
|
34%
|
|
Making
a difference
|
34%
|
30%
|
35%
|
|
Being
creative
|
30%
|
30%
|
30%
|
|
Being
fun-loving
|
29%
|
29%
|
29%
|
|
Being
tolerant of others
|
24%
|
22%
|
24%
|
|
Curiosity
|
20%
|
20%
|
20%
|
|
Tackling
important challenges
|
19%
|
19%
|
19%
|
|
Being
proud to be Canadian
|
17%
|
16%
|
17%
|
|
Being
of service to one’s community
|
14%
|
16%
|
14%
|
|
Respecting
tradition
|
11%
|
17%
|
9%
|
|
Being
heroic
|
7%
|
9%
|
6%
|
When
asked to provide unprompted answers describing the three things they most want
to achieve in life, a fulfilling career (42%), a family (33%) and being happy (25%)
are the top three responses, followed by financial stability (19%) and travel
(18%). Having a family (35%) and travel (20%) are more important to
non-minority respondents than visible minorities (29% and 14%, respectively).
Women are more likely than men to want a family (37% vs 29%), a good job (46%
vs 33%), happiness (30% vs 20%) and to travel (24% vs 13%). Men are more
likely to name wealth (22% vs 10%) as an important life achievement. Those aged
19-20 (49%) are most focused on finding a good, fulfilling career, compared to
those 17-18 (41%) and 21-23 (39%).
Exhibit
B2: Q17: What are the three things you most want to achieve in life? [OPEN
END] *excludes DK/NR/None/Nothing
|
Most
Important Life Achievements
|
|
|
Gen Pop
(n=1635)
|
Visible Minority
(n=781)
|
Non-Visible Minority (n=854)
|
|
A
good, fulfilling career
|
42%
|
41%
|
43%
|
|
Have
a family
|
33%
|
29%
|
35%
|
|
To
be happy
|
25%
|
23%
|
26%
|
|
Financial
stability
|
19%
|
22%
|
18%
|
|
To
travel
|
18%
|
14%
|
20%
|
|
To
have money
|
15%
|
18%
|
14%
|
|
To
be successful
|
14%
|
19%
|
12%
|
|
To
have a home
|
12%
|
11%
|
12%
|
|
To
be healthy
|
8%
|
10%
|
8%
|
|
Finish
school
|
8%
|
9%
|
7%
|
|
Make
a difference
|
7%
|
6%
|
8%
|
|
To
get married
|
7%
|
7%
|
7%
|
|
Have
a good, comfortable life
|
6%
|
7%
|
6%
|
|
Help
others
|
6%
|
5%
|
6%
|
|
Being
a good, kind person
|
6%
|
6%
|
6%
|
|
To
be loved
|
5%
|
6%
|
5%
|
|
Have
children
|
4%
|
3%
|
5%
|
|
To
open a business
|
4%
|
5%
|
4%
|
|
To
have friends
|
3%
|
3%
|
4%
|
|
To
have a car
|
3%
|
2%
|
3%
|
|
Ability
to take care of/provide/support family
|
3%
|
3%
|
2%
|
|
Adventure
/ Fun
|
2%
|
2%
|
2%
|
|
Good
work/life balance
|
2%
|
3%
|
2%
|
|
To
be famous
|
2%
|
2%
|
2%
|
|
Be
independent
|
2%
|
1%
|
2%
|
|
Freedom
|
2%
|
2%
|
2%
|
|
To
fulfil/achieve my dreams
|
2%
|
2%
|
2%
|
|
Overall
well-being
|
2%
|
2%
|
2%
|
|
To
be creative
|
2%
|
1%
|
2%
|
|
Self-development/growth
|
2%
|
2%
|
2%
|
|
To
have good, meaningful relationships
|
2%
|
1%
|
2%
|
|
Stability
(unspecified)
|
1%
|
1%
|
1%
|
|
Retire
comfortably
|
1%
|
1%
|
1%
|
|
Safety/Security
|
1%
|
1%
|
1%
|
|
To
have a good/serving relationship with God
|
1%
|
1%
|
1%
|
|
To
be mentally healthy
|
1%
|
1%
|
1%
|
|
To
have animals/help animals
|
1%
|
1%
|
1%
|
|
Help
the environment
|
1%
|
0%
|
1%
|
|
To
be debt free
|
1%
|
1%
|
1%
|
|
To
own property
|
1%
|
1%
|
1%
|
|
More
time (for family, friends, hobbies, etc.)
|
1%
|
1%
|
0%
|
|
To
be proud/make parents proud
|
1%
|
1%
|
1%
|
|
None/Nothing
|
0%
|
0%
|
0%
|
|
Other
|
7%
|
9%
|
6%
|
When
asked to rate the importance of several goals, well over half place great
importance on work-life balance (69% very important), full-time employment
(63%), and being financially successful (61%) and proud of one’s career (61%).
Fame (8%), peer recognition (20%) and community engagement (22%) are the least
important. Being financially successful is even more important to visible
minorities than non-visible minorities (67% vs 59%), along with having a clear
career path (50% vs 36%), being recognized by peers (27% vs 17%) and being
famous (14% vs 6%). Other notable differences include:
§ Men would like to be recognized by their peers (25% very
important) more than women do (15%). Women are more likely to aspire to getting
married (53%) and having children (45%), compared to men (46% and 38%,
respectively).
§ While most feel it is important, home ownership (58% very
important) is a higher priority for respondents aged 21-23 than the younger age
groups (49% of 17-18 year-olds and 50% of 19-20 year-olds). Work-life balance
is also more important to the older group (72%), compared to the 17-18 (67%)
and 19-20 year-olds (66%).
Exhibit
B3: Q18: There are many different types of goals people might have for
their life. For each of the following, please indicate how important, if at
all, each goal is to you personally.
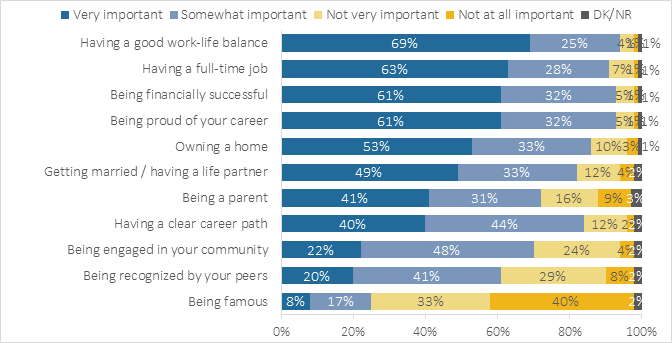
Exhibit
B4: Q18: There are many different types of goals people might have for
their life. For each of the following, please indicate how important, if at
all, each goal is to you personally.
|
Life
Goals - % Very Important
|
|
|
Gen Pop
(n=2031)
|
Visible Minority
(n=1008)
|
Non-Visible Minority
(n=1023)
|
|
Having
a good work-life balance
|
69%
|
69%
|
68%
|
|
Having
a full-time job
|
63%
|
65%
|
62%
|
|
Being
financially successful
|
61%
|
67%
|
59%
|
|
Being
proud of your career
|
61%
|
62%
|
61%
|
|
Owning
a home
|
53%
|
56%
|
52%
|
|
Getting
married/having a life partner
|
49%
|
49%
|
49%
|
|
Being
a parent
|
41%
|
41%
|
41%
|
|
Having
a clear career path
|
40%
|
50%
|
36%
|
|
Being
engaged in your community
|
22%
|
30%
|
18%
|
|
Being
recognized by your peers
|
20%
|
27%
|
17%
|
|
Being
famous
|
8%
|
14%
|
6%
|
Few (7%)
are very familiar with the CAF, while a third are somewhat familiar. Over half
(59%) are not familiar including 44% who are not very familiar and 15% who are
not at all familiar with the CAF. Visible minorities are more familiar with the
CAF (45% very or somewhat familiar) than non-visible minorities (37%).
Familiarity is also higher among:
§ Men (46%) than women (32%);
§ Indigenous respondents (58%) than
non-Indigenous respondents (39%);
§ Atlantic Canadians (56%) than Quebecers (28%), Ontarians
(40%), Albertans (43%) and those in Manitoba and Saskatchewan (37%); and,
§ Those who have completed high school (40%), college (44%)
or university (46%) than those who have not completed high school (26%).
Exhibit
C1: Q22: How familiar are you with the Canadian Armed Forces?
|
Familiarity
with the CAF
|
|
|
Gen Pop (n=2031)
|
Visible Minority (n=1008)
|
Non-Visible Minority (n=1023)
|
|
Very
familiar
|
7%
|
8%
|
6%
|
|
Somewhat
familiar
|
33%
|
37%
|
31%
|
|
Not
very familiar
|
44%
|
37%
|
47%
|
|
Not
at all familiar
|
15%
|
16%
|
15%
|
|
Don’t
know/Prefer not to answer
|
1%
|
2%
|
0%
|
Two-thirds
(68%) have a favourable opinion of the CAF in general and, though one quarter
do not offer an opinion, half (53%) have a positive impression of the CAF as an
employer. When it comes to the CAF in general, impressions do not vary much
between various segments of the population. One notable exception is that
Atlantic Canadians have a much more positive view of the CAF (80% very or
somewhat favourable) than respondents from other regions.
When
asked to rate the CAF as an employer, certain groups are more likely not to
offer a response, including:
§ Women (32% compared to 21% of men);
§ Ontarians (30%, compared to British Columbians at 20%);
and
§ Those who have not completed high school (32%) or have
only completed high school (30%) compared to those who have a college diploma
(23%) or have a bachelor’s degree/postgraduate degree (17%).
Exhibit
C2: Q23: Generally speaking, would you say that you have a very favourable,
somewhat favourable, not very favourable, or not at all favourable opinion of
the Canadian Armed Forces?
Q25.
Would you say you have a very favourable, somewhat favourable, not very
favourable, or not at all favourable opinion of the Canadian Armed Forces as an
employer?
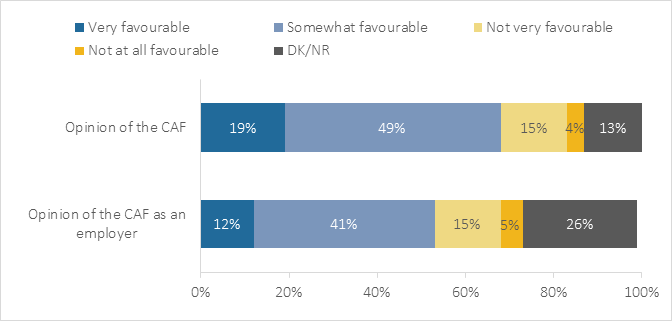
Exhibit C3: Q23: Generally
speaking, would you say that you have a very favourable, somewhat favourable,
not very favourable, or not at all favourable opinion of the Canadian Armed
Forces?
|
Opinion
of the CAF
|
|
|
Gen Pop (n=2031)
|
Visible Minority (n=1008)
|
Non-Visible Minority (n=1023)
|
|
Very
favourable
|
19%
|
16%
|
20%
|
|
Somewhat
favourable
|
49%
|
49%
|
48%
|
|
Not
very favourable
|
15%
|
14%
|
15%
|
|
Not
at all favourable
|
4%
|
4%
|
5%
|
|
Don’t
know/Prefer not to answer
|
14%
|
17%
|
12%
|
Exhibit
C4: Q25: Would you say that you have a very favourable, somewhat
favourable, not very favourable, or not at all favourable opinion of the
Canadian Armed Forces as an employer?
|
Opinion
of the CAF As an Employer
|
|
|
Gen Pop (n=2031)
|
Visible Minority (n=1008)
|
Non-Visible Minority (n=1023)
|
|
Very
favourable
|
12%
|
11%
|
13%
|
|
Somewhat
favourable
|
41%
|
40%
|
41%
|
|
Not
very favourable
|
15%
|
16%
|
15%
|
|
Not
at all favourable
|
5%
|
6%
|
5%
|
|
Don’t
know/Prefer not to answer
|
26%
|
27%
|
26%
|
A
quarter of those with a highly favourable impression of the CAF say they feel
this way out of respect for the sacrifices its members make (26%) and the
protection they provide (25%). Other reasons include the CAF’s reputation
(11%), its members service (11%) and the sense that they do important work
(10%). Non-visible minorities are more likely to have a very favourable view of
the military because they know someone in the CAF (10% vs 3%), though the
difference is not statistically significant. Across the country, the source of
favourable impressions varies slightly:
§ Over a third (38%) in Alberta say they have a very
favourable impression of the CAF because they respect the sacrifices its
members make, a significantly higher percentage than in BC (8%).
§ More in Ontario (14%) have a very favourable impression
of the CAF because of its reputation, in contrast to Quebec (4%).
§ Ontarians are more likely to have a very favourable
impression because they know someone in the CAF (13%), particularly compared to
Atlantic Canadians (2%).
Exhibit
C5: Q24: [IF VERY FAVOURABLE OPINION OF CAF] Why do you say that?
|
Favourable
Impressions of the CAF
|
|
|
Gen Pop
(n=2031)
|
Visible Minority
(n=1008)
|
Non-Visible Minority (n=1023)
|
|
Respect/Respect
them for sacrifices they make
|
26%
|
23%
|
27%
|
|
They
protect us/our country
|
25%
|
22%
|
26%
|
|
Great
reputation
|
11%
|
9%
|
12%
|
|
They
serve our country
|
11%
|
10%
|
11%
|
|
They
do important/good work
|
10%
|
12%
|
9%
|
|
I
know someone in the military
|
8%
|
3%
|
10%
|
|
Respected
job/Good career choice
|
8%
|
10%
|
7%
|
|
Ensure
that peace is kept
|
6%
|
7%
|
5%
|
|
They
serve for our freedom
|
4%
|
2%
|
5%
|
|
I
am part of/have been part of Cadets
|
4%
|
2%
|
5%
|
|
Known
to be well trained
|
3%
|
1%
|
3%
|
|
Offers
good opportunities
|
3%
|
3%
|
3%
|
|
I
want to become a member of the CAF
|
2%
|
4%
|
1%
|
|
No
reason
|
1%
|
0%
|
2%
|
|
They
are heroic/Heroes
|
1%
|
0%
|
1%
|
|
Other
|
5%
|
7%
|
4%
|
|
Don’t
know/Prefer not to answer
|
6%
|
6%
|
6%
|
Those
with a completely unfavourable impression associate the CAF with war and
violence (28%), do not respect the CAF (14%) or are not very interested in the
army (10%). Non-visible minorities are more likely than visible minorities to
have a not at all favourable impression because they associate the CAF with
violence (31% vs 17%) and do not respect the CAF (17% vs 7%) though the
differences are not statistically significant.
Exhibit
C6: Q24: [IF NOT AT ALL FAVOURABLE OPINION OF CAF] Why do you say that?
|
Unfavourable
Impressions of the CAF
|
|
|
Gen Pop
(n=86)
|
Visible Minority
(n=40*)
|
Non-Visible Minority (n=46*)
|
|
Associate
with war/violence/global unrest
|
28%
|
17%
|
31%
|
|
I
don’t respect anything about the CAF
|
14%
|
7%
|
17%
|
|
Not
interested in the army
|
10%
|
14%
|
9%
|
|
No reason
|
9%
|
10%
|
9%
|
|
Respected
job/Good career choice
|
1%
|
0%
|
2%
|
|
I
am part of/have been part of Cadets
|
1%
|
0%
|
2%
|
|
Great
reputation
|
1%
|
3%
|
0%
|
|
Other
|
12%
|
14%
|
11%
|
|
Don’t
know/Prefer not to answer
|
24%
|
36%
|
20%
|
*Small
sample size, results should be considered qualitative in nature and interpreted
with caution.
Under
a third (28%) are knowledgeable of opportunities within the CAF, and fewer (23%)
are familiar with opportunities within the Reserve Force. Visible minorities
tend to be slightly more familiar with opportunities in both the CAF (32%) and
the Reserve Force (27%) than non-visible minorities (27% and 22%, respectively),
but the differences are not statistically significant. More striking contrasts
are found between the following groups:
Opportunities
within the CAF:
§ Just 20% of women, compared to 37% of men consider
themselves knowledgeable;
§ Indigenous respondents are more knowledgeable (46%) than
non-Indigenous respondents (28%);
§ Respondents in BC (41%) and Atlantic Canada (40%) are
more knowledgeable than those in other regions, specifically Quebec (26%),
Ontario (25%) and Manitoba/Saskatchewan (26%); and,
§ Those who have completed either college (35%) or
university (35%) are more knowledgeable than those who have not (19% of those
with some high school or less and 26% of those who have graduated high school).
Similar
patterns exist when it comes to knowledge of opportunities within the Reserve
Force:
§ Men (29%) claim to be more knowledgeable than women
(16%);
§ Indigenous respondents are more knowledgeable (48%) than
non-Indigenous respondents (21%);
§ Respondents in Atlantic Canada (38%) and BC (30%) are
more knowledgeable than those in other regions, Ontario in particular (18%);
and,
§ Those who have completed either college (28%) or
university (29%) are more knowledgeable than those who have not (18% of those
with some high school or less and 19% of those who have graduated high school).
Exhibit
C7: Q28: How knowledgeable do you feel you are about career opportunities
within the Canadian Armed Forces?
Q30.
How knowledgeable do you feel you are about opportunities within the Reserve
Force in the Canadian Armed Forces?
Exhibit
C8: Q28: How knowledgeable do you feel you are about career opportunities
within the Canadian Armed Forces?
|
Knowledgeable
about Opportunities within the CAF
|
|
|
Gen Pop (n=2031)
|
Visible Minority (n=1008)
|
Non-Visible Minority (n=1023)
|
|
Very
knowledgeable
|
4%
|
5%
|
4%
|
|
Somewhat
knowledgeable
|
24%
|
27%
|
23%
|
|
Not
very knowledgeable
|
39%
|
36%
|
40%
|
|
Not
at all knowledgeable
|
28%
|
28%
|
28%
|
|
Don’t
know/Prefer not to answer
|
4%
|
4%
|
4%
|
Exhibit
C9: Q30: How knowledgeable do you feel you are about opportunities within
the Reserve Force in the Canadian Armed Forces?
|
Knowledgeable
about Opportunities within the Reserve Force
|
|
|
Gen Pop (n=2031)
|
Visible Minority (n=1008)
|
Non-Visible Minority (n=1023)
|
|
Very
knowledgeable
|
4%
|
4%
|
4%
|
|
Somewhat
knowledgeable
|
19%
|
21%
|
18%
|
|
Not
very knowledgeable
|
39%
|
35%
|
40%
|
|
Not
at all knowledgeable
|
34%
|
34%
|
35%
|
|
Don’t
know/Prefer not to answer
|
4%
|
5%
|
3%
|
One-in-five
are likely to consider a career in the CAF. Few (17%) of those who are not
likely to pursue a career with the CAF have thought about it before. Visible
minorities are more likely (29%) than non-visible minorities (16%) to be very
or somewhat likely to consider a career in the CAF. Other groups more likely to
consider a career in the CAF include:
§ Men (26%) compared to women (14%);
§ Indigenous respondents (52%) compared to non-Indigenous
respondents (18%); and,
§ Respondents from BC (29%), particularly compared to
respondents from Atlantic Canada (16%), Quebec (15%) and Ontario (18%).
Exhibit
C10: Q26: Today, how likely are you to consider a career in the Canadian
Armed Forces?
|
Likelihood
to Consider a Career in the CAF
|
|
|
Gen Pop (n=2031)
|
Visible Minority (n=1008)
|
Non-Visible Minority (n=1023)
|
|
Very
likely
|
4%
|
6%
|
3%
|
|
Somewhat
likely
|
16%
|
23%
|
13%
|
|
Not
very likely
|
36%
|
31%
|
38%
|
|
Not
at all likely
|
41%
|
35%
|
43%
|
|
Don’t
know/Prefer not to answer
|
4%
|
6%
|
3%
|
Exhibit
C11: Q27: [IF NOT VERY LIKELY OR NOT AT ALL LIKELY] Have you ever
considered a career in the Canadian Armed Forces?
|
Likelihood
to Consider a Career in the CAF
|
|
|
Gen Pop (n=1478)
|
Visible Minority (n=654)
|
Non-Visible Minority (n=824)
|
|
Yes
|
17%
|
14%
|
18%
|
|
No
|
80%
|
83%
|
80%
|
|
Don’t
know/Prefer not to answer
|
2%
|
3%
|
2%
|
Half (52%)
would be likely to pursue a career in the CAF if they knew it was possible to
do so in the fields they find most interesting. Among those who initially said
they would be likely to pursue a career in the CAF, 36% would be very likely to
consider it if they could pursue a career in one of the fields of greatest
interest to them. Among those who initially said they would not be very likely
to consider a career in the CAF, over half (60%) would be very or somewhat
likely to consider it if it meant working in a field that interests them. Among
those who said they would not be likely at all to consider a career in the CAF,
just under a third (30%) would be willing to do so, contingent upon being able
to work in the field of their choice.
Turning
to demographic differences, if offered the chance to work in the field that is
of greatest interest to them, 60% of visible minorities and 50% or non-visible
minorities would be likely to consider applying to the CAF. Slightly more men
(56%) than women (50%) would consider applying, but the increase in the
proportion who would be interested in joining the CAF is larger among women
(+36%) than among men (+30%).
Exhibit
C12: Q29: If you found it was possible to pursue a career [INSERT RESPONSE
AT Q10 OR “OF INTEREST TO YOU”] as a member of the Canadian Armed Forces, how
likely would you be to consider applying to the Canadian Armed Forces?
|
Likelihood
to Pursue Preferred Career Field in the CAF
|
|
|
Gen Pop (n=2031)
|
Visible Minority (n=1008)
|
Non-Visible Minority (n=1023)
|
|
Very
likely
|
11%
|
15%
|
10%
|
|
Somewhat
likely
|
41%
|
45%
|
40%
|
|
Not
very likely
|
28%
|
25%
|
29%
|
|
Not
at all likely
|
14%
|
10%
|
16%
|
|
Don’t
know/Prefer not to answer
|
6%
|
6%
|
6%
|
Just
under half (45%) would be interested in joining the CAF Reserves. A larger
percentage of visible minorities (51%) than non-visible minorities (43%) would
be interested in joining the CAF Reserves. The CAF Reserves are particularly
appealing to the following:
§ Indigenous respondents (68% interested in joining
compared to 44% of non-Indigenous respondents);
§ Male respondents (50% compared to 41% of women);
§ Respondents in BC (57%, compared to a low of 37% in
Manitoba/Saskatchewan); and,
§ Those who have completed college (51%, compared to those
with a high school diploma at 41% and those with a university degree at 43%).
Exhibit
C13: Q31: Reservists usually have a full-time job or attend school during
the daytime and work on a part-time basis with the Canadian Armed Forces.
Reservists play an important role in supporting Canadian operations both at
home and abroad (e.g., Helping with flood relief efforts in Quebec and
Manitoba). Reservists are also active in their communities and help with
cultural events, parades, festivals and other public events in communities
across Canada (e.g., the 2010 Winter Olympics in Vancouver). Part-time members
may also choose to serve overseas, when there are opportunities available. How
interested would you be in joining the Canadian Armed Forces Reserves?
|
Interest
in Joining the CAF Reserves
|
|
|
Gen Pop (n=2031)
|
Visible Minority (n=1008)
|
Non-Visible Minority (n=1023)
|
|
Very
interested
|
9%
|
12%
|
8%
|
|
Somewhat
interested
|
36%
|
39%
|
34%
|
|
Not
very interested
|
28%
|
27%
|
28%
|
|
Not
at all interested
|
22%
|
15%
|
24%
|
|
Don’t
know/Prefer not to answer
|
5%
|
7%
|
4%
|
Significantly
fewer agree than disagree that they could see themselves joining any
environment of the CAF. This includes the CAF broadly (net score of -37%,
calculated by subtracting the % disagree from the % agree), the Royal Canadian
Navy (-52%), the Royal Canadian Air Force (-47%) and the Canadian Army (-42%). Opinion
is more evenly split over whether one’s family (-4%) or friends (+2%) would
encourage them to join. Significantly more agree than disagree that the CAF
offers a wide variety of professions (+49%), opens doors to careers outside the
CAF (+33%) and that they would be proud to be in the CAF (+32%). Over half
agree (60%) that a career in the CAF makes it difficult to raise a family.
The
most pronounced differences between visible minorities and non-visible
minorities are for the statements dealing with joining the CAF. For example,
28% of visible minorities could see themselves joining the Navy, compared to
17% of non-visible minorities. Other differences include that non-minorities
are more likely to agree that the CAF offers a wide variety of professions (27%
vs 20% strongly agree) and that they know people who could have a great career
in the CAF (20% vs 15% strongly agree).
Men
(35%) are more likely than women (21%) to agree that they could see themselves
joining the CAF. They are also more likely to believe the workplace environment
in the CAF is respectful of women (51% of men agree, compared to 44% of women).
Regionally,
respondents in BC are most likely to agree they could see themselves joining
the CAF (37%), the Royal Canadian Air Force (31%) or the Royal Canadian Navy
(30%). Respondents in Atlantic Canada are more likely to agree that their
family (58%) and friends (63%) would encourage them to join the CAF. The
perception that a career in the CAF makes it hard to raise a family is
strongest in Quebec (67% agree).
Exhibit
C14: Q32: To what extent do you agree or disagree with each of the
following statements.
Exhibit
C15: Q32: To what extent do you agree or disagree with each of the
following statements.
|
Attitudinal
Statement: I could see myself joining the Royal Canadian Navy
|
|
|
Gen Pop (n=2031)
|
Visible Minority (n=1008)
|
Non-Visible Minority (n=1023)
|
|
Strongly
agree
|
4%
|
6%
|
3%
|
|
Somewhat
agree
|
16%
|
22%
|
14%
|
|
Somewhat
disagree
|
27%
|
27%
|
28%
|
|
Strongly
disagree
|
45%
|
34%
|
49%
|
|
Don’t
know/Prefer not to answer
|
8%
|
11%
|
7%
|
Exhibit
C16: Q32: To what extent do you agree or disagree with each of the
following statements.
|
Attitudinal
Statement: I could see myself joining the Royal Canadian Air Force
|
|
|
Gen Pop (n=2031)
|
Visible Minority (n=1008)
|
Non-Visible Minority (n=1023)
|
|
Strongly
agree
|
6%
|
8%
|
5%
|
|
Somewhat
agree
|
17%
|
23%
|
14%
|
|
Somewhat
disagree
|
27%
|
28%
|
26%
|
|
Strongly
disagree
|
43%
|
30%
|
48%
|
|
Don’t
know/Prefer not to answer
|
8%
|
11%
|
7%
|
Exhibit
C17: Q32: To what extent do you agree or disagree with each of the
following statements.
|
Attitudinal
Statement: I could see myself joining the Canadian Army
|
|
|
Gen Pop (n=2031)
|
Visible Minority (n=1008)
|
Non-Visible Minority (n=1023)
|
|
Strongly
agree
|
6%
|
9%
|
5%
|
|
Somewhat
agree
|
19%
|
21%
|
18%
|
|
Somewhat
disagree
|
28%
|
29%
|
27%
|
|
Strongly
disagree
|
39%
|
30%
|
42%
|
|
Don’t
know/Prefer not to answer
|
8%
|
11%
|
7%
|
Exhibit
C18: Q32: To what extent do you agree or disagree with each of the
following statements.
|
Attitudinal
Statement: I could see myself joining the Canadian Armed Forces
|
|
|
Gen Pop (n=2031)
|
Visible Minority (n=1008)
|
Non-Visible Minority (n=1023)
|
|
Strongly
agree
|
7%
|
9%
|
6%
|
|
Somewhat
agree
|
21%
|
27%
|
19%
|
|
Somewhat
disagree
|
30%
|
28%
|
30%
|
|
Strongly
disagree
|
35%
|
27%
|
38%
|
|
Don’t
know/Prefer not to answer
|
8%
|
10%
|
7%
|
Exhibit
C19: Q32: To what extent do you agree or disagree with each of the
following statements.
|
Attitudinal
Statement: My family would encourage me to join the Canadian Armed Forces if
it were of interest to me
|
|
|
Gen Pop (n=2031)
|
Visible Minority (n=1008)
|
Non-Visible Minority (n=1023)
|
|
Strongly
agree
|
12%
|
12%
|
12%
|
|
Somewhat
agree
|
31%
|
29%
|
32%
|
|
Somewhat
disagree
|
23%
|
24%
|
22%
|
|
Strongly
disagree
|
24%
|
23%
|
24%
|
|
Don’t
know/Prefer not to answer
|
11%
|
12%
|
10%
|
Exhibit
C20: Q32: To what extent do you agree or disagree with each of the
following statements.
|
Attitudinal
Statement: People join the Canadian Armed Forces when they have few other
options available
|
|
|
Gen Pop (n=2031)
|
Visible Minority (n=1008)
|
Non-Visible Minority (n=1023)
|
|
Strongly
agree
|
8%
|
9%
|
8%
|
|
Somewhat
agree
|
32%
|
33%
|
31%
|
|
Somewhat
disagree
|
31%
|
32%
|
31%
|
|
Strongly
disagree
|
15%
|
11%
|
17%
|
|
Don’t
know/Prefer not to answer
|
14%
|
15%
|
13%
|
Exhibit
C21: Q32: To what extent do you agree or disagree with each of the
following statements.
|
Attitudinal
Statement: My friends would encourage me to join the Canadian Armed Forces
if it were of interest to me
|
|
|
Gen Pop (n=2031)
|
Visible Minority (n=1008)
|
Non-Visible Minority (n=1023)
|
|
Strongly
agree
|
11%
|
11%
|
11%
|
|
Somewhat
agree
|
34%
|
36%
|
33%
|
|
Somewhat
disagree
|
24%
|
25%
|
23%
|
|
Strongly
disagree
|
19%
|
16%
|
20%
|
|
Don’t
know/Prefer not to answer
|
12%
|
12%
|
12%
|
Exhibit
C22: Q32: To what extent do you agree or disagree with each of the
following statements.
|
Attitudinal
Statement: The Canadian Armed Forces workplace environment is respectful of
women
|
|
|
Gen Pop (n=2031)
|
Visible Minority (n=1008)
|
Non-Visible Minority (n=1023)
|
|
Strongly
agree
|
13%
|
12%
|
13%
|
|
Somewhat
agree
|
34%
|
34%
|
34%
|
|
Somewhat
disagree
|
22%
|
21%
|
22%
|
|
Strongly
disagree
|
10%
|
9%
|
11%
|
|
Don’t
know/Prefer not to answer
|
21%
|
23%
|
20%
|
Exhibit
C23: Q32: To what extent do you agree or disagree with each of the
following statements.
|
Attitudinal
Statement: There are people I know who could have a great career in the
Canadian Armed Forces
|
|
|
Gen Pop
(n=2013)
|
Visible Minority
(n=1008)
|
Non-Visible Minority (n=1023)
|
|
Strongly
agree
|
19%
|
15%
|
20%
|
|
Somewhat
agree
|
37%
|
36%
|
37%
|
|
Somewhat
disagree
|
16%
|
19%
|
15%
|
|
Strongly
disagree
|
13%
|
11%
|
13%
|
|
Don’t
know/Prefer not to answer
|
16%
|
18%
|
15%
|
Exhibit
C24: Q32: To what extent do you agree or disagree with each of the
following statements.
|
Attitudinal
Statement: I think that the Canadian Armed Forces workplace environment is
respectful of all people regardless of cultural heritage
|
|
|
Gen Pop
(n=2013)
|
Visible Minority
(n=1008)
|
Non-Visible Minority (n=1023)
|
|
Strongly
agree
|
17%
|
17%
|
17%
|
|
Somewhat
agree
|
37%
|
39%
|
37%
|
|
Somewhat
disagree
|
20%
|
19%
|
20%
|
|
Strongly
disagree
|
9%
|
8%
|
9%
|
|
Don’t
know/Prefer not to answer
|
18%
|
18%
|
18%
|
Exhibit
C25: Q32: To what extent do you agree or disagree with each of the
following statements.
|
Attitudinal
Statement: I would be proud to be in the Canadian Armed Forces
|
|
|
Gen Pop
(n=2013)
|
Visible Minority
(n=1008)
|
Non-Visible Minority (n=1023)
|
|
Strongly
agree
|
20%
|
19%
|
20%
|
|
Somewhat
agree
|
39%
|
39%
|
39%
|
|
Somewhat
disagree
|
15%
|
17%
|
14%
|
|
Strongly
disagree
|
12%
|
9%
|
14%
|
|
Don’t
know/Prefer not to answer
|
14%
|
16%
|
13%
|
Exhibit
C26: Q32: To what extent do you agree or disagree with each of the
following statements.
|
Attitudinal
Statement: A career in the Canadian Armed Forces makes it difficult to raise
a family
|
|
|
Gen Pop
(n=2013)
|
Visible Minority
(n=1008)
|
Non-Visible Minority (n=1023)
|
|
Strongly
agree
|
17%
|
15%
|
17%
|
|
Somewhat
agree
|
43%
|
42%
|
43%
|
|
Somewhat
disagree
|
18%
|
19%
|
18%
|
|
Strongly
disagree
|
7%
|
8%
|
6%
|
|
Don’t
know/Prefer not to answer
|
15%
|
16%
|
15%
|
Exhibit
C27: Q32: To what extent do you agree or disagree with each of the
following statements.
|
Attitudinal
Statement: The Canadian Armed Forces also open doors to success in careers
outside of the Canadian Armed Forces
|
|
|
Gen Pop
(n=2013)
|
Visible Minority
(n=1008)
|
Non-Visible Minority (n=1023)
|
|
Strongly
agree
|
15%
|
15%
|
15%
|
|
Somewhat
agree
|
41%
|
38%
|
42%
|
|
Somewhat
disagree
|
16%
|
19%
|
15%
|
|
Strongly
disagree
|
7%
|
9%
|
6%
|
|
Don’t
know/Prefer not to answer
|
21%
|
20%
|
21%
|
Exhibit
C28: Q32: To what extent do you agree or disagree with each of the following
statements.
|
Attitudinal
Statement: There is a wide variety of professions within the Canadian Armed
Forces
|
|
|
Gen Pop
(n=2013)
|
Visible Minority
(n=1008)
|
Non-Visible Minority (n=1023)
|
|
Strongly
agree
|
25%
|
20%
|
27%
|
|
Somewhat
agree
|
41%
|
40%
|
42%
|
|
Somewhat
disagree
|
12%
|
17%
|
11%
|
|
Strongly
disagree
|
5%
|
4%
|
5%
|
|
Don’t
know/Prefer not to answer
|
16%
|
19%
|
15%
|
When
asked to choose the top three most compelling reasons to join the CAF from a
list, respondents feel paid education (37%), salary/benefits (35%) and helping
others (29%) are the most important. Travel appeals more to non-visible minorities
(29%) than visible minorities (24%), as does the opportunity to help others
(32% vs 25%). Other demographic differences include:
§ Women, more than men, find helping others (37% vs 23%),
travel (31% vs 24%), salary/benefits (41% vs 28%) and paid education (40% vs
34%) more compelling reasons. Men find service to the country (25% vs 17%),
interesting challenges (21% vs 15%) and transferable skills (15% vs 11%) more
persuasive.
§ The youngest age group (17-18 year-olds) are more
persuaded by the possibility of helping others (36%) compared to those aged
19-20 (29%) and 21-23 (27%). The salary and benefits are most compelling to
21-23 year-olds (39%), particularly compared to those 17-18 (30%).
§ The salary and benefits are distinctly important to
Quebecers (46%). Helping others is a bigger driver in Ontario (34%) and Alberta
(34%).
§ Those who are likely to join the CAF believe serving the
country is a more compelling argument (26%), along with training (18%) than
those who are not at all likely (16% and 8%, respectively).
Exhibit
C29: Q33a: Below is a list of factors that may make someone consider
pursuing a career in the Canadian Armed Forces. Regardless of your current
interest in a career in the Canadian Armed Forces, please rank the three most
compelling to you, personally.
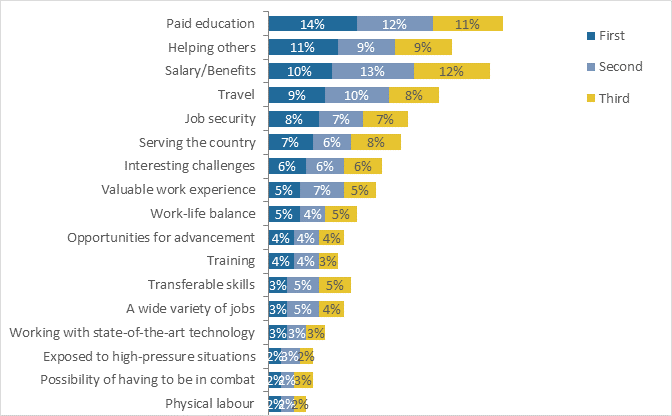
Exhibit
C30: Q33a: Below is a list of factors that may make someone consider
pursuing a career in the Canadian Armed Forces. Regardless of your current
interest in a career in the Canadian Armed Forces, please rank the three most
compelling to you, personally.
|
Most
Compelling Reasons to Consider a Career in the CAF - % Combined First,
Second and Third Ranking
|
|
|
Gen Pop
(n=2031)
|
Visible Minority
(n=1008)
|
Non-Visible Minority (n=1023)
|
|
Paid
education
|
37%
|
34%
|
38%
|
|
Salary/Benefits
|
35%
|
34%
|
36%
|
|
Helping
others
|
30%
|
25%
|
32%
|
|
Travel
|
27%
|
24%
|
29%
|
|
Job
security
|
22%
|
24%
|
21%
|
|
Serving
the country
|
21%
|
22%
|
20%
|
|
Interesting
challenges
|
18%
|
18%
|
18%
|
|
Valuable
work experience
|
17%
|
17%
|
16%
|
|
Work-life
balance
|
14%
|
15%
|
13%
|
|
Opportunities
for advancement
|
12%
|
13%
|
12%
|
|
Training
|
11%
|
13%
|
11%
|
|
Transferable
skills
|
13%
|
14%
|
13%
|
|
A
wide variety of jobs
|
12%
|
11%
|
12%
|
|
Working
with state-of-the-art technology
|
9%
|
10%
|
9%
|
|
Exposed
to high pressure situations
|
7%
|
10%
|
6%
|
|
Possibility
of having to be in combat
|
7%
|
9%
|
7%
|
|
Physical
labour
|
6%
|
8%
|
5%
|
Respondents
were asked which three reasons are the strongest arguments against a career in
the CAF. Exposure to danger (38%), being away from home and family (34%), and
the possibility of combat (33%) are the greatest deterrents. Non-visible
minorities are more concerned about being away from home and family (36%)
compared to visible minorities (29%), as well as the possibility of combat
(36%, compared to 25%). Other notable differences include:
§ Women are more deterred than men by the possibility of
combat (38%, compared to 29%), exposure to danger (45%, compared to 33%) and
being away from home (40% vs 29%).
§ Youth 17-18 years old are more concerned about giving up
their freedom than the older cohorts. A quarter view it is a reason not to join
the CAF, compared to 18% of those 19-20 and 17% of those 21-23.
§ Those interested in the CAF are more deterred by the
impact it would have on their work-life balance (23%), inability to utilize all
their talents in the CAF (14%) and job instability (11%) than those who are
less likely to join.
o Among those not very interested,16% are concerned about
work-life balance, 9% are concerned about their inability to utilize all their
talents and 5% are concerned about job instability; among those not at all
interested, 14% are concerned about work-life balance, 6% are concerned about
their inability to utilize all their talents and 6% are concerned about job
instability).
Exhibit
C31: Q33b: Below is a list of factors that may make someone decide NOT to
pursue a career in the Canadian Armed Forces. Which three of the following
best describe why you would avoid a career in the Canadian Armed Forces?
|
Most
Compelling Reasons NOT to Consider a Career in the CAF
|
|
|
Gen Pop
(n=2031)
|
Visible Minority
(n=1008)
|
Non-Visible Minority (n=1023)
|
|
Being
exposed to danger
|
38%
|
40%
|
38%
|
|
Being
away from home/family
|
34%
|
29%
|
36%
|
|
Possibility
of combat
|
33%
|
25%
|
36%
|
|
Giving
up your freedom
|
19%
|
18%
|
20%
|
|
Not
something I identify with
|
19%
|
15%
|
21%
|
|
Physical
labour
|
18%
|
18%
|
18%
|
|
Requires
a minimum commitment
|
16%
|
16%
|
16%
|
|
Work-life
balance
|
16%
|
17%
|
16%
|
|
Having
to follow orders
|
13%
|
11%
|
14%
|
|
Being
micro-managed
|
11%
|
11%
|
11%
|
|
Unable
to fully utilize one’s talent
|
9%
|
10%
|
8%
|
|
Boring
|
7%
|
10%
|
6%
|
|
Not
offer a positive work environment
|
7%
|
7%
|
7%
|
|
Lack
of representation of my gender or culture
|
7%
|
9%
|
7%
|
|
Salary/Benefits
|
7%
|
6%
|
7%
|
|
Limited
variety of jobs
|
6%
|
8%
|
5%
|
|
Job
instability
|
6%
|
9%
|
6%
|
|
Work
experience not helpful outside the CAF
|
6%
|
9%
|
5%
|
|
Limited
opportunities for advancement
|
5%
|
8%
|
4%
|
|
Not
offer flexibility to change careers
|
5%
|
8%
|
4%
|
|
Limited
job opportunities in skilled trades
|
4%
|
5%
|
4%
|
|
Not
respected
|
4%
|
4%
|
4%
|
|
Not
adventurous
|
3%
|
4%
|
3%
|
|
Not
prestigious
|
3%
|
5%
|
2%
|
|
Other
|
1%
|
0%
|
1%
|
When
asked how well a series of attributes describe a career in the CAF, physically
challenging (52% describes very well), training (42%), respect (35%) and
adventure (31%) are the most appropriate. Work-life balance (6%), no
requirement to move away (8%) and freedom/flexibility (8%) are the attributes
that worst describe a career in the CAF. These assessments are fairly
consistent across a wide range of demographic groups, with a few exceptions:
§ Men (19%) are more likely than women (15%) to believe
“equal opportunity employer” describes the CAF very well. They are also more
likely to believe that “no requirement to move away” describes the CAF very
well (10%), compared to women (5%).
§ Women (56%) are more likely than men (48%) to think that
“physically challenging” describes a career in the CAF very well.
§ The oldest cohort (aged 21-23) believe economic-based
attributes such as “job security”, “good pay” and “offers a pension” are very
good descriptors of a career in the CAF:
o Job security: 24% of those ages 21-23 say this term
describes a CAF career very well compared to 18% of 17-18 year-olds and 19% of
19-20 year-olds;
o Good pay: 21% of 21-23 year-olds compared to 12% of 17-18
year-olds and 15% of 19-20 year-olds;
o Offers a pension: 32% of 21-23 year-olds compared to 25%
of 17-18 year-olds and 26% of 19-20 year-olds.
§ Those who are likely to consider a career in the CAF are
more inclined to agree that “no requirement to move away” is a good description
(16% compared to 4% of those not at all interested), along with “offers a
positive work environment” (17% compared to 5% of those not interested) and
“offers a pension” (39% compared to 25% of those not interested). They also
believe it offers more freedom and flexibility (15% compared to 5% of those not
interested) and opportunity for promotion (29% compared to 19% of those not
interested).
Exhibit
C32: Q34: To what extent would you say each of the following describes a
career in the Canadian Armed Forces?
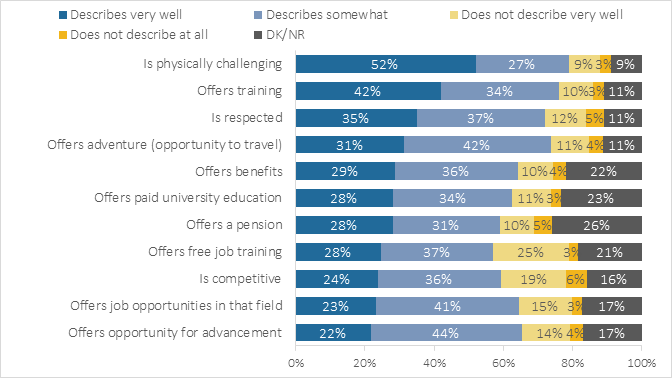
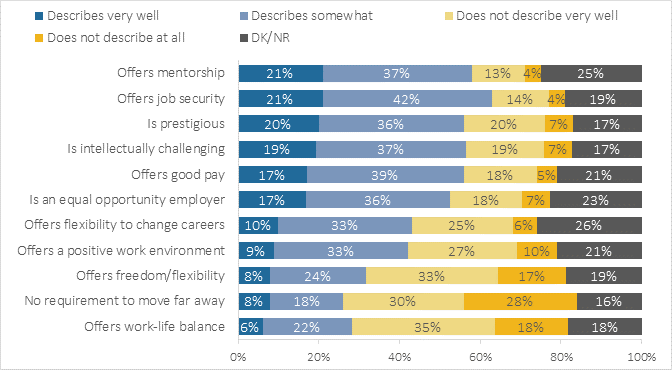
Exhibit
C33: Q34: To what extent would you say each of the following describes a
career in the Canadian Armed Forces?
|
Description
of a Career in the CAF - % Describes Very Well
|
|
|
Gen Pop
(n=2031)
|
Visible Minority
(n=1008)
|
Non-Visible Minority (n=1023)
|
|
Is
physically challenging
|
52%
|
47%
|
54%
|
|
Offers
training
|
42%
|
40%
|
43%
|
|
Is
respected
|
35%
|
36%
|
34%
|
|
Offers
adventure (opportunity to travel)
|
31%
|
28%
|
32%
|
|
Offers
benefits
|
29%
|
27%
|
30%
|
|
Offers
paid university education
|
28%
|
26%
|
29%
|
|
Offers
a pension
|
28%
|
28%
|
29%
|
|
Offers
free job training
|
28%
|
26%
|
28%
|
|
Is
competitive
|
24%
|
24%
|
25%
|
|
Offers
job opportunities in that field
|
23%
|
24%
|
23%
|
|
Offers
opportunity for advancement
|
22%
|
23%
|
21%
|
|
Offers
mentorship
|
21%
|
24%
|
20%
|
|
Offers
job security
|
21%
|
22%
|
21%
|
|
Is
prestigious
|
20%
|
22%
|
19%
|
|
Is
intellectually challenging
|
19%
|
19%
|
20%
|
|
Offers
good pay
|
17%
|
19%
|
16%
|
|
Is
an equal opportunity employer
|
17%
|
17%
|
17%
|
|
Offers
flexibility to change careers
|
10%
|
10%
|
10%
|
|
Offers
a positive work environment
|
10%
|
12%
|
8%
|
|
Offers
freedom/flexibility
|
8%
|
11%
|
6%
|
|
No
requirement to move far away
|
8%
|
10%
|
7%
|
|
Offers
work-life balance
|
6%
|
10%
|
5%
|
Respondents
who completed the survey in English were shown one of two recruitment videos:
“Attention (Navy)” or Attention (Army)” and asked a series of questions to
capture their reaction.
Over
half said the video “Attention (Navy)” was appealing to watch (65%) and was
compelling (59%). Over two-thirds (69%) said it made them at least a little
more interested in a career with the CAF. Fewer, though still a majority, felt
it was meant for them (59%). Over three-quarters (76%) of visible minority
respondents said the video made them at least a little more likely to consider
a career in the CAF, compared to 67% of non-visible minorities.
Among
those who initially said they are likely to consider a career in the CAF,
almost all (94%) said the video made them a little more interested in the CAF.
Among those who said they are not very likely to join, 81% are a little more
interested after seeing the video.
Exhibit
D1: Q35: Please indicate how well this applies to what you just watched?
Attention (Navy)

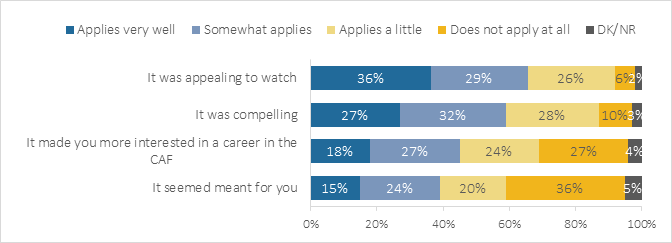
Exhibit
D2: Q35: Please indicate how well this applies to what you just watched.
|
Attention
(Navy): It was appealing to watch
|
|
|
Gen Pop
(n=780)
|
Visible Minority
(n=411)
|
Non-Visible Minority
(n=369)
|
|
Applies
very well
|
36%
|
34%
|
37%
|
|
Somewhat
applies
|
29%
|
33%
|
27%
|
|
Applies
a little
|
26%
|
24%
|
27%
|
|
Does
not apply at all
|
6%
|
6%
|
6%
|
|
Don’t
know/Prefer not to answer
|
2%
|
2%
|
2%
|
Exhibit
D3: Q35: Please indicate how well this applies to what you just watched.
|
Attention
(Navy): It was compelling
|
|
|
Gen Pop
(n=780)
|
Visible Minority
(n=411)
|
Non-Visible Minority
(n=369)
|
|
Applies
very well
|
27%
|
29%
|
26%
|
|
Somewhat
applies
|
32%
|
33%
|
31%
|
|
Applies
a little
|
28%
|
25%
|
30%
|
|
Does
not apply at all
|
10%
|
10%
|
10%
|
|
Don’t
know/Prefer not to answer
|
3%
|
2%
|
3%
|
Exhibit
D4: Q35: Please indicate how well this applies to what you just watched.
|
Attention
(Navy): It made you more interested in a career in the CAF
|
|
|
Gen Pop
(n=780)
|
Visible Minority
(n=411)
|
Non-Visible Minority
(n=369)
|
|
Applies
very well
|
18%
|
22%
|
17%
|
|
Somewhat
applies
|
27%
|
30%
|
26%
|
|
Applies
a little
|
24%
|
24%
|
24%
|
|
Does
not apply at all
|
27%
|
21%
|
30%
|
|
Don’t
know/Prefer not to answer
|
4%
|
3%
|
4%
|
Exhibit
D5: Q35: Please indicate how well this applies to what you just watched.
|
Attention
(Navy): It seemed meant for you
|
|
|
Gen Pop
(n=780)
|
Visible Minority
(n=411)
|
Non-Visible Minority
(n=369)
|
|
Applies
very well
|
15%
|
15%
|
15%
|
|
Somewhat
applies
|
24%
|
28%
|
22%
|
|
Applies
a little
|
20%
|
21%
|
19%
|
|
Does
not apply at all
|
36%
|
32%
|
39%
|
|
Don’t
know/Prefer not to answer
|
5%
|
4%
|
6%
|
As
with the first video, the majority found the “Attention (Army)” video appealing
(62%) to watch and compelling (57%). Slightly fewer, though still the
majority, said it made them at least a little more interested in a career in
the CAF (61%). Non-visible minorities found it less appealing (38% does not
apply/only applies a little) and compelling (45%). As with the first video,
visible minorities were more swayed by the messages. A quarter (73%) said the
video made them at least a little more interested in the CAF, compared to 54%
of non-visible minorities.
Among
those who were initially likely to consider the CAF, almost all (93%) said the
video made them more interested. Among those who were not very likely, fewer,
though still over two-thirds (69%), are at least a little more interested in
joining the CAF.
Exhibit
D6: Q35: Please indicate how well this applies to what you just watched?
Attention (Army)
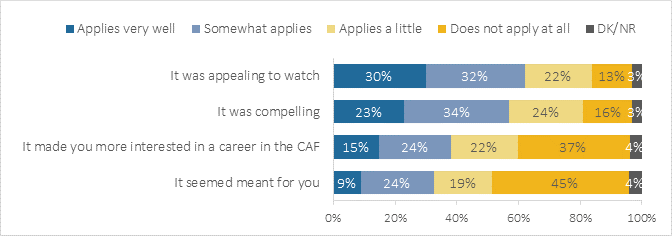
Exhibit
D7: Q35: Please indicate how well this applies to what you just watched.
|
Attention
(Army): It was appealing to watch
|
|
|
Gen Pop
(n=833)
|
Visible Minority
(n=437)
|
Non-Visible Minority
(n=396)
|
|
Applies
very well
|
30%
|
33%
|
29%
|
|
Somewhat
applies
|
32%
|
34%
|
32%
|
|
Applies
a little
|
22%
|
22%
|
22%
|
|
Does
not apply at all
|
13%
|
7%
|
16%
|
|
Don’t
know/Prefer not to answer
|
3%
|
5%
|
2%
|
Exhibit
D8: Q35: Please indicate how well this applies to what you just watched.
|
Attention
(Army): It was compelling
|
|
|
Gen Pop
(n=833)
|
Visible Minority
(n=437)
|
Non-Visible Minority
(n=396)
|
|
Applies
very well
|
23%
|
27%
|
21%
|
|
Somewhat
applies
|
34%
|
38%
|
32%
|
|
Applies
a little
|
24%
|
19%
|
27%
|
|
Does
not apply at all
|
16%
|
10%
|
18%
|
|
Don’t
know/Prefer not to answer
|
3%
|
5%
|
2%
|
Exhibit
D9: Q35: Please indicate how well this applies to what you just watched.
|
Attention
(Army): It made you more interested in a career in the CAF
|
|
|
Gen Pop
(n=833)
|
Visible Minority
(n=437)
|
Non-Visible Minority
(n=396)
|
|
Applies
very well
|
15%
|
22%
|
12%
|
|
Somewhat
applies
|
24%
|
28%
|
21%
|
|
Applies
a little
|
22%
|
23%
|
21%
|
|
Does
not apply at all
|
37%
|
23%
|
43%
|
|
Don’t
know/Prefer not to answer
|
4%
|
4%
|
3%
|
Exhibit
D10: Q35: Please indicate how well this applies to what you just watched.
|
Attention
(Army): It seemed meant for you
|
|
|
Gen Pop
(n=833)
|
Visible Minority
(n=437)
|
Non-Visible Minority
(n=396)
|
|
Applies
very well
|
9%
|
12%
|
8%
|
|
Somewhat
applies
|
24%
|
31%
|
20%
|
|
Applies
a little
|
19%
|
24%
|
16%
|
|
Does
not apply at all
|
45%
|
28%
|
52%
|
|
Don’t
know/Prefer not to answer
|
4%
|
4%
|
4%
|
Just
over half follow the news closely (56%) or are interested in politics or political
issues of the day (53%). One notable difference in civic interest is that those likely to consider joining are more likely
to follow the news (67%) and pay attention to politics (70%). Men are more
likely than women to follow the news very closely (15% vs 8%) but the combined
percentages of men and women who follow the news at least somewhat closely are
similar (57% vs 55%) and the difference is not statistically significant.
Exhibit
E1: Q19: How closely do you follow news about current events?
|
Follow
News about Current Events
|
|
|
Gen Pop
(n=2031)
|
Visible Minority
(n=1008)
|
Non-Visible Minority
(n=1023)
|
|
Very
closely
|
12%
|
12%
|
12%
|
|
Somewhat
closely
|
44%
|
48%
|
43%
|
|
Not
very closely
|
36%
|
33%
|
37%
|
|
Not
at all closely
|
8%
|
6%
|
8%
|
|
Don’t
know/Prefer not to answer
|
1%
|
2%
|
0%
|
Exhibit
E2: Q20: How interested are you in politics or political issues of the day?
|
Interest
in Politics
|
|
|
Gen Pop
(n=2031)
|
Visible Minority
(n=1008)
|
Non-Visible Minority
(n=1023)
|
|
Very
interested
|
13%
|
11%
|
14%
|
|
Somewhat
interested
|
40%
|
44%
|
39%
|
|
Not
very interested
|
30%
|
29%
|
30%
|
|
Not
at all interested
|
16%
|
14%
|
17%
|
|
Don’t
know/Prefer not to answer
|
1%
|
1%
|
1%
|
Respondents
were asked to select from a list which leisure activities they engage in on a
regular basis. The most common leisure activities include TV/movies (50%),
music (44%), fitness (43%) and video games (43%). Visual (18%) and culinary
arts (17%), team sports (17%) and cycling (15%) make up the second tier of most
common pastimes.
Women
are more likely than men to participate in the following:
§
TV and movies (56% vs 44%);
§
Music (49% vs 39%);
§
Visual arts (22% vs 12%); and
§
Culinary arts (22% 13%).
Men
are more likely than women to participate in the following:
§
Video games (56% vs 29%);
§
Team sports (21% vs 14%);
§
Cycling (19% vs 12%);
§
Hunting and/or fishing (13% vs 9%);
§
Individual sports (14% vs 7%);
§
Vehicle restoration (6% vs 1%); and
§
Marksmanship (6% vs 1%).
Exhibit
E3: Q21: In which of the following leisure activities do you participate?
|
Preferred
Leisure Activities
|
|
|
Gen Pop
(n=2031)
|
Visible Minority
(n=1008)
|
Non-Visible Minority (n=1023)
|
|
Television/Movies
|
50%
|
50%
|
51%
|
|
Music
|
44%
|
44%
|
44%
|
|
Fitness
|
43%
|
42%
|
43%
|
|
Video
games
|
43%
|
39%
|
45%
|
|
Visual
arts
|
18%
|
18%
|
18%
|
|
Culinary
arts
|
17%
|
13%
|
19%
|
|
Competing
in team sports
|
17%
|
13%
|
19%
|
|
Cycling
|
15%
|
17%
|
15%
|
|
Watersports
|
11%
|
9%
|
12%
|
|
Hunting/Fishing
|
11%
|
6%
|
13%
|
|
Performing
arts
|
10%
|
10%
|
10%
|
|
Competing
in individual sports
|
10%
|
9%
|
11%
|
|
Canoeing
|
9%
|
6%
|
10%
|
|
Vehicle
restoration
|
4%
|
4%
|
4%
|
|
Marksmanship
|
4%
|
3%
|
4%
|
|
Cadets
|
3%
|
3%
|
2%
|
|
Sailing
|
2%
|
1%
|
2%
|
|
Aviation
|
2%
|
2%
|
1%
|
|
Amateur
radio
|
2%
|
2%
|
2%
|
|
Scouts/Girl
Guides
|
2%
|
2%
|
2%
|
|
None
of the above
|
5%
|
6%
|
5%
|
|
Other
|
4%
|
2%
|
5%
|
|
Don’t
know/Prefer not to answer
|
2%
|
5%
|
1%
|
When
asked which three career fields they find most interesting, respondents name
healthcare (27%) and the creative or arts field (27%) first, followed by
education (22%), travel and tourism (20%), and business or entrepreneurial
pursuits (20%).
Exhibit
F1: Q10: Which three career fields do you find the most interesting?
|
Preferred
Career Field
|
|
|
Gen Pop
(n=2031)
|
Visible Minority
(n=1008)
|
Non-Visible Minority (n=1023)
|
|
Healthcare
|
27%
|
28%
|
26%
|
|
Creative/Arts
|
27%
|
24%
|
28%
|
|
Education
|
22%
|
18%
|
24%
|
|
Travel/Tourism
|
20%
|
18%
|
21%
|
|
Business/Entrepreneur
|
20%
|
25%
|
18%
|
|
Sports/Entertainment
|
16%
|
15%
|
16%
|
|
Public
service/Government
|
14%
|
16%
|
13%
|
|
Research
& Development
|
14%
|
14%
|
13%
|
|
Marketing/Advertising/Media
|
13%
|
12%
|
13%
|
|
Engineering
|
13%
|
15%
|
12%
|
|
Banking/Finance
|
12%
|
17%
|
11%
|
|
Information
technology
|
12%
|
16%
|
11%
|
|
Legal
profession
|
12%
|
11%
|
12%
|
|
Skilled
trade
|
12%
|
10%
|
13%
|
|
Police/Law
enforcement
|
12%
|
8%
|
13%
|
|
Journalism
|
10%
|
8%
|
10%
|
|
Retail/Service
|
9%
|
10%
|
8%
|
|
Architecture
|
9%
|
8%
|
10%
|
|
Military
|
8%
|
7%
|
8%
|
|
Manufacturing
|
6%
|
6%
|
7%
|
|
Mining
|
2%
|
2%
|
2%
|
|
Distribution
|
2%
|
2%
|
2%
|
|
Other
|
2%
|
1%
|
2%
|
|
Don’t
know/Prefer not to answer
|
2%
|
2%
|
2%
|
The
least interesting career field is mining (36%), followed by the military (28%),
banking and finance (20%) and journalism (19%).
Exhibit
F2: Q11: Which three of the following types of career fields do you find the
least interesting? That is, which three are the career/profession you would
least prefer?
|
Least
Interesting Career Field
|
|
|
Gen Pop
(n=2031)
|
Visible Minority
(n=1008)
|
Non-Visible Minority (n=1023)
|
|
Mining
|
36%
|
39%
|
35%
|
|
Military
|
28%
|
25%
|
29%
|
|
Banking/Finance
|
20%
|
17%
|
21%
|
|
Journalism
|
19%
|
20%
|
18%
|
|
Manufacturing
|
14%
|
16%
|
14%
|
|
Retail/Service
|
15%
|
16%
|
15%
|
|
Police/Law
enforcement
|
15%
|
16%
|
14%
|
|
Engineering
|
13%
|
11%
|
14%
|
|
Sports/Entertainment
|
13%
|
12%
|
13%
|
|
Legal
profession
|
13%
|
12%
|
14%
|
|
Healthcare
|
12%
|
11%
|
12%
|
|
Distribution
|
11%
|
14%
|
10%
|
|
Public
service/Government
|
10%
|
7%
|
11%
|
|
Marketing/Advertising/Media
|
10%
|
8%
|
10%
|
|
Education
|
10%
|
8%
|
10%
|
|
Architecture
|
10%
|
11%
|
9%
|
|
Skilled
trade
|
9%
|
10%
|
8%
|
|
Creative/Arts
|
9%
|
10%
|
8%
|
|
Information
technology
|
8%
|
7%
|
9%
|
|
Travel/Tourism
|
7%
|
7%
|
7%
|
|
Research
& Development
|
6%
|
7%
|
6%
|
|
Business/Entrepreneur
|
6%
|
5%
|
6%
|
|
Don’t
know/Prefer not to answer
|
3%
|
3%
|
2%
|
To
support DND and the CAF in their efforts to develop recruitment marketing and
advertising strategies, we conducted a segmentation analysis of the data. Two
additional data analyses were undertaken:
1. For each respondent, a score on a scale from zero (0) to
five (5) was calculated indicating their level of potential for recruitment.
This score has been labelled their “CAFSCORE”; and,
2. A segmentation was created that sorted groups of
respondents with similar scores for potential recruitment.
The
score was developed using responses from three specific variables that are most
indicative of recruitment potential: overall impression of the CAF; impression
of the CAF as an employer; and, likelihood to consider joining the CAF.
After
investigating various approaches, we determined that a logic-based sorting of
respondents produced the most valuable results. Of the three questions above,
likelihood to consider joining CAF is the most immediate indication of a person
with high potential to be recruited.
§ It is reasoned that someone who is already likely to
consider joining (those who are currently very or somewhat likely to consider a
career in the CAF) and hold consistently favourable impressions of the CAF both
in general and as an employer specifically (with responses of very or somewhat
favourable in both cases), can rationally be considered a person who is most
immediately receptive to any CAF recruiting initiatives. These people were
assigned a score of five (5) out of five on the CAFSCORE scale indicating their
potential to be recruited.
§ An individual who is at least somewhat likely to consider
joining the CAF, but does not have such consistently favourable impressions of
the CAF (overall and as an employer) may reasonably be considered to have great
potential to join, but slightly less than one who holds favourable
impressions. These respondents were assigned a CAFSCORE of four (4).
§ A CAFSCORE of three (3) was assigned to respondents who
are unable to answer whether or not they would consider a career in the CAF but
hold favourable impressions of both the CAF overall and as an employer.
§ A CAFSCORE of two (2) was assigned to respondents who are
unsure whether or not they would consider a career in the CAF and do not hold
consistently favourable impressions of both the CAF overall and as an employer.
§ Respondents who indicate being not very or not at all
likely to consider a career in the CAF despite holding favourable impressions
of the CAF overall and as an employer were assigned a CAFSCORE of one (1).
§ Finally, respondents who are not very or not at all
likely to consider joining and do not hold consistently favourable impressions
of the CAF overall and as an employer were assigned a CAFSCORE of zero (0).
The
distribution of CAFSCORES is as follows:
§ 15% have a CAFSCORE of 5/5
§ 5% have a CAFSCORE of 4/5
§ 1% have a CAFSCORE of 3/5
§ 3% have a CAFSCORE of 2/5
§ 31% have a CAFSCORE of 1/5
§ 46% have a CAFSCORE of 0/5
This
CAFSCORE index variable formed the basis for a segmentation identifying target
audiences based upon their level of potential to be immediately receptive to
marketing and advertising. We decided that a five-segment solution would be
the most helpful:
§ Likely Candidates (15%)
have a CAFSCORE of 5, are top-2-box (T2B) on likely to consider a CAF career
and T2B on both overall impression of the CAF and impression of the CAF as an
employer;
§ Willing Explorers
(5%) have a CAFSCORE of 4, are top-2-box (T2B) on likely to consider a CAF
career but not consistently favourable on impressions of the CAF (they may hold
favourable impressions on one criterion or the other or on neither criterion,
but they do not hold favourable impressions on both criteria);
§ Undecided (4%)
have a CAFSCORE or 2 or 3, are those who do not offer a response on whether
they are willing to consider a career in the CAF, regardless of their
impressions of the CAF overall or as an employer;
§ Good for Others
(31%) have a CAFSCORE of 1, are those who are not T2B on likely to consider a
career in the CAF, despite holding consistently favourable impressions of the
CAF overall and as an employer; and,
§ Disinterested (46%)
have a CAFSCORE of 0, are those who are neither T2B on likely to consider a
career in the CAF nor hold consistently favourable impressions of the CAF
overall and as an employer.
Exhibit G1: CAFSCORE
Segmentation
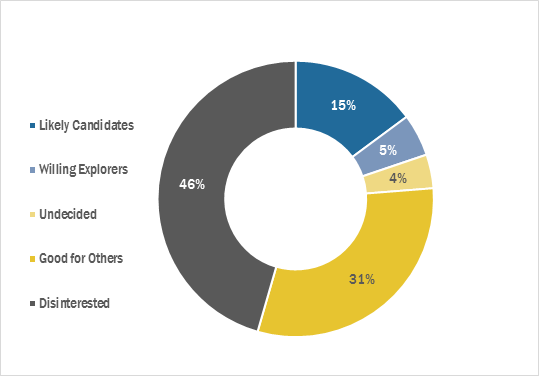
The
survey results were then analyzed using these two new variables (CAFSCORE and
the segmentation). This chapter reviews the key insights gleaned from this
analysis in terms of the value to recruitment marketing and advertising
strategies. This includes both profiling of the segments to understand the
nature of each group, as well as a comprehensive review of CAFSCOREs
highlighting how habits, interests, attitudes and goals relate to having a
greater or lesser potential to be recruited by the CAF.
Segment Profile
The
following analysis highlights the demographic characteristics of each of the
five segments created.
Likely
Candidates (15%) are notable for the
following characteristics:
§ More male (68%) than any others segment;
§ Slightly older skew (47% are aged 21-23);
§ More likely than average to be visible minority
(40% vs 27% on average);
§ More likely than average to be Indigenous (13% vs
5% on average);
§ Less likely to live in either Ontario (35% vs 40% on
average) or Quebec (15% vs 22% on average);
§ More likely to live west of Ontario (44% vs 32% on
average);
§ Slightly less likely to live in a rural area (10% vs 13%
on average);
§ Slightly more likely than average to have household
income of $40k or more (70% vs 65% on average);
§ Most likely to have some university education (27%
vs 21% on average);
§ Most familiar with the CAF (76% vs 40% on
average);
§ Most knowledgeable about CAF careers (64% vs 29%
on average);
§ Nearly all (92%) say they would be at least somewhat likely
to join the CAF if they could pursue their preferred career(s);
§ More knowledgeable about the CAF Reserves (58%)
than any other segment;
§ More interested in the CAF Reserves (89%) than any
other segment;
§ Slightly more likely to feel dissatisfied with their life
(24% vs 21% on average);
§ Most likely to follow news (74% vs 56% on
average); and
§ Most interested in politics (77% vs 53% on
average).
Exhibit
G2: Likely Candidates - Demographics
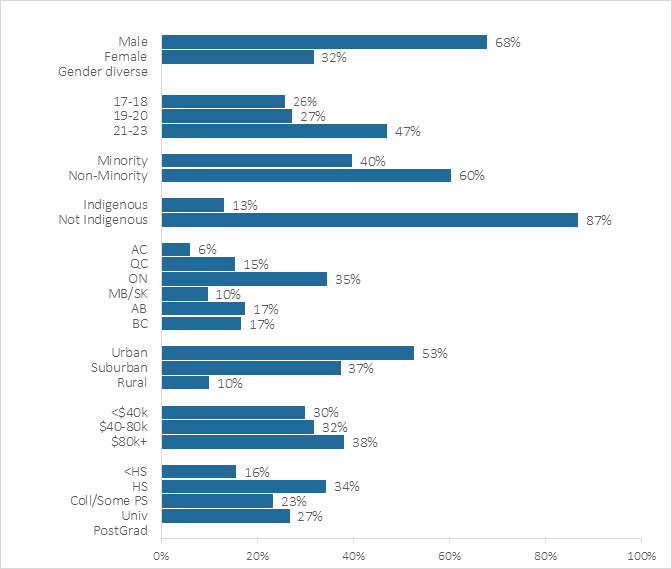
The
relatively small Willing Explorers segment (5%) are notable for the
following characteristics:
§ Skew male (59%);
§ Slightly skew older than 18 years of age (76% vs
73% on average);
§ More likely than average to be a member of a visible
minority group (41% vs 27% on average);
§ More likely than average to be Indigenous (14% vs
5% on average);
§ Twice as likely as average to live in B.C. (26% vs
13% on average);
§ Most likely to be urban (59% vs 52% on average);
§ Most likely to have a household income of less than
$40k (44% vs 35% on average);
§ Least likely to have completed high school (21% vs 15% on
average) and most likely to have attended college or received vocational or
technical training (26% vs 21% on average);
§ More familiar with the CAF (52% vs 40% on
average);
§ More knowledgeable about CAF careers (45% vs 29%
on average);
§ Most (78%) say they would be at least somewhat likely
to join the CAF if they could pursue their preferred career(s);
§ More knowledgeable about the CAF Reserves (34% vs
23% on average);
§ More interested in the CAF Reserves (75% vs 45% on
average);
§ Most likely to be neutral in terms of their level of
satisfaction with their life (38% vs 20% on average); and
§ Less likely to follow
the news (46% vs 56% on average).
Exhibit
G3: Willing Explorers - Demographics
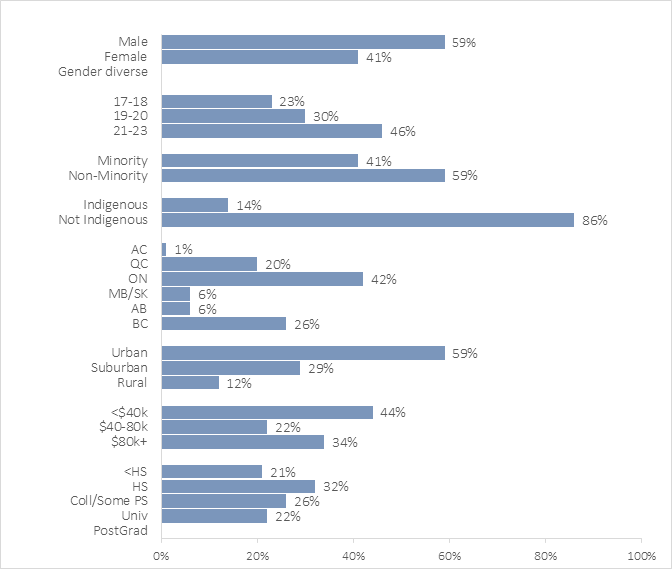
The
equally small Undecided segment (5%) are notable for the following
characteristics:
§ Skew male (55%);
§ Skew slightly to the youngest age bracket, 17-18
years of age (34% vs 27% on average);
§ More likely than average to be a member of a visible
minority group (41% vs 27% on average);
§ Slightly more likely to live in Ontario (46% vs
40% on average) or Atlantic Canada (10% vs 6% on average);
§ More likely to live in an urban area (57% vs 52%
on average), but also slightly more likely to live in a rural area (15% vs 13%
on average);
§ Most likely to have household income of less than $40k
(40% vs 35% on average);
§ Most likely to have only a high school education or
less so far (67% vs 56% on average);
§ Less familiar
with the CAF (32% vs 40% on average);
§ Least certain as to whether they would be likely to join
the CAF if they could pursue their preferred career(s) (38% non-responsive vs
6% on average);
§ Least knowledgeable
about CAF careers (15% vs 29% on average);
§ Less knowledgeable
about the CAF Reserves (14% vs 23% on average);
§ Less interested
in the CAF Reserves (31% vs 45% on average);
§ Fairly satisfied with their life (62% vs 59% on
average); and
§ Least interested in politics (31% vs 53% on
average).
Exhibit
G4: Undecided - Demographics
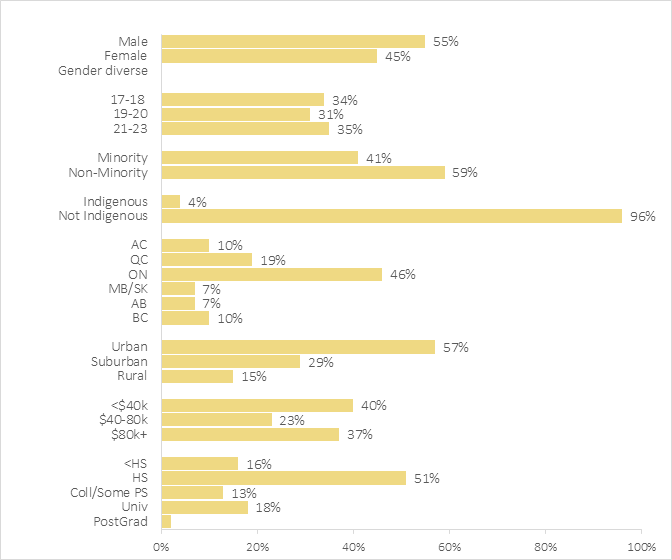
The
third (31%) of respondents who fall into the Good for Others segment are
notable for the following characteristics:
§ More female (55%) than any other segment;
§ Slightly older skew (48% are aged 21-23);
§ Most likely to be non-visible minority (80% vs 73%
on average);
§ Most likely to be non-Indigenous (98% vs 95% on
average);
§ More likely to live in Quebec (26% vs 22% on
average) or Atlantic Canada (10% vs 6% on average);
§ More likely to have some post-secondary education
(48% vs 43% on average);
§ More likely to feel not very or not at all knowledgeable
about CAF careers (70% vs 67% on average);
§ Slightly more likely to say they would be likely to join
the CAF if they could pursue their preferred career(s) (56% vs 52% on average);
§ Less knowledgeable
about the CAF Reserves (78% not very or not at all knowledgeable vs 73% on
average);
§ Slightly more interested in the CAF Reserves (49%
vs 45% on average);
§ Most satisfied with their life (67% vs 59% on
average);
§ More likely to follow the news (61% vs 56% on
average); and
§ More interested in politics (57% vs 53% on
average).
Exhibit
G5: Good for Others - Demographics
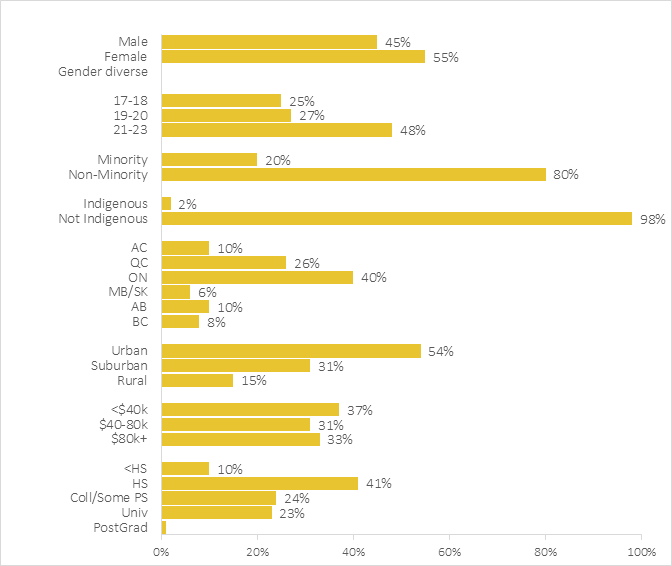
Because
of their size, the plurality (46%) who comprise the Disinterested
segment tend to have characteristics similar to the population as a whole.
However, they are notable for the following characteristics:
§ More female (51%) than the segments most inclined
to join the CAF and, although the survey found very few (3%) identifying as gender
diverse, all of those respondents fall into this Disinterested segment;
§ Slightly younger skew (59% are less than 21);
§ More likely to live in suburbs (38% vs 35% on average);
§ More likely to have only a high school education or
less so far (62% vs 56% on average);
§ Most likely to feel not very or not at all familiar
with the CAF (73% vs 67% on average);
§ Most likely to feel not very or not at all knowledgeable
about CAF careers (78% vs 67% on average);
§ Least likely to say they would be likely to join the CAF
if they could pursue their preferred career(s) (35% vs 52% on average);
§ Less knowledgeable about the CAF Reserves (84% not very
or not at all knowledgeable vs 73% on average);
§ Least interested in the CAF Reserves (27% vs 45% on
average);
§ Less likely to follow the news (48% vs 56% on average);
and
§ Less interested in politics (45% vs 53% on average).
Exhibit
G6: Disinterested - Demographics
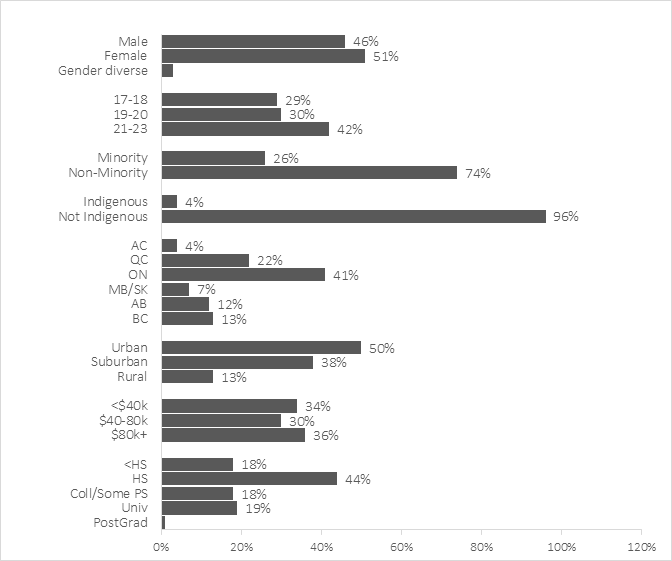
There
is clearly a correlation between where one sits on this spectrum of potential
recruitment and one’s level familiarity with the CAF in general, one’s
knowledge about career options within CAF and one’s knowledge about the CAF
Reserves. However, it is not clear whether being interested stimulates
gathering knowledge or that being more informed about CAF drives a higher
willingness to consider joining CAF. Nevertheless, given the correlation, for
the purposes of recruitment marketing and advertising strategies, it may be
reasonable to assume that building up awareness and knowledge of the CAF has
the potential to increase an individual’s probability of joining CAF.
Exhibit
G7: CAFSCORE Segments – Demographic Profiles
|
CAFSCORE
Segments – Demographic Profile with Statistical Significance Testing
|
|
|
Total (n=2031)
(A)
|
Likely Candidates
(n=340)
(B)
|
Willing Explorers
(n=126)
(C)
|
Undecided (n=87)
(D)
|
Good for Others (n=584) (E)
|
Disinterested (n=894)
(F)
|
|
Male
|
50%
|
68% EF
|
59% EF
|
55%
|
45%
|
46%
|
|
Female
|
49%
|
32%
|
41%
|
45%
|
55% BC
|
51% B
|
|
|
|
|
|
|
|
|
|
17-18
|
27%
|
26%
|
23%
|
34%
|
25%
|
29%
|
|
19-20
|
29%
|
27%
|
30%
|
31%
|
27%
|
30%
|
|
21-23
|
44%
|
47%
|
46%
|
35%
|
48% DF
|
42%
|
|
|
|
|
|
|
|
|
|
Minority
|
27%
|
40% EF
|
41% EF
|
41% EF
|
20%
|
26%
|
|
Non-minority
|
73%
|
60%
|
59%
|
59%
|
80% BCD
|
74% BCD
|
|
|
|
|
|
|
|
|
|
Indigenous
|
5%
|
13% EF
|
14% EF
|
4%
|
2%
|
4%
|
|
Non-Indigenous
|
95%
|
87%
|
86%
|
96%
|
98% BC
|
96% BC
|
|
|
|
|
|
|
|
|
|
AC
|
6%
|
6%
|
1%
|
10%
|
10% CF
|
4%
|
|
QC
|
22%
|
15%
|
20%
|
19%
|
26% B
|
22%
|
|
ON
|
40%
|
35%
|
42%
|
46%
|
40%
|
41%
|
|
MB/SK
|
7%
|
10%
|
6%
|
7%
|
6%
|
7%
|
|
AB
|
12%
|
17% CDE
|
6%
|
7%
|
10%
|
12% C
|
|
BC
|
13%
|
17% E
|
26% DEF
|
10%
|
8%
|
13% E
|
|
|
|
|
|
|
|
|
|
Rural
|
13%
|
10%
|
12%
|
15%
|
15%
|
13%
|
|
Suburban
|
35%
|
37%
|
29%
|
29%
|
31%
|
38% E
|
|
Urban
|
52%
|
53%
|
59%
|
57%
|
54%
|
50%
|
|
|
|
|
|
|
|
|
|
<$40K
|
35%
|
30%
|
44% B
|
40%
|
37%
|
34%
|
|
$40-80K
|
30%
|
32%
|
22%
|
23%
|
31%
|
30%
|
|
$80k+
|
35%
|
38%
|
34%
|
37%
|
33%
|
36%
|
|
|
|
|
|
|
|
|
|
<HS
|
15%
|
16%
|
21% E
|
16%
|
10%
|
18% E
|
|
HS
|
41%
|
34%
|
32%
|
51% BC
|
41%
|
44% BC
|
|
Coll/Some
PS
|
21%
|
23%
|
26%
|
13%
|
24% DF
|
18%
|
|
Univ
|
21%
|
27% F
|
22%
|
18%
|
23%
|
19%
|
|
Post-grad
|
1%
|
0%
|
0%
|
2%
|
1%
|
1%
|
Targeting
Based Upon Goals, Attitudes and Activities
The
segmentation and segment profiling information above is helpful for
identifying, prioritizing and targeting broad groups as well as knowing their
respective predispositions and determining the steps that need to be taken to
move people further up the spectrum. However, there is a great deal of value
in reviewing the CAFSCORE results by respondents’ characteristics, interests,
goals, attitudes and activities.
The
analysis below examines the mean CAFSCOREs for the many variables identifying
these characteristic, attitudinal and behavioural traits. On an aggregate
basis, the average CAFSCORE generated by all respondents together was 1.33 out
of 5. To make it easier to quickly analyze the results, the CAFSCOREs have
been indexed against the national average. Since the national average CAFSCORE
was 1.33, any group with an average CAFSCORE of 1.33 will have an indexed
CAFSCORE of 100. Thus, respondent groups with CAFSCOREs above 1.33 hold
greater-than-average potential for recruitment into CAF and will have indexed
scores above 100.
As an
example, respondents who identified as Indigenous have an average CAFSCORE of
2.66. Since this is twice the national average of 1.33, the indexed CAFSCORE
for Indigenous respondents is 200 – or, twice the national base index of 100.
The higher the CAFSCORE, the greater the current degree of potential for
recruitment among that subset of respondents.
The
table below presents a list of the subsets of respondents with relatively high
CAFSCOREs and therefore the subsets with the greatest potential for
recruitment. In addition to the indexed CAFSCORE, the unweighted sample size
is provided for each subset. An asterisk indicates subsets where the sample
size is too small for statistical analysis, but the findings in these cases are
included since they may provide useful qualitative analysis.
Exhibit G7: CAFSCORE Top
Prospects for Recruitment – CAFSCORE Index
|
Top
Prospects for Recruitment Based Upon CAFSCORE
|
n
|
CAFSCORE Indexed
|
|
National Average
|
2031
|
100
|
|
By
Cultural Heritage…
|
|
|
|
Indigenous
|
268
|
200
|
|
South Asian (e.g., East
Indian, Pakistani, Sri Lankan, etc.)
|
151
|
148
|
|
Arab/Filipino/Japanese
|
139
|
141
|
|
By Employment Status…
|
|
|
|
Employed full-time
|
324
|
126
|
|
By Current Field of
Employment…
|
|
|
|
Working in skilled trades/ mining/
distribution
|
63*
|
208
|
|
Working in journalism/IT/business/entrepreneur/banking/finance/
marketing/advertising/engineering
|
130
|
153
|
|
Those Most Interested in
These Careers:
|
|
|
|
The military
|
149
|
255
|
|
Manufacturing
|
117
|
147
|
|
Law enforcement/Police
|
217
|
137
|
|
Mining
|
48*
|
135
|
|
Distribution
|
47*
|
126
|
|
Engineering
|
270
|
121
|
|
Skilled trades
|
224
|
117
|
|
Banking/Finance
|
262
|
114
|
|
Architecture
|
181
|
114
|
|
Information technology
|
265
|
114
|
|
Those Least Interested in
These Careers:
|
|
|
|
Architecture
|
206
|
133
|
|
Education
|
188
|
132
|
|
Journalism
|
366
|
125
|
|
Research & Development
|
131
|
122
|
|
Distribution
|
245
|
119
|
|
Information technology
|
193
|
115
|
|
A healthcare profession
|
208
|
115
|
|
A creative career (e.g.,
designer, musician, film maker)
|
184
|
113
|
|
Skilled trades
|
191
|
113
|
|
Those Most Seeking a Career
That…
|
|
|
|
Is physically challenging
|
97
|
177
|
|
Offers the flexibility to
change careers
|
118
|
139
|
|
Is competitive (not something
that anyone can do)
|
119
|
137
|
|
Offers training
|
108
|
132
|
|
Offers the opportunity for
promotion and advancement
|
229
|
123
|
|
Is prestigious
|
129
|
121
|
|
Offers a pension
|
163
|
121
|
|
Is respected
|
277
|
120
|
|
Those Least Motivated by…
|
|
|
|
There are job/career
opportunities in that field
|
107
|
158
|
|
Offers a positive work
environment
|
98
|
154
|
|
Job security
|
108
|
135
|
|
Offers a pension
|
205
|
132
|
|
Offers the opportunity for
promotion and advancement
|
107
|
119
|
|
Good pay
|
122
|
119
|
|
Work-life balance
|
121
|
117
|
|
Those Who Rank These Values
as Important:
|
|
|
|
Being heroic
|
181
|
154
|
|
Being proud to be Canadian
|
328
|
123
|
|
Respecting tradition
|
269
|
120
|
|
Those Who Describe These as
Life Goals:
|
|
|
|
Good lifestyle (fulfilling/fun/adventure/quality
time/freedom/self-development)
|
203
|
126
|
|
Serving (doing good/being
good/helping, serving God)
|
203
|
121
|
|
Basic material goals (land/car/home/debt-free/money)
|
469
|
116
|
|
Rate These Life Goals as Very
Important:
|
|
|
|
Being famous
|
233
|
141
|
|
Being engaged in your
community
|
480
|
126
|
|
Being recognized (by your
community or your peers)
|
443
|
125
|
|
Rate These Life Goals as
Unimportant:
|
|
|
|
Having a good work/life
balance
|
101
|
132
|
|
Those Who Strongly Agree
That…
|
|
|
|
The Canadian Armed Forces also
open doors to success in careers outside of the Canadian Armed Forces
|
287
|
177
|
|
Those Who Participate in…
|
|
|
|
Aviation
|
38*
|
273
|
|
A member of the Cadets program
|
57*
|
236
|
|
Marksmanship
|
64*
|
195
|
|
Sailing
|
41*
|
184
|
|
Vehicle restoration
|
67*
|
177
|
|
Amateur radio
|
39*
|
156
|
|
A member of Scouts or Girl
Guides
|
47*
|
141
|
|
Hunting and/or fishing
|
182
|
132
|
|
Canoeing
|
149
|
120
|
|
Cycling
|
282
|
115
|
|
Among Those Who Think the
Best Reason to Join is…
|
|
|
|
Training
|
236
|
136
|
|
The possibility of having to
be in combat
|
162
|
134
|
|
Typically involves a lot of
physical labour
|
146
|
127
|
|
Serving the country
|
397
|
119
|
|
Being exposed to high-pressure
or risky situations
|
151
|
119
|
|
Opportunities for career
advancement
|
268
|
118
|
|
Interesting challenges
|
358
|
116
|
|
Valuable work experience
|
339
|
113
|
|
Among Those Who Say the
Biggest Drawbacks Are…
|
|
|
|
Is not prestigious
|
76
|
158
|
|
Limited job opportunities in
technical occupations and skilled trades
|
99
|
157
|
|
Job instability (risk of
unemployment)
|
161
|
146
|
|
Unable to fully utilize one’s talent
|
179
|
143
|
|
Limited opportunities for
career advancement
|
112
|
141
|
|
Does not offer the flexibility
to change careers
|
126
|
133
|
|
Limited variety of jobs
|
138
|
132
|
|
Is not adventurous, for
example, offers little opportunity to travel
|
73
|
132
|
|
Is not respected
|
93
|
128
|
|
Work-life balance
|
314
|
124
|
|
Being micro-managed
|
197
|
120
|
|
Having to follow orders
|
250
|
114
|
|
Lack of representation of
members of my gender or cultural community
|
162
|
113
|
In
addition to uncovering the national insights above, an indexed CAFSCORE can
also be used to help inform strategies aimed at recruiting specific subsets of
the population. Below is a table of the results among only the female
respondents to the survey. As has been demonstrated, women are, as a whole,
consistently less inclined to consider a career in the CAF than are men, but by
examining the results on an indexed CAFSCORE, it is possible to identify which
groups of women are more open to considering a career in the CAF. To ease
analysis, the index for this table was based upon the average CAFSCORE of all
women (1.07), as opposed to the average CAFSCORE of all respondents (1.33).
Thus, in the table below, an index of 200 would mean that group of women score
twice as high as the aggregate of all women – not the aggregate of all
respondents. In many instances, the attitudes, characteristics and behaviours
that relate to higher inclination to consider a career in the CAF are identical
to those found in the population as a whole, but there are a few where women
have unique results.
Exhibit G8: CAFSCORE Top
Prospects for Recruitment Among Women – CAFSCORE Index
|
Top
Prospects for Recruitment Based Upon CAFSCORE
|
n
|
CAFSCORE Indexed
|
|
Average Among Women
|
1123
|
100
|
|
By
Cultural Heritage…
|
|
|
|
Visible minority
|
494
|
116
|
|
Arab/Filipino/Korean
|
75
|
159
|
|
Indigenous
|
61*
|
147
|
|
South Asian (e.g., East
Indian, Pakistani, Sri Lankan, etc.)
|
86
|
119
|
|
By Employment Status…
|
|
|
|
Employed full-time
|
166
|
115
|
|
Employed part-time
|
161
|
117
|
|
Those Most Interested in
These Careers:
|
|
|
|
The military
|
51*
|
284
|
|
Manufacturing
|
27*
|
169
|
|
Law enforcement/Police
|
120
|
154
|
|
Information technology
|
98
|
128
|
|
Skilled trades
|
94
|
126
|
|
Architecture
|
87
|
124
|
|
Engineering
|
89
|
119
|
|
Those Least Interested in
These Careers:
|
|
|
|
Education
|
79
|
149
|
|
Research & Development
|
85
|
142
|
|
Distribution
|
142
|
135
|
|
Banking/Finance
|
242
|
124
|
|
Architecture
|
107
|
123
|
|
Business/Entrepreneur
|
75
|
118
|
|
Retail or service industry
|
148
|
117
|
|
Marketing/Advertising/Media
|
87
|
114
|
|
Journalism
|
175
|
114
|
|
Skilled trades
|
94
|
114
|
|
Those Most Seeking a Career
That…
|
|
|
|
Is physically challenging
|
28*
|
223
|
|
Offers the flexibility to
change careers
|
50*
|
139
|
|
Is competitive (not something
that anyone can do)
|
51*
|
143
|
|
Offers paid university
education, while on a full-time salary
|
48*
|
123
|
|
Offers free job training,
while on full-time salary
|
81
|
119
|
|
Offers training
|
39*
|
114
|
|
Those Least Motivated by…
|
|
|
|
Work-life balance
|
47*
|
136
|
|
Offers the opportunity for
promotion and advancement
|
46*
|
125
|
|
Offers training
|
79
|
118
|
|
Job security
|
39*
|
116
|
|
Offers freedom and flexibility
|
51*
|
115
|
|
Offers a pension
|
93
|
115
|
|
Those Who Rank These Values
as Important:
|
|
|
|
Being heroic
|
50*
|
198
|
|
Being proud to be Canadian
|
139
|
141
|
|
Being of service to one’s
community
|
170
|
131
|
|
Those Who Describe These as
Life Goals:
|
|
|
|
Serving (doing good/being
good/helping, serving God)
|
104
|
119
|
|
Basic material goals (land/car/home/debt-free/money)
|
241
|
118
|
|
Rate These Life Goals as
Very Important:
|
|
|
|
Being famous
|
64*
|
122
|
|
Being engaged in your
community
|
226
|
119
|
|
Rate These Life Goals as
Unimportant:
|
|
|
|
Having a good work-life
balance
|
47*
|
177
|
|
Those Who Agree That…
|
|
|
|
The Canadian Armed Forces also
open doors to success in careers outside of the Canadian Armed Forces
|
590
|
135
|
|
I think that the Canadian
Armed Forces workplace environment is respectful of women
|
500
|
134
|
|
There is a wide variety of
professions within the Canadian Armed Forces
|
719
|
128
|
|
Those Who Participate in…
|
|
|
|
Aviation
|
6*
|
340
|
|
A member of the Cadets program
|
24*
|
239
|
|
Marksmanship
|
15*
|
223
|
|
Sailing
|
19*
|
202
|
|
Vehicle restoration
|
16*
|
182
|
|
Hunting and/or fishing
|
89
|
163
|
|
Competing in individual sports
|
68*
|
144
|
|
Amateur radio
|
16*
|
136
|
|
Among Those Who Think the
Best Reason to Join is…
|
|
|
|
Training
|
99
|
168
|
|
Typically involves a lot of
physical labour
|
56*
|
131
|
|
Opportunities for career
advancement
|
151
|
124
|
|
The possibility of having to
be in combat
|
49*
|
122
|
|
Valuable work experience
|
192
|
119
|
|
Serving the country
|
193
|
118
|
|
Among Those Who Say the
Biggest Drawbacks Are…
|
|
|
|
Limited opportunities for
career advancement
|
42*
|
187
|
|
Limited job opportunities in
technical occupations and skilled trades
|
35*
|
178
|
|
Is not adventurous, for
example, offers little opportunity to travel
|
27*
|
175
|
|
Unable to fully utilize one’s
talent
|
75
|
166
|
|
Is not prestigious
|
27*
|
149
|
|
Does not offer the flexibility
to change careers
|
53*
|
146
|
|
Lack of representation of
members of my gender or cultural community
|
95
|
134
|
|
Job instability (risk of
unemployment)
|
85
|
123
|
|
Is not respected
|
40*
|
120
|
|
The salary and benefits
|
54*
|
116
|
The
same exercise was conducted among respondents who identify as visible
minorities. The index for the table below is based on the average CAFSCORE
among visible minorities (1.72). Among this relatively more enthusiastic
segment of the sample, the attitudes, characteristics and behaviours that
relate to higher inclination to consider a career in the CAF are similar to
those found in the population as a whole, with a few exceptions. For example,
seeking an equal opportunity employer is a stronger determinant of visible
minorities’ inclination to join, along with valuing the ability to tackle
important challenges.
Exhibit G9: CAFSCORE Top
Prospects for Recruitment Among Visible Minorities – CAFSCORE Index
|
Top
Prospects for Recruitment Based Upon CAFSCORE
|
n
|
CAFSCORE Indexed
|
|
Average Among Visible Minorities
|
1008
|
100
|
|
By
Cultural Heritage…
|
|
|
|
South Asian (e.g., East
Indian, Pakistani, Sri Lankan, etc.)
|
151
|
114
|
|
Those Most Interested in
These Careers:
|
|
|
|
The military
|
71*
|
225
|
|
Distribution
|
27*
|
159
|
|
Information technology
|
153
|
128
|
|
Architecture
|
89*
|
128
|
|
Banking/Finance
|
155
|
116
|
|
Those Least Interested in
These Careers:
|
|
|
|
Travel & Tourism
|
78*
|
136
|
|
Research & Development
|
67*
|
130
|
|
Architecture
|
105
|
127
|
|
Journalism
|
188
|
126
|
|
Skilled trades
|
108
|
121
|
|
Education
|
91*
|
120
|
|
A legal profession
|
113
|
115
|
|
Those Most Seeking a Career
That…
|
|
|
|
Is physically challenging
|
53*
|
166
|
|
Is competitive (not something
that anyone can do)
|
63*
|
153
|
|
Offers the flexibility to
change careers
|
70*
|
139
|
|
Offers a pension
|
74*
|
138
|
|
Is prestigious
|
84*
|
125
|
|
Offers training
|
71*
|
116
|
|
Is an equal opportunity
employer
|
85*
|
115
|
|
Those Least Motivated by…
|
|
|
|
Offers a positive work
environment
|
62*
|
152
|
|
Offers training
|
84*
|
129
|
|
Is respected
|
93*
|
126
|
|
Job security
|
59*
|
126
|
|
Offers a pension
|
122
|
124
|
|
There are job/career
opportunities in that field
|
60*
|
124
|
|
Work-life balance
|
77*
|
119
|
|
Good pay
|
78*
|
114
|
|
Those Who Rank These Values
as Important:
|
|
|
|
Being heroic
|
115
|
142
|
|
Curiosity
|
194
|
126
|
|
Being creative
|
298
|
121
|
|
Tackling important challenges
|
182
|
120
|
|
Respecting tradition
|
180
|
118
|
|
Rate These Life Goals as
Very Important:
|
|
|
|
Being engaged in your
community
|
294
|
131
|
|
Being famous
|
169
|
129
|
|
Being recognized (by your
community or your peers)
|
269
|
119
|
|
Those Who Agree That…
|
|
|
|
I could see myself joining the
Royal Canadian Air Force
|
292
|
190
|
|
I could see myself joining the
Canadian Army
|
297
|
190
|
|
I could see myself joining the
Royal Canadian Navy
|
280
|
187
|
|
I could see myself joining the
Canadian Armed Forces
|
339
|
181
|
|
My family would encourage me
to join the Canadian Armed Forces if it were of interest to me
|
408
|
152
|
|
My friends would encourage me
to join the Canadian Armed Forces if it were of interest to me
|
439
|
147
|
|
I think that the Canadian
Armed Forces workplace environment is respectful of women
|
478
|
133
|
|
The Canadian Armed Forces also
open doors to success in careers outside of the Canadian Armed Forces
|
502
|
130
|
|
I would be proud to be in the
Canadian Armed Forces
|
575
|
128
|
|
I think that the Canadian
Armed Forces workplace environment is respectful of all people regardless of
cultural heritage
|
539
|
128
|
|
There are people I know who
could have a great career in the Canadian Armed Forces
|
499
|
125
|
|
There is a wide variety of
professions within the Canadian Armed Forces
|
586
|
122
|
|
People join the Canadian Armed
Forces when they have few other options available
|
428
|
120
|
|
Those Who Participate in…
|
|
|
|
Sailing
|
18*
|
235
|
|
Aviation
|
26*
|
232
|
|
Amateur radio
|
24*
|
192
|
|
A member of the Cadets program
|
32*
|
191
|
|
Marksmanship
|
26*
|
162
|
|
A member of Scouts or Girl
Guides
|
25*
|
158
|
|
Hunting and/or Fishing
|
56*
|
147
|
|
Canoeing
|
53*
|
144
|
|
Cycling
|
150
|
136
|
|
Vehicle Restoration
|
33*
|
120
|
|
Among Those Who Think the
Best Reason to Join is…
|
|
|
|
The possibility of having to
be in combat
|
95*
|
125
|
|
Training
|
135
|
124
|
|
Opportunities for career
advancement
|
138
|
121
|
|
Serving the country
|
200
|
117
|
|
Job security
|
223
|
115
|
|
Among Those Who Say the
Biggest Drawbacks Are…
|
|
|
|
Unable to fully utilize one’s
talent
|
95*
|
171
|
|
Limited job opportunities in
technical occupations and skilled trades
|
62*
|
156
|
|
Is not adventurous, for
example, offers little opportunity to travel
|
43*
|
154
|
|
Is not respected
|
49*
|
152
|
|
Limited variety of jobs
|
85*
|
137
|
|
Limited opportunities for
career advancement
|
72*
|
131
|
|
Lack of representation of
members of my gender or cultural community
|
93*
|
130
|
|
Having to follow orders
|
117
|
120
|
|
Giving up your freedom
|
176
|
116
|
|
Work-life balance
|
149
|
116
|
CONCLUSIONS AND RECOMMENDATIONS
Although
young Canadians do not tend to feel they are particularly familiar with the
CAF, there is nevertheless a broadly favourable attitude towards the CAF in
general. This favourable predisposition holds true regardless of region,
gender, cultural heritage or many other demographic characteristics. When it
comes to perceptions of the CAF as an employer, while knowledge is noticeably
lower, those offering an opinion have more favourable than unfavourable
impressions of CAF as an employer.
For
any organization hoping to attract new applicants from among this age cohort,
this positivity provides a helpful foundation.
Going
further into the specifics of how one evaluates career choices, the
self-assessed level of knowledge about the career options within the CAF
reduces still further, resulting in just over one in four youth feeling they
are knowledgeable.
Since
the default towards positivity is combined with a lack of familiarity with the
CAF – both in general and specifically as an employer – and a fairly widespread
lack of knowledge about the career options available within the CAF, the data
demonstrates there is an ability to raise the awareness and understanding of
the CAF career options and open the eyes of more young Canadians to the notion
of how a career in the CAF may be something that fits with their personal
goals, interests, values and ambitions.
Fewer
feel they have much knowledge about career options within the CAF, but again,
for those who offer an opinion, there is more default towards favourable than
unfavourable impressions of careers in the CAF.
At
the moment, roughly one in seven hold favourable impressions of the CAF in
general as well as of the CAF as an employer and are already likely to consider
a career in the CAF. This segment of “Likely Candidates” forms the most
promising pool of potential recruits to target in the short term. There are
other segments of the population who have some potential to be recruited, but
there is certainly a plurality of “Disinterested” individuals who would require
a significant amount of convincing in order to ever consider applying for a
career in the CAF. Strategically, it may be valuable over the long-term to see
this segment of the population reduced and the study identifies some of the key
attitudes to address should this is be an objective for the CAF, but in the
meantime, devoting resources to communicate with those more pre-disposed may be
more efficient.
As
one of the main objectives of this study was to investigate opinions among
youth who identify as visible minority or Indigenous, it is particularly useful
to note the relatively high interest in pursuing a career in the CAF already
exists among those respondents who identify as Indigenous, South Asian, Arab,
Filipino or Japanese.
There
are many more traits that correlate more strongly with interest in pursuing a
career in the CAF and several of them are perhaps stereotypical. These include
people who: want a career that is physically challenging; are (also) interested
in a career in law enforcement; place importance on values such as being
heroic; feel the possibility of being in combat is appealing; and, already enjoy
activities such as aviation, marksmanship, or being in the Cadets.
However,
the results of this study shed light on a far more diverse range of
possibilities for attracting youth to the CAF. The data suggests there are at
least three specific approaches that may improve the effectiveness of marketing
and advertising aimed at stimulating recruitment into the CAF and for the
most-part, these hold true whether targeting men or women:
§ Enabling certain life goals. Highlighting how a career in the CAF helps individuals
achieve goals of personal financial stability (e.g., home- or land-ownership,
being debt-free), fulfillment, friendship, the pursuit of interests while
cultivating the sense of freedom that comes with a sense of independence all
appear to be aspects that have the potential to broaden the appeal of, or
strengthen the interest in, a career in the CAF. For women, in particular, the
potential for the CAF to be an environment that contributes to their
professional development and success may be a uniquely valuable motivator, if
more widely known.
§ Opening eyes to a range of possibilities. Two aspects that are not as widely understood but which
tend to correlate with a higher inclination to join the CAF are:
o the notion that within the CAF, one can actually pursue
the careers that interest them, rather than being limited to options that do
not align with current interests; and,
o the notion that training received during one’s time in
the CAF can be leveraged to open doors to interesting career opportunities
after having spent time in the CAF.
The data suggest that educating young Canadians in
general, and women in particular, on these possibilities may increase the
willingness to consider a career in the CAF for some.
§ Removing perceived barriers where possible. Certain drawbacks to a career in the CAF may be
impossible to remove. There are many roles that may involve exposure to danger
and the requirement to be away from home are aspects that can never be entirely
removed for all career options within the CAF. However, there may be some
aspects where it may be possible to demonstrate that the drawback is not as
significant as assumed and changing that assumption may stimulate some youth to
increase their willingness to consider a career in the CAF. There are a few
that appear to have both the data evidence of being impactful and possibly be
aspects where there is an ability to alter impressions:
o Demonstrating that the CAF offers greater individual
freedom and flexibility than may be assumed, particularly as it pertains to the
ability for those in the CAF to choose, shape or perhaps even switch their
career to suit one’s evolving interests and needs;
o Placing physical challenge in context so that some of
those who are interested in careers that do not generally involve physical
challenge and specifically identify physical challenge as a drawback to a
career in the CAF, can more easily see themselves pursuing their preferred
(non-physical) careers in such fields as information technology, engineering
and even finance;
o For women in particular, proving that a career within the
CAF need not be narrowly defined and can allow one to explore numerous avenues
in order to ensure one is ultimately satisfied their talent has been fully
developed and utilized; and,
o There is also clearly a relationship between one’s sense
that the work environment is respectful of women and one’s openness to a career
in the CAF. The more the CAF can increase the proportion of women who see this
is the case, the greater the pool of potential recruits among women.
The
insights above are by no means the limits to how the results of this survey can
successfully guide the development of effective marketing and communications
strategies. Indeed, the survey results contain a wealth of information that
the CAF can possibly use in very narrowly focused ways to stimulate recruitment
among young Canadians. Fundamentally, the results prove the public opinion
environment includes a significant number of youth who welcome additional
information from the CAF on how a career may suit them and perhaps more
importantly, may suit them in ways they value but which they do not currently
expect.
APPENDIX
A: METHODOLOGY REPORT
Survey Methodology
Earnscliffe
Strategy Group’s overall approach for this study was to conduct an online
survey of Canadians aged 17 to 23, using Léger’s online survey panel. A
detailed discussion of the approach used to complete this research is presented
below.
Questionnaire Design
The
questionnaire for this study was designed by Earnscliffe in consultation with
DND, drawing on previous studies, and provided for fielding to Léger. The
survey was offered to respondents in both English and French and completed based
on their preferences.
Sample Design and Selection
The
sampling plan for the study was designed by Earnscliffe to ensure the
appropriate quotas were achieved. The sample was drawn by Leger based on
Earnscliffe’s instructions from their proprietary online panel. To achieve the
desired sample size of visible minority and Indigenous respondents, Leger
partnered with Decision Point Research and drew from the latter’s proprietary
multicultural research panel. For more comprehensive details on the nature of
the opt-in panels used, the Government of Canada is already in possession of
each company’s responses to the ESOMAR28 questions. In total, 406 completes
were from Decision Point’s panel. In total, 406 completes were from Decision
Point’s panel.
Data Collection
The
survey was conducted in English and French from March 5, 2019 to March 24, 2019.
The survey was undertaken by Leger’s online opt-in panel headquartered in
Montréal, Québec.
Targets/Weighting
The
sample was targeted to region, age and gender quotas, along with setting a
target to ensure half of the respondents self-identified as members of a
visible minority. The data was weighted by age, region, gender and membership
to a visible minority group.
|
REGION/PROVINCE
|
Actual %
|
Sample %
|
Expected:
Visible Minority/
Indigenous
(17-23)
|
Sample: Visible Minority/Indigenous (17-23)
|
Expected: Rest of Canadians
(17-23)
|
Sample: Rest of Canadians (17-23)
|
|
Atlantic Canada
|
6.8%
|
10%
|
68
|
101
|
68
|
100
|
|
Quebec
|
23.4%
|
25%
|
234
|
251
|
234
|
263
|
|
Ontario
|
38.3%
|
33%
|
383
|
334
|
383
|
332
|
|
Prairies
|
6.5%
|
10%
|
66
|
100
|
66
|
101
|
|
Alberta
|
11.2%
|
10%
|
113
|
101
|
113
|
101
|
|
British Columbia
|
13.5%
|
12%
|
136
|
121
|
136
|
126
|
|
TOTAL
|
100%
|
100%
|
1,000
|
1,008
|
1,000
|
1,023
|
Reporting
Bolded
results in the tables presented in this report indicate that the difference
between the demographic groups analysed are significantly higher than results
found in other columns in the table. In the text of the report, unless
otherwise noted, demographic differences highlighted are statistically
significant at the 95% confidence level. The statistical test used to determine
the significance of the results was the Z-test.
Quality Controls
Leger
conducted a soft-launch pre-test of the survey, and Earnscliffe reviewed the
data to ensure that all skip patterns were working and that all respondents
were completing the survey in an appropriate amount of time.
Results
FINAL DISPOSITIONS
A
total of 7,931 individuals entered the online survey, of which 2,031 qualified
as eligible and completed the survey. The response rate for this survey was 11.91%.
|
Total Entered Survey
|
7931
|
|
Completed
|
2031
|
|
Not
Qualified/Screen out
|
3438
|
|
Over quota
|
1830
|
|
Suspend/Drop-off
|
632
|
|
|
|
|
Unresolved
(U)
|
53442
|
|
Email invitation bounce-backs
|
375
|
|
Email invitations unanswered
|
53067
|
|
In-scope
- Non-responding (IS)
|
632
|
|
Non-response from eligible
respondents
|
N/A
|
|
Respondent refusals
|
N/A
|
|
Language problem
|
N/A
|
|
Selected respondent not available
|
N/A
|
|
Qualified respondent break-off
|
632
|
|
In-scope
- Responding units (R)
|
7313
|
|
Completed surveys disqualified – quota filled
|
1830
|
|
Completed surveys disqualified – other reasons
|
3438
|
|
Completed surveys
|
2031
|
|
Response
Rate = R/(U+IS+R)
|
11.91%
|
NONRESPONSE
Respondents
for the online survey were selected from among those who have volunteered to
participate in online surveys by joining an online opt-in panel. The notion of
non-response is more complex than for random probability studies that begin
with a sample universe that can, at least theoretically, include the entire
population being studied. In such cases, non-response can occur at a number of
points before being invited to participate in this particular survey, let alone
in deciding to answer any particular question within the survey.
That
being said, in order to provide some indication of whether the final sample is
unduly influenced by a detectable non response bias, we provide the tables
below comparing the unweighted and weighted distributions of each sample’s
demographic characteristics.
All weighting was determined based upon the most recent Census
data available from Statistics Canada. The variables used for the weighting of
each sample were age and gender within each region, and whether or not the
respondent was a member of a visible minority community.
SAMPLE PROFILE: UNWEIGHTED VS. WEIGHTED DISTRIBUTIONS
|
Region
|
Unweighted Sample
|
Weighted Sample
|
|
Atlantic
|
201
|
125
|
|
Quebec
|
514
|
445
|
|
Ontario
|
666
|
817
|
|
Manitoba/Saskatchewan
|
201
|
145
|
|
Alberta
|
202
|
238
|
|
British Columbia/Territories
|
247
|
261
|
|
Gender
|
Unweighted Sample
|
Weighted Sample
|
|
Female
|
1123
|
1010
|
|
Male
|
891
|
992
|
|
Gender Diverse
|
17
|
30
|
|
Employment
|
Unweighted Sample
|
Weighted Sample
|
|
Working full-time
|
324
|
366
|
|
Working part-time
|
266
|
276
|
|
Self-employed
|
32
|
39
|
|
Unemployed, but looking for work
|
71
|
85
|
|
Full-time student
|
1189
|
1135
|
|
Part-time student
|
102
|
82
|
|
Not in the workforce
|
37
|
40
|
|
Retired
|
2
|
2
|
|
Prefer not to answer
|
8
|
6
|
|
Education
|
Unweighted Sample
|
Weighted Sample
|
|
Grade 8 or less
|
23
|
13
|
|
Some high school
|
291
|
298
|
|
High school diploma or equivalent
|
828
|
832
|
|
Registered apprenticeship or other trades certificate or
diploma
|
92
|
100
|
|
College, CEGEP or other non-university certificate or
diploma
|
328
|
323
|
|
University certificate or diploma below bachelor’s level
|
144
|
143
|
|
Bachelor’s degree
|
287
|
286
|
|
Post graduate degree above bachelor’s level
|
21
|
22
|
|
Household Income
|
Unweighted Sample
|
Weighted Sample
|
|
Under $20,000
|
317
|
327
|
|
$20,000 to just under $40,000
|
287
|
293
|
|
$40,000 to just under $60,000
|
271
|
251
|
|
$60,000 to just under $80,000
|
281
|
277
|
|
$80,000 to just under $100,000
|
283
|
267
|
|
$100,000 to just under $150,000
|
220
|
217
|
|
$150,000 and above
|
106
|
135
|
|
Prefer not to answer
|
266
|
265
|
|
Indigenous Heritage
|
Unweighted Sample
|
Weighted Sample
|
|
Indigenous person, that is, First Nations (North American
Indian), Métis or Inuk (Inuit)
|
268
|
102
|
|
Ethnicity
|
Unweighted Sample
|
Weighted Sample
|
|
White
|
1090
|
1516
|
|
South Asian
|
151
|
115
|
|
Chinese
|
202
|
136
|
|
Black
|
156
|
85
|
|
Filipino
|
60
|
37
|
|
Latin American
|
61
|
31
|
|
Arab
|
64
|
30
|
|
Southeast Asian
|
52
|
32
|
|
West Asian
|
21
|
11
|
|
Korean
|
14
|
10
|
|
Japanese
|
15
|
12
|
|
Other
|
11
|
8
|
MARGIN OF ERROR
Respondents
for the online survey were selected from among those who have volunteered to
participate/registered to participate in online surveys. The data have been
weighted to reflect the demographic composition of the Canadian population aged
17 to 23. Because the sample is based on those who initially self-selected for
participation in the panel, no estimates of sampling error can be calculated.
The treatment here of the non-probability sample is aligned with the Standards for the Conduct of Government of Canada Public
Opinion Research for online surveys.
SURVEY DURATION
The
median survey duration was 14 minutes.
APPENDIX B: SURVEY INSTRUMENT
Research Approach
An
online survey of 2,000 Canadians between the ages of 17 and 23. The survey
will be conducted with Canadians who would be potentially eligible to join the
Canadian Armed Forces (CAF) and the sample will be evenly divided between
Canadians who self-identify as visible or cultural minorities and those who do
not. The survey will be completed in English and French, representative of the
first official language distribution across the country. To ensure sufficient
representation of Canadians, we will set quotas as outlined in the table below.
|
|
Minority
Canadians
|
Non-Minority
Canadians
|
|
Region
|
|
Atlantic Canada
|
100
|
100
|
|
Quebec
|
250
|
250
|
|
Ontario
|
330
|
330
|
|
Prairies (MB/SK)
|
100
|
100
|
|
Alberta
|
100
|
100
|
|
British Columbia
|
120
|
120
|
|
Total
|
1,000
|
1,000
|
Email Invitation
LA VERSION FRANÇAISE SUIT
Welcome and thank you for your
interest in this study. Earnscliffe Strategy Group, in collaboration with Leger
Marketing, has been hired to administer an online survey on behalf of the
Government of Canada. The purpose of the study is to explore Canadians’
education, career planning and choices.
This online survey will take
about 15 to 17 minutes to complete. Your participation in the study is
voluntary and completely confidential. All your answers will remain anonymous
and will be combined with responses from all other respondents. As a token of
our appreciation for your participation, you will receive [insert reward].
If you have any questions about
the survey or if you encounter any difficulties, please email [INSERT EMAIL
CONTACT].
To begin, click on the link
below.
[URL]
Landing Page
Welcome and thank you for your
interest in this study. Earnscliffe Strategy Group, in collaboration with
Leger, has been hired to administer an online survey on behalf of the
Government of Canada. The purpose of the study is to explore Canadians’
education, career planning and choices.
Your responses to this survey
will be kept entirely confidential and any information you provide will be
administered in accordance with the Privacy Act and other applicable privacy
laws. Do you wish to continue?
Yes
No [TERMINATE]
Section 1: Screening
1.
Are you a Canadian citizen?
Yes 1
No [THANK & TERMINATE] 2
Prefer not to answer [THANK
& TERMINATE] 9
2.
Please indicate your gender.
Male 1
Female 2
Gender diverse 3
Prefer not to answer [THANK
& TERMINATE] 9
3.
In what year were you born?
[INSERT YEAR. IF YOUNGER/OLDER
THAN 17-23 YEARS, THANK & TERMINATE]
4.
Which of the following provinces or
territories do you live in?
Newfoundland and Labrador 1
Nova Scotia 2
Prince Edward Island 3
New Brunswick 4
Quebec 5
Ontario 6
Manitoba 7
Saskatchewan 8
Alberta 9
British Columbia 10
Yukon 11
Nunavut 12
Northwest Territories 13
Prefer not to say [THANK &
TERMINATE] 99
5.
Do you work for the Canadian Armed
Forces?
Yes [THANK & TERMINATE] 1
No 2
Prefer not to answer [THANK
& TERMINATE] 9
6.
Are you an Indigenous person, that
is, First Nations, Métis or Inuk (Inuit)?
Yes 1
No 2
Prefer not to answer 9
7.
[IF NOT INDIGENOUS] Are you…? [SELECT
ALL THAT APPLY]
White 1
South Asian (e.g., East Indian, Pakistani, Sri Lankan, etc.) 2
Chinese 3
Black 4
Filipino 5
Latin American 6
Arab 7
Southeast Asian (e.g.,
Vietnamese, Cambodian, Malaysian, Laotian, etc.) 8
West Asian (e.g., Iranian,
Afghan, etc.) 9
Korean 10
Japanese 11
Other [SPECIFY] 12
Prefer not to answer [THANK
& TERMINATE] 99
FOR CAUCASION SAMPLE: Q6>1 AND
Q7=1 ONLY.
FOR NON-CAUCASION SAMPLE: Q6=1 OR
Q7 HAS AT LEAST ONE RESPONSE BETWEEN 2 AND 11.
Section 2: Personal Situation, Outlook & Aspirations
8.
Which of the following best describes
your current employment status?
Working full-time, that is, 30
or more hours per week 1
Working part-time, that is,
less than 30 hours per week 2
Self-employed 3
Unemployed, but looking for
work [SKIP TO Q10] 4
A student attending school
full-time [SKIP TO Q10] 5
A student attending school
part-time [SKIP TO Q10] 6
Retired [SKIP TO Q10] 7
Not in the workforce (full-time
homemaker, unemployed, not looking for work) [SKIP TO Q10] 8
Prefer not to answer [SKIP TO
Q10] 9
9.
You indicated that you are (INSERT Q8
RESPONSE: working full-time/ working part-time/ self-employed). In which field
are you currently working? [RANDOMIZE]
Information technology 1
Entrepreneur/Business 2
Public service/Government 3
Banking/Finance 4
Engineering 5
Architecture 6
Sports/Entertainment 7
Education 8
Healthcare profession 9
Legal profession 10
Skilled trades 11
Police/Law enforcement 12
Military 13
Retail or service industry 14
Manufacturing 15
Distribution 16
Marketing/Advertising/Media 17
Mining 18
Travel & Tourism 19
Research & Development 20
Journalism 21
Creative career (e.g.,
designer, musician, film maker) 22
Other (specify) 77
Don’t know/Prefer not to answer 99
10. Which three other career fields do you find the
most interesting? [EXCLUDE ANSWER TO PREVIOUS QUESTION. USE SAME ORDER AS
Q9.]
Information technology 1
Entrepreneur/Business 2
Public service/Government 3
Banking/Finance 4
Engineering 5
Architecture 6
Sports/Entertainment 7
Education 8
Healthcare profession 9
Legal profession 10
Skilled trades 11
Police/Law enforcement 12
Military 13
Retail or service industry 14
Manufacturing 15
Distribution 16
Marketing/Advertising/Media 17
Mining 18
Travel & Tourism 19
Research & Development 20
Journalism 21
Creative career (e.g.,
designer, musician, film maker) 22
Other (specify) 77
Don’t know/Prefer not to answer 99
11. Which three of the following types of career
fields do you find least interesting? That is, which three are the
career/profession you would least prefer? [EXCLUDE ANSWERS TO PREVIOUS
QUESTIONS. KEEP ORDER IDENTICAL TO Q9.]
Information technology 1
Entrepreneur/Business 2
Public service/Government 3
Banking/Finance 4
Engineering 5
Architecture 6
Sports/Entertainment 7
Education 8
Healthcare profession 9
Legal profession 10
Skilled trades 11
Police/Law enforcement 12
Military 13
Retail or service industry 14
Manufacturing 15
Distribution 16
Marketing/Advertising/Media 17
Mining 18
Travel & Tourism 19
Research & Development 20
Other (specify) 77
Don’t know/Prefer not to answer 99
12. From the list below, which three do you most want out
of a career? [RANDOMIZE. ANCHOR OTHER, NONE OF THE ABOVE AND DK AT THE
BOTTOM. ALLOW UP TO 3 ANSWERS]
Job security 1
Good pay 2
Adventure, for example, offers
opportunity to travel 3
Would not require moving far
away for the job 4
Offers a positive work
environment 5
Offers benefits such as health
insurance/drug plan 6
Offers a pension 7
Offers the flexibility to
change careers 8
Offers paid university
education, while on a full-time salary 9
Is respected 10
Is prestigious 11
Is intellectually challenging 12
Is physically challenging 13
Is competitive (not something
that anyone can do) 14
Offers freedom and flexibility 15
Offers the opportunity for
promotion and advancement 16
Offers free job training, while
on full-time salary 17
Is an equal opportunity
employer 18
There are job/career
opportunities in that field 19
Work-life balance 20
Offers training 21
Offers mentorship 22
Other (specify) 77
None of the above 98
Don’t know/Prefer not to answer 99
13. And how confident are you will have a career that [INSERT
ANY SELECTED ANSWERS <98 FROM Q13. FOR ANSWERS 1, 2, 4, 5 AND 21 INSERT
“delivers” BEFORE RESPONSE]?
Not at all confident 1
Not very confident 2
Somewhat confident 3
Very confident 4
Don’t know/Prefer not to answer 9
14. And can you identify which three matter the least
to you in making career decisions? [EXCLUDE RESPONSES FROM Q12. USE SAME
ORDER AS Q12. ALLOW UP TO 3 ANSWERS]
Job security 1
Good pay 2
Adventure, for example, offers
opportunity to travel 3
Would not require moving far
away for the job 4
Offers a positive work
environment 5
Offers benefits such as health
insurance/drug plan 6
Offers a pension 7
Offers the flexibility to
change careers 8
Offers paid university
education, while on a full-time salary 9
Is respected 10
Is prestigious 11
Is intellectually challenging 12
Is physically challenging 13
Is competitive (not something
that anyone can do) 14
Offers freedom and flexibility 15
Offers the opportunity for
promotion and advancement 16
Offers free job training, while
on full-time salary 17
Is an equal opportunity
employer 18
There are job/career
opportunities in that field 19
Work-life balance 20
Offers training 21
Offers mentorship 22
Other (specify) 77
None of the above 98
Don’t know/Prefer not to answer 99
15. How satisfied would you say you are with your life right
now?
Very dissatisfied 1
Somewhat dissatisfied 2
Neither satisfied nor
dissatisfied 3
Somewhat satisfied 4
Very satisfied 5
Don’t know/Prefer not to answer 9
Section 3: Values & Goals
16. Below is a list of values or character traits that may be
important to some people and unimportant to others. Please rank the five that
are most important to you personally. [RANDOMIZE. SELECT FIVE.]
Being proud to be Canadian 1
Being of service to one’s community 2
Making a difference 3
Being of good character 4
Tackling important challenges 5
Being heroic 6
Being compassionate 7
Being tolerant of others 8
Respecting tradition 9
Being determined or perseverant 10
Thinking independently, for
oneself 11
Being creative 12
Being fun-loving 13
Curiosity 14
Continuous learning and
self-development 15
Being successful 16
Freedom to choose one’s path 17
Being loyal 18
17. What are the three things you most want to achieve in
life? [OPEN-END]
a) Answer 1: [OPEN-END]
b) Answer 2: [OPEN-END]
c) Answer 3: [OPEN-END]
18. There are many different types of goals people might have
for their life. For each of the following, please indicate how important, if
at all, each goal is to you personally. [RANDOMIZE]
a. Getting married or having a life partner
b. Being a parent
c. Owning a home
d. Having a full-time, steady job
e. Being engaged in your community
f. Being proud of your job or career
g. Being famous
h. Being financially successful
i. Being recognized (by your community or your peers)
j. Having a good work/life balance
k. Having a clear career path
Not at all important 1
Not very important 2
Somewhat important 3
Very important 4
Don’t know/Prefer not to answer 9
Section 4: Civics
19. How closely do you follow news about current events?
Very closely 4
Somewhat closely 3
Not very closely 2
Not at all 1
Don’t know/Prefer not to answer 9
20. How interested are you in politics or political issues of
the day?
Very interested 4
Somewhat interested 3
Not very interested 2
Not at all interested 1
Don’t know/Prefer not to answer 9
21. In which of the following leisure activities do you
participate? [SELECT ALL THAT APPLY.]
Sailing 1
Canoeing 2
Fitness 3
Water Sports 4
Vehicle Restoration 5
Competing in Team Sports 6
Music 7
Visual Arts 8
Aviation 9
Amateur radio 10
Marksmanship 11
Hunting and/or Fishing 12
Video Games 13
Culinary Arts 14
Competing in Individual Sports 15
Cycling 16
Performing Arts 17
Television and Movies 18
A member of Scouts or Girl
Guides 19
A member of the Cadets program 20
Other [SPECIFY] 97
None of the above 98
Don’t know/Prefer not to say 99
Section 5: Career in the Canadian Armed Forces
22. How familiar are you with the Canadian Armed Forces?
Very familiar 4
Somewhat familiar 3
Not very familiar 2
Not at all familiar 1
Don’t know/Prefer not to answer 9
23. Generally speaking, would you say that you have a very
favourable, somewhat favourable, not very favourable, or not at all favourable
opinion of the Canadian Armed Forces?
Very favourable 4
Somewhat favourable 3
Not very favourable 2
Not at all favourable 1
Don’t know/Prefer not to answer 9
24. [IF Q23=4 OR IF Q23=1] Why do you say that? [OPEN-END]
25. Would you say you have a very favourable, somewhat
favourable, not very favourable, or not at all favourable opinion of the Canadian
Armed Forces as an employer?
Very favourable 4
Somewhat favourable 3
Not very favourable 2
Not at all favourable 1
Don’t know/Prefer not to answer 9
26. Today, how likely are you to consider a career in the
Canadian Armed Forces?
Very likely 4
Somewhat likely 3
Not very likely 2
Not at all likely 1
Don’t know/Prefer not to answer 9
27. [IF NOT VERY LIKELY OR NOT AT ALL LIKELY] Have you ever
considered a career in the Canadian Armed Forces?
Yes 2
No 1
Don’t know/Prefer not to answer 9
28. How knowledgeable do you feel you are about career
opportunities within the Canadian Armed Forces?
Very knowledgeable 4
Somewhat knowledgeable 3
Not very knowledgeable 2
Not at all knowledgeable 1
Don’t know/Prefer not to answer 9
29. If you found out that it was possible to pursue a career
[IF ANSWERED Q10: “in [INSERT Q10 RESPONSES]”; EVERYONE ELSE: “of interest to
you”] as a member of the Canadian Armed Forces, how likely would you be to
consider applying to the Canadian Armed Forces?
Very likely 4
Somewhat likely 3
Not very likely 2
Not at all likely 1
Don’t know/Prefer not to answer 9
30. How knowledgeable do you feel you are about opportunities
within the Reserve Force in the Canadian Armed Forces?
Very knowledgeable 4
Somewhat knowledgeable 3
Not very knowledgeable 2
Not at all knowledgeable 1
Don’t know/Prefer not to answer 9
31. Reservists usually have a full-time job or attend school
during the daytime and work on a part-time basis with the Canadian Armed
Forces. Reservists play an important role in supporting Canadian operations
both at home and abroad (e.g., Helping with flood relief efforts in Quebec and
Manitoba). Reservists are also active in their communities and help with
cultural events, parades, festivals and other public events in communities
across Canada (e.g., the 2010 Winter Olympics in Vancouver). Part-time members
may also choose to serve overseas, when there are opportunities available. How interested would you be in joining the Canadian
Armed Forces Reserves?
Very interested 4
Somewhat interested 3
Not very interested 2
Not at all interested 1
Don’t know/Prefer not to answer 9
32. To what extent do you agree or disagree with each of the
following statements? [RANDOMIZE. DISPLAY SCALE AT THE TOP, MIDDLE AND BOTTOM
OF GRID.]
a. I could see myself joining the Canadian Armed Forces
b. I could see myself joining the Royal Canadian Navy
c. I could see myself joining the Canadian Army
d. I could see myself joining the Royal Canadian Air Force
e. My friends would encourage me to join the Canadian Armed Forces
if it were of interest to me
f. My family would encourage me to join the Canadian Armed
Forces if it were of interest to me
g. People join the Canadian Armed Forces when they have few
other options available
h. There is a wide variety of professions within the
Canadian Armed Forces
i. The Canadian Armed Forces also open doors to success in
careers outside of the Canadian Armed Forces
j. I think that the Canadian Armed Forces workplace
environment is respectful of women
k. I think that the Canadian Armed Forces workplace
environment is respectful of all people regardless of cultural heritage
l. A career in the Canadian Armed Forces makes it difficult
to raise a family
m. I would be proud to be in the Canadian Armed Forces
n. There are people I know who could have a great career in
the Canadian Armed Forces
Strongly agree 4
Somewhat agree 3
Somewhat disagree 2
Strongly disagree 1
Don’t know/Prefer not to answer 9
33. There are a number of factors people might consider for
why they would or would not join the Canadian Armed Forces. [ROTATE ORDER OF A
AND B AND RANDOMIZE VARIABLES WITHIN EACH LIST]
a. Below is a list of factors that may make someone consider
pursuing a career in the Canadian Armed Forces. Regardless of your current
interest in a career in the Canadian Armed Forces, please rank the three
most compelling to you, personally. [RANDOMIZE]
Paid education 1
Job security 2
Valuable work experience 3
Opportunities for career
advancement 4
A wide variety of jobs 5
Serving the country 6
Helping others 7
Working with state-of-the-art
technology 8
Interesting challenges 9
Traveling to other parts of the
country and world 10
Being exposed to high-pressure
or risky situations 11
The possibility of having to be
in combat 12
Typically involves a lot of
physical labour 13
The salary and benefits 14
Having transferable skills 15
Work-life balance 16
Training 17
Other [SPECIFY] 98
b. Below is a list of factors that may make someone decide
NOT to pursue a career in the Canadian Armed Forces. Which three of the
following reasons best describe why you would avoid a career in the Canadian
Armed Forces? [RANDOMIZE]
Work experience that does not
help outside of the Canadian Armed Forces 1
Limited opportunities for
career advancement 2
Limited variety of jobs 3
Boring/Not interesting 4
Being exposed to danger 5
Giving up your freedom 6
Having to follow orders 7
Being away from home and family 8
Limited job opportunities in
technical occupations and skilled trades 9
Unable to fully utilize one’s
talent 11
The possibility of having to be
in combat 12
Typically involves a lot of
physical labour 13
Typically requires a minimum
commitment of 3 years 14
Being micro-managed 15
The salary and benefits 16
Work-life balance 17
Job instability (risk of
unemployment) 18
Is not adventurous, for
example, offers little opportunity to travel 19
Does not offer a positive work
environment 20
Does not offer the flexibility
to change careers 21
Is not respected 22
Is not prestigious 23
Lack of representation of
members of my gender or cultural community 24
It is not something or people I
see myself identifying with 25
Other [SPECIFY] 98
34. To what extent would you say each of the following
describes a career in the Canadian Armed Forces? [DISPLAY IN SAME ORDER AS
Q12]
Job security 1
Good pay 2
Adventure, for example, offers
opportunity to travel 3
Would not require moving far
away for the job 4
Offers a positive work
environment 5
Offers benefits such as health
insurance/drug plan 6
Offers a pension 7
Offers the flexibility to change
careers 8
Offers paid university
education, while on a full-time salary 9
Is respected 10
Is prestigious 11
Is intellectually challenging 12
Is physically challenging 13
Is competitive (not something
that anyone can do) 14
Offers freedom and flexibility 15
Offers the opportunity for
promotion and advancement 16
Offers free job training, while
on full-time salary 17
Is an equal opportunity
employer 18
There are job/career
opportunities in that field 19
Work-life balance 20
Offers training 21
Offers mentorship 22
Describes very well 4
Describes somewhat 3
Does not describe very well 2
Does not describe at all 1
Don’t know/Prefer not to answer 9
Section 6:
Video Testing
Next, you will be shown a brief
video and then asked for your impressions of it. [RANDOMLY SELECT ONE VIDEO TO
TEST PER RESPONDENT.]
35. For each of the following, please indicate how well this
applies to what you just watched? [RANDOMIZE]
a. It was appealing to watch
b. It was compelling
c. It seemed meant for you
d. It made you more interested in a career in the Canadian
Armed Forces
Does not apply at all 1
Applies a little 2
Somewhat applies 3
Applies very well 4
Don’t know/Prefer not to answer 9
Section 7:
Demographics
The last few questions are
strictly for statistical purposes. All of your answers are completely
confidential.
36. What is the highest level of schooling that you have
completed?
Grade 8 or less 1
Some high school 2
High school diploma or
equivalent 3
Registered apprenticeship or
other trades certificate or diploma 4
College, CEGEP or other
non-university certificate or diploma 5
University certificate or
diploma below bachelor’s level 6
Bachelor’s degree 7
Post graduate degree above
bachelor’s level 8
Prefer not to answer 9
37. Which of the following categories best describes your
total household income for 2018? That is, the total income of all persons in
your household combined, before taxes?
Under $20,000 1
$20,000 to just under $40,000 2
$40,000 to just under $60,000 3
$60,000 to just under $80,000 4
$80,000 to just under $100,000 5
$100,000 to just under $150,000 6
$150,000 and above 7
Prefer not to answer 9
38. How would you describe the area in which you live?
Urban 1
Suburban 2
Rural 3
Prefer not to answer 9
39. What is your marital status?
Single 1
Married/living with
someone/common law 2
Separated/divorced 3
Widowed 4
Other 5
Prefer not to answer 9
40. What are the first three digits of your postal code?
[INSERT FIRST THREE DIGITS OF
POSTAL CODE. FORMAT A1A]
Prefer not to answer 9
This concludes the survey. Thank you for your
participation!