This research report presents the results of an online survey conducted by Ekos Research Associates Inc. on behalf of Natural Resources Canada. The research involved an online survey of 3,449 Canadians. The survey was conducted across Canada in both official languages. The field dates for the survey were July 16-August 3, 2021.
Cette publication est aussi disponible en français sous le titre : Sensibilisation, connaissances et attitudes des Canadiens par rapport aux véhicules à émission zéro (VEZ).
This publication may be reproduced for non-commercial purposes only. Prior written permission must be obtained from Natural Resources Canada. For more information on this report, please contact Natural Resources Canada at: nrcan.por-rop.rncan@canada.ca
Catalogue Number:
M144-311/2021E-PDF
International Standard Book Number (ISBN):
978-0-660-41008-1
Related publications (registration number: POR 021-21)
To date the Government of Canada has invested more than $1B in support of ZEVs, has made long-term commitments to accelerating ZEV adoption, and has committed to a mandatory target of 100 per cent of light-duty vehicles sales by 2035.
As indication of the Government's commitment to achieving these targets, the Strengthened Climate Plan of December 2020 confirmed new investments of $287M for ZEV vehicle purchase rebates ($587M total to-date), and $150M for charging infrastructure ($460M total to-date), along with a commitment to “work with partners in the year ahead on supply-side policy options”.
For the Government to achieve its ZEV targets, awareness, knowledge and public confidence in ZEV technologies have been acknowledged by all stakeholders as critical.
Although various parties in Canada have conducted sporadic consumer surveys over the past decade that seek to measure these factors in the Canadian general public, these have not been designed as baseline surveys to then be repeated consistently over time, so comparison between years of the fast-evolving consumer perspectives on ZEVs cannot be undertaken with scientific rigour.
Consequently, NRCan commissioned Ekos Research Associates to undertake a baseline survey of Canadians examining their awareness, knowledge and confidence in ZEVs. This survey will be repeated on an annual or bi-annual basis, and will provide key performance indicators on the success of efforts to rapidly increase consumer confidence and action on the purchase of ZEV technologies.
B. Methodology
The research involved an online survey of 3,449 Canadians. The survey was conducted across Canada in both official languages. The field dates for the survey were July 16-August 3, 2021.
Appendix A contains a detailed description of the methodology used in this study.
Appendix B contains the full survey questionnaire.
C. Key Findings
Survey results reveal that Canadians hold mixed views on electric vehicles and a general lack of knowledge about these vehicles. Canadians strongly believe that ZEVs are beneficial for the environment, but also feel they are expensive and difficult to fuel/charge. Canadians also have limited experience with ZEVs, and little understanding about a range of important issues associated with these vehicles, such as safety, vehicle charging, performance, maintenance costs, and resale value, suggesting these are areas in need of increased ZEV awareness/ education initiatives.
Highlight Results
The following highlight results suggest that although there is interest in ZEVs among Canadians, increased communications efforts will be required to overcome some of the concerns about ZEVs (e.g. charging, reliability, costs to run and maintain), and the general lack of knowledge and exposure to these vehicles among the Canadian public.
66 per cent have never ridden in or driven a ZEV (74 per cent in Atlantic Canada).
83 per cent would be interested in taking a ZEV for a test drive.
25 per cent are very interested in a zero emission vehicle and will definitely consider one when purchasing their next vehicle
51 per cent have considered purchasing or leasing a vehicle that runs on electricity
34 per cent don't feel there is a ZEV available that meets the needs of their lifestyle.
27 per cent cannot name any ZEV makes or models.
53 per cent agree that there are too few, if any, publicly available charging stations where they drive (67 per cent in Saskatchewan/Manitoba).
46 per cent are unsure whether the repair and maintenance costs for a zero emission vehicle are lower than for a gas or diesel-powered vehicle
79 per cent say proven reliability in Canadian climates would make them more likely to consider purchasing or leasing a ZEV.
Outlined below are key findings from this study, organized by topic area. The remainder of this report describes survey results in more detail.
Intention to Purchase/Lease a Vehicle
Respondents were first asked if they plan to purchase or lease a new or used vehicle in the next 10 years. Results reveal that two-thirds of Canadians (68 per cent) say they do intend to purchase a vehicle within the next 10 years. When asked in what timeframe they plan to purchase a vehicle, most of these respondents indicated within the next 2-5 years (39 per cent), or within the next 2 years (35 per cent).
Canadians were also asked how many vehicles they currently have in their household. The plurality (42 per cent) indicate they have one vehicle, while a sizeable proportion (35 per cent) say they have two vehicles.
Ownership and Intention to Lease/Purchase an Electric Vehicle
Those who indicated they had a vehicle in their household were asked if they currently lease or own an electric vehicle. Results reveal that only five per cent of Canadians say they currently own or lease a vehicle that runs on electricity; the vast majority (95 per cent) do not.
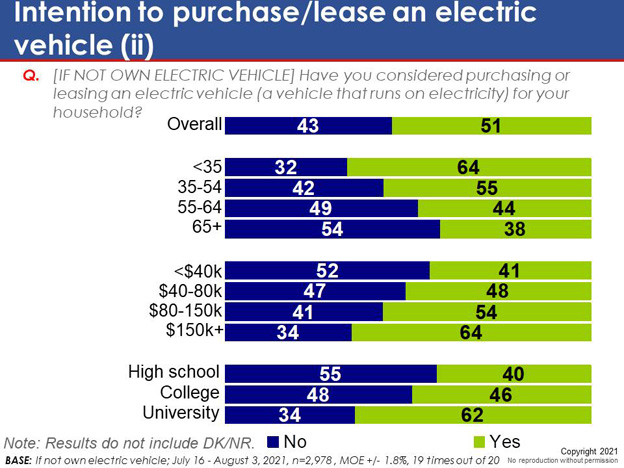
Those who do not own or lease an electric vehicle were asked if they had considered purchasing or leasing an electric vehicle for their household. Results are roughly split, with a slight majority (51 per cent) indicating that they had considered purchasing an electric vehicle, and 43 per cent indicating no.
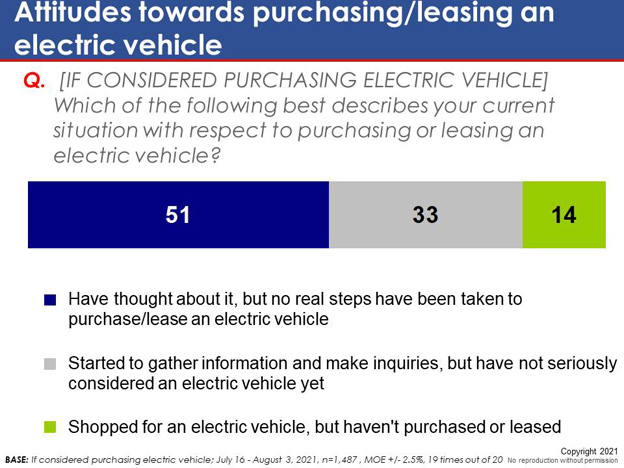
Results further reveal that 51 per cent of those who had considered purchasing/leasing an electric vehicle say they have not taken any real steps to purchase/lease this type of vehicle. One in three (33 per cent) say they have started to gather information and make inquiries, but have not yet seriously considered an electric vehicle. Only one in seven of these respondents (14 per cent) say they have actually shopped for an electric vehicle.
Experience with Zero Emission Vehicles
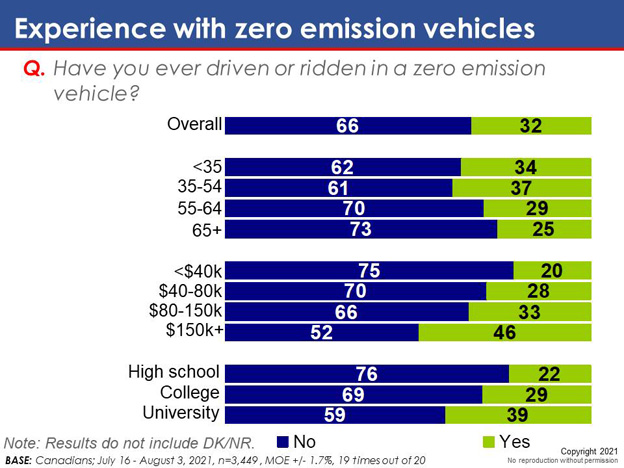
Respondents were also asked if they had ever driven or ridden in a zero emission vehicle. Results reveal that most Canadians (66 per cent) have no direct experience with ZEVs.
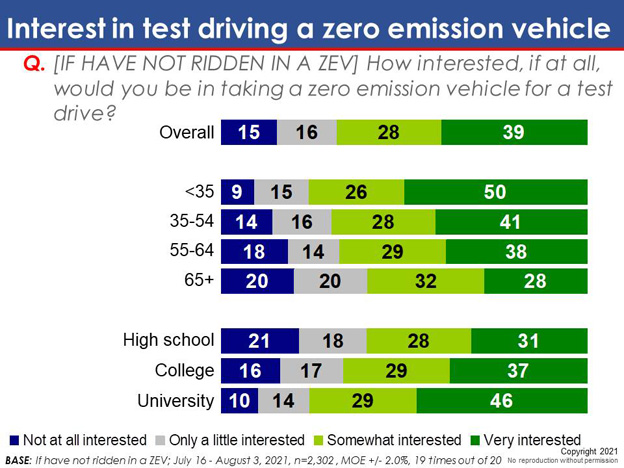
Those who had not driven or ridden in a ZEV were asked how interested they would be in taking a zero emission vehicle for a test drive. Most say they would be very (39 per cent) or somewhat (29 per cent) interested. A further 16 per cent said they were only a little interested in this idea, and 15 per cent said they were not at all interested.
Familiarity and Views on Zero Emission Vehicle Features
Results reveal that Canadians have limited familiarity with the various aspects of zero emission or electric vehicles. Respondents are most familiar with the environmental benefits of ZEVs (62 per cent indicate they are very or somewhat familiar with the environmental impact of electric vehicles). However, fewer than half say they are familiar with the potential to charge (“fuel up”) the battery at their home (49 per cent), how far a ZEV can go on a fully charged battery (46 per cent), the price of ZEVs (45 per cent), or how the “fueling up” process works when electricity powers a vehicle (43 per cent). Only about one in three express familiarity with the time required to charge the battery, or the availability of consumer information about ZEVs. Even fewer express familiarity with the warranty, resale value, towing capacity, or insurance costs of ZEVs.
Respondents were also asked a number of attitudinal questions about ZEVs. Results reveal mixed views on electric vehicles, and, reinforcing earlier results, a general lack of knowledge about these vehicles (from 14 to 52 per cent of Canadians could not provide a response to the questions asked).
A clear majority of Canadians (63 per cent) believe that zero emission vehicles are too expensive (and only 7 per cent disagree with this idea). However, Canadians also strongly believe that ZEVs are better for the environment than other types of vehicles: six in ten agree that zero emission vehicles contribute significantly to a reduction of greenhouse gas emissions and air pollutants compared to gas or diesel-powered vehicles (61 per cent), and that zero emission vehicles are less damaging to the environment than gas or diesel-powered vehicles (58 per cent).
At the same time, concerns are expressed about charging ZEVs. More than half of Canadians (53 per cent) agree that there are too few, if any, publicly available charging stations where they drive. Fewer than half agree that they can charge a zero emission vehicle at their home (47 per cent), and even fewer agree they can charge a zero emission vehicle at their workplace (18 per cent). In addition, four in ten express concerns that zero emission vehicles can't travel far enough on a full charge (44 per cent), and that charging a zero emission vehicle at home will significantly increase their monthly electricity bill (42 per cent).
Across many of the other issues examined, most Canadians could not even provide a response. Half of respondents are unsure whether the repair and maintenance costs for a zero emission vehicle are lower than for a gas or diesel-powered vehicle (46 per cent said they do not know), or whether zero-emission vehicles have the same towing ability as conventional vehicles (52 per cent). And a similar proportion could not provide a response when asked whether hydrogen fuel cell electric vehicles are more dangerous than other kinds of vehicles (50 per cent), or whether zero emission vehicles have a poor resale value (52 per cent).
Results further reveal that many Canadians would only buy a zero emission vehicle if the price were about the same as an equivalent conventional vehicle (47 per cent). About one in four (23 per cent) would be willing to pay more for a zero emission vehicle than an equivalent conventional vehicle, and about one in ten indicated they would only buy a zero emission vehicle if the price were lower than an equivalent conventional vehicle.
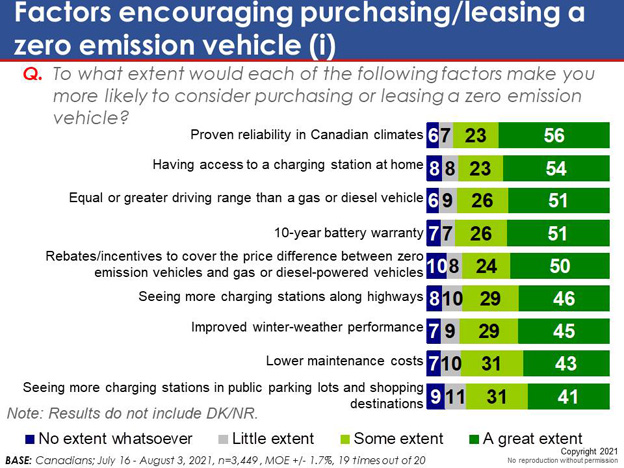
Respondents were also asked to what extent a range of factors would make them more likely to consider purchasing or leasing a zero emission vehicle. Proven reliability in Canadian climates (79 per cent to a great or some extent), and having access to a charging station at home (77 per cent) were seen as the most important factors in encouraging Canadians to consider purchasing/leasing ZEVs. Equal or greater driving range than a gas or diesel vehicle (77 per cent), a 10-year battery warranty (77 per cent), and rebates/incentives (74 per cent) to cover the price difference between zero emission vehicles and gas or diesel-powered vehicles were also seen as effective in encouraging Canadians to consider ZEVs.
Awareness and Support for Government Rebates
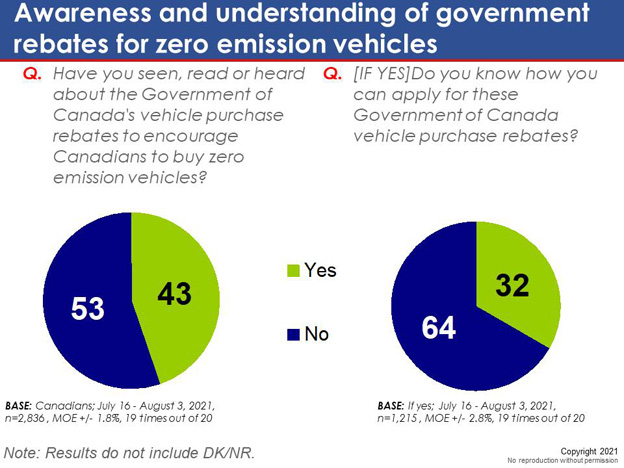
Results suggest Canadians have limited awareness of government rebates for ZEVs. When asked whether they have seen, read or heard about the Government of Canada's vehicle purchase rebates to encourage Canadians to buy zero emission vehicles, a majority (53 per cent) indicate they have not heard of these rebates. And among those who indicated they are aware of these Government of Canada rebates, most (64 per cent) are unsure how to apply for them.
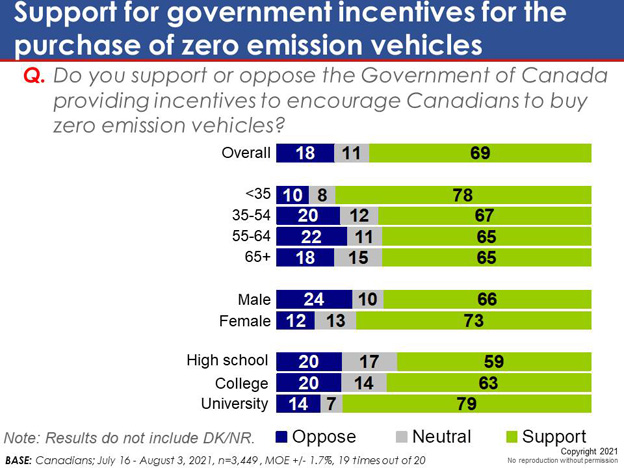
However, despite limited awareness of these rebates, a clear majority of Canadians (69 per cent) support the Government of Canada providing incentives to encourage Canadians to buy zero emission vehicles, while only 18 per cent oppose these federal government incentives and 11 per cent are neutral.
D. Contract Value
The contract value for the POR project is $69,049.10 (including HST).
This certification is to be submitted with the final report submitted to the Project Authority.
I hereby certify as Senior Officer of Ekos Research Associates Inc. that the deliverables fully comply with the Government of Canada political neutrality requirements outlined in the Communications Policy of the Government of Canada and Procedures for Planning and Contracting Public Opinion Research.
Specifically, the deliverables do not include information on electoral voting intentions, political party preferences, standings with the electorate, or ratings of the performance of a political party or its leaders.
Signed by: Derek Jansen (Vice President
Detailed Findings
A. Intention to Purchase/Lease a Vehicle
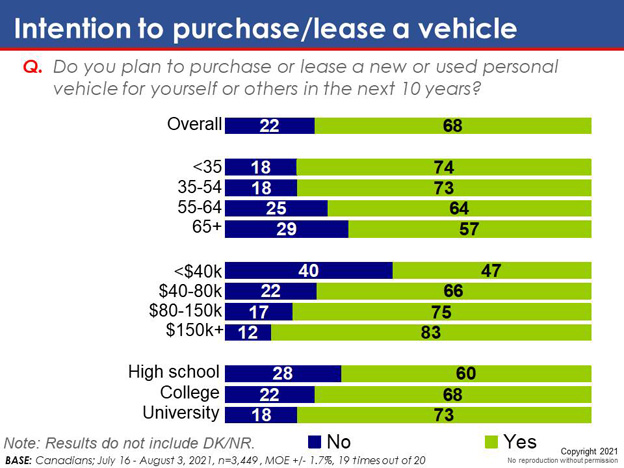
Respondents were first asked if they plan to purchase or lease a new or used vehicle in the next 10 years. Results reveal that two-thirds of Canadians (68 per cent) say they do intend to purchase a vehicle within the next 10 years, 22 per cent do not intend to purchase a vehicle within this timeframe, and 10 per cent are unsure.
Residents of Atlantic Canada are more likely to say they plan to purchase or lease a new or used personal vehicle in the next 10 years (76 per cent, compared to 68 per cent nationally).
The likelihood of purchasing or leasing a vehicle rises progressively with both income (from 47 per cent among those earning less than $40,000 in household income to 83 per cent among those earning $150,000 or more) and education (from 60 per cent among those with a high school education to 73 per cent among university graduates).
Men and those under 55 years of age (74 per cent each) are also more likely to say they plan to purchase or lease a vehicle.
Those willing to pay more for a zero emission vehicle than an equivalent conventional one are more likely to say they plan to purchase/lease a new/used personal vehicle in the next 10 years (72 per cent).
Chart 1: Intention to purchase/lease a vehicle
Chart 1: Intention to purchase/lease a vehicle - Text Version
This stacked chart shows the percentage of results for responses to twelve statements across two categories: no and yes.
Respondents were asked: "Do you plan to purchase or lease a new or used personal vehicle for yourself or others in the next 10 years?"
Respondents selected:
Overall:
Category "No": 22%
Category "Yes": 68%
<35:
Category "No": 18%
Category "Yes": 74%
35-54:
Category "No": 18%
Category "Yes": 73%
55-64:
Category "No": 25%
Category "Yes": 64%
65+:
Category "No": 29%
Category "Yes": 57%
<$40K:
Category "No": 40%
Category "Yes": 47%
$40-80K:
Category "No": 22%
Category "Yes": 66%
$80-150K:
Category "No": 17%
Category "Yes": 75%
$150+:
Category "No": 12%
Category "Yes": 83%
High School:
Category "No": 28%
Category "Yes": 60%
College:
Category "No": 22%
Category "Yes": 68%
University:
Category "No": 18%
Category "Yes": 73%
Note: Results do not include DK/NR.
Base: Canadians; July 16 - August 3, 2021, n=3,449, MOE ± 1.7%, 19 times out of 20
Timeframe for Purchasing/Leasing a Vehicle
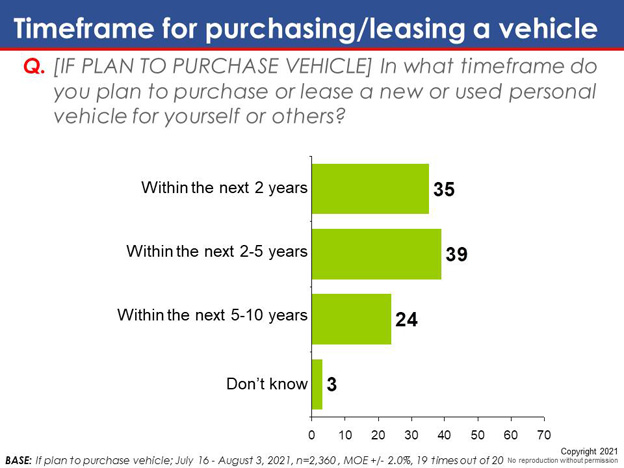
Those who indicated they planned to purchase or lease a vehicle in the next 10 years were asked a number of follow-up questions. When asked in what timeframe they plan to purchase a vehicle, most of these respondents indicated within the next 2-5 years (39 per cent), or within the next 2 years (35 per cent).
Residents of Alberta (40 per cent) and those under 35 years of age (39 per cent) are more likely to say they will purchase/lease a vehicle within the next 2 years.
Residents of Atlantic Canada (44 per cent), the Territories (50 per cent), and those older than 65 years of age (46 per cent) are more likely to say they will purchase/lease a vehicle within the next 2 to 5 years.
Chart 2: Timeframe for purchasing/leasing a vehicle
Chart 2: Timeframe for purchasing/leasing a vehicle - Text Version
This chart of single bars shows the percentage of results for responses to four statements.
Respondents were asked: "[If plan to purchase vehicle] In what timeframe do you plan to purchase or lease a new or used personal vehicle for yourself or others?"
Respondents selected:
Within the next 2 years: 35%
Within the next 2-5 years: 39%
Within the next 5-10 years: 24%
Don't know: 3%
Base: If plan to purchase vehicle; July 16 - August 3, 2021, n=2,360, MOE ± 2.0%, 19 times out of 20
Size/Type of Vehicle to be Purchased
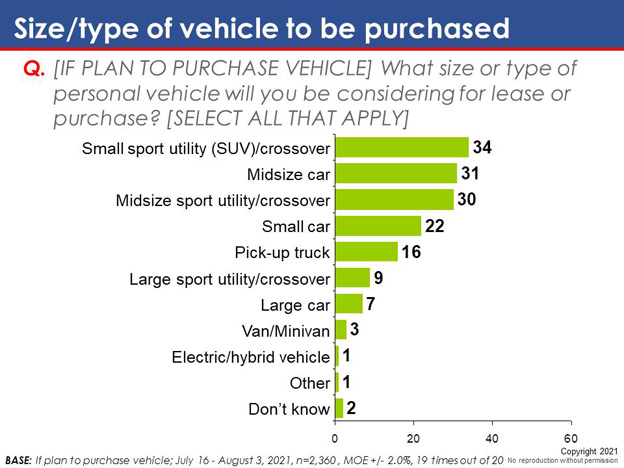
Results suggest that small sport utility vehicles are most likely to be purchased (34 per cent), followed closely by midsize vehicles (31 per cent), and midsize SUVs (30 per cent).
Respondents from Saskatchewan/Manitoba are more likely to consider purchasing or leasing a small sport utility vehicle (41 per cent).
Ontarians are more likely to consider purchasing/leasing a midsize car (34 per cent).
The likelihood of considering the purchase or lease of a pick-up truck (30 per cent, compared to 16 per cent nationally) and a midsize sport utility/crossover (37 per cent) is higher among respondents from Alberta.
Men (34 per cent), those earning less than $40,000 in household income (39 per cent) and those under 35 years of age (42 per cent) are more likely to consider purchasing or leasing a midsize vehicle.
Those willing to pay more for a zero emission vehicle than an equivalent conventional one are more likely to say they plan to purchase/lease a small sport utility (SUV)/crossover.
Chart 3: Size/type of vehicle to be purchased
Chart 3: Size/type of vehicle to be purchased - Text Version
This chart of single bars shows the percentage of results for responses to eleven statements.
Respondents were asked: "[If plan to purchase vehicle] What size or type of personal vehicle will you be considering for lease or purchase?" [Select all that ally]
Respondents selected:
Small sport utility (SUV)/crossover: 34%
Midsize car: 31%
Midsize sport utility/crossover: 30%
Small car: 22%
Pick-up truck: 16%
Large sport utility/crossover: 9%
Large car: 7%
Van/Minivan: 3%
Electric/hybrid vehicle: 1%
Other: 1%
Don't know: 2%
Base: If plan to purchase vehicle; July 16 - August 3, 2021, n=2,360, MOE ± 2.0%, 19 times out of 20
Intended Vehicle to be Purchased
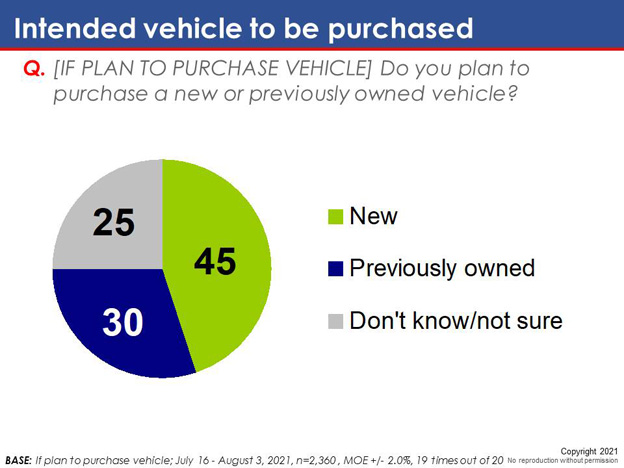
Results further reveal that a plurality of these respondents plan to purchase a new vehicle (45 per cent), although a sizeable minority (30 per cent) intend to buy a used vehicle, and a fairly large proportion are unsure (25 per cent).
Those 65 years of age and older (57 per cent) and those with a household income of $150,000 or greater (54 per cent) are more likely to say they will purchase a new vehicle.
Men are more likely than women to say they will purchase a new vehicle (47 per cent versus 43 per cent).
Conversely, residents of Saskatchewan/Manitoba are most likely to purchase a previously owned vehicle (44 per cent, compared to 30 per cent nationally).
Those willing to pay more for a zero emission vehicle than an equivalent conventional one are more likely to say they plan to purchase/lease a new vehicle (52 per cent).
Chart 4: Intended vehicle to be purchased
Chart 4: Intended vehicle to be purchased - Text Version
This pie chart shows the percentage of results for responses to one question across three categories: new, previously owned, and don't know/not sure.
Respondents were asked: "[If plan to purchase vehicle] Do you plan to purchase a new or previously owned vehicle?"
Respondents selected:
Category "New": 45%
Category "Previously owned": 30%
Category "Don't know/not sure": 25%
Base: If plan to purchase vehicle; July 16 - August 3, 2021, n=2,360 , MOE ± 2.0%, 19 times out of 20
Market Value of Vehicle to be Purchased
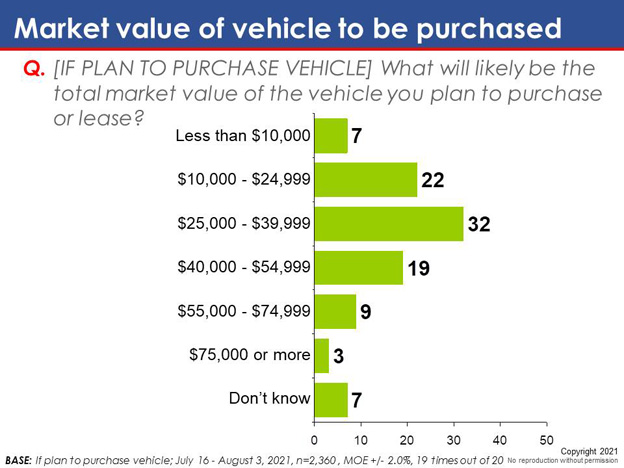
Most Canadians who intend to purchase a car in the next 10 years believe the total cost of the vehicle will be in the $25,000-$39,999 range.
Those earning less than $40,000 in household income are more likely to purchase/lease a vehicle with a market value from $10,000 to $24,999 (35 per cent).
The likelihood of spending from $25,000 to $39,999 on a vehicle is higher among those 65 years of age and older (38 per cent), those with university education (35 per cent), and those earning from $40,000 to under $150,000 in household income (36 per cent).
Respondents that say they plan to purchase a previously owned vehicle are more likely to spend from $10,000 to $24,000 (45 per cent).
Chart 5: Market value of vehicle to be purchased
Chart 5: Market value of vehicle to be purchased - Text Version
This chart of single bars shows the percentage of results for responses to seven statements.
Respondents were asked: "[If plan to purchase vehicle] What will likely be the total market value of the vehicle you plan to purchase or lease?"
Respondents selected:
Less than $10,000: 7%
$10,000-$24,999: 22%
$25,000-$39,999: 32%
$40,000-$54,999: 19%
$55,000-$74,999: 9%
$75,000 or more: 3%
Don't know: 7%
Base: If plan to purchase vehicle; July 16 - August 3, 2021, n=2,360, MOE ± 2.0%, 19 times out of 20
Number of Personal Vehicles Owned
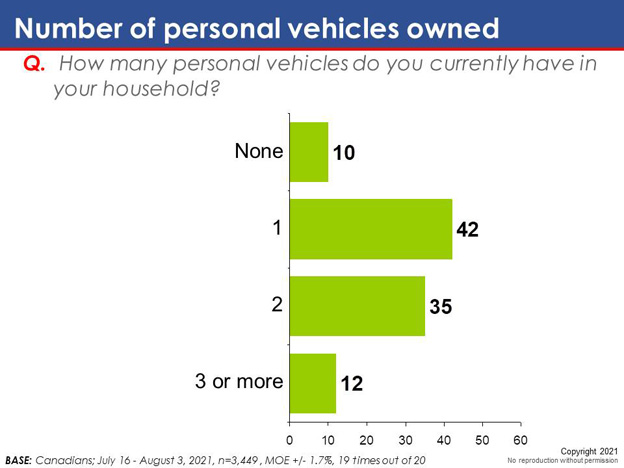
All Canadians were asked how many vehicles they currently have in their household. The plurality (42 per cent) indicate they have one car, while a sizeable proportion (35 per cent) say they have two vehicles. Ten per cent of Canadians say they do not own a vehicle, and 12 per cent indicate they have three or more vehicles in their household.
Residents of Quebec are more likely to have one personal vehicle in their household (50 per cent, compared to 42 per cent nationally), and residents of Alberta are more likely to have two (43 per cent, compared to 35 per cent nationally).
Those with a household income from $40,000 to under $80,000 are more likely to have one vehicle in their household (54 per cent, compared to 42 per cent overall).
Respondents saying they plan to purchase a new vehicle are more likely to have two personal vehicles in their household (42 per cent).
The number of vehicles in a household rises with income. For example, 14 per cent of those earning less than $40,000 in household income say they have two vehicles, compared to 48 per cent among those earning $150,000 or more.
Chart 6: Number of personal vehicles owned
Chart 6: Number of personal vehicles owned - Text Version
This chart of single bars shows the percentage of results for responses to four statements.
Respondents were asked: "How many personal vehicles do you currently have in your household?"
Respondents selected:
None: 10%
1: 42%
2: 35%
3 or more: 12%
Base: Canadians; July 16 - August 3, 2021, n=3,449, MOE ± 1.7%, 19 times out of 20
B. Ownership and Intention to Purchase/Lease an Electric Vehicle
Electric Vehicles Owned/Leased
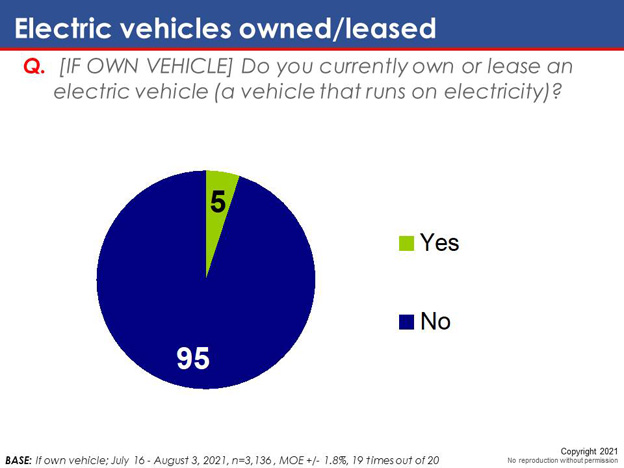
Those who indicated they had a vehicle in their household were asked if they currently lease or own an electric vehicle. Results reveal that only five per cent of Canadians say they own or lease a vehicle that runs on electricity; the vast majority (95 per cent) do not.
Residents of Quebec (10 per cent), those with a household income of $150,000 or more (8 per cent) and university graduates (7 per cent) are somewhat more likely to own an electric vehicle.
Chart 7: Electric vehicles owned/leased
Chart 7: Electric vehicles owned/leased - Text Version
This pie chart shows the percentage of results for responses to one question across two categories: yes and no.
Respondents were asked: "[If own vehicle] Do you currently own or lease an electric vehicle (a vehicle that runs on electricity)?"
Respondents selected:
Category "Yes": 5%
Category "No": 95%
Base: If own vehicle; July 16 - August 3, 2021, n=3,136, MOE ± 1.8%, 19 times out of 20
Intention to Purchase/Lease an Electric Vehicle
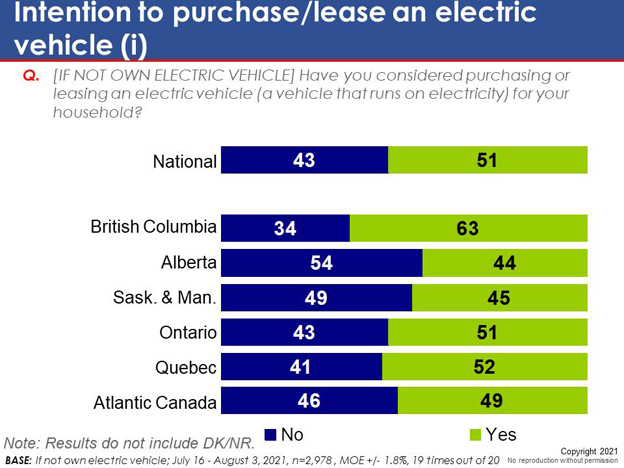
Those who do not own or lease an electric vehicle were asked if they had considered purchasing or leasing an electric vehicle for their household. Results are split, with a slight majority (51 per cent) indicating that they had considered purchasing an electric vehicle, and a smaller proportion (43 per cent) indicating no.
Residents of BC are more likely to consider purchasing/leasing an electric vehicle (63 per cent, compared to 51 per cent nationally).
The likelihood of considering the purchase/lease of an electric vehicle rises progressively with both income (from 41 per cent among those earning less than $40,000 in household income, to 64 per cent of those earning $150,000 or more), and education (from 40 per cent among those with a high school diploma, to 62 per cent of university graduates).
Conversely, the incidence of those that have considered purchasing/leasing an electric vehicle declines with age (64 per cent of those under 35 years of age, compared to 38 per cent of those ages 65 and older).
Respondents that are most likely to say they have considered purchasing/leasing an electric vehicle for their household include those willing to pay more for a ZEV than an equivalent conventional vehicle (85 per cent), and those saying they plan to purchase a new vehicle (61 per cent).
The proportion who plan to purchase a new vehicle, and have considered purchasing/leasing an electric vehicle for their household, and are willing to pay more for a ZEV than an equivalent conventional vehicle represents 12 per cent of the Canadian population.
Chart 8: Intention to purchase/lease an electric vehicle (i)
Chart 8: Intention to purchase/lease an electric vehicle (i) - Text Version
This stacked chart shows the percentage of results for responses to seven statements across two categories: no and yes.
Respondents were asked: "[If not own electric vehicle] Have you considered purchasing or leasing an electric vehicle (a vehicle that runs on electricity) for your household?"
Respondents selected:
National:
Category "No": 43%
Category "Yes": 51%
British Columbia:
Category "No": 34%
Category "Yes": 63%
Alberta:
Category "No": 54%
Category "Yes": 44%
Saskatchewan & Manitoba:
Category "No": 49%
Category "Yes": 45%
Ontario:
Category "No": 43%
Category "Yes": 51%
Quebec:
Category "No": 41%
Category "Yes": 52%
Atlantic Canada:
Category "No": 46%
Category "Yes": 49%
Note: Results do not include DK/NR
Base: If not own electric vehicle; July 16 - August 3, 2021, n=2,978, MOE ± 1.8%, 19 times out of 20
Chart 9: Intention to purchase/lease an electric vehicle (ii)
Chart 9: Intention to purchase/lease an electric vehicle (ii) - Text Version
This stacked chart shows the percentage of results for responses to twelve statements across two categories: no and yes.
Respondents were asked: "[If not own electric vehicle] Have you considered purchasing or leasing an electric vehicle (a vehicle that runs on electricity) for your household?"
Respondents selected:
Overall:
Category "No": 43%
Category "Yes": 51%
<35:
Category "No": 32%
Category "Yes": 64%
35-54:
Category "No": 42%
Category "Yes": 55%
55-64:
Category "No": 49%
Category "Yes": 44%
65+:
Category "No": 54%
Category "Yes": 38%
<$40:
Category "No": 52%
Category "Yes": 41%
$40-80K:
Category "No": 47%
Category "Yes": 48%
$80-150K:
Category "No": 41%
Category "Yes": 54%
$150+:
Category "No": 34%
Category "Yes": 64%
High School:
Category "No": 55%
Category "Yes": 40%
College:
Category "No": 48%
Category "Yes": 46%
University:
Category "No": 34%
Category "Yes": 62%
Note: Results do not include DK/NR
Base: If not own electric vehicle; July 16 - August 3, 2021, n=2,978, MOE ± 1.8%, 19 times out of 20
Those who said they had considered purchasing/leasing an electric vehicle were asked which of a range of options best describes their current situation with respect to purchasing or leasing an electric vehicle. Results reveal that most of these respondents (51 per cent) say they have thought about purchasing an electric vehicle, but have not taken any real steps to purchase/lease this type of vehicle. One in three (33 per cent) say they have started to gather information and make inquiries, but have not seriously considered an electric vehicle yet. Only one in seven (14 per cent) say they have actually shopped for an electric vehicle.
Residents of Saskatchewan/Manitoba (60 per cent), those 65 years of age and over (57 per cent), those earning less than $40,000 in household income (64 per cent), and those with high school education (61 per cent) are particularly likely to say that they have thought about purchasing/leasing an electric vehicle, but that no real steps have been taken.
Chart 10: Attitudes towards purchasing/leasing an electric vehicle
Chart 10: Attitudes towards purchasing/leasing an electric vehicle - Text Version
This single stacked chart shows the percentage of results for responses to one statement across three categories: have thought about it, but no real steps have been taken to purchase/lease an electric vehicle; started to gather information and make inquiries, but have not seriously considered an electric vehicle yet; shopped for an electric vehicle, but haven't purchased or leased.
Respondents were asked: "[If considered purchasing electric vehicle] Which of the following best describes your current situation with respect to purchasing or leasing an electric vehicle?"
Respondents selected:
Have thought about it, but no real steps have been taken to purchase/lease an electric vehicle: 51%
Started to gather information and make inquiries, but have not seriously considered an electric vehicle yet: 33%
Shopped for an electric vehicle, but haven't purchased or leased: 14%
Base: If considered purchasing electric vehicle; July 16 - August 3, 2021, n=1,487, MOE ± 2.5%, 19 times out of 20
C. Experience With Zero Emission Vehicles
Experience with Zero Emission Vehicles
Respondents were informed that zero emissions vehicles are vehicles that can be driven without producing polluting exhaust, and include fully battery electric, plug-in hybrid electric, and hydrogen fuel cell electric vehicles. They were then asked if they had ever driven or ridden in a zero emission vehicle. Results reveal that most Canadians (66 per cent) have not, while 32 per cent said they had.
Men (38 per cent), those ages 35 to 54 (37 per cent), and residents of BC (46 per cent) are particularly likely to say they have driven/ridden in a zero emission vehicle.
Conversely, those from Atlantic Canada (24 per cent), women (27 per cent), those with high school education (22 per cent), and those earning less than $40,000 in household income (20 per cent) are less likely to indicate they have driven or ridden in a ZEV.
The incidence of having driven/ridden in a zero emission vehicle rises with both income (from 20 per cent among those earning less than $40,000 in household income to 46 per cent of those earning $150,000 or more) and education (from 22 per cent among those with a high school diploma to 39 per cent of university graduates).
Chart 11: Experience with zero emission vehicles
Chart 11: Experience with zero emission vehicles - Text Version
This stacked chart shows the percentage of results for responses to twelve statements across two categories: no and yes.
Respondents were asked two questions: "Have you ever driven or ridden in a zero emission vehicle?"
Respondents selected:
Overall:
Category "No": 66%
Category "Yes": 32%
<35:
Category "No": 62%
Category "Yes": 34%
35-54:
Category "No": 61%
Category "Yes": 37%
55-64:
Category "No": 70%
Category "Yes": 29%
65+:
Category "No": 73%
Category "Yes": 25%
<$40K:
Category "No": 75%
Category "Yes": 20%
$40-80K:
Category "No": 70%
Category "Yes": 28%
$80-150K:
Category "No": 66%
Category "Yes": 33%
$150+:
Category "No": 52%
Category "Yes": 46%
High School:
Category "No": 76%
Category "Yes": 22%
College:
Category "No": 69%
Category "Yes": 29%
University:
Category "No": 59%
Category "Yes": 39%
Note: Results do not include DK/NR.
Base: Canadians; July 16 - August 3, 2021, n=3,449, MOE ± 1.7%, 19 times out of 20
Interest in Test Driving a Zero Emission Vehicle
Those who had not driven or ridden in a ZEV were asked how interested they would be in taking a zero emission vehicle for a test drive if they were able test one that suited their lifestyle needs, at a convenient location with an impartial expert to answer their questions. Most of these respondents say they would be very (39 per cent) or somewhat (29 per cent) interested. A further 16 per cent said they were only a little interested in this idea, and 15 per cent said they were not at all interested.
Those under 35 years of age are more interested in taking a zero emission vehicle for a test drive (50 per cent compared to 39 per cent on average).
Interest in taking a zero emission vehicle for a test drive rises progressively with both education (from 31 per cent among those with a high school diploma to 46 per cent of university graduates) and income (from 37 per cent of those earning less than $40,000 in household income to 47 per cent of those earning $150,000 or more).
Respondents that are most likely to say they are very interested in taking a zero emission vehicle for a test drive include those who say they are willing to pay more for a ZEV than an equivalent conventional vehicle (64 per cent), and those planning to purchase a new vehicle (45 per cent).
The proportion who plan to purchase a new vehicle, and are very interested in taking a zero emission vehicle for a test drive, and are willing to pay more for a ZEV than an equivalent conventional vehicle represents 5 per cent of the Canadian population.
Chart 12: Interest in test driving a zero emission vehicle
Chart 12: Interest in test driving a zero emission vehicle - Text Version
This stacked chart shows the percentage of results for responses to eight statements across four categories: not at all interested, only a little interested, somewhat interested, very interested.
Respondents were asked: "[If have not ridden in a ZEV] How interested, if at all, would you be in taking a zero emission vehicle for a test drive?"
Respondents selected:
Overall:
Category "Not at all interested": 15%
Category "Only a little interested": 16%
Category "Somewhat interested": 28%
Category "Very interested": 39%
<35:
Category "Not at all interested": 9%
Category "Only a little interested": 15%
Category "Somewhat interested": 26%
Category "Very interested": 50%
35-54:
Category "Not at all interested": 14%
Category "Only a little interested": 16%
Category "Somewhat interested": 28%
Category "Very interested": 41%
55-64:
Category "Not at all interested": 18%
Category "Only a little interested": 14%
Category "Somewhat interested": 29%
Category "Very interested": 38%
65+:
Category "Not at all interested": 20%
Category "Only a little interested": 20%
Category "Somewhat interested": 32%
Category "Very interested": 28%
High School:
Category "Not at all interested": 21%
Category "Only a little interested": 18%
Category "Somewhat interested": 28%
Category "Very interested": 31%
College:
Category "Not at all interested": 16%
Category "Only a little interested": 17%
Category "Somewhat interested": 29%
Category "Very interested": 37%
University:
Category "Not at all interested": 10%
Category "Only a little interested": 14%
Category "Somewhat interested": 29%
Category "Very interested": 46%
Base: If have not ridden in a ZEV; July 16 - August 3, 2021, n=2,302, MOE ± 2.0%, 19 times out of 20
Experience with Zero Emission Vehicle Owners
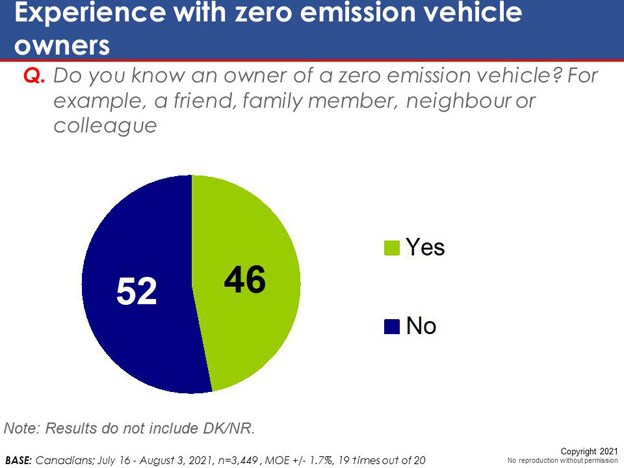
When asked whether they know an owner of a zero emission vehicle (such as a friend, family member, neighbour or colleague), results are split, with roughly the same proportion indicating yes (46 per cent) as no (52 per cent).
Residents of Quebec and BC (58 per cent and 57 per cent respectively), those ages 35 to 54 (51 per cent), those earning $150,000 or more in household income (61 per cent) and university graduates (53 per cent) are more likely to say they know an owner of a zero emission vehicle.
Men are more likely than women to know an owner of a ZEV (50 per cent versus 41 per cent).
Among those who say they know an owner of a ZEV, those willing to pay more for a ZEV (60 per cent) and those saying they plan to purchase a new vehicle (51 per cent) are most likely to say yes to this question.
Chart 13: Experience with zero emission vehicle owners
Chart 13: Experience with zero emission vehicle owners - Text Version
This pie chart shows the percentage of results for responses to one question across two categories: yes and no.
Respondents were asked: "Do you know an owner of a zero emission vehicle? For example, a friend, family member, neighbour or colleague."
Respondents selected:
Yes: 46%
No: 52%
Note: Results do not include DK/NR.
Base: Canadians; July 16 - August 3, 2021, n=3,449, MOE ± 1.7%, 19 times out of 20
Awareness of Zero Emission Vehicles Makes and Models
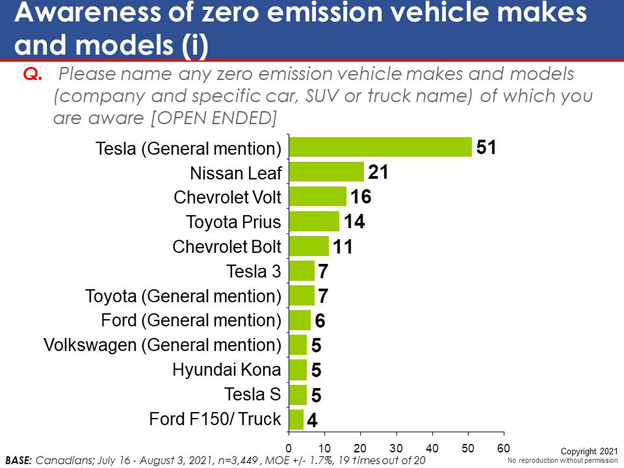
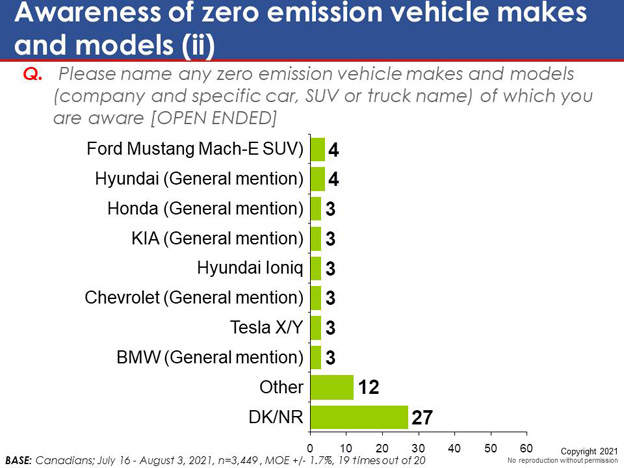
Respondents were asked, unprompted, to name any zero emission vehicle makes and models they were aware of. Tesla is mentioned most often (51 per cent), followed fairly distantly by the Nissan Leaf (21 per cent) and the Chevrolet Volt (16 per cent). One in four (27 per cent) could not provide a response to this question.
Residents of Ontario (55 per cent), those ages 35 to 54 (55 per cent), men (54 per cent), those earning $80,000 or more in household income (59 per cent), and university graduates (57 per cent) are the most likely to name Tesla as a ZEV they are aware of.
Respondents more likely to name Tesla include those willing to pay more for a zero emission vehicle than an equivalent conventional one (59 per cent), and those saying they plan to purchase a new vehicle (55 per cent).
Those ages 65 and up (37 per cent), women (34 per cent), those with a household income lower than $40,000 (45 per cent), high school graduates (41 per cent), and residents of Atlantic Canada (39 per cent), Alberta (35 per cent) and the Territories (40 per cent) were particularly likely to not provide a response to this question.
Chart 14: Awareness of zero emission vehicle makes and models (i)
Chart 14: Awareness of zero emission vehicle makes and models (i) - Text Version
This chart of single bars shows the percentage of results for responses to twelve statements.
Respondents were asked: "Please name any zero emission vehicle makes and models (company and specific car, SUV or truck name) of which you are aware [Open ended]?"
Respondents selected:
Tesla (General mention): 51%
Nissan Leaf: 21%
Chevrolet Volt: 16%
Toyota Prius: 14%
Chevrolet Bolt: 11%
Tesla 3: 7%
Toyota (general mention): 7%
Ford (general mention): 6%
Volkswagen (general mention): 5%
Hyundai Kona: 5%
Tesla S: 5%
Ford F150/Truck: 4%
Chart 15: Awareness of zero emission vehicle makes and models (ii)
Chart 15: Awareness of zero emission vehicle makes and models (ii) - Text Version
This chart of single bars shows the percentage of results for responses to 10 statements.
Respondents were asked: "Please name any zero emission vehicle makes and models (company and specific car, SUV or truck name) of which you are aware [Open ended]?"
Respondents selected:
Ford Mustang Mach-E SUV: 4%
Hyundai (general mention): 4%
Honda (general mention): 3%
KIA (general mention): 3%
Hyundai Ioniq: 3%
Chevrolet (general mention): 3%
Tesla X/Y: 3%
BMW (general mention): 3%
Other: 12%
DK/NR: 27%
Base: Canadians; July 16 - August 3, 2021, n=3,449, MOE ± 1.7%, 19 times out of 20
D. Familiarity and Views on Zero Emission Vehicle Features
Familiarity and Views on Zero Emission Vehicle Features
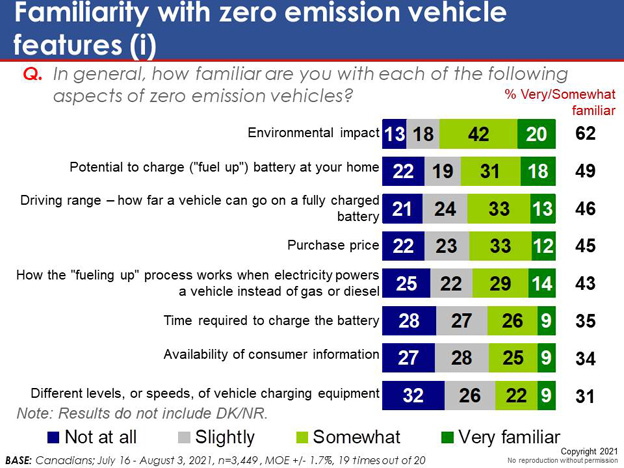
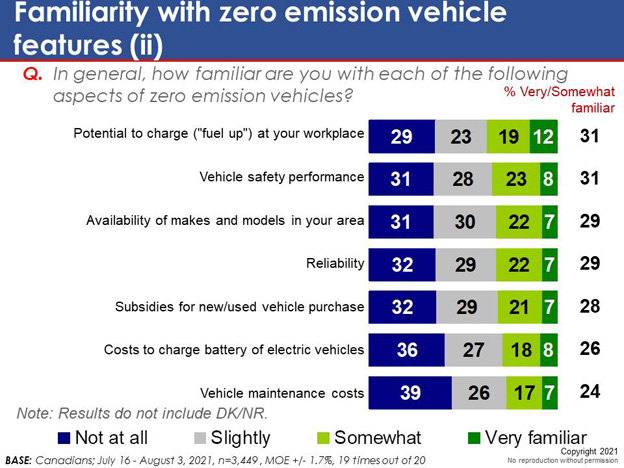
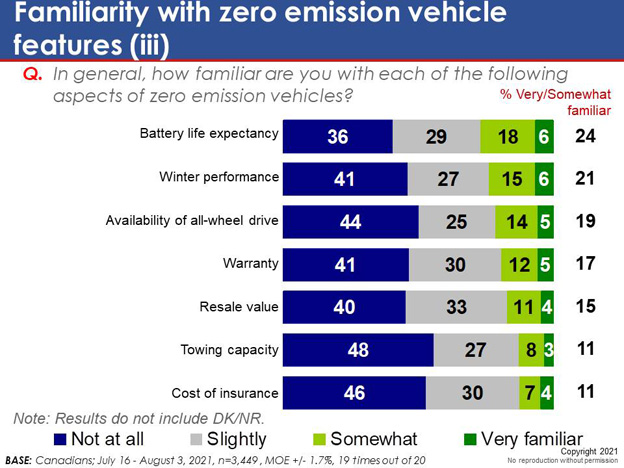
Respondents had limited familiarity with a range of aspects of zero emission vehicles. They are most familiar with the environmental benefits of ZEVs (62 per cent indicate they are very or somewhat familiar with the environmental impact of electric vehicles). However, fewer than half say they are familiar with the potential to charge (“fuel up”) the battery at their home (49 per cent), how far a vehicle can go on a fully charged battery (46 per cent), the price of ZEVs (45 per cent), and how the “fueling up” process works when electricity powers a vehicle (43 per cent). About one in three express familiarity with the time required to charge the battery, and the availability of consumer information about ZEVs. Three in ten say they are familiar with the different speeds of vehicle charging equipment, the potential to charge (“fuel up”) at their workplace, vehicle safety performance, the availability of makes and models in their area, and the reliability of ZEVs. Only one in four indicate familiarity with subsidies for new/used zero emission vehicle purchase, vehicle maintenance costs, or battery life expectancy. One in five say they are familiar with the winter performance of ZEVs, and the availability of all-wheel drive for these types of vehicles. Even fewer express familiarity with the warranty, resale value, towing capacity, or insurance costs of ZEVs. (Charts are on following pages).
Generally speaking, residents of BC, those ages 35 to 54, those with a household income of $150,000 or more, and university graduates are more familiar with zero emission vehicle features.
Men are more familiar than women with all zero emission vehicle aspects. For instance, 60 per cent of men are familiar with the driving range, compared to 33 per cent of women. Similarly, 60 per cent of men are familiar with the potential to charge the battery at home, compared to 38 per cent of women.
Quebeckers are the most likely to be aware of subsidies for new/used zero emission vehicle purchases (36 per cent, compared to 28 per cent nationally).
Respondents that are most likely to say they are familiar with the environmental impact of a ZEV include those willing to pay more for a zero emission vehicle than an equivalent conventional one (77 per cent), and those saying they plan to purchase a new vehicle (67 per cent).
Chart 16: Familiarity with zero emission vehicle features (i)
Chart 16: Familiarity with zero emission vehicle features (i) - Text Version
This stacked bar chart shows the percentage of results for responses to eight statements across four categories: Not at all, slightly, somewhat, very familiar. A column on the side represents the combined results of "very/somewhat familiar".
Respondents were asked: "In general, how familiar are you with each of the following aspects of zero emission vehicles?"
Respondents selected:
Environmental impact
Category "Not at all": 13%
Category "Slightly": 18%
Category "Somewhat": 42%
Category "Very familiar": 20%
Category "Somewhat/very familiar": 62%
Potential to charge ("fuel up") battery at your home
Category "Not at all": 22%
Category "Slightly": 19%
Category "Somewhat": 31%
Category "Very familiar": 18%
Category "Somewhat/very familiar": 49%
Driving range – how far a vehicle can go on a fully charged battery
Category "Not at all": 21%
Category "Slightly": 24%
Category "Somewhat": 33%
Category "Very familiar": 13%
Category "Somewhat/very familiar": 46%
Purchase price
Category "Not at all": 22%
Category "Slightly": 23%
Category "Somewhat": 33%
Category "Very familiar": 12%
Category "Somewhat/very familiar": 45%
How the "fueling up" process works when electricity powers a vehicle instead of gas or diesel
Category "Not at all": 25%
Category "Slightly": 22%
Category "Somewhat": 29%
Category "Very familiar": 14%
Category "Somewhat/very familiar": 43%
Time required to charge the battery
Category "Not at all": 28%
Category "Slightly": 27%
Category "Somewhat": 26%
Category "Very familiar": 9%
Category "Somewhat/very familiar": 35%
Availability of consumer information
Category "Not at all": 27%
Category "Slightly": 28%
Category "Somewhat": 25%
Category "Very familiar": 9%
Category "Somewhat/very familiar": 34%
Different levels, or speeds, of vehicle charging equipment
Category "Not at all": 32%
Category "Slightly": 26%
Category "Somewhat": 22%
Category "Very familiar": 9%
Category "Somewhat/very familiar": 31%
Note: Results do not include DK/NR.
Base: Canadians; July 16 - August 3, 2021, n=3,449, MOE ± 1.7%, 19 times out of 20
Chart 17: Familiarity with zero emission vehicle features (ii)
Chart 17: Familiarity with zero emission vehicle features (ii) - Text Version
This stacked bar chart shows the percentage of results for responses to seven statements across four categories: Not at all, slightly, somewhat, very familiar. A column on the side represents the combined results of "very/somewhat familiar".
Respondents were asked: "In general, how familiar are you with each of the following aspects of zero emission vehicles?"
Respondents selected:
Potential to charge ("fuel up") at your workplace
Category "Not at all": 29%
Category "Slightly": 23%
Category "Somewhat": 19%
Category "Very familiar": 12%
Category "Somewhat/very familiar": 31%
Vehicle safety performance
Category "Not at all": 31%
Category "Slightly": 28%
Category "Somewhat": 23%
Category "Very familiar": 8%
Category "Somewhat/very familiar": 31%
Availability of makes and models in your area
Category "Not at all": 31%
Category "Slightly": 30%
Category "Somewhat": 22%
Category "Very familiar": 7%
Category "Somewhat/very familiar": 29%
Reliability
Category "Not at all": 32%
Category "Slightly": 29%
Category "Somewhat": 22%
Category "Very familiar": 7%
Category "Somewhat/very familiar": 29%
Subsidies for new/used vehicle purchase
Category "Not at all": 32%
Category "Slightly": 29%
Category "Somewhat": 21%
Category "Very familiar": 7%
Category "Somewhat/very familiar": 28%
Costs to charge battery of electric vehicles
Category "Not at all": 36%
Category "Slightly": 27%
Category "Somewhat": 18%
Category "Very familiar": 8%
Category "Somewhat/very familiar": 26%
Vehicle maintenance costs
Category "Not at all": 39%
Category "Slightly": 26%
Category "Somewhat": 17%
Category "Very familiar": 7%
Category "Somewhat/very familiar": 24%
Note: Results do not include DK/NR.
Base: Canadians; July 16 - August 3, 2021, n=3,449, MOE ± 1.7%, 19 times out of 20
Chart 18: Familiarity with zero emission vehicle features (iii)
Chart 18: Familiarity with zero emission vehicle features (iii) - Text Version
This stacked bar chart shows the percentage of results for responses to seven statements across four categories: Not at all, slightly, somewhat, very familiar. A column on the side represents the combined results of "very/somewhat familiar".
Respondents were asked: "In general, how familiar are you with each of the following aspects of zero emission vehicles?"
Respondents selected:
Battery life expectancy
Category "Not at all": 36%
Category "Slightly": 29%
Category "Somewhat": 18%
Category "Very familiar": 6%
Category "Somewhat/very familiar": 24%
Winter performance
Category "Not at all": 41%
Category "Slightly": 27%
Category "Somewhat": 15%
Category "Very familiar": 6%
Category "Somewhat/very familiar": 21%
Availability of all-wheel drive
Category "Not at all": 44%
Category "Slightly": 25%
Category "Somewhat": 14%
Category "Very familiar": 5%
Category "Somewhat/very familiar": 19%
Warranty
Category "Not at all": 41%
Category "Slightly": 30%
Category "Somewhat": 12%
Category "Very familiar": 5%
Category "Somewhat/very familiar": 17%
Resale value
Category "Not at all": 40%
Category "Slightly": 33%
Category "Somewhat": 11%
Category "Very familiar": 4%
Category "Somewhat/very familiar": 15%
Towing capacity
Category "Not at all": 48%
Category "Slightly": 27%
Category "Somewhat": 8%
Category "Very familiar": 3%
Category "Somewhat/very familiar": 11%
Cost of insurance
Category "Not at all": 46%
Category "Slightly": 30%
Category "Somewhat": 7%
Category "Very familiar": 4%
Category "Somewhat/very familiar": 11%
Note: Results do not include DK/NR.
Base: Canadians; July 16 - August 3, 2021, n=3,449, MOE ± 1.7%, 19 times out of 20
Interest in Purchasing/Leasing Zero Emission Vehicles
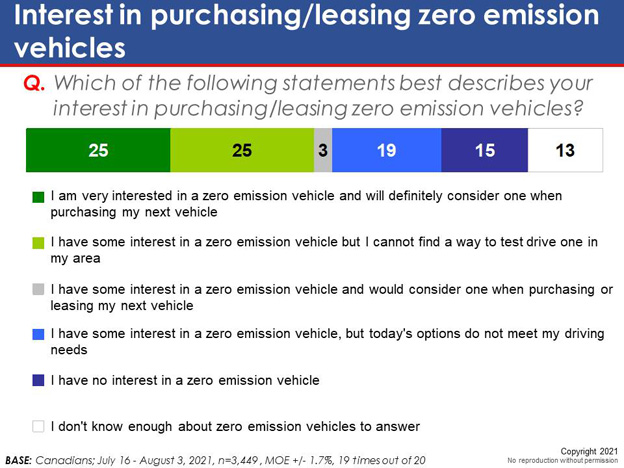
When asked which of a range of statements best describes their interest in purchasing/leasing zero emission vehicles, only one in four (25 per cent) say they are very interested in a zero emission vehicle and will definitely consider one when purchasing their next vehicle. The same proportion (25 per cent) indicate some interest in a zero emission vehicle but cannot find a way to test drive one in their area. Only three per cent say they would consider a ZEV when purchasing or leasing their next vehicle. One in five (19 per cent) have some interest in a zero emission vehicle, but today's options do not meet their driving needs. Fifteen per cent have no interest in a zero emission vehicle, and roughly the same proportion (13 per cent) don't know enough about zero emission vehicles to make a decision.
Those under 35 years of age (33 per cent), those earning $150,000 or more in household income (37 per cent) and university graduates (32 per cent) are particularly likely to say they are very interested in a zero emission vehicle and will definitely consider one when purchasing their next vehicle.
Respondents most likely to say they are very interested in a zero emission vehicle and will definitely consider one when purchasing their next vehicle include those who indicate they plan to purchase a new vehicle (32 per cent), and those willing to pay more for a zero emission vehicle than an equivalent conventional one (60 per cent).
Chart 19: Interest in purchasing/leasing zero emission vehicles
Chart 19: Interest in purchasing/leasing zero emission vehicles - Text Version
This single stacked chart shows the percentage of results for responses to one statement across six categories: I am very interested in a zero emission vehicle and will definitely consider one when purchasing my next vehicle; I have some interest in a zero emission vehicle but I cannot find a way to test drive one in my area; I have some interest in a zero emission vehicle and would consider one when purchasing or leasing my next vehicle; I have some interest in a zero emission vehicle, but today's options do not meet my driving needs; I have no interest in a zero emission vehicle; I don't know enough about zero emission vehicles to answer.
Respondents were asked: "Which of the following statements best describes your interest in purchasing/leasing zero emission vehicles?"
Respondents selected:
I am very interested in a zero emission vehicle and will definitely consider one when purchasing my next vehicle: 25%
I have some interest in a zero emission vehicle but I cannot find a way to test drive one in my area: 25%
I have some interest in a zero emission vehicle and would consider one when purchasing or leasing my next vehicle: 3%
I have some interest in a zero emission vehicle, but today's options do not meet my driving needs: 19%
I have no interest in a zero emission vehicle: 15%
I don't know enough about zero emission vehicles to answer: 13%
Base: Canadians; July 16 - August 3, 2021, n=3,449, MOE ± 1.7%, 19 times out of 20
Attitudes Towards Zero Emission Vehicles
Respondents were also asked a number of attitudinal questions about ZEVs. Results reveal mixed views on electric vehicles, as well as a general lack of knowledge about these vehicles (from 14 to 52 per cent of Canadians could not provide a response to the questions asked).
Generally speaking, findings indicate that Canadians strongly believe that ZEVs are beneficial for the environment, but also feel they are expensive and difficult to fuel/charge. Canadians also have limited experience with ZEVs, and little understanding about a range of important issues associated with these vehicles, such as safety, vehicle charging, performance, maintenance costs, and resale value, suggesting these are areas in need of increased ZEV awareness/education initiatives.
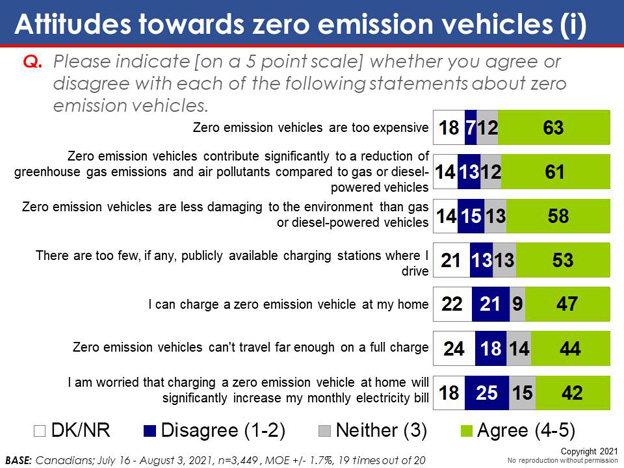
A clear majority of Canadians (63 per cent) believe that zero emission vehicles are too expensive (only 7 per cent disagree with this idea). However, Canadians also strongly believe that ZEVs are better for the environment than other types of vehicles: six in ten (61 per cent) agree that zero emission vehicles contribute significantly to a reduction of greenhouse gas emissions and air pollutants compared to gas or diesel-powered vehicles, and that zero emission vehicles are less damaging to the environment than gas or diesel-powered vehicles (58 per cent).
At the same time, concerns are expressed about charging ZEVs. More than half of Canadians (53 per cent) agree that there are too few, if any, publicly available charging stations where they drive (in Saskatchewan/Manitoba, 67 per cent agree). Fewer than half agree that they can charge a zero emission vehicle at their home (47 per cent), and even fewer agree they can charge a zero emission vehicle at their workplace (18 per cent). In addition, four in ten express concerns that zero emission vehicles can't travel far enough on a full charge (44 per cent), and that charging a zero emission vehicle at home will significantly increase their monthly electricity bill (42 per cent).
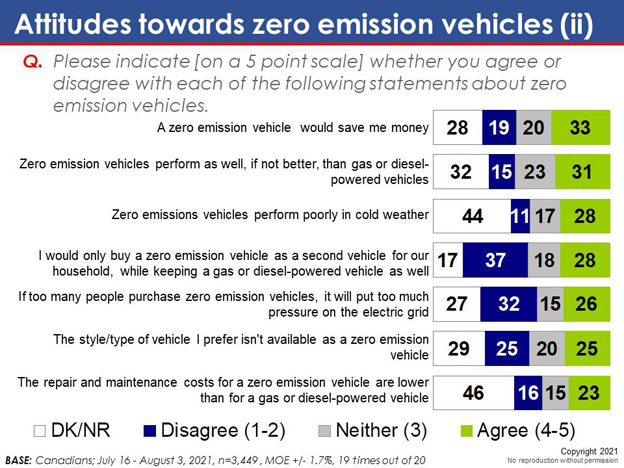
Only one in three believe a zero emission vehicle would save them money (fully 28 per cent are unsure), or that zero emission vehicles perform as well, if not better than gas or diesel-powered vehicles (and 32 per cent are unsure).
Three in ten (28 per cent) agree that zero emissions vehicles perform poorly in cold weather, but almost half (44 per cent) are unsure. A similar proportion agree that they would only buy a zero emission vehicle as a second vehicle for their household, while keeping a gas or diesel-powered vehicle as well (17 per cent are unsure).
One in four are concerned that if too many people purchase zero emission vehicles, it will put too much pressure on the electric grid (27 per cent are unsure). A similar proportion feel that the style/type of vehicle they prefer isn't available as a zero emission vehicle, but most are unsure. Fewer than one in five (18 per cent) feel there is an affordable zero emission vehicle available that meets their lifestyle needs, but again, many are unsure.
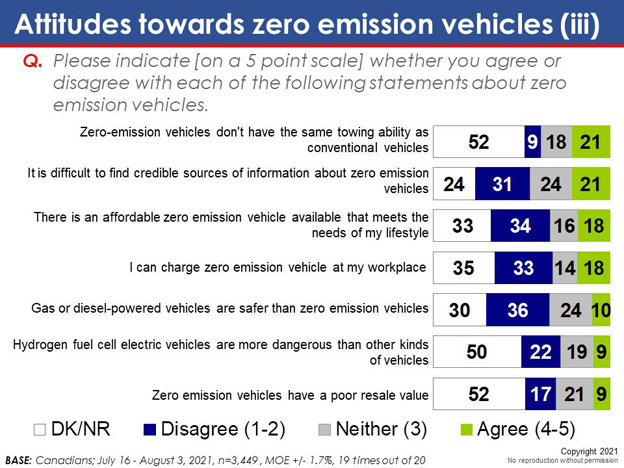
Fully half of respondents are unsure whether the repair and maintenance costs for a zero emission vehicle are lower than for a gas or diesel-powered vehicle (46 per cent), or whether zero-emission vehicles have the same towing ability as conventional vehicles (52 per cent).
Moreover, half of Canadians or more could not provide a response when asked whether hydrogen fuel cell electric vehicles are more dangerous than other kinds of vehicles (50 per cent), or whether zero emission vehicles have a poor resale value (52 per cent).
Finally, only one in five (21 per cent) agree that it is difficult to find credible sources of information about zero emission vehicles, and only one in ten (10 per cent) feel that gas or diesel-powered vehicles are safer than ZEVs, but again, many express uncertainty about these issues. (Charts are on following pages).
Men are more likely than women to agree that zero emission vehicles are too expensive (68 per cent, compared to 59 per cent).
Quebeckers (69 per cent), those with a household income of $150,000 or more (66 per cent), and university graduates (68 per cent) are more likely to agree that zero emission vehicles contribute significantly to a reduction of greenhouse gas emissions and air pollutants compared to gas or diesel-powered vehicles.
Agreement with the idea that zero emission vehicles are less damaging to the environment than gas or diesel-powered vehicles is higher among residents of Quebec and Ontario (63 per cent and 62 per cent, respectively), women (62 per cent), those under 35 years of age (62 per cent), and university graduates (66 per cent).
Residents of Saskatchewan/Manitoba (67 per cent), Alberta (60 per cent) and those with an annual household income between $80,000 and less than $150,000 (56 per cent) are more likely to agree that there are too few, if any, publicly available charging stations where they drive.
Men (56 per cent), Quebeckers (58 per cent), those earning $150,000 or more in household income (60 per cent), and university graduates (51 per cent) are more likely to agree that they can charge a zero emission vehicle at their home.
Agreement with the idea that zero emission vehicles can't travel far enough on a full charge is higher among residents of Alberta (52 per cent), men (51 per cent), and those earning $150,000 or more in household income (50 per cent).
Respondents most likely to say that zero emission vehicles contribute significantly to a reduction of greenhouse gas emissions and air pollutants compared to gas or diesel-powered vehicles include those willing to pay more for a zero emission vehicle than an equivalent conventional one (83 per cent) and those saying they plan to purchase a new vehicle (64 per cent).
Chart 20: Attitudes towards zero emission vehicles (i)
Chart 20: Attitudes towards zero emission vehicles (i) - Text Version
This stacked chart shows the percentage of results for responses to seven statements across four categories: DK/NR, disagree (1-2), neither (3), agree (4-5).
Respondents were asked: "Please indicate [on a 5 point scale] whether you agree or disagree with each of the following statements about zero emission vehicles."
Respondents selected:
Zero emission vehicles are too expensive
Category "DK/NR": 18%
Category "Disagree (1-2)": 7%
Category "Neither (3)": 12%
Category "Agree (4-5)": 63%
Zero emission vehicles contribute significantly to a reduction of greenhouse gas emissions and air pollutants compared to gas or diesel-powered vehicles
Category "DK/NR": 14%
Category "Disagree (1-2)": 13%
Category "Neither (3)": 12%
Category "Agree (4-5)": 61%
Zero emission vehicles are less damaging to the environment than gas or diesel-powered vehicles
Category "DK/NR": 14%
Category "Disagree (1-2)": 15%
Category "Neither (3)": 13%
Category "Agree (4-5)": 58%
There are too few, if any, publicly available charging stations where I drive
Category "DK/NR": 21%
Category "Disagree (1-2)": 13%
Category "Neither (3)": 13%
Category "Agree (4-5)": 53%
I can charge a zero emission vehicle at my home
Category "DK/NR": 22%
Category "Disagree (1-2)": 21%
Category "Neither (3)": 9%
Category "Agree (4-5)": 47%
Zero emission vehicles can't travel far enough on a full charge
Category "DK/NR": 24%
Category "Disagree (1-2)": 18%
Category "Neither (3)": 14%
Category "Agree (4-5)": 44%
I am worried that charging a zero emission vehicle at home will significantly increase my monthly electricity bill
Category "DK/NR": 18%
Category "Disagree (1-2)": 25%
Category "Neither (3)": 15%
Category "Agree (4-5)": 42%
Base: Canadians; July 16 - August 3, 2021, n=3,449, MOE ± 1.7%, 19 times out of 20
Chart 21: Attitudes towards zero emission vehicles (ii)
Chart 21: Attitudes towards zero emission vehicles (ii) - Text Version
This stacked chart shows the percentage of results for responses to seven statements across four categories: DK/NR, disagree (1-2), neither (3), agree (4-5).
Respondents were asked: "Please indicate [on a 5 point scale] whether you agree or disagree with each of the following statements about zero emission vehicles."
Respondents selected:
A zero emission vehicle would save me money
Category "DK/NR": 28%
Category "Disagree (1-2)": 19%
Category "Neither (3)": 20%
Category "Agree (4-5)": 33%
Zero emission vehicles perform as well, if not better, than gas or diesel-powered vehicles
Category "DK/NR": 32%
Category "Disagree (1-2)": 15%
Category "Neither (3)": 23%
Category "Agree (4-5)": 31%
Zero emissions vehicles perform poorly in cold weather
Category "DK/NR": 44%
Category "Disagree (1-2)": 11%
Category "Neither (3)": 17%
Category "Agree (4-5)": 28%
I would only buy a zero emission vehicle as a second vehicle for our household, while keeping a gas or diesel-powered vehicle as well
Category "DK/NR": 17%
Category "Disagree (1-2)": 37%
Category "Neither (3)": 18%
Category "Agree (4-5)": 28%
If too many people purchase zero emission vehicles, it will put too much pressure on the electric grid
Category "DK/NR": 27%
Category "Disagree (1-2)": 32%
Category "Neither (3)": 15%
Category "Agree (4-5)": 26%
The style/type of vehicle I prefer isn't available as a zero emission vehicle
Category "DK/NR": 29%
Category "Disagree (1-2)": 25%
Category "Neither (3)": 20%
Category "Agree (4-5)": 25%
The repair and maintenance costs for a zero emission vehicle are lower than for a gas or diesel-powered vehicle
Category "DK/NR": 46%
Category "Disagree (1-2)": 16%
Category "Neither (3)": 15%
Category "Agree (4-5)": 23%
Base: Canadians; July 16 - August 3, 2021, n=3,449, MOE ± 1.7%, 19 times out of 20
Chart 22: Attitudes towards zero emission vehicles (iii)
Chart 22: Attitudes towards zero emission vehicles (iii) - Text Version
This stacked chart shows the percentage of results for responses to seven statements across four categories: DK/NR, disagree (1-2), neither (3), agree (4-5).
Respondents were asked: "Please indicate [on a 5 point scale] whether you agree or disagree with each of the following statements about zero emission vehicles."
Respondents selected:
Zero-emission vehicles don't have the same towing ability as conventional vehicles
Category "DK/NR": 52%
Category "Disagree (1-2)": 9%
Category "Neither (3)": 18%
Category "Agree (4-5)": 21%
It is difficult to find credible sources of information about zero emission vehicles
Category "DK/NR": 24%
Category "Disagree (1-2)": 31%
Category "Neither (3)": 24%
Category "Agree (4-5)": 21%
There is an affordable zero emission vehicle available that meets the needs of my lifestyle
Category "DK/NR": 33%
Category "Disagree (1-2)": 34%
Category "Neither (3)": 16%
Category "Agree (4-5)": 18%
I can charge zero emission vehicle at my workplace
Category "DK/NR": 35%
Category "Disagree (1-2)": 33%
Category "Neither (3)": 14%
Category "Agree (4-5)": 18%
Gas or diesel-powered vehicles are safer than zero emission vehicles
Category "DK/NR": 30%
Category "Disagree (1-2)": 36%
Category "Neither (3)": 24%
Category "Agree (4-5)": 10%
Hydrogen fuel cell electric vehicles are more dangerous than other kinds of vehicles
Category "DK/NR": 50%
Category "Disagree (1-2)": 22%
Category "Neither (3)": 19%
Category "Agree (4-5)": 9%
Zero emission vehicles have a poor resale value
Category "DK/NR": 52%
Category "Disagree (1-2)": 17%
Category "Neither (3)": 21%
Category "Agree (4-5)": 9%
Base: Canadians; July 16 - August 3, 2021, n=3,449, MOE ± 1.7%, 19 times out of 20
Sources of Information about Zero Emission Vehicles
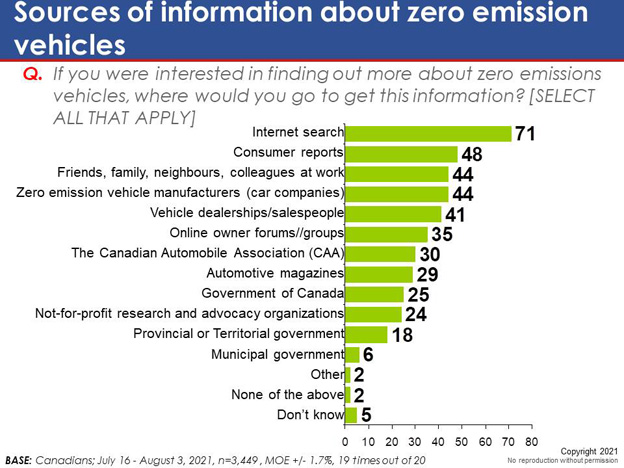
When asked where they would go to find out more information about zero emissions vehicles, respondents most often mentioned an internet search (71 per cent), followed fairly distantly by consumer reports (48 per cent), friends and family (44 per cent), and zero emission vehicle manufacturers (44 per cent).
Residents of Ontario (77 per cent), those ages 35 to 54 (76 per cent), men (74 per cent), those earning $80,000 or more in household income (78 per cent) and university graduates (79 per cent) are more likely to indicate they would look for information about zero emission vehicles through an Internet search.
Those ages 55 and over (57 per cent) and university graduates (52 per cent) are the most likely to look for information on ZEVs in consumer reports.
Those willing to pay more for a zero emission vehicle than an equivalent conventional one are more likely to look for information on ZEVs through an Internet Search (81 per cent) and in ZEV manufacturers (59 per cent).
Chart 23: Sources of information about zero emission vehicles
Chart 23: Sources of information about zero emission vehicles - Text Version
This chart of single bars shows the percentage of results for responses to fifteen statements.
Respondents were asked: "If you were interested in finding out more about zero emissions vehicles, where would you go to get this information? [Select all that ally]?"
Respondents selected:
Internet search: 71%
Consumer reports: 48%
Friends, family, neighbours, colleagues at work: 44%
Zero emission vehicle manufacturers (car companies): 44%
Vehicle dealerships/salespeople: 41%
Online owner forums//groups: 35%
The Canadian Automobile Association (CAA): 30%
Automotive magazines: 29%
Government of Canada: 25%
Not-for-profit research and advocacy organizations: 24%
Provincial or Territorial government: 18%
Municipal government: 6%
Other: 2%
None of the above: 2%
Don't know: 5%
Base: Canadians; July 16 - August 3, 2021, n=3,449, MOE ± 1.7%, 19 times out of 20
Importance of Price in Purchase of Zero Emission Vehicles
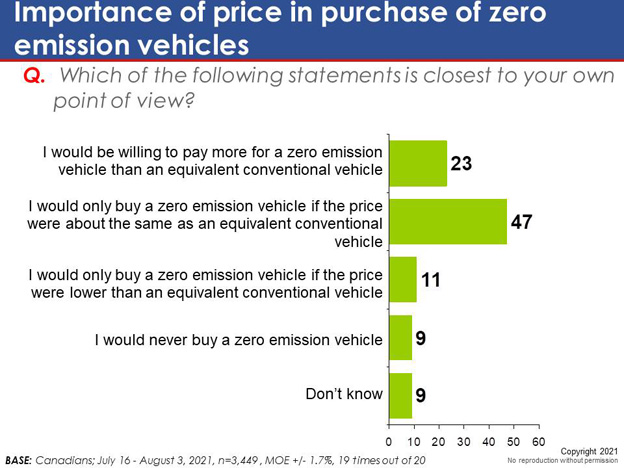
Respondents were also asked which of a range of statements about the purchase price of a ZEV is closest to their own point of view. Most indicated that they would only buy a zero emission vehicle if the price were about the same as an equivalent conventional vehicle (47 per cent). About one in four (23 per cent) would be willing to pay more for a zero emission vehicle than an equivalent conventional vehicle, and about one in ten (11 per cent) indicated they would only buy a zero emission vehicle if the price were lower than an equivalent conventional vehicle. Nine per cent said they would never buy a zero emission vehicle.
Those under 35 years of age (50 per cent) and those earning from $40,000 to less than $80,000 in household income (50 per cent) are particularly likely to indicate they would only buy a zero emission vehicle if the price were about the same as an equivalent conventional vehicle.
Residents on Quebec are more likely to say they would be willing to pay more for a zero emission vehicle than an equivalent conventional vehicle (27 per cent, compared to 23 per cent nationally).
Chart 24: Importance of price in purchase of zero emission vehicles
Chart 24: Importance of price in purchase of zero emission vehicles - Text Version
This chart of single bars shows the percentage of results for responses to five statements.
Respondents were asked: "Which of the following statements is closest to your own point of view?"
Respondents selected:
I would be willing to pay more for a zero emission vehicle than an equivalent conventional vehicle: 23%
I would only buy a zero emission vehicle if the price were about the same as an equivalent conventional vehicle: 47%
I would only buy a zero emission vehicle if the price were lower than an equivalent conventional vehicle: 11%
I would never buy a zero emission vehicle: 9%
Don't know: 9%
Base: Canadians; July 16 - August 3, 2021, n=3,449, MOE ± 1.7%, 19 times out of 20
Factors Encouraging Purchasing/Leasing a Zero Emission Vehicle
Canadians were also asked to what extent a range of factors would make them more likely to consider purchasing or leasing a zero emission vehicle. Proven reliability in Canadian climates, and having access to a charging station at home were seen as the most important factors in encouraging Canadians to consider purchasing/leasing ZEVs.
Equal or greater driving range than a gas or diesel vehicle, a 10-year battery warranty, and rebates/incentives to cover the price difference between zero emission vehicles and gas or diesel-powered vehicles were also seen as effective in encouraging Canadians to consider ZEVs.
Seeing more charging stations along highways, improved winter-weather performance, lower maintenance costs, and seeing more charging stations in public parking lots and shopping destinations were also seen as important factors to encourage the purchase/lease of ZEVs.
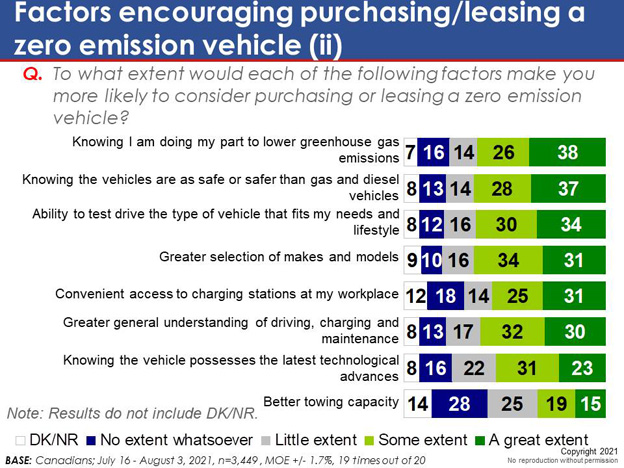
Knowing they are doing their part to lower greenhouse gas emissions, knowing the vehicles are as safe or safer than gas and diesel vehicles, and the ability to test drive the type of vehicle that fits their needs and lifestyle are seen as moderately effective factors in encouraging consideration of ZEVs.
Greater selection of makes and models, convenient access to charging stations at their workplace, and greater general understanding of driving, charging and maintenance are seen as less important but still somewhat significant factors to encourage Canadians to consider the purchase/lease of ZEVs.
Relatively few felt that knowing the vehicle possesses the latest technological advances, or better towing capacity would encourage consideration of ZEVs. (Charts are on following page).
Residents of the Territories (79 per cent), those with a household income of $150,000 or more (61 per cent) and university graduates (60 per cent) are more likely to consider purchasing/leasing a ZEV if the vehicle has proven reliability in Canadian climates.
Respondents most likely to consider the purchase of a ZEV if the vehicle has proven reliability in Canadian climates include those willing to pay more for a zero emission vehicle than an equivalent conventional one, and those saying they plan to purchase a new vehicle (63 per cent each).
Residents of Quebec and Ontario (58 per cent and 57 per cent, respectively), those under 35 years of age (58 per cent), women (56 per cent), those earning $150,000 or more in household income (58 per cent) and university graduates (61 per cent) are more likely to say they would consider purchasing/leasing a ZEV if they have access to a charging station at home.
Chart 25: Factors encouraging purchasing/leasing a zero emission vehicle (i)
Chart 25: Factors encouraging purchasing/leasing a zero emission vehicle (i) - Text Version
This stacked bar chart shows the percentage of results for responses to nine statements across four categories: No extent whatsoever, little extent, some extent, a great extent.
Respondents were asked: "To what extent would each of the following factors make you more likely to consider purchasing or leasing a zero emission vehicle?"
Respondents selected:
Proven reliability in Canadian climates
Category "No extent whatsoever": 6%
Category "Little extent": 7%
Category "Some extent": 23%
Category "A great extent": 56%
Having access to a charging station at home
Category "No extent whatsoever": 8%
Category "Little extent": 8%
Category "Some extent": 23%
Category "A great extent": 54%
Equal or greater driving range than a gas or diesel vehicle
Category "No extent whatsoever": 6%
Category "Little extent": 9%
Category "Some extent": 26%
Category "A great extent": 51%
10-year battery warranty
Category "No extent whatsoever": 7%
Category "Little extent": 7%
Category "Some extent": 26%
Category "A great extent": 51%
Rebates/incentives to cover the price difference between zero emission vehicles and gas or diesel-powered vehicles
Category "No extent whatsoever": 10%
Category "Little extent": 8%
Category "Some extent": 24%
Category "A great extent": 50%
Seeing more charging stations along highways
Category "No extent whatsoever": 8%
Category "Little extent": 10%
Category "Some extent": 29%
Category "A great extent": 46%
Improved winter-weather performance
Category "No extent whatsoever": 7%
Category "Little extent": 9%
Category "Some extent": 29%
Category "A great extent": 45%
Lower maintenance costs
Category "No extent whatsoever": 7%
Category "Little extent": 10%
Category "Some extent": 31%
Category "A great extent": 43%
Seeing more charging stations in public parking lots and shopping destinations
Category "No extent whatsoever": 9%
Category "Little extent": 11%
Category "Some extent": 31%
Category "A great extent": 41%
Note: Results do not include DK/NR.
Base: Canadians; July 16 - August 3, 2021, n=3,449, MOE ± 1.7%, 19 times out of 20
Chart 26: Factors encouraging purchasing/leasing a zero emission vehicle (ii)
Chart 26: Factors encouraging purchasing/leasing a zero emission vehicle (ii) - Text Version
This stacked bar chart shows the percentage of results for responses to eight statements across five categories: DK/NR, no extent whatsoever, little extent, some extent, a great extent.
Respondents were asked: "To what extent would each of the following factors make you more likely to consider purchasing or leasing a zero emission vehicle?"
Respondents selected:
Knowing I am doing my part to lower greenhouse gas emissions
Category "DK/NR": 7%
Category "No extent whatsoever": 16%
Category "Little extent": 14%
Category "Some extent": 26%
Category "A great extent": 38%
Knowing the vehicles are as safe or safer than gas and diesel vehicles
Category "DK/NR": 8%
Category "No extent whatsoever": 13%
Category "Little extent": 14%
Category "Some extent": 28%
Category "A great extent": 37%
Ability to test drive the type of vehicle that fits my needs and lifestyle
Category "DK/NR": 8%
Category "No extent whatsoever": 12%
Category "Little extent": 16%
Category "Some extent": 30%
Category "A great extent": 34%
Greater selection of makes and models
Category "DK/NR": 9%
Category "No extent whatsoever": 10%
Category "Little extent": 16%
Category "Some extent": 34%
Category "A great extent": 31%
Convenient access to charging stations at my workplace
Category "DK/NR": 12%
Category "No extent whatsoever": 18%
Category "Little extent": 14%
Category "Some extent": 25%
Category "A great extent": 31%
Greater general understanding of driving, charging and maintenance
Category "DK/NR": 8%
Category "No extent whatsoever": 13%
Category "Little extent": 17%
Category "Some extent": 32%
Category "A great extent": 30%
Knowing the vehicle possesses the latest technological advances
Category "DK/NR": 8%
Category "No extent whatsoever": 16%
Category "Little extent": 22%
Category "Some extent": 31%
Category "A great extent": 23%
Better towing capacity
Category "DK/NR": 14%
Category "No extent whatsoever": 28%
Category "Little extent": 25%
Category "Some extent": 19%
Category "A great extent": 15%
Base: Canadians; July 16 - August 3, 2021, n=3,449, MOE ± 1.7%, 19 times out of 20
E. Awareness and Support for Government Rebates
Awareness and Understanding of Government Rebates for Zero Emission Vehicles
Results suggest Canadians have limited awareness of government rebates for ZEVs. When asked whether they have seen, read or heard about the Government of Canada's vehicle purchase rebates to encourage Canadians to buy zero emission vehicles, a majority (53 per cent) indicate they have not heard of these rebates, while four in ten say they are aware of them.
Residents of Quebec are more likely to have seen, read or heard about the Government of Canada's vehicle purchase rebates (67 per cent, compared to 43 per cent nationally).
Men (49 per cent), those under 35 years of age (48 per cent), those willing to pay more for a zero emission vehicle than an equivalent conventional one (57 per cent), and those saying they plan to purchase a new vehicle (49 per cent) are also more likely to express awareness of these rebates.
Awareness of Government of Canada rebates rise progressively with both income (from 33 per cent among those earning less than $40,000 in household income to 52 per cent among those earning $150,000 or more) and education (from 31 per cent among those with a high school diploma to 49 per cent among university graduates).
Among those who indicated they are aware of these Government of Canada rebates, most (64 per cent) are unsure how to apply for them.
Those ages 35 to 54 are somewhat more likely to say they know how to apply for these rebates (36 per cent, compared to 32 per cent overall).
Chart 27: Awareness and understanding of government rebates for zero emission vehicles
Chart 27: Awareness and understanding of government rebates for zero emission vehicles - Text Version
These two pie charts show the percentage of results for responses across two categories: yes and no.
Respondents were asked two questions: "Have you seen, read or heard about the Government of Canada's vehicle purchase rebates to encourage Canadians to buy zero emission vehicles?" and "[If yes] Do you know how you can apply for the Government of Canada vehicle purchase rebates?"
Respondents selected:
Left
Category "Yes": 43%
Category "No": 53%
Note: Results do not include DK/NR.
Base: Canadians; July 16 - August 3, 2021, n=2,836, MOE ± 1.8%, 19 times out of 20
Right
Category "Yes": 32%
Category "No": 64%
Note: Results do not include DK/NR.
Base: If yes; July 16 - August 3, 2021, n=1,215, MOE ± 2.8%, 19 times out of 20
Support for Government Incentives for the Purchase of Zero Emission Vehicles
Despite limited awareness of these rebates, a clear majority of respondents (69 per cent) support the Government of Canada providing incentives to encourage Canadians to buy zero emission vehicles.
Support for Government of Canada incentives to encourage the purchase of zero emission vehicles rises progressively with education (59 per cent of those with a high school diploma, compared to 79 per cent of university graduates).
Residents of Quebec (78 per cent), those under 35 years of age (78 per cent), women (73 per cent), those earning from $40,000 to under $80,000 in household income (73 per cent), those willing to pay more for a zero emission vehicle than an equivalent conventional one (93 per cent) and those saying they plan to purchase a new vehicle (72 per cent) are also more likely to support these incentives.
Chart 28: Support for government incentives for the purchase of zero emission vehicles
Chart 28: Support for government incentives for the purchase of zero emission vehicles - Text Version
This stacked chart shows the percentage of results for responses to ten statements across three categories: oppose, neutral, support.
Respondents were asked: "Do you support or oppose the Government of Canada providing incentives to encourage Canadians to buy zero emission vehicles?"
Respondents selected:
Overall:
Category "Oppose": 18%
Category "Neutral": 11%
Category "Support": 69%
<35:
Category "Oppose": 10%
Category "Neutral": 8%
Category "Support": 78%
35-54:
Category "Oppose": 20%
Category "Neutral": 12%
Category "Support": 67%
55-64:
Category "Oppose": 22%
Category "Neutral": 11%
Category "Support": 65%
65+:
Category "Oppose": 18%
Category "Neutral": 15%
Category "Support": 65%
Male:
Category "Oppose": 24%
Category "Neutral": 10%
Category "Support": 66%
Female:
Category "Oppose": 12%
Category "Neutral": 13%
Category "Support": 73%
High School:
Category "Oppose": 20%
Category "Neutral": 17%
Category "Support": 59%
College:
Category "Oppose": 20%
Category "Neutral": 14%
Category "Support": 63%
University:
Category "Oppose": 14%
Category "Neutral": 7%
Category "Support": 79%
Note: Results do not include DK/NR.
Base: Canadians; July 16 - August 3, 2021, n=3,449, MOE ± 1.7%, 19 times out of 20
Appendices
A. Methodological Details
The research involved an online survey of 3,449 Canadians. The survey was conducted across Canada in both official languages. The field dates for the survey were July 16-August 3, 2021.
We used our probability-based online panel, Probit, in undertaking this survey. Probit is an online research panel that has been designed by Ekos to provide statistically representative data. Our panel offers complete coverage of the Canadian population (Internet, phone, cell phone), random recruitment (participants are recruited randomly; they do not opt themselves into our panel), and equal probability sampling. All respondents to our panel are recruited by telephone using random digit dialling, and their demographic information is confirmed by live interviewers.
The distribution of the recruitment process for our panel mirrors the actual population in Canada (as defined by Statistics Canada). As such, our panel can be considered representative of the general public (survey results from our online panel support confidence intervals and margin of error estimates). The overall panel size is roughly 90,000 Canadian households. Random stratified samples are drawn from the panel database for individual research assignments.
All survey results were weighted by region, age and gender according to Statistics Canada data, to ensure results are representative of the Canadian public. The margin of error for a survey of n=3,449 is ± 1.7 percentage points, 19 times out of 20.
Sample design, weighting and respondent profile
The sampling method was designed to complete interviews with at least 3,400 Canadians ages 18 and over. Quotas were set by age, gender, and region. The survey obtained the following distribution:
Distribution Table
Variable
% of population
Target (quota)
% of sample
Actual Unweighted
Actual Weighted*
Jurisdiction
Newfoundland and Labrador
2%
135
4%
140
51
Nova Scotia
3%
140
4%
150
97
Prince Edward Island
<1%
75
2%
76
14
New Brunswick
2%
135
4%
137
76
Quebec
23%
750
22%
755
800
Ontario
38%
800
23%
804
1,306
Manitoba
4%
180
5%
182
119
Saskatchewan
3%
180
5%
180
106
Alberta
11%
475
14%
479
387
British Columbia
14%
500
15%
500
466
Territories
<1%
30
1%
31
12
Age
18-34
27%
930
22%
756
954
35-54
34%
1,158
36%
1,238
1,174
55+
39%
1,311
42%
1,414
1,280
Gender
Male
49%
1,652
48%
1,641
1,652
Female
51%
1,747
52%
1,762
1,751
The following table presents the weighted distribution of survey participants by specific variables.
Variable
Total sample %
% of population
Education α
High school or less
19
35
Apprentice/college/some university
35
36
University graduate/post-graduate
45
29
Total annual household income +
Under $40,000
13
17
$40,000-<$80,000
25
30
$80,000-<$100,000
14
13
$100,000-<$150,000
20
22
$150,000 or more
17
18
Survey language /official languages
English
84
85
French
16
15
α Actual Census categories differ from those used in this survey; categories have been adjusted to correspond. Statistics Canada figures for education are for Canadians aged 25 to 64 years. For employment age 15+.
+ Percentaged on those providing a response
Questionnaire design
NRCan provided Ekos with a draft questionnaire for review and comment. In consultation with NRCan, Ekos revised and finalized the questionnaire.
Ekos data analysts programmed the final questionnaire and performed thorough testing to ensure accuracy in set-up and data collection. This validation ensured that the data entry process conformed to the surveys' basic logic. The data collection system handles sampling invitations, quotas and questionnaire completion (skip patterns, branching, and valid ranges). The client was also given the opportunity to test the survey links.
Prior to finalizing the survey for field, a pre-test (soft launch) was conducted in English and French. The pre-test assessed the questionnaires in terms of question wording and sequencing, respondent sensitivity to specific questions and to the survey overall, and to determine the survey length; standard Government of Canada pre- testing questions were also asked.
The final survey questionnaire is included in Appendix B.
Fieldwork
The survey was conducted by Ekos using a secure, fully featured web-based survey environment. The average interview length was 13.9 minutes.
All respondents were offered the opportunity to complete the surveys in their official language of choice. All research work was conducted in accordance with the Standards for the Conduct of Government of Canada Public Opinion Research – Online Surveys and recognized industry standards, as well as applicable federal legislation (The Privacy Act, Personal Information Protection and Electronic Documents Act, and Access to Information Act).
Following data collection, the data from this survey were statistically weighted to ensure the sample is representative of the Canadian population according to the most recently available Census information.
Completion results
The completion results are presented in the following table.
Contact Disposition
Disposition
N
Total invitations (c)
16,728
Total completes (d)
3,449
Qualified break-offs (e)
792
Disqualified (f)
0
Not responded (g)
12,401
Quota filled (h)
86
Contact rate = (d+e+f+h)/c
26%
Participation rate = (d+f+h)/c
21%
Non-response bias analysis
The table below presents a profile of the final sample, compared to the actual population of Canada (2016 Census information). As is the case with most surveys, the final sample underrepresents those with high school or less education, which is a typical pattern for public opinion surveys in Canada (e.g., those with more education are more likely to respond to surveys).
Non-response bias analysis
Sample type
Sample*
Canada (2016 Census)
Gender (18+)
Male
48%
49%
Female
52%
51%
Age
18-34
22%
27%
35-54
36%
34%
55+
42%
39%
Education level α
High school diploma or less
19%
35%
Trades/college/post sec no degree
35%
36%
University degree
45%
29%
* Data are unweighted and percentaged on those giving a response to each demographic question
α Actual Census categories differ from those used in this survey and have been recalculated to correspond.
Statistics Canada figures for education are for Canadians aged 25 to 64 years.
B. Survey Questionnaire
Web Introduction
Thanks for agreeing to participate in this survey. This survey is being conducted by the Government of Canada and covers a range of topics with a particular focus on vehicle ownership and use. It should take you about 15 minutes to complete.
Si vous préférez répondre au sondage en français, veuillez cliquer sur [français].
Your participation is voluntary and completely confidential. Your answers will remain anonymous. It is being directed by Ekos Research, and is being administered according to the requirements of the Privacy Act. To view our privacy policy, click here.
If you need an alternative means of accessing the survey, click the following link: [Accessible version].
The survey is registered with the Research Verification Services operated by the Canadian Research Insights Council (CRIC). [Click here] if you wish to verify its authenticity (project code 20210714-EK256).
If you require any technical assistance, please contact online@ekos.com.
QA
These first few questions will help us to understand more about you and any recent vehicle purchases you have made or intend to make in the near future.
Do you plan to purchase or lease a new or used personal vehicle for yourself or others in the next 10 years?
Yes: 1
No: 2
Don't know: 9
Q1
QA = Yes
If... QA = 1
In what timeframe do you plan to purchase or lease a new or used personal vehicle for yourself or others:
Within the next 2 years: 1
Within the next 2-5 years: 2
Within the next 5-10 years: 3
Don't know: 9
Q2 [1,10]
QA = Yes
If... QA = 1
What size or type of personal vehicle will you be considering for lease or purchase?
Check all that apply.
Small car: 1
Midsize car: 2
Large car: 3
Small sport utility (SUV)/crossover: 4
Midsize sport utility/crossover: 5
Large sport utility/crossover: 6
Pick-up truck: 7
Other (name): 77
Don't know: 99 X
Q3
QA = Yes
If... QA = 1
Do you plan to purchase a new or previously owned vehicle?
New: 1
Previously owned: 2
Don't know/not sure: 9
Q4
QA = Yes
If... QA = 1
What will likely be the total market value of the vehicle you plan to purchase or lease?
Less than $10,000: 1
$10,000-$24,999: 2
$25,000-$39,999: 3
$40,000-$54,999: 4
$55,000-$74,999: 5
$75,000 or more: 6
Don't know: 9
Q5
How many personal vehicles do you currently have in your household?
None: 98
1: 1
2: 2
3 or more: 3
Don't know: 99
Q5A
Q5 greater than 0
If... Q5 = 1,2,3
Do you currently own or lease an electric vehicle (a vehicle that runs on electricity)?
Yes: 1
No: 2
Don't know: 9
Q6
Q5A = No
If... Q5 = 1,2,3 and Q5A = 2
Have you considered purchasing or leasing an electric vehicle (a vehicle that runs on electricity) for your household?
Yes: 1
No: 2
Don't know: 9
Q7
Q6 = Yes
If... Q5 = 1,2,3 and Q5A = 2 and Q6 = 1
Which of the following best describes your current situation with respect to purchasing or leasing an electric vehicle:
Shopped for an electric vehicle, but haven't purchased or leased: 1
Started to gather information and make inquiries, but have not seriously considered an electric vehicle yet: 2
Have thought about it, but no real steps have been taken to purchase/lease an electric vehicle: 3
Have not considered buying/leasing an electric vehicle: 4
Was not aware electric vehicles were available for purchase: 9
Q9
Now, we have a few questions about zero emissions vehicles (ZEVs).
Zero emissions vehicles are vehicles that can be driven without producing polluting exhaust, and include fully battery electric (often referred to simply as "electric vehicles" or "EVs"), plug-in hybrid electric, and hydrogen fuel cell electric vehicles.
Have you ever driven or ridden in a zero emission vehicle?
Yes: 1
No: 2
Don't know: 9
Q10
Q9 = No
If... Q9 = 2
Imagine you were able to test drive a zero emission vehicle that suited your lifestyle needs, at a location that was convenient for you and with an impartial expert (no brand affiliation) available at the test drive to answer your questions. How interested, if at all, would you be in taking a zero emission vehicle for a test drive?
Very interested: 1
Somewhat interested: 2
Only a little interested: 3
Not at all interested: 4
Don't know: 9
Q11
Do you know an owner of a zero emission vehicle? For example, a friend, family member, neighbour or colleague.
Yes: 1
No: 2
Don't know: 9
PQ12
Please name any zero emission vehicle makes and models (company and specific car, SUV or truck name) of which you are aware.
Q12A [0,1]
Vehicle 1
Please specify: 77
Don't know: 99 S
Q12B [0,1]
Vehicle 2
Please specify: 77
Don't know: 99 S
Q12C [0,1]
Vehicle 3
Please specify: 77
Don't know: 99 S
Q12D [0,1]
Vehicle 4
Please specify: 77
Don't know: 99 S
Q12E [0,1]
Vehicle 5
Please specify: 77
Don't know: 99 S
PQ13
In general, how familiar are you with each of the following aspects of zero emission vehicles?
Q13A
How the "fueling up" process works when electricity powers a vehicle instead of gas or diesel
Very familiar: 1
Somewhat familiar: 2
Not very familiar: 3
Not familiar at all: 4
Don't know: 9 S
Q13B
Availability of makes and models in your area
Very familiar: 1
Somewhat familiar: 2
Not very familiar: 3
Not familiar at all: 4
Don't know: 9 S
Q13C
Vehicle safety performance
Very familiar: 1
Somewhat familiar: 2
Not very familiar: 3
Not familiar at all: 4
Don't know: 9 S
Q13D
Vehicle maintenance costs
Very familiar: 1
Somewhat familiar: 2
Not very familiar: 3
Not familiar at all: 4
Don't know: 9 S
Q13E
Purchase price
Very familiar: 1
Somewhat familiar: 2
Not very familiar: 3
Not familiar at all: 4
Don't know: 9 S
Q13F
Costs to charge battery of electric vehicles
Very familiar: 1
Somewhat familiar: 2
Not very familiar: 3
Not familiar at all: 4
Don't know: 9 S
Q13G
Environmental impact
Very familiar: 1
Somewhat familiar: 2
Not very familiar: 3
Not familiar at all: 4
Don't know: 9 S
Q13H
Different levels, or speeds, of vehicle charging equipment
Very familiar: 1
Somewhat familiar: 2
Not very familiar: 3
Not familiar at all: 4
Don't know: 9 S
Q13I
Potential to charge ("fuel up") battery at your home
Very familiar: 1
Somewhat familiar: 2
Not very familiar: 3
Not familiar at all: 4
Don't know: 9 S
Q13J
Potential to charge ("fuel up") at your workplace
Very familiar: 1
Somewhat familiar: 2
Not very familiar: 3
Not familiar at all: 4
Don't know: 9 S
Q13K
Driving range – how far a vehicle can go on a fully charged battery
Very familiar: 1
Somewhat familiar: 2
Not very familiar: 3
Not familiar at all: 4
Don't know: 9 S
Q13L
Availability of consumer information
Very familiar: 1
Somewhat familiar: 2
Not very familiar: 3
Not familiar at all: 4
Don't know: 9 S
Q13M
Time required to charge the battery
Very familiar: 1
Somewhat familiar: 2
Not very familiar: 3
Not familiar at all: 4
Don't know: 9 S
Q13N
Resale value
Very familiar: 1
Somewhat familiar: 2
Not very familiar: 3
Not familiar at all: 4
Don't know: 9 S
Q13O
Subsidies for new/used vehicle purchase
Very familiar: 1
Somewhat familiar: 2
Not very familiar: 3
Not familiar at all: 4
Don't know: 9 S
Q13P
Reliability
Very familiar: 1
Somewhat familiar: 2
Not very familiar: 3
Not familiar at all: 4
Don't know: 9 S
Q13Q
Battery life expectancy
Very familiar: 1
Somewhat familiar: 2
Not very familiar: 3
Not familiar at all: 4
Don't know: 9 S
Q13R
Warranty
Very familiar: 1
Somewhat familiar: 2
Not very familiar: 3
Not familiar at all: 4
Don't know: 9 S
Q13S
Cost of insurance
Very familiar: 1
Somewhat familiar: 2
Not very familiar: 3
Not familiar at all: 4
Don't know: 9 S
Q13T
Towing capacity
Very familiar: 1
Somewhat familiar: 2
Not very familiar: 3
Not familiar at all: 4
Don't know: 9 S
Q13U
Availability of all-wheel drive
Very familiar: 1
Somewhat familiar: 2
Not very familiar: 3
Not familiar at all: 4
Don't know: 9 S
Q13V
Winter performance
Very familiar: 1
Somewhat familiar: 2
Not very familiar: 3
Not familiar at all: 4
Don't know: 9 S
Q14
Which of the following statements best describes your interest in purchasing/leasing zero emission vehicles?
I am very interested in a zero emission vehicle and will definitely consider one when purchasing my next vehicle: 1
I have some interest in a zero emission vehicle and would consider one when purchasing or leasing my next vehicle: 2
I have some interest in a zero emission vehicle but I cannot find a way to test drive one in my area: 3
I have some interest in a zero emission vehicle, but today's options do not meet my driving needs: 4
I have no interest in a zero emission vehicle: 5
I don't know enough about zero emission vehicles to answer: 9
PQ15
Please indicate whether you agree or disagree with each of the following statements about zero emission vehicles.
Q15A
There are too few, if any, publicly available charging stations where I drive
Strongly agree: 1
Somewhat agree: 2
Neither agree nor disagree: 3
Somewhat disagree: 4
Strongly disagree: 5
I don't know: 9 S
Q15B
It is difficult to find credible sources of information about zero emission vehicles
Strongly agree: 1
Somewhat agree: 2
Neither agree nor disagree: 3
Somewhat disagree: 4
Strongly disagree: 5
I don't know: 9 S
Q15C
I would only buy a zero emission vehicle as a second vehicle for our household, while keeping a gas or diesel-powered vehicle as well
Strongly agree: 1
Somewhat agree: 2
Neither agree nor disagree: 3
Somewhat disagree: 4
Strongly disagree: 5
I don't know: 9 S
Q15D
Zero emission vehicles are too expensive
Strongly agree: 1
Somewhat agree: 2
Neither agree nor disagree: 3
Somewhat disagree: 4
Strongly disagree: 5
I don't know: 9 S
Q15E
Zero emission vehicles are less damaging to the environment than gas or diesel-powered vehicles
Strongly agree: 1
Somewhat agree: 2
Neither agree nor disagree: 3
Somewhat disagree: 4
Strongly disagree: 5
I don't know: 9 S
Q15F
Zero emission vehicles can't travel far enough on a full charge
Strongly agree: 1
Somewhat agree: 2
Neither agree nor disagree: 3
Somewhat disagree: 4
Strongly disagree: 5
I don't know: 9 S
Q15G
The repair and maintenance costs for a zero emission vehicle are lower than for a gas or diesel-powered vehicle
Strongly agree: 1
Somewhat agree: 2
Neither agree nor disagree: 3
Somewhat disagree: 4
Strongly disagree: 5
I don't know: 9 S
Q15H
I can charge a zero emission vehicle at my home
Strongly agree: 1
Somewhat agree: 2
Neither agree nor disagree: 3
Somewhat disagree: 4
Strongly disagree: 5
I don't know: 9 S
Q15H2
I can charge a zero emission vehicle at my workplace
Strongly agree: 1
Somewhat agree: 2
Neither agree nor disagree: 3
Somewhat disagree: 4
Strongly disagree: 5
I don't know: 9 S
Q15I
The style/type of vehicle I prefer isn't available as a zero emission vehicle
Strongly agree: 1
Somewhat agree: 2
Neither agree nor disagree: 3
Somewhat disagree: 4
Strongly disagree: 5
I don't know: 9 S
Q15J
Gas or diesel-powered vehicles are safer than zero emission vehicles
Strongly agree: 1
Somewhat agree: 2
Neither agree nor disagree: 3
Somewhat disagree: 4
Strongly disagree: 5
I don't know: 9 S
Q15K
Hydrogen fuel cell electric vehicles are more dangerous than other kinds of vehicles
Strongly agree: 1
Somewhat agree: 2
Neither agree nor disagree: 3
Somewhat disagree: 4
Strongly disagree: 5
I don't know: 9 S
Q15L
Zero emission vehicles perform as well, if not better, than gas or diesel-powered vehicles
Strongly agree: 1
Somewhat agree: 2
Neither agree nor disagree: 3
Somewhat disagree: 4
Strongly disagree: 5
I don't know: 9 S
Q15M
A zero emission vehicle would save me money
Strongly agree: 1
Somewhat agree: 2
Neither agree nor disagree: 3
Somewhat disagree: 4
Strongly disagree: 5
I don't know: 9 S
Q15N
Zero emission vehicles have a poor resale value
Strongly agree: 1
Somewhat agree: 2
Neither agree nor disagree: 3
Somewhat disagree: 4
Strongly disagree: 5
I don't know: 9 S
Q15O
If too many people purchase zero emission vehicles, it will put too much pressure on the electric grid
Strongly agree: 1
Somewhat agree: 2
Neither agree nor disagree: 3
Somewhat disagree: 4
Strongly disagree: 5
I don't know: 9 S
Q15P
Zero emission vehicles contribute significantly to a reduction of greenhouse gas emissions and air pollutants compared to gas or diesel-powered vehicles
Strongly agree: 1
Somewhat agree: 2
Neither agree nor disagree: 3
Somewhat disagree: 4
Strongly disagree: 5
I don't know: 9 S
Q15Q
I am worried that charging a zero emission vehicle at home will significantly increase my monthly electricity bill
Strongly agree: 1
Somewhat agree: 2
Neither agree nor disagree: 3
Somewhat disagree: 4
Strongly disagree: 5
I don't know: 9 S
Q15R
There is an affordable zero emission vehicle available that meets the needs of my lifestyle
Strongly agree: 1
Somewhat agree: 2
Neither agree nor disagree: 3
Somewhat disagree: 4
Strongly disagree: 5
I don't know: 9 S
Q15S
Zero emissions vehicles perform poorly in cold weather
Strongly agree: 1
Somewhat agree: 2
Neither agree nor disagree: 3
Somewhat disagree: 4
Strongly disagree: 5
I don't know: 9 S
Q15T
Zero-emission vehicles don't have the same towing ability as conventional vehicles
Strongly agree: 1
Somewhat agree: 2
Neither agree nor disagree: 3
Somewhat disagree: 4
Strongly disagree: 5
I don't know: 9 S
Q16 [1,15]
If you were interested in finding out more about zero emissions vehicles, where would you go to get this information?
Please check as many as apply.
Zero emission vehicle manufacturers (car companies): 1
Vehicle dealerships/salespeople: 2
Consumer reports: 3
Automotive magazines: 4
The Canadian Automobile Association (CAA): 5
Government of Canada: 6
Provincial or Territorial government: 7
Municipal government: 8
Not-for-profit research and advocacy organizations: 9
Friends, family, neighbours, colleagues at work: 10
Internet search: 11
Online owner forums//groups: 12
Other (specify): 77 B
None of the above: 98 BX
Don't know: 99 BX
Q17
Which of the following statements is closest to your own point of view?
I would be willing to pay more for a zero emission vehicle than an equivalent conventional vehicle: 1
I would only buy a zero emission vehicle if the price were about the same as an equivalent conventional vehicle: 2
I would only buy a zero emission vehicle if the price were lower than an equivalent conventional vehicle: 3
I would never buy a zero emission vehicle: 4
Don't know: 9
PQ18
To what extent would each of the following factors make you more likely to consider purchasing or leasing a zero emission vehicle? To a great extent, to some extent, to little extent, to no extent whatsoever.
Q18A
Lower maintenance costs
A great extent: 1
Some extent: 2
Little extent: 3
No extent whatsoever: 4
Don't know: 9 S
Q18B
Greater selection of makes and models
A great extent: 1
Some extent: 2
Little extent: 3
No extent whatsoever: 4
Don't know: 9 S
Q18C
Greater general understanding of driving, charging and maintenance
A great extent: 1
Some extent: 2
Little extent: 3
No extent whatsoever: 4
Don't know: 9 S
Q18D
Improved winter-weather performance
A great extent: 1
Some extent: 2
Little extent: 3
No extent whatsoever: 4
Don't know: 9 S
Q18E
Better towing capacity
A great extent: 1
Some extent: 2
Little extent: 3
No extent whatsoever: 4
Don't know: 9 S
Q18F
10-year battery warranty
A great extent: 1
Some extent: 2
Little extent: 3
No extent whatsoever: 4
Don't know: 9 S
Q18G
Rebates/incentives to cover the price difference between zero emission vehicles and gas or diesel-powered vehicles
A great extent: 1
Some extent: 2
Little extent: 3
No extent whatsoever: 4
Don't know: 9 S
Q18H
Equal or greater driving range than a gas or diesel vehicle
A great extent: 1
Some extent: 2
Little extent: 3
No extent whatsoever: 4
Don't know: 9 S
Q18I
Having access to a charging station at home
A great extent: 1
Some extent: 2
Little extent: 3
No extent whatsoever: 4
Don't know: 9 S
Q18J
Convenient access to charging stations at my workplace
A great extent: 1
Some extent: 2
Little extent: 3
No extent whatsoever: 4
Don't know: 9 S
Q18K
Seeing more charging stations in public parking lots and shopping destinations
A great extent: 1
Some extent: 2
Little extent: 3
No extent whatsoever: 4
Don't know: 9 S
Q18L
Seeing more charging stations along highways
A great extent: 1
Some extent: 2
Little extent: 3
No extent whatsoever: 4
Don't know: 9 S
Q18M
Knowing I am doing my part to lower greenhouse gas emissions
A great extent: 1
Some extent: 2
Little extent: 3
No extent whatsoever: 4
Don't know: 9 S
Q18N
Knowing the vehicle possesses the latest technological advances
A great extent: 1
Some extent: 2
Little extent: 3
No extent whatsoever: 4
Don't know: 9 S
Q18O
Knowing the vehicles are as safe or safer than gas and diesel vehicles
A great extent: 1
Some extent: 2
Little extent: 3
No extent whatsoever: 4
Don't know: 9 S
Q18P
Ability to test drive the type of vehicle that fits my needs and lifestyle
A great extent: 1
Some extent: 2
Little extent: 3
No extent whatsoever: 4
Don't know: 9 S
Q18Q
Proven reliability in Canadian climates
A great extent: 1
Some extent: 2
Little extent: 3
No extent whatsoever: 4
Don't know: 9 S
Q18R [0,1]
Other, Please specify:
A great extent: 1
Some extent: 2
A Little extent: 3
No extent whatsoever: 4
Don't know: 9
Q19
Q18G, Rebates/incentives, rated little - great extent
If... Q18G = 1,2,3
Have you seen, read or heard about the Government of Canada's vehicle purchase rebates to encourage Canadians to buy zero emission vehicles?
Yes: 1
No: 2
Don't know: 9
Q20
Q19 = Yes
If... Q18G = 1,2,3 and Q19 = 1
Do you know how you can apply for these Government of Canada vehicle purchase rebates?
Yes: 1
No: 2
Don't know: 9
Q21
Do you support or oppose the Government of Canada providing incentives to encourage Canadians to buy zero emission vehicles?
Strongly support: 1
Somewhat support: 2
Neutral: 3
Somewhat oppose: 4
Strongly oppose: 5
Don't know: 9
QGENDR
These final few questions are for statistical purposes only. Your responses will be aggregated with those of other respondents to the survey and will help us to analyse different sub-groups of the population.
What is your gender?
Male: 1
Female: 2
Other: 77 X
Prefer not to answer: 99 X
QAGEX
In what year were you born?
Year: 77
Prefer not to answer: 99
QAGEY
If... QAGEX = 99
Which of the following age categories do you belong to?
18-34: 1
35-44: 2
45-54: 3
55-64: 4
65 or older: 5
Prefer not to answer: 9
QPROV
In which province or territory of the country do you reside?
Newfoundland: 1
Nova Scotia: 2
Prince Edward Island: 3
New Brunswick: 4
Quebec: 5
Ontario: 6
Manitoba: 7
Saskatchewan: 8
Alberta: 9
British Columbia: 10
Northwest Territories/Yukon/Nunavut: 11
Prefer not to answer: 99
QEDUC
What is the highest level of formal education that you have completed?
Less than a high school diploma or equivalent: 1
High School Diploma or equivalent: 2
Registered Apprenticeship or other trades certificate or diploma: 3
College, CEGEP, or other non-university certificate or diploma: 4
University certificate or diploma below bachelor's level: 5
Bachelor's degree: 6
Post graduate degree above the bachelor's level: 7
Prefer not to answer: 9
QINC
Which of the following best describes your total household income last year, from all sources for all household members, before taxes?
Under $20,000: 1
$20,000 to just under $40,000: 2
$40,000 to just under $60,000: 3
$60,000 to just under $80,000: 4
$80,000 to just under $100,000: 5
$100,000 to just under $150,000: 6
$150,000 and above: 7
Prefer not to answer: 9
QHOME
Which of the following best describes the type of dwelling in which you live?
Single, detached home: 1
Semi-detached: 2
Townhome or row home: 3
Apartment or condo: 4
Other (please specify): 77
Prefer not to answer: 99
QLANE
Do you have access to your own driveway or indoor parking at home?
Yes: 1
No: 2
Prefer not to answer: 9
QDISAB
Are you a person with a disability? A person with a disability is a person who has a long-term or recurring impairment (such as vision, hearing, mobility or mental health-related) which limits their daily activities inside or outside the home.
Yes: 1
No: 2
Prefer not to answer: 9
QPOSTCELL
May we have the first three digits of your postal code?
Please specify: 77
Prefer not to answer: 99
Thank You
This completes the survey. This survey was conducted on behalf of Natural Resources Canada. On behalf of the Government of Canada, we thank you for taking the time to share your feedback. It is much appreciated.