Supporting Accessibility,
Inclusivity, and Retention in Energy Efficiency Programs
FINAL REPORT
Prepared for Natural Resources Canada
Supplier: Leger Marketing Inc.
Contract Number: 23483-221011/001/CY
Contract Value: $ 199 998.14 (including HST)
Award Date: February 3, 2022
Delivery Date: April 1,
2022
Registration Number: POR 113-21
For more information on
this report, please contact Natural Resources Canada at rop-por@ nrcan-rncan.gc.ca
Ce
rapport est aussi disponible en français
This public
opinion research report presents the results of an online survey conducted by Léger
Marketing Inc. on behalf of Natural Resources
Canada. The quantitative research study was conducted
with 2,919 Canadians who are homeowners residing in different regions of Canada
between February 18 and March 31, 2022.
Cette publication
est aussi disponible en français sous le titre Soutenir l'accessibilité, l'inclusivité et la rétention dans les
programmes d'efficacité énergétique.
This publication
may be reproduced for non-commercial purposes only. Prior written permission
must be obtained from Natural Resources Canada. For more information on this
report, please contact: rop-por@ nrcan-rncan.gc.ca
Department of Natural Resources
DG S Office 15th Floor
580 Booth St.
Ottawa, Ontario
K1A0E5
Catalogue Number:
M4-226/2022E-PDF
International Standard Book Number (ISBN):
978-0-660-45274-6
Related publications (registration number: ROP 113-21):
·
M4-226/2022F-PDF
·
978-0-660-45275-3
© Her Majesty the
Queen in Right of Canada, as represented by the Prime Minister of Canada, 2022.
Table of contents
1.0 EXECUTIVE SUMMARY. 5
1.1 Background and
Objectives. 5
1.2 Methodology. 7
1.3 Overview of the
Findings. 9
1.4 Notes on
Interpretation of the Research Findings. 10
1.5 Political
Neutrality Statement and Contact Information. 11
2.0 DETAILED RESULTS. 12
2.1 Demographic
Profile of the Respondents. 12
2.2 Characteristics
of Respondents’ Homes. 15
2.2.1 Type of
Home. 15
2.2.2
Indigenous Primary Residences. 16
2.2.3
Residence Square Footage. 17
2.2.4
Construction Year of the Primary Residence. 17
2.2.5 Last
Energy Efficiency Improvement 19
2.3
Energy Efficiency. 19
2.3.1
Percentage of Income Dedicated to Paying Monthly Bills. 20
2.3.2 Monthly
Amount Paid for Home Energy Bills. 21
2.3.3
Financial Burden of Home Energy Costs. 22
2.3.4
Priority to Improve Home Energy Efficiency. 23
2.3.5 Reasons
for Improvements Being a Priority. 24
2.3.6 Reasons
for Improvements NOT Being a Priority. 26
2.3.7
Disposable Income for a Home Improvement Project 27
2.3.8 Planned
Energy Efficiency Improvements. 28
2.3.9
Estimated Costs of Energy Efficiency Improvements. 30
2.3.10 Planned Sources to be Used to Minimize the
Financial Burden of Home Energy Improvement Projects. 32
2.4
Awareness of Energy Efficiency Programs. 33
2.4.1
Awareness of Government Resources and Support Programs for Energy Efficiency. 33
2.4.2
Familiarity with the Canada Greener Homes Grant 34
2.4.3
Application to the Canada Greener Homes Grant Among Eligible Homeowners. 36
2.4.4 Reasons
not to Apply to the Canada Greener Homes Grant 37
2.4.5
Awareness of Provincial Programs and Support for Energy Efficiency. 37
2.4.6
Awareness of Regional/Municipal Programs and Support for Energy Efficiency. 39
2.5 Trust in
Government 40
2.5.1 Trust in
Resources and/or Support Programs From All Levels of Government 40
2.6 Reasons and
Barriers for Home Energy Efficiency Improvements. 42
2.6.1 Reasons
for Making Home Energy Efficiency Improvements. 42
2.6.2 Reasons
or Barriers for not Prioritizing Home Energy Efficiency Improvements. 44
2.6.3
On-Reserve Limitations to Accessing Home Energy Efficiency Improvements. 46
2.6.4 Fair
Access to Government Grants for Visible Minority Communities. 46
2.6.5
Priorities When Choosing to Make Home Improvements. 47
2.6.7
Incentives for Less Home Energy Usage. 48
2.7 Psychographic
Profile of Respondents. 49
2.8. Energy Source. 51
2.8.1 Main
Energy Source for Home Heating. 51
2.8.2
Possession of Energy-related Items. 52
2.8.3
Likeliness of Owning Energy-related Items in the Near-future. 52
2.9
Canada Greener Homes Grant (CGHG) 53
2.9.1
Audiences for Consideration for the CGHG.. 53
2.9.2 The
Audience for Consideration’s Attitude Towards Energy Efficiency Improvements. 57
2.10 Conclusion. 58
APPENDIX. 60
A.1 Quantitative
Methodology. 60
A.1.1
Sampling Procedure. 60
A.1.2 Data
Collection. 61
A.1.3 Answer
Rate. 61
A.1.4
Unweighted and Weighted Samples. 62
A.2 Survey
Questionnaire. 67
Leger is pleased
to present Natural Resources Canada with this report on findings from a
quantitative survey designed to learn about Canadians who are homeowners residing
in different regions. This report was prepared by Léger Marketing Inc. who was
contracted by Natural Resources Canada (contract number 23483-221011/001/CY awarded
February 3, 2022). This contract has a value of $176,989.50 (excluding HST).
Natural
Resources Canada (NRCan) has a mandate through the Energy Efficiency Act
to promote energy efficiency, to make and enforce regulations that prescribe
standards and labelling requirements for energy-using products and products
that affect energy use, and to collect data on energy use.
The Canada
Greener Homes Grant (CGHG) program was launched in May 2021 to support
homeowners in making energy efficiency, resiliency, and solar retrofits for
their homes while creating green jobs in the sector to advance economic
recovery. The program was immediately met with a high level of interest from
homeowners who quickly registered for the program.
To ensure that
the CGHG program is able to effectively reach homeowners with the greatest need
for support to complete home energy retrofits, and is inclusive of all
demographic groups, it is important that NRCan has comprehensive data on: who
homeowners are, where they live, characteristics of their households and homes,
and their attitudes and behaviours towards energy efficiency and conservation. Previously,
such data was fragmented along multiple datasets, many of which are outdated or
lacking demographic characteristics.
Acquiring
comprehensive data through a survey provides an evidence base for NRCan to
inform innovative solutions that support the effectiveness, efficiency,
accessibility, and inclusivity for the CGHG program and other energy
efficiency/conservation programs. It also informs subsequent departmental
programs and policies to address barriers to home energy
efficiency/conservation and increase awareness of energy-efficient products and
practices.
In this context, Leger Marketing Inc. was
commissioned by NRCan to gather quantitative data on
the demographic characteristics of homeowners, households, and homes in Canada,
and the awareness, attitudes, and behaviours of homeowners related to energy
efficiency, conservation, and supportive federal programming.
More specifically the research gathers and analyzes data on:
●
Demographic characteristics of individual
homeowners, e.g., region, age, gender, Indigenous (First Nations, Inuit,
Métis), visible minority, LGBTQ2+, newcomer, language profiles, persons living
with a disability;
●
Household characteristics (e.g., number of
members, ages, children, household income);
●
Home ownership (e.g., owning with a mortgage,
owning without a mortgage);
●
Characteristics of the home (e.g., home type,
age, size, heat source, need for repairs, completion of EnerGuide assessments,
completion of retrofits for energy efficiency);
●
Awareness of energy efficiency programs in
Canada, including the CGHG program; and
●
Attitudes and behaviours in relation to energy
efficiency/conservation, their relationship to climate
change and related federal programs.
Overall, this research provides insights on the needs for, and
barriers to, accessing programs to enhance home energy efficiency. It also
provides behavioural insights on how homeowners make decisions in relation to
energy efficiency/conservation, which informs NRCan program development and
implementation in this area.
The quantitative research consisted
of telephone interviews, which were conducted using a computer-assisted
telephone interviewing system (CATI technology).
To obtain reliable data for each
of the subgroups, we surveyed a total sample of 2,919 Canadian adults in all
regions of the country. Only one adult respondent was interviewed per
household. The national margin of error for this survey is +/- 1.8%, 19 times
out of 20.
Sample
Distribution
The sample frame
has been designed using a regional stratification scheme designed to accurately
reflect the geographic distribution of Canada’s population, including the North
(Yukon, Northwest Territories, and Nunavut). The following table describes the regional
quotas and the effective sample distribution achieved during the data
collection.
Table 1. Sample
Regional Distribution
|
Region
|
Quotas
|
Effective
Sample Size (n=)
|
Maximum Margin
of Error
|
|
Atlantic Canada
|
190
|
217
|
6.7%
|
|
Quebec
|
600
|
617
|
3.9%
|
|
Ontario
|
1,050
|
1,104
|
2.9%
|
|
Prairies (MB, SK)
|
160
|
195
|
7.0%
|
|
Alberta
|
320
|
361
|
5.2%
|
|
British Columbia
|
350
|
392
|
5.0%
|
|
Yukon, Northwest Territories and Nunavut
|
30
|
33
|
17.1%
|
|
Total
|
2,700
|
2,919
|
1.8%
|
The main target population in this
study was Canadian adults aged 18 and older who are homeowners. To meet the
objectives of this research, the sample also had to include sufficient
representation from the following key target groups:
· Indigenous
peoples (First Nations, Inuit, Métis);
· Those who identify as a visible minority;
· Newcomers to Canada (last 10 years was suggested as the cut-off
period);
· Persons living with a disability or in a household with someone who is
living with a disability; and
· Persons who identify as belonging to the LGBTQ2+ community.
Quotas Structure
As per the specific target groups
which need to be sufficiently represented to offer statistically valid results,
Leger proposed a structure with minimum quotas for each specific target.
The following table describes the
minimum quotas and the effective sample distribution achieved during the data
collection for each of those specific targets.
Table 2. Sample Size for Specific
Target Groups
|
Target Group (minimum quota)
|
Minimum Quotas
|
Effective
Sample Size (n=)
|
Maximum Margin
of Error
|
|
Indigenous
peoples
|
100
|
116
|
±9.1%
|
|
Those who
identify as a visible minority
|
220
|
323
|
±5.5%
|
|
Newcomers to
Canada
|
100
|
123
|
±8.8%
|
|
Persons
living with a disability
|
220
|
243
|
±6.3%
|
|
Persons who
identify as belonging to the LGBTQ2+ community
|
100
|
113
|
±9.2%
|
|
Total
|
740
|
918
|
±1.9%
|
Data collection for this survey
took place between February 18 and March 31, 2022. The national response rate
for the survey was 5.2%. The details of the calculation of the response rate
and the comprehensive distribution of calls are presented in Appendix A. A
pre-test of 39 interviews, in both official languages, was conducted between February
18 and 23, 2022. More specifically, 20 interviews were conducted in French and
19 in English. Some minor changes were made to the questionnaire following the
pre-test, including minor rephrasing of some of the questions and the addition
of examples to be provided to the interviewers, as provided by Natural
Resources Canada representatives. Data collection began as planned. The
pre-test responses were included in the overall results. The interviews lasted
an average of 23 minutes. The interviews were recorded to assess the level of
understanding of each issue in the population.
A proportion of
the interviews were conducted with a sample of cell phone numbers (cell phone-only
household members), in order to provide an adequate and reliable sample of the
youth cohort (18 to 34). In order to optimize the number of young Canadians who
participate in the survey, 40% of telephone numbers in the sample frame came
from lists of cell phones-only households in Canada, as supplied by Survey
Sampler ASDE. While the cell phone sample did not exclusively target the youth
cohort, this age group was over-indexed in that target sample. The other
interviews were conducted with landline users.
According to 2016 national census data from Statistics Canada, Leger
weighted the results of this survey by age, gender, region, and education
level. Results were also weighted by specific profile: Indigenous, immigrants,
newcomers, visible minorities and LGBTQ2+ in order to give back the real weight
of the respondents with this profile and prevent them from unbalancing the
whole sample due to the fact that they had been voluntarily overrepresented in
the sampling frame.
Leger meets the strictest
quantitative research guidelines. The questionnaire was prepared in accordance
with the Standards for the Conduct of Government of Canada Public Opinion
Research—Series D—Quantitative Research. Details on the methodology, Leger’s
quality control mechanisms, the questionnaire, and the weighting procedures are provided in
the appendix.
Last Improvement of Energy Efficiency
·
Just under half of Canadian homeowners (46%)
indicated that the last time that they upgraded their primary residence to make
it more energy efficient was less than 5 years ago.
·
Fewer than one out of five Canadian homeowners
(16%) indicated that their home was never renovated to improve energy
efficiency.
·
There are no major statistically significant
differences on this question for gender, age, region and language spoken at
home.
·
Homeowners who immigrated to Canada are more
likely than other homeowners to have indicated that their primary residence has
never been improved for energy efficiency (22%).
Energy Efficiency
·
More than half of the respondents (54%) reported
that they spend more than $200 per month.
·
Homeowners in Alberta (82%), the Atlantic
Provinces (66%), and the territories (84%) are more likely than other
homeowners to report paying more than $200 per month for their primary
residence's energy bills.
·
Homeowners whose primary residence is in a rural
area are more likely than homeowners living in urban areas to report paying
more than $200 per month for their energy bill (66%).
Financial Burden
of Energy Costs
·
Just over one in five Canadian homeowners (21%)
indicated that the energy costs of their primary residence are a significant
financial burden to them.
·
Homeowners with an annual household income of
less than $60,000 are more likely than other homeowners to consider their
home's energy costs to be a financial burden (30%).
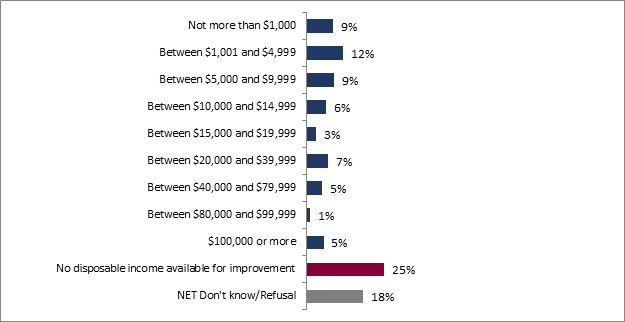
Disposable
Income for a Home Improvement Project
·
Homeowners whose home is in Quebec are
significantly more likely than others to have indicated that they do not have
any disposable income to make improvements to their primary residence.
·
Homeowners who identified as Indigenous (18%)
and those with a disability (15%) were statistically more likely than other
homeowners to have reported having less than $1,000 available to make home
improvements.
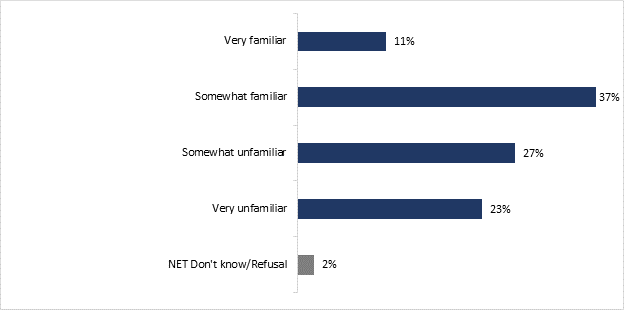
Familiarity
with the Canada Greener Homes Grant (CGHG)
·
Homeowners whose language most frequently used
at home is French are statistically more likely to have indicated that they are
not familiar with the Canada Greener Homes Grant (72%) than are other
homeowners. This is also the case for homeowners whose residence is located in
Quebec (75%).
·
Homeowners who reported having a disability are
also significantly more likely to have said they are unfamiliar with Canada
Greener Homes Grant (70%) than other homeowners.
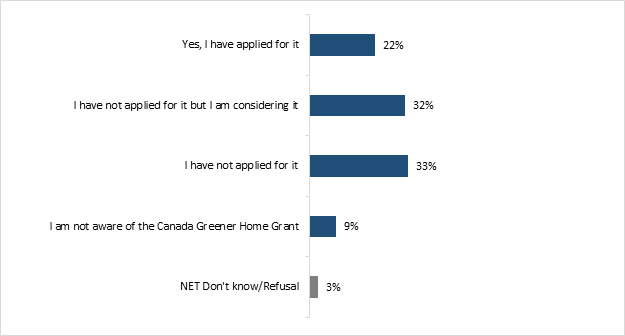
Reasons Not
to Apply to the Canada Greener Homes Grant
·
A few reasons were given by these homeowners for
not applying to the CGHG. They have indicated that the process is too
complicated (28%), that home improvements are too expensive and out of their
budget (12%), that they are not eligible or don’t qualify (8%) or that they do
not trust the program (5%).
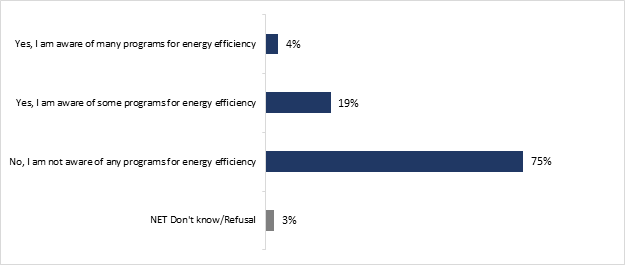
Awareness
of Regional/Municipal Programs and Support for Energy Efficiency
·
Three quarters (75%) of homeowners who consider
their home energy costs to be a burden, as well as those for whom energy costs
are not a burden, were not aware of any energy efficiency programs in their
region or municipality.
Reasons
for Making Home Energy Efficiency Improvements
·
The first reason cited by respondents was the
desire to save money or reduce energy costs (88%) for those whose energy costs
are a burden versus 74% for those whose energy costs are not a burden.
Reasons
for Not Prioritizing Home Energy Efficiency Improvements
·
The cost of improvements was the main reason
cited by homeowners whose energy costs are a burden (61%) compared to 23% for
the others.
Likeliness
of Owning Energy-related Items in the Near-future
·
Half of the homeowners (55%) who responded to
the survey indicated that they do not plan to purchase any energy efficient
items or to improve the energy footprint of their home. Slightly less than half
(44%) of them indicated having made home energy improvements in the last 5
years, while almost one fifth of them stated that no renovation was ever made
to improve their home’s energy efficiency.
The opinions and
observations expressed in this document do not reflect those of Natural
Resources Canada. This report was compiled by Leger based on research conducted
specifically for this project. This research is probabilistic; the results can
be applied to the general population of Canada. The research was designed with
this objective in mind.
Leger certifies
that the final deliverables fully comply with the Government of Canada’s
political neutrality requirements outlined in the Policy on Communications and
Federal Identity and the Directive on the Management of Communications.
Specifically,
the deliverables do not include information on electoral voting intentions,
political party preferences, standing with the electorate, or ratings of the
performance of a political party or its leaders.
Signed by:

Christian Bourque
Executive Vice President and Associate
Leger
507 Place d’Armes, Suite 700
Montréal, Quebec
H2Y 2W8
cbourque@leger360.com
Table 3 details the composition of the sample collected
for the research project. Half of the sample (50%) identifies as female while
approximately half identifies as male (49%). Two thirds of the survey
respondents (67%) are 45 years of age or older, the other third of respondents
are 44 years of age or younger (33%). Approximately one third of respondents
(31%) have a university-level education, another third (33%) have a college or
CEGEP-level education, and the remaining respondents (35%) have less than a
college or CEGEP-level education. The regional distribution of respondents in
Canada follows the distribution of the Canadian population.
Table 3. Demographic Profile of the Respondents
|
Gender
|
|
|
Female
|
50%
|
|
Male
|
49%
|
|
|
|
|
Age
|
|
|
18-24
|
3%
|
|
25-34
|
12%
|
|
35-44
|
17%
|
|
45-54
|
21%
|
|
55-64
|
22%
|
|
65+
|
25%
|
|
|
|
|
Education
|
|
|
High School or less
|
28%
|
|
Coll.
|
40%
|
|
Uni.
|
31%
|
|
|
|
|
Region of Residence
|
|
|
British Columbia
|
13%
|
|
Alberta
|
12%
|
|
Saskatchewan
|
3%
|
|
Manitoba
|
4%
|
|
Ontario
|
38%
|
|
Quebec
|
22%
|
|
New Brunswick
|
1%
|
|
Nova Scotia
|
2%
|
|
Newfoundland and Labrador
|
3%
|
|
Prince Edward Island
|
1%
|
|
Yukon
|
1%
|
|
|
|
|
Urban or Rural Area
|
|
|
Urban
|
75%
|
|
Rural
|
22%
|
|
Langage Spoken at Home
|
|
|
English
|
79%
|
|
French
|
22%
|
|
Other
|
9%
|
|
|
|
|
Income
|
|
|
<$60k
|
26%
|
|
$60K-$149k
|
42%
|
|
$150k+
|
17%
|
Table 4 shows the immigration status of survey
respondents. Nearly eight out of ten respondents (79%) were born in Canada, and
one out of five (21%) were born outside the country.
Table 4. Immigration Status
|
Born in Canada
|
79%
|
|
Born outside Canada
|
21%
|
Among respondents born outside of Canada, the vast
majority (82%) arrived to Canada at least ten years ago, before 2012. Of the
remaining respondents who were born outside of Canada, 15% arrived within the
last ten years, and 2% chose not to answer this question (Table 5).
Table 5. Years of Arrival in Canada
|
Before 2012
|
82%
|
|
2012-2022
|
15%
|
|
Prefer not to answer
|
2%
|
The composition of the sample by minority status is
presented in Table 6. Seven out of ten respondents (71%) do not belong to a
minority group. Among the respondents living in a minority situation, 18% claim
to belong to a visible minority, 7% claim to have a disability or limitation of
some kind, 4% identify as Indigenous (First Nations, Inuk (Inuit) or Metis) and
2% identify as part of the LGBTQ2+ community. A small proportion of respondents
(1%) chose not to answer this question.
Table 6. Minority Profile
|
A member of the LGBTQ2+
community
|
2%
|
|
A person with a disability
|
7%
|
|
A member of a visible minority group
|
18%
|
|
An Indigenous person (First Nations, Inuk (Inuit) or
Métis)
|
4%
|
|
None of the above
|
71%
|
|
Prefer not to answer
|
1%
|
Of the respondents who identified as Indigenous, most identified as
First Nations (55%) or Métis (40%). Few Indigenous respondents in the sample
identified themselves as Inuk (1%), while some (4%) preferred not to answer
this question.
Table 7. Indigenous Profile
|
First Nations
|
55%
|
|
Inuk
|
1%
|
|
Metis
|
40%
|
|
Prefer not to answer
|
4%
|
Table 8 indicates the place of residence of these
respondents on or off reserve. The vast majority (86%) indicated that they
lived off reserve while just over one in ten (13%) indicated the opposite. A
small proportion of respondents (1%) chose not to answer this question.
Table 8. Living on Reserve
|
Live on reserve
|
13%
|
|
Live off reserve
|
86%
|
|
Prefer not to answer
|
1%
|
Table 9 details the household composition of homeowners in Canada.
Homeowners' households are mainly composed of more than one person. Only 19% of
homeowners reported living alone. A slight majority of 52% reported having
children under the age of 18 living with them. Just over half (56%) reported
that they have a mortgage that they are still paying, and over one third
reported that they have finished paying (35%) their mortgage. Finally, the
majority (63%) said they were in the employed population.
Table 9. Composition of the Household
|
Household Size
|
|
|
1
|
19%
|
|
2
|
34%
|
|
3
|
17%
|
|
4+
|
29%
|
|
|
|
|
Children in the Household
|
|
|
Yes
|
52%
|
|
No
|
47%
|
|
|
|
|
Mortgage
|
|
|
Have a mortgage
|
56%
|
|
Mortgage paid
|
35%
|
|
Under a land lease agreement
|
3%
|
|
|
|
|
Employment
|
|
|
Employed
|
63%
|
|
Unemployed
|
7%
|
|
Retired
|
28%
|
The majority of Canadian homeowners live in a single or semi-detached
home (79%) as their primary residence. Other types of primary residences are
much less common. Less than 10% of homeowners live in townhouses (6%), low-rise
multi-unit residential buildings (three stories or less with a footprint of 600
m2 or less) (4%), row houses (3%), mobile homes on a permanent foundation (2%),
condos (2%), mixed-use buildings (residential portion only) (1%), or other
types of residence (2%).
Figure 1: Type of home
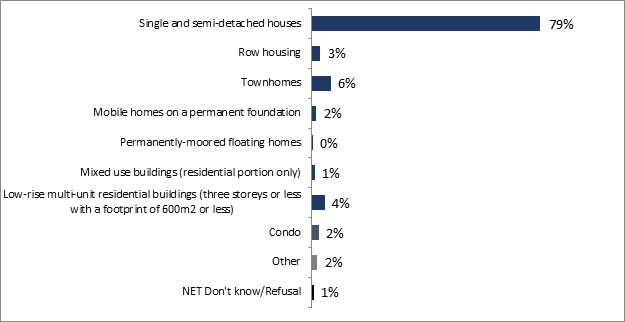
Q11: What type of home (primary residence) do you currently live in?
Base: All respondents (n=2,919)
Notable subgroup differences regarding respondents’ type of home
include the following:
·
There were no significant differences between
men and women in the type of residence they own.
·
Younger homeowners between 18 and 34 were more
likely than other homeowners to live in a townhouse (19%) or apartment building
(10%). Homeowners 55 and older were more likely to live in a single-family home
(84%).
·
Homeowners living in rural areas were more
likely to live in single-family homes (91%) and mobile homes (3%), while
homeowners in urban areas were more likely to live in townhouses (11%) and
apartment buildings (7%).
·
Homeowners who identified themselves as visible
minorities were more likely to live in row houses (17%) while homeowners who
did not identify as visible minorities were more likely to live in single
family homes (82%).
·
Immigrant homeowners were more likely to live in
townhouses (13%), while non-immigrant homeowners were more likely to live in
single-family homes (81%) or in mobile homes (2%). Newcomers, on the other
hand, were more likely to live in a building (20%).
Fewer than one out of ten (5%) Indigenous respondents
report that their home is part of an Indigenous government or organization
(such as a band council or land claim organization) and fewer than one out of
ten (7%) report that their primary residence is part of a housing management
organization that owns housing occupied by Indigenous families.
Figure 2: Indigenous
primary residences
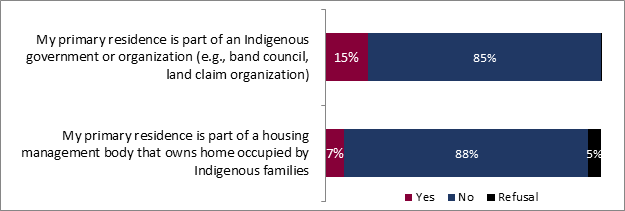
Q12: Do any of the following situations apply to you or your
principal residence? Base: Respondents who identify as Indigenous people
(n=116)
About one in ten homeowners (12%)
were unable to state the size of the living area of their principal residence
(in square feet or square meters). About one quarter of homeowners (27%)
reported having 2,001 square feet or more of living space, another quarter
(26%) between 1,401 and 2,000 square feet, and the remaining 35% reported
having less than 1,400 square feet.
Figure 3: Living space square footage
of the residence
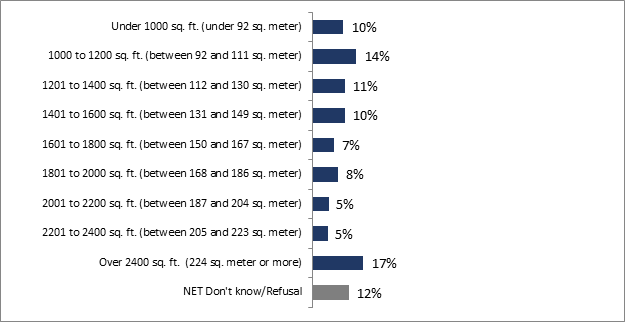
Q14: What is the living space in square footage of your home? Base:
All respondents (n=2,919)
About one in ten (12%) Canadian
homeowners reported that their primary residence was built between 2011 or
later. More than one third of homeowners (38%) said their primary residence was
built between 1984 and 2010 and about the same proportion (40%) said their
primary residence was built between 1946 and 1983. Less than one in ten
homeowners (9%) indicated that their primary residence was built before 1946.
Figure 4:
Construction year of the primary residence
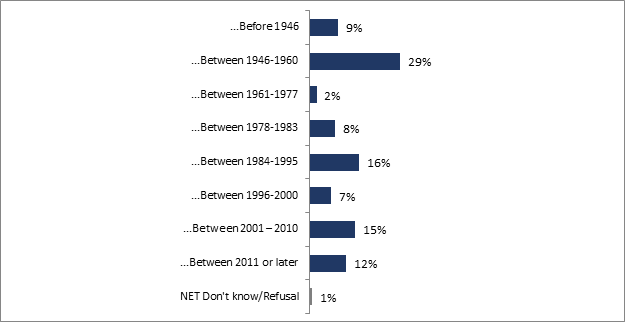
Q13.1: In what year was your residence
built? Base: All respondents + Q13.2: Even if you do not know the exact year, would you say your
primary residence was built?
(n=2,919)
Notable subgroup differences regarding
respondents’ construction year of their primary residence include the
following:
· Homeowners of 18 to 34 years old are more likely than other
respondents to have mentioned that their residence was built in the last 10
years (24%). Likewise, homeowners in Alberta are more likely to have answered
that their primary residence was built in the last 10 years (20%).
· Homeowners 55 and older are more likely than other homeowners to
have indicated that their home was built between 1946 and 1960 (34%).
· The homeowners residing in the Atlantic provinces are more likely
than others to have answered that the construction of their main residence
occurred before 1946.
· Homeowners with a household income of less than $60,000 annually are
statistically more likely to have indicated that their home was built between
1946 and 1960 (37%). Those with a household income of more than $150,000
annually are more likely to live in a home that was built between 2001 and 2010
(22%) or within the past 10 years (18%).
· Homeowners who identify as visible minorities are more likely than
non-minorities to have mentioned that their home was built between 2001 and
2010 (23%). Homeowners who immigrated to Canada are more likely to have
indicated that their home was built between 2001 and 2010 (21%), and newcomers
are more likely to have indicated that their primary residence was built within
the past 10 years (30%).
Just under half of Canadian homeowners (46%) indicated
that the last time that they upgraded their primary residence to make it more
energy efficient was less than 5 years ago. One quarter (24%) said that the
last energy efficiency improvements were made 6 to 15 years ago. Fewer (22%)
said that the last energy efficiency retrofit was done more than 15 years ago
on their primary residence. A few homeowners (7%) were unable to answer or
refused to answer this question.
Figure 5: Last
energy efficiency improvement
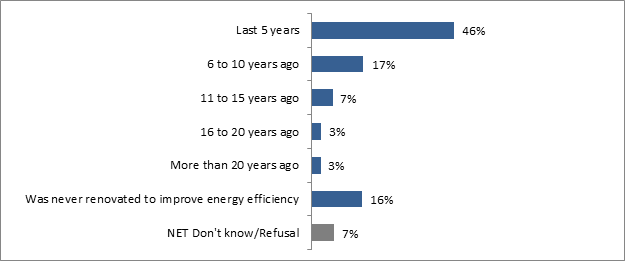
Q15: Based on what you know, when was the last time that a home
improvement was made to make your home more energy efficient? Base: All respondents (n=2,919)
Notable subgroup differences regarding
respondents last known renovations to improve their residence’s energy
efficiency include the following:
· There are no major statistically significant differences on this question
for gender, age, region and language spoken at home.
· Homeowners with a household income higher than $150,000 per year are
more likely to have made energy efficiency improvements to their home in the
past 5 years (54%).
· Homeowners who identify as Indigenous are statistically more likely
to have made energy efficiency improvements to their home in the past 5 years
(58%).
· Homeowners who immigrated to Canada are more likely than other
homeowners to have indicated that their primary residence has never been
improved for energy efficiency (22%).
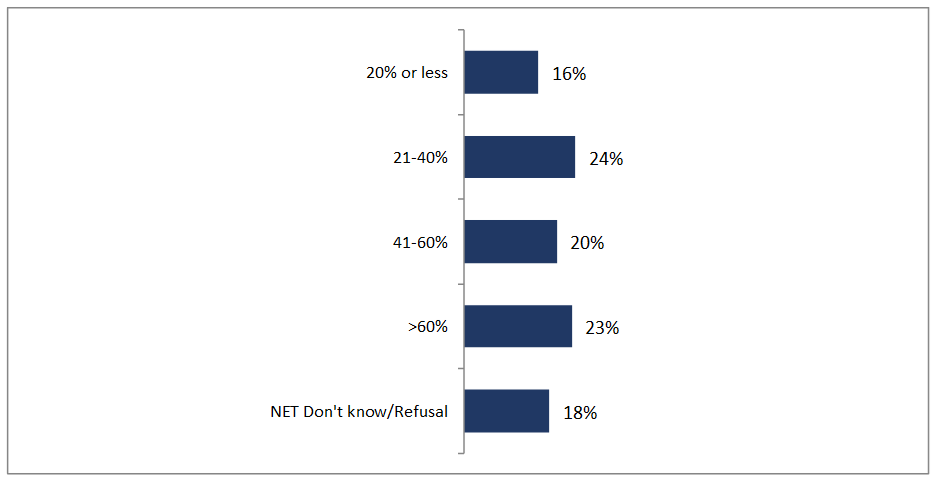
Just under one quarter of Canadian homeowners reported
that their monthly expenses (including all bills, mortgage, debt payments and
loans) exceeded 60% of their monthly household income. One out of five
homeowners (20%) estimated this expense to be between 41% and 60% of their
household income. One quarter (24%) estimated this expense at between 21% and
40%, while 16% of respondents estimated this expense at less than 20% of their
household income. Nearly one out of five respondents (18%) did not answer,
either because they were not able to make this assessment or did not want to
answer the question.
Figure 6: Percentage of income dedicated to paying monthly
bills
Q8: Based on your best guess, what
percentage (%) of your total monthly household income is dedicated to paying
your monthly bills, including your mortgage and any other loans or debt payments?
Base: All respondents (n=2,919)
Notable subgroup differences regarding respondents’ percentage
of income dedicated to paying monthly bills include the following:
· Homeowners 18 to 34 years of age are statistically more likely to
have reported that the percentage of their monthly income dedicated to paying
bills is between 41% and 60% (26%) or more than 60% (30%).
· Homeowners who reside in the Atlantic provinces are among the
Canadian homeowners with the highest percentage of monthly income dedicated to
paying bills. They are statistically more likely to have indicated that 41% to
60% of their monthly income is spent on bills (30%).
· Homeowners with household incomes over $150,000 per year spend the
least percentage of their monthly income on bills. They are more likely than
other homeowners to have indicated that they spend between 21% and 40% of their
monthly income on bills (33%) or 20% or less (22%).
· Homeowners who belong to the LGBTQ2+ community are more likely than
other homeowners to spend between 41% and 60% of their monthly income on paying
bills.
· Homeowners who are newcomers are statistically less likely to
dedicate 20% or less of their monthly income to paying bills (8%).
With respect to monthly energy expenses (electricity,
gas, etc.), a very small number of Canadian homeowners (2%) reported having
energy costs of $50 or less per month. One in ten homeowners (10%) indicated
that their monthly energy costs for their primary residence were between $51
and $100, while one third of respondents (32%) estimated their monthly energy
costs to be between $100 and $200. More than half of the respondents (54%)
reported that they spend more than $200 per month on their home's energy needs.
A small proportion of respondents (2%) did not answer this question.
Figure 7: Monthly amount paid for home
energy bills
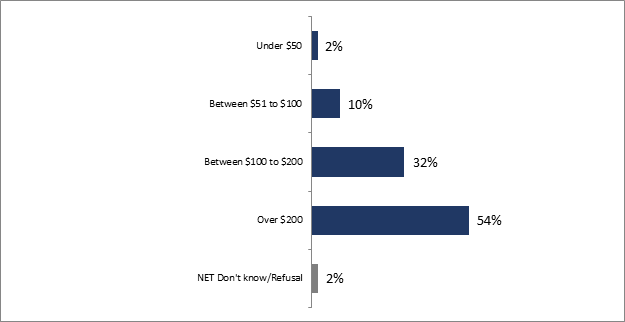
Q9: Based on your best guess, what is the
amount you pay each month for your home energy bills (electricity, gas, etc.)?
Is it…? Base: All respondents (n=2,919)
Notable subgroup differences regarding respondents’ monthly amount
paid for energy bills include the following:
· Homeowners in Alberta (82%), the Atlantic Provinces (66%), and the
territories (84%) are more likely than other homeowners to report paying more
than $200 per month for their primary residence's energy bills. Homeowners in
Quebec are more likely than others to report paying between $100 and $200 (41%)
or between $51 and $100 (16%) per month for their energy bills.
· Homeowners whose primary residence is in a rural area are more
likely than homeowners living in urban areas to report paying more than $200
per month for their energy bill (66%).
· Homeowners with an annual household income of more than $150,000 are
more likely to pay more than $200 per month for their energy bill (67%).
· Homeowners who are newcomers are more likely than other homeowners
to pay between $51 and $100 per month for their energy bills (21%). However,
they are less likely to pay more than $200 per month for energy bills (30%).
· Homeowners who identify themselves as LGBTQ2+ are more likely than
non-LGBTQ2+ homeowners to report paying less than $50 per month for their
energy bills (9%). However, they are less likely to pay more than $200 per
month (34%).
Just over one in five Canadian homeowners (21%)
indicated that the energy costs of their primary residence are a significant
financial burden to them. About one quarter (26%) of homeowners do not consider
these costs to be a financial burden. The remaining 51% of Canadian homeowners
said that the energy costs of their primary residence are manageable for their
household.
Figure 8: Financial
burden of home energy costs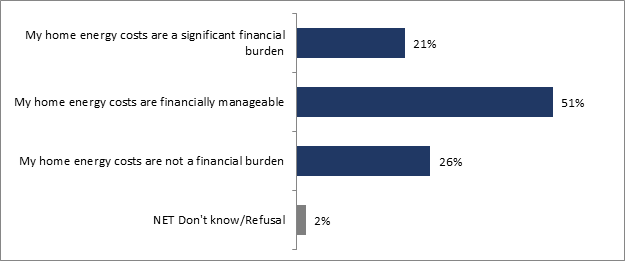
Q16: Which best describe your home energy costs (electricity, gas,
etc.):
Base: All respondents (n=2,919)
Notable differences among the subgroups regarding
their perception that their home energy costs are a financial burden are as
follows:
·
Homeowners 35 to 54 years of age are
statistically more likely to have answered that their primary residence's
energy costs are a significant financial burden (26%). In contrast, homeowners
55 and older are statistically more likely to have said that home energy costs
are not a financial burden (31%).
·
Homeowners living in Alberta are significantly
more likely than other homeowners to have indicated that their home's energy
costs are a significant financial burden (42%), while homeowners living in
Quebec are significantly more likely to have answered that energy costs are not
a financial burden to their household (31%).
·
Homeowners with an annual household income of
less than $60,000 are more likely than other homeowners to consider their
home's energy costs a financial burden (30%) while those with an annual
household income of more than $150,000 are more likely than other homeowners
not to have considered their home's energy costs a burden (37%).
·
Homeowners who define themselves as newcomers
and homeowners with disabilities are statistically more likely to have
identified home energy costs as a significant financial burden (31%).
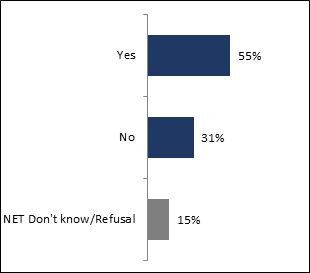
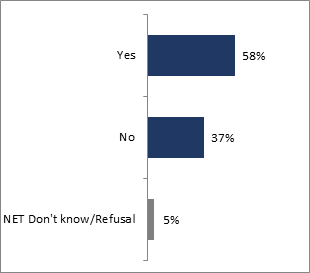
Among Canadian homeowners whose home energy costs are a
financial burden, more than half (55%) consider it a significant enough burden
that they would make upgrading their home a priority to reduce energy bills and
avoid energy and heat loss. This proportion (58%) is similar among homeowners
for whom the energy cost of their home is not a financial burden.
Figure 9A-B: Priority
to upgrade home energy efficiency
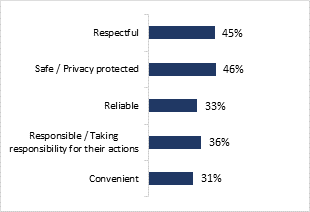
Notable subgroup
differences regarding respondents’ opinion of programs and resources:
Significant
differences only among those who do not consider energy costs to be a burden.
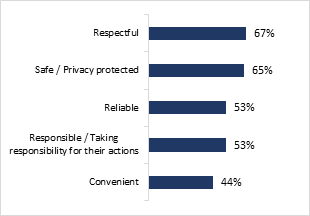
In general,
Quebec homeowners and newcomers were the most positive about the programs and
resources offered by all levels of government.
Convenient
·
Quebec homeowners are more likely than other
homeowners to have considered the programs to be convenient (56%).
·
Newcomers are also more likely to have indicated
that the programs and resources offered by all levels of government are
convenient (68%).
Reliable
·
Quebec homeowners are more likely than other
homeowners to have considered government programs and resources to be reliable
(68%).
·
Newcomers are also more likely to have indicated
that the programs and resources offered by all levels of government were
convenient (84%), as are homeowners who identify themselves as visible minorities
(65%).
Responsible
·
Homeowners whose residence is located in Quebec
are more likely than other homeowners to have found the programs and resources
proposed by all levels of government to be responsible (68%).
Respectful
·
Homeowners with a residence in Quebec are more
likely than other homeowners to have considered the programs and resources
offered by all levels of government to be respectful (78%).
·
Newcomers are also more likely to have indicated
that they found the programs and resources proposed by all levels of government
to be respectful (82%). However, people with disabilities are under-represented
among those who consider them respectful (50%).
Safe
·
Quebec homeowners are more likely than other
homeowners to have considered government programs and resources to be safe
(72%).
·
Newcomers are also more likely to have indicated
that they consider government programs and resources to be safe (83%).
2.6.1 Reasons
for Making Home Energy Efficiency Improvements
The top five reasons for making a home energy efficient
are the same whether the homeowner considers energy costs a burden or not. The
first reason cited by respondents was the desire to save money or reduce energy
costs (88%) for those whose energy costs are a burden versus 74% for the others.
The second reason is related to the desire to help the environment and reduce
one's energy footprint (27%) for those whose energy costs are a burden versus
39% for the others. The desire to make one's home more comfortable, without
drafts and to have a more uniform temperature inside, (24%) for those whose
energy costs are a burden versus 39% for the others. Increasing the value of
the home (14%) and replacing old materials (13%) for those whose energy costs
are a burden versus 14% and 12% respectively for others were the other mentions
that closed the top five.
Table 21: Reasons for making home more energy efficient
|
Home energy costs
are a financial burden
|
Home energy costs
are NOT a financial burden
|
|
I have no specific reason to do it
|
2%
|
2%
|
|
Helping the environment - reducing
environmental footprint
|
27%
|
39%
|
|
Saving money - reducing operating costs/energy
costs
|
88%
|
74%
|
|
Increase property value
|
14%
|
14%
|
|
It aligns with my values
|
7%
|
9%
|
|
Replacing or updating old equipment
|
13%
|
12%
|
|
Aesthetic improvements toward energy efficient
updates
|
7%
|
7%
|
|
Emergency replacement
|
3%
|
2%
|
|
Taking advantage of government incentives
|
9%
|
7%
|
|
Increasing resiliency against environmental
factors (storms, floods, etc.)
|
7%
|
7%
|
|
Making my home more comfortable (less draughty
or stuffy, even temperatures)
|
24%
|
25%
|
|
To leave a better planet for future
generations
|
8%
|
10%
|
|
Save energy / Do not want to waste energy /
Use less energy / Energy efficient
|
0%
|
3%
|
|
Other
|
0%
|
1%
|
|
NET Don't know/Refusal
|
2%
|
2%
|
Q27 and Q27B: What are your reasons for making your home more energy
efficient?
Base: Respondents for whom home energy costs are a financial burden
and for whom making upgrades to bring down home energy costs is a priority (n=298)
Base: Respondents for whom home energy costs are NOT a
financial burden and for whom making upgrades to bring down home energy costs
is a priority (n=1,319)
Notable subgroup differences regarding respondents’ reasons for
making home energy efficiency improvements include:
Those for whom energy costs are a financial burden.
· Urban homeowners are significantly more likely to have indicated
that the main reason for making home improvements is to help the environment
and reduce their environmental footprint (31%).
· Rural homeowners are significantly more likely than other homeowners
to have mentioned that the main reason for making improvements to their home is
to make it more comfortable (37%). This is also the case for homeowners with a
household income under $60,000 (31%).
Those for whom energy costs are not a financial burden.
·
Homeowners aged 18 to 34 are significantly more
likely than other homeowners to have indicated that the main reason for making
home improvements is to help the environment (52%) and because it aligns with
their value (16%). Homeowners aged between 35 and 54 are significantly more
likely than other homeowners to have indicated saving money and reducing
operating costs as the primary reason for making home improvements (80%).
·
Homeowners who indicated having a language other
than English or French as their primary language spoken at home are
significantly more likely to have mentioned the desire to increase the value of
their property (25%), the desire to replace or update old equipment (21%), and
the intention to take advantage of government benefits and incentives (20%) as the
primary reasons for making energy efficiency improvements to their home.
·
Homeowners identifying as visible minorities
have identified a multitude of reasons for making energy efficiency
improvements to their homes. They are statistically more likely than other
homeowners to have mentioned an interest in helping the environment and
reducing their environmental footprint (49%), a desire to make their home more
comfortable (33%), and an interest in increasing the value of their property
(22%), as well as a desire to replace and update old equipment (22%), but also
because it aligns with their values (16%), because it increases resilience to
environmental factors (15%), because they want to take advantage of government
incentives (14%), and to make aesthetic improvements while being energy
efficient (13%).
·
Homeowners identifying as immigrants have also
mentioned numerous reasons for making energy efficiency improvements to their
homes. They are statistically more likely than non-immigrant homeowners to have
identified a desire to help the environment and reduce their environmental
footprint (46%), to want to make their home more comfortable (36%), to want to
replace old equipment (20%), and because it aligns with their values (14%).
·
Homeowners identifying as newcomers, like
immigrant homeowners, have mentioned a multitude of reasons for making energy
efficiency improvements to their homes. They are statistically more likely than
other homeowners to have mentioned wanting to make their home more comfortable
(49%), to increase the value of their property (30%), to replace old equipment
(27%), and also because it aligns with their values (23%), to increase their resilience
to environmental factors (20%), to take advantage of government incentives
(18%), and to leave a better planet for future generations (25%).
·
Homeowners with disabilities are significantly
more likely to have mentioned a desire to make their home more comfortable
(39%) than other homeowners. They are also more likely to have indicated that
this is aligned with their value (23%) and that they want to leave a better
planet for future generations (20%).
·
Homeowners who identify with the LGBTQ2+ community
are significantly more likely to have mentioned a desire to help the
environment and reduce their environmental footprint (59%).
The reasons why Canadian homeowners did not prioritize
energy efficiency improvements were somewhat different whether the homeowner
considered their energy costs to be a burden or not. The cost of improvements
was the main reason cited by homeowners whose energy costs are a burden (61%)
compared to 23% for the others. The fact that no improvements were needed at
this time was mentioned by homeowners whose energy costs are a burden (21%)
compared with 38% for the others. The following reasons were different for homeowners
who are burdened by energy costs and those who aren’t burdened by energy costs.
Homeowners who considered their home's energy costs to
be a burden cited the following reasons: their home requires modifications
other than energy upgrades (14%), that modifications will be made in the future
(13%) or the lack of time (12%). For homeowners whose energy costs were not a
burden, the reasons given were that the home is still new (16%), that the home
requires modifications other than energy upgrades (14%) or that energy upgrades
are not a valuable modification (13%).
Table 22: Reasons or barriers for not prioritizing home energy
efficiency improvements
|
Home energy costs
are a financial burden
|
Home energy costs
are NOT a financial burden
|
|
No improvements are currently necessary
|
21%
|
38%
|
|
My home needs other repairs before any energy
efficiency improvements
|
14%
|
14%
|
|
Planning to make improvements in the future
|
13%
|
11%
|
|
Planning to sell
|
10%
|
10%
|
|
Improvements are too costly
|
61%
|
23%
|
|
Do not have time
|
12%
|
8%
|
|
The home was recently built
|
11%
|
16%
|
|
The home was recently purchased
|
5%
|
7%
|
|
Energy efficiency
|
7%
|
13%
|
|
Decision is up to the condo board / building
administration
|
1%
|
3%
|
|
Other
|
4%
|
2%
|
|
NET Don't know/Refusal
|
2%
|
3%
|
Q28A and Q28B: What is the main reason or the barriers for NOT
prioritizing any energy efficiency improvements to your home?
Base: Respondents for whom home energy costs are a financial burden
and for whom making upgrades to bring down home energy costs is not a priority
(n=174)
Base: Respondents for whom home energy costs are NOT a
financial burden and for whom making upgrades to bring down home energy costs
is not a priority (n=911)
Notable subgroup differences regarding respondents’ reasons or
barriers for not prioritizing home energy efficiency improvements include:
Those for whom energy costs are a financial burden.
·
Female homeowners are significantly more likely
than men to have indicated that improvements are too expensive (71%).
·
Homeowners whose home is in Alberta are more
likely to have mentioned that no improvements are currently needed to their
homes (36%).
Those for whom
energy costs are not a financial burden.
·
Female homeowners are more likely than males to
have indicated that no improvements are currently needed to their home (43%).
·
Homeowners between 18 and 34 are more likely
than other homeowners to have indicated that their home was recently acquired
(16%). Homeowners between 35 and 54 are more likely than other homeowners to
have said that improvements are too expensive (29%), that their home is
relatively new (22%), that their home requires other repairs before energy
efficiency modifications (19%), and that they plan to make changes in the
future (16%). Homeowners aged 55 and older are significantly more likely to
have mentioned that their home does not require any improvements at this time
(45%).
·
Homeowners who define themselves as newcomers
are significantly more likely than others to have said their home is too new
(42%).
Given that only 14 respondents were qualified to answer this
question, the results must be interpreted with great caution. No final
conclusions can be extrapolated to the Indigenous populations living on a
reserve. The results are presented for illustrative purposes only.
Figure 18: On-reserve main limitations to accessing home energy
efficiency improvements
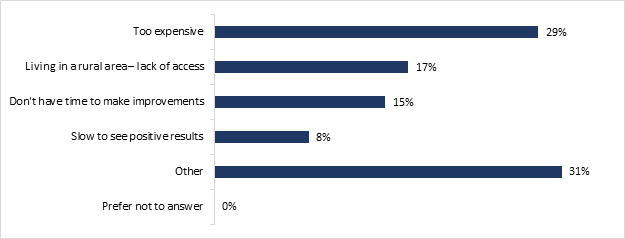
Q31: If you are living on a reserve, what is the biggest limitation
to accessing energy efficient improvements for your home?
Base: Indigenous respondents living on a reserve (n=14)
Overall, just over half of respondents identifying as a visible
minority have expressed the belief that members of their community have
equitable access (absolutely + some access) to government grant programs for
home energy retrofit projects. One third (32%) responded that they absolutely have
access to government grants, and one out of five (22%) responded that they have
some access to government grants. On the other hand, one out of five
respondents (20%) said that there was no access for members of their community
and 15% said they were not sure about it.
Figure 19: Fair access to government grants for visible minority
communities
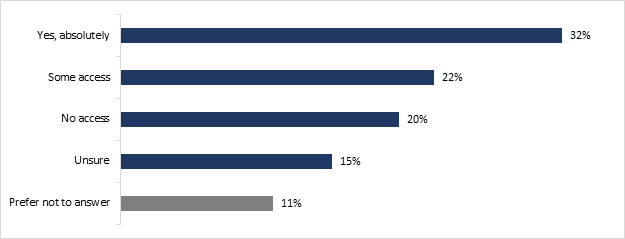
Q32: As a member of a visible minority, do you feel that your
community (social community, family and friends) has been given fair access to
government grants for energy efficiency improvements?
Base: Respondents who consider themselves to be part of a visible minority
(n=323)
Notable subgroup differences regarding fair access to government
grants for visible minority communities include:
·
Men (62%) identifying as a visible minority were
more likely than women to have indicated that their community absolutely had
equitable access to government funding programs for energy efficiency
improvements.
·
No other statistically significant differences can
be identified in the sample subgroups for this question.
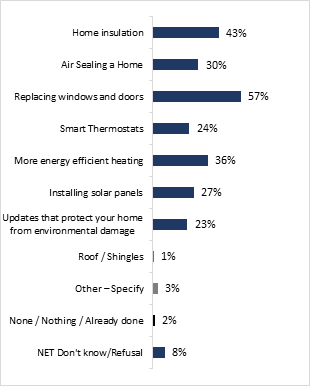
Canadian homeowners who want to make improvements to
their homes are primarily motivated by cost savings (72%), energy savings
(56%), increasing resale value (40%), climate and environmental concerns (36%),
and the look and appearance of the home (28%).
Figure 20: Factors prioritized when choosing to make home
improvements
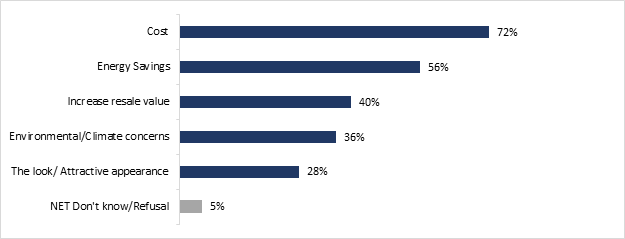
Q29: When choosing to make home improvements, in what order would
you rank the following priorities when deciding what repairs to do: *Up to
three answers possible.
Base: All respondents (n=2,919)
Notable subgroup differences regarding respondents’ priority ranking
when choosing to make home improvements include:
·
Homeowners between 18 and 34 are significantly
more likely (46%) to be concerned with increasing the value of their property
when deciding to make home improvements. Homeowners between 35 and 54 years of
age are significantly more likely than other homeowners to focus on the cost
(77%) when deciding to make home improvements.
·
Homeowners in British Columbia are more likely
to have indicated that they consider the cost (79%) but also their concern for
the climate and environment (44%) when making decisions to renovate their home.
Homeowners in Saskatchewan are more likely than others to indicate that they
are concerned about energy conservation (69%), while those in Manitoba tend to
prioritize the resale value of their home (54%). Homeowners in the Atlantic region
are more likely to prioritize energy conservation (63%).
·
Homeowners identifying as visible minorities are
significantly more likely to be concerned about energy conservation (63%), as
are newcomers (66%).
Receiving financial incentives to make efficiency
improvements to the home was the main reason cited by Canadian homeowners (42%)
to use less energy in and around their homes. Other incentives were also
mentioned, although to a lesser extent. Having new energy-efficient appliances
(13%), having connected or smart devices that help measure the home's energy
efficiency (10%), winning prizes for meeting an energy efficiency target (7%)
and receiving coaching from an expert (6%) were the top five incentives mentioned
by Canadian homeowners.
Figure 21: Incentives that most encourage to use less energy at home
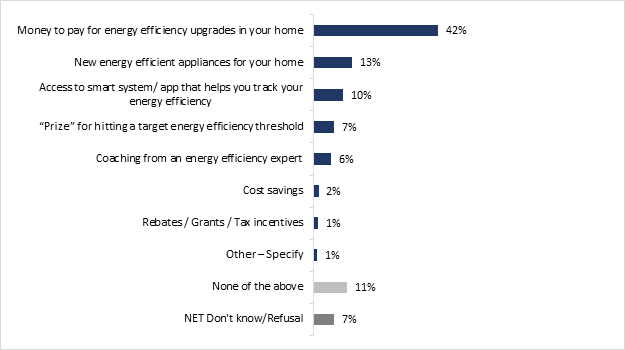
Q30: What incentive would most encourage you to use less energy in
and around your home?
Base: All respondents (n=2,919)
Notable subgroup differences regarding respondents’ incentives that
most encourage less home energy usage include:
·
Homeowners between 18 and 34 years of age are
significantly more likely (46%) to have indicated that having access to smart
systems or apps that would help them track their energy use was an incentive that
would encourage them to use less energy (18%). For homeowners between 35 and
54, receiving money to help pay for energy efficiency improvements to their
home was a more significant incentive than for other homeowners (49%).
More than eight in ten Canadian homeowners agreed that
it is important to reduce their environmental footprint (85%), that if they had
access to programs to access rebates, support, credits or tax exemptions, they
would improve the energy efficiency of their homes (82%), and that actions to
make homes more energy efficient really do make a difference to the environment
(81%). To a lesser extent, three quarters (74%) of homeowners in Canada agree
that they are knowledgeable enough to improve the efficiency of their home, that
they feel valued by family and friends when they make the choice to reduce
their environmental footprint (58%), that they would pay $10 more per month in
energy bills to protect the environment (48%), that energy efficiency is an
important issue, but they find it very difficult to change their habits (41%),
and that they are thinking about improving the energy efficiency of their homes,
but don't know where to start (36%).
Other homeowners agreed that their household is already
doing everything possible to reduce energy use and there is no reason to do
more (49%), that their current lifestyle prevents them from reducing energy use
(30%), and that they are concerned that making efforts to reduce energy use
will take too much time (28%).
Table 23: Psychographic profile of respondents
|
It's important to me to reduce my
environmental footprint.
|
85%
|
|
If I had access to one or more programs to
obtain rebates, tax credits or grants to make my home energy efficient, I
would do so.
|
82%
|
|
I think the actions we take to make our home
energy efficient really make a difference for the environment.
|
81%
|
|
I have the knowledge that helps me improve the
energy efficiency of my home
|
74%
|
|
I feel valued by my friends and family in my choice
to reduce my environmental footprint
|
58%
|
|
My household is already doing as much as
possible to reduce its energy consumption, I have no reason to do more.
|
49%
|
|
I would pay $10 per month extra in energy
bills to protect the environment
|
48%
|
|
Energy efficiency is an important issue for
me, but I find it very difficult to change my habits
|
41%
|
|
I am thinking about improving the energy
efficiency of my home, but I don't know where to start.
|
36%
|
|
My current lifestyle prevents me from reducing
my energy usage
|
30%
|
|
I am afraid that making efforts to reduce
energy consumption will take up too much of my time
|
28%
|
Q33: Please indicate your level of agreement or disagreement with
the following statements. Base: All respondents (n=2,919)
Notable subgroup differences regarding respondents’ psychographic
profiles include:
· Homeowners aged between 18 and 34 are significantly more likely than
other homeowners to have identified barriers to improving their environmental
footprint: energy efficiency is
an important issue for me, but I find it very difficult to change my habits
(56%), I am thinking about improving the energy efficiency of my home, but I
don't know where to start (55%), my current lifestyle prevents me from reducing
my energy usage (39%) and I am afraid that making efforts to reduce energy
consumption will take up too much of my time (46%).
· Homeowners of age 55 and older are more likely than others to have
indicated that their household is already doing as much as possible to reduce
its energy consumption, and that they have no reason to do more (57%).
· Quebec homeowners are more likely than other homeowners to have said
they would be willing to pay an extra $10 per month to protect the environment
(54%), but they are afraid that making the extra effort will take too much of
their time (34%).
· Homeowners who identified themselves as a visible minority were
significantly more likely to have said that they do not know where to start
making energy efficiency improvements (53%), that they find it difficult to
change their habits (51%), and that they are afraid that making the extra
effort will take too much time (42%).
· Homeowners who identified themselves as immigrants were significantly
more likely to have indicated that their household is already doing as much as
possible to reduce their energy consumption (54%), that they don't know where
to start to improve their home's energy performance (46%), and that they are
afraid that making the extra effort will take too much of their time (35%).
· Newcomers also share many of these concerns, but they are also more
likely than other homeowners to indicate that taking action to make a home
energy efficient makes a real difference (90%) and that if they had access to
programs that provide assistance, tax credits or other incentives, they would
take action to improve the energy efficiency of their home (89%). However, they
are also more likely to believe that it is difficult for them to change their
habits (52%), to not knowing where to start to make improvements (65%), and to
believe that making additional efforts will take too much of their time (56%).
Almost half of Canadian homeowners (46%) reported using
natural gas to heat their homes, while one-third (32%) reported using
electricity for heating. The remaining Canadian homeowners reported burning
wood (6%), using heat pumps (5%), heating oil (4%) and propane (4%).
Figure 22: Main energy source for home heating
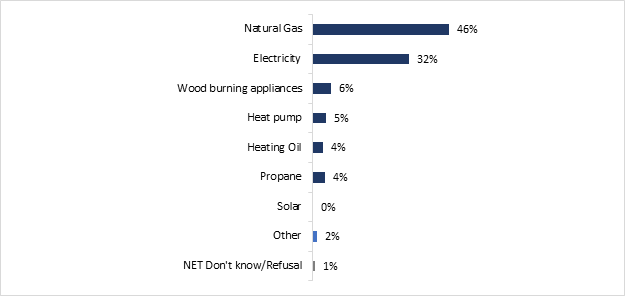
Q34: What is the main energy source used for heating your home?
Base: All respondents (n=2,919)
The most common energy-related items owned by Canadian
homeowners are ENERGY STAR certified appliances, whether refrigerators (66%),
dishwashers (56%), windows and doors (54%). Smart thermostats (47%), new
insulation (less than 5 years old) (28%), heat pump (19%) and solar panels (4%)
are owned by less than half of Canadian homeowners. Almost eight out of ten
Canadian homeowners reported owning or leasing a gas or diesel vehicle (79%).
In comparison, only 8% of respondents said they own a hybrid or electric
vehicle (8%).
Figure 23: Possession of energy-related items
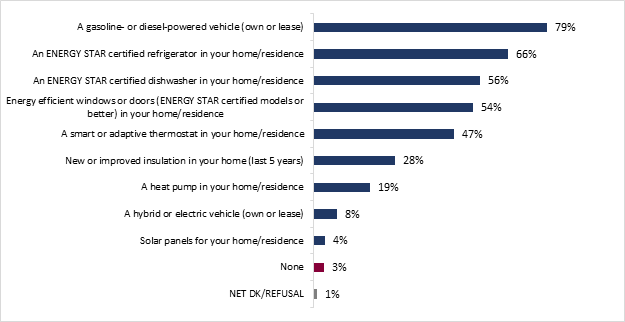
Q35: Do you currently own (any of) the following? *Multiple answer
allowed.
Base: All respondents (n=2,919)
Notable subgroup differences regarding respondents’ owning of
energy-related items:
·
Homeowners between 35 and 54 are significantly
more likely than other homeowners to have reported having an ENERGY STAR
dishwasher in their home (61%) and smart thermostats (55%).
·
Homeowners in Quebec are significantly more
likely to have indicated having a heat pump in their home (40%) and smart
thermostats (52%) than other homeowners. Those in the Atlantic provinces are
significantly more likely to have said that they own a heat pump (37%), ENERGY
STAR windows and doors (62%) and have installed new insulation in their home less
than 5 years ago (41%).
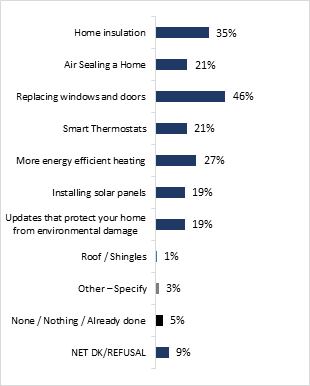
Half of the homeowners (56%) who responded to the survey
indicated that they do not plan to purchase any energy efficient items or to
improve the energy footprint of their home. The purchase of certified windows
and doors (15%), new home insulation (11%), and a hybrid or electric car (10%)
were the three items most frequently mentioned by respondents who said they
would purchase energy-related items in the next 6 months. Less than 10% of these
respondents mentioned the other items on the list.
Figure 24: Likeliness of owning energy-related items in the next six
months
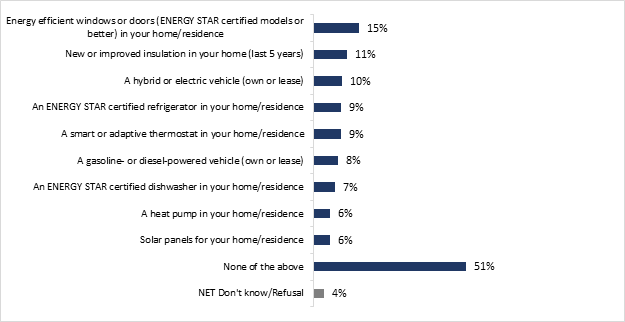
Q36: How likely are you to purchase any of the following in the NEXT
SIX MONTHS? *Multiple answer allowed. Base: All respondents (n=2,919)
Notable subgroup differences regarding respondents’ likeliness of owning
energy-related items in the next six months:
·
Quebec Homeowners who said they would purchase energy-related
items in the next 6 months are significantly more likely to have indicated that
they want to own a hybrid vehicle in the next few months (16%). Homeowners in
the Atlantic provinces who said they would purchase energy-related items in the
next 6 months are significantly more likely to have indicated that they want to
add a heat pump to their home (14%) in the next few months, as well as new
insulation for their home (18%).
The survey
results were filtered to identify a core group of respondents that corresponded
to the key primary population for the Canada Greener Homes Grant (CGHG)
program. In addition to pulling out the core group of
respondents who met the eligibility criteria for the CGHG, we used the
following additional criteria to identify key homeowner population segments
that would be of interest for the CGHG program:
1) Homeowners
for whom making energy efficiency improvements to their home is a priority.
2) Homeowners
whose homes were built in 2010 or earlier.
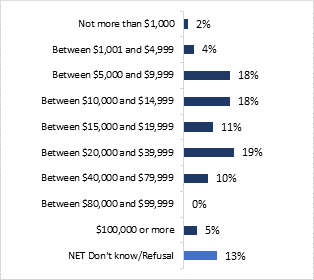
3) Have
established a minimum investment of $5,000 to be made on their property within
the next five years.
The CGHG
awareness and the intention to apply to CGHG criteria were dropped as this
would have been too restrictive and would have significantly reduced the sample
size for this group.
Using the
criteria mentioned above, the CGHG audience for consideration sample is 500
respondents, representing 17% of Canadian homeowners. More than eight out of
ten respondents (85%) who meet this profile live in a single or semi-detached
home. About half of them (53%) live in a residence that was built before 1983.
The remaining indicated that they live in residences built between 1984 and
2010. Over half of the respondents (56%) in this audience for consideration
indicated that their home had undergone an energy efficiency improvement in the
last 5 years.
The Core Audience for Consideration
The following is the profile distribution
of this core audience for consideration for the CGHG.
Table 24.
Demographic profile of the respondents
|
Gender
|
Profile of Homeowners
|
CGHG Audience for
Consideration
|
|
Female
|
50%
|
44%
|
|
Male
|
49%
|
55%
|
|
|
|
|
|
Age
|
|
|
|
18-24
|
3%
|
4%
|
|
25-34
|
12%
|
13%
|
|
35-44
|
17%
|
15%
|
|
45-54
|
21%
|
28%
|
|
55-64
|
22%
|
24%
|
|
65+
|
25%
|
16%
|
|
|
|
|
|
Education
|
|
|
|
High School or less
|
28%
|
19%
|
|
Coll.
|
40%
|
42%
|
|
Uni.
|
31%
|
40%
|
|
|
|
|
|
Region of Residence
|
|
|
|
British Columbia
|
13%
|
14%
|
|
Alberta
|
12%
|
9%
|
|
Saskatchewan
|
3%
|
2%
|
|
Manitoba
|
4%
|
4%
|
|
Ontario
|
38%
|
42%
|
|
Quebec
|
22%
|
19%
|
|
Atlantic
|
7%
|
7%
|
|
Territories
|
1%
|
2%
|
|
|
|
|
|
Urban or Rural Area
|
|
|
|
Urban
|
75%
|
79%
|
|
Rural
|
22%
|
20%
|
|
Langage Spoken at Home
|
|
|
|
English
|
79%
|
83%
|
|
French
|
22%
|
19%
|
|
Other
|
9%
|
7%
|
|
|
|
|
|
Income
|
|
|
|
<60k$
|
26%
|
19%
|
|
60K$-149k$
|
42%
|
47%
|
|
150k+$
|
17%
|
29%
|
Table 25. Immigration status
|
|
Profile of Homeowners
|
CGHG Audience for
Consideration
|
|
Born in Canada
|
79%
|
81%
|
|
Born outside Canada
|
21%
|
19%
|
Table 26. Minority profile
|
|
Profile of Homeowners
|
CGHG Audience for
Consideration
|
|
A member of the LGBTQ2+
community
|
2%
|
4%
|
|
A person with a disability
|
7%
|
6%
|
|
A member of a visible minority group
|
18%
|
23%
|
|
An Indigenous person (First Nations, Inuk (Inuit) or
Métis)
|
4%
|
4%
|
|
None of the above
|
71%
|
68%
|
|
Prefer not to answer
|
1%
|
0%
|
Table 27. Composition of the household
|
|
Profile of Homeowners
|
CGHG Audience for
Consideration
|
|
Household Size
|
|
|
|
1
|
19%
|
13%
|
|
2
|
34%
|
35%
|
|
3
|
17%
|
23%
|
|
4+
|
29%
|
29%
|
|
|
|
|
|
Children in the Household
|
|
|
|
Yes
|
52%
|
55%
|
|
No
|
47%
|
45%
|
|
|
|
|
|
Mortgage
|
|
|
|
Have a mortgage
|
56%
|
60%
|
|
Mortgage paid
|
35%
|
38%
|
|
Under a land lease agreement
|
3%
|
0%
|
|
|
|
|
|
Employment
|
|
|
|
Employed
|
63%
|
72%
|
|
Unemployed
|
7%
|
5%
|
|
Retired
|
28%
|
22%
|
The profile of
the core audience for consideration for the CGHG is relatively similar to the
population of homeowners in Canada, but statistically significant differences can be observed.
The core audience
for consideration for the CGHG is significantly over-represented among male
homeowners and under-represented among female homeowners compared to the
general homeowner population of Canada. The core audience for consideration for
the CGHG is significantly over-represented among those between 45 and 54 years
old, and under-represented among those who are 65 or older.
The core audience
for consideration for the CGHG is significantly over-represented among
homeowners who have a completed at least one university degree, and
under-represented among those who have a high-school diploma or less.
The core audience
for consideration for the CGHG is significantly over-represented among English speakers.
The core audience
for consideration for the CGHG is significantly over-represented among
households with an annual income of $60,000 or more. It is under-represented
among households who have an annual income of less than $60,000.
There is little
difference in the minority status of the audience for consideration for the CGHG,
except that homeowners identifying with the LGBTQ2+ community and visible
minorities are over-represented compared to the general homeowner population of
Canada.
The core audience
for consideration for the CGHG is significantly under-represented among
homeowners under a land lease agreement.
The core audience
for consideration is also significantly over-represented among three-person households,
while under-represented among those who live on their own.
The CGHG audience
for consideration is significantly over-represented among the working
population and under-represented among those who are retired.
On average, the
CGHG audience for consideration reported spending less than half of their
monthly income (42%) on bills, mortgages, loans and other debts. Nearly nine
out of ten (92%) of the CGHG audience for consideration have a monthly energy
bill of more than $100, with more than half of them (57%) indicating that they
are paying over $200.
About two third
of those for whom home energy expenses are a burden consider energy efficiency
improvements a priority in order to save money (67%). The desire to reduce
energy consumption (14%), helping the environment (11%), and the fact that their
house is old and needs renovations and updates (5%) are considered less
important reasons for making energy efficiency improvements a priority.
For those whose
energy costs are not a burden, saving money (54%), helping the environment (24%),
saving energy (20%), increasing their home's comfort (10%) and having an old
house that needs renovations and updates (8%) are the main reasons identified
for making energy efficiency improvements.
Replacing
windows and doors, replacing home insulation, and installing a more
energy-efficient heating system are the three improvements planned by the
largest number of homeowners who are part of the CGHG's core audience for
consideration.
On average, around
half of the respondents in this audience for consideration indicated that they
want to take advantage of government financial assistance and tax credits for
retrofitting their homes, including 46% of those whose energy costs are not a
burden and 60% of those who consider their energy costs to be a financial
burden. Using savings and income (78% and 67% respectively) and using a home
loan equity line of credit (21% and 32% respectively) were the other most
popular strategies for those whose energy costs are not a burden and for the
others.
The most popular
reasons for making their homes energy efficient, in order of preference, were
saving money, helping the environment and making their home more comfortable. Less
than half of those fitting the CGHC audience for consideration (49%) indicated
that receiving money to pay for energy efficiency improvements to their home
was the thing that would most encourage them to use less energy in and around
their home.
The respondents
who fit the CGHG audience for consideration have a personality type that is
significantly more open to energy efficiency improvements than other
homeowners. Indeed, they are significantly more likely to have indicated they
would make energy efficiency improvements to their homes if they had access to
one or more programs that offered rebates, tax credits or grants. They are also
significantly more likely to believe that reducing their environmental footprint
is important, that they feel valued by their close ones for reducing their
environmental footprint, and that they would pay an extra $10 monthly in energy
bills to protect the environment. They are less likely than other homeowners
to have suggested that they have already done enough in their household about
reducing energy consumption and see no reason to do more.
The CGHG core
audience for consideration represents a small percentage of homeowners in
Canada, about 17%. Awareness of the CGHG is also quite limited among this
group. Indeed, less than a quarter (23%) of the CGHG core audience for
consideration indicated being aware of the program. It is therefore important
to adequately approach this group of homeowners with campaigns promoting the
program.
These homeowners
are generally part of the active population under 65 years of age, and they
tend to live in single-family homes and semi-detached homes. Their average
annual household income is above $60,000.
They mostly
intend to replace their windows, doors and insulation in the next few years.
Making energy efficiency adjustments is mainly motivated by economic
considerations such as saving money. This motivation comes before environmental
reasons, even though this specific group of homeowners tends to also be
sensitive to eco-responsible values.
A high
proportion of this group indicated that having access to programs that offer
financial incentives would prompt them to launch energy efficiency improvement
projects on their homes. Given this group’s predisposition toward the program,
three main strategies should be preferred regarding how to specifically
approach them:
-
Firstly, as less than one quarter of them are
aware of the CGHG, specific efforts should be made in order to increase the knowledge
of the program’s existence among this group.
-
Secondly, more guidance regarding the
application process should be communicated to them. Results from this study show
that the main reason given by the respondents who were aware of the CGHG for
not applying to it was, by far, the fact that the process was too complicated. This
reason was mentioned by over half of the core CGHG audience for consideration. Therefore,
explicit details about the application process, including where to find
relevant resources and help, should be brought to the attention of the target population.
-
Thirdly, since this group is sensitive to
economic and environmental considerations, the preferred marketing approach
should address both their environmental values as well as their economic
sensitivity, with an emphasis on the latter. A message centred on the potential
for significant savings on their home energy bills combined with the added
advantage of reducing their environmental footprint should help to stimulate
these respondents’ interest for the program while showing them that it aligns
with their values.
The quantitative
research consisted of telephone interviews, which were conducted using a
computer-assisted telephone interviewing system (CATI technology). Leger
adheres to the most stringent guidelines for quantitative research. The survey
was conducted in accordance with Government of Canada requirements for
quantitative research, including the Standards of the Conduct of Government of
Canada Public Opinion Research—Series D—Quantitative Research.
Respondents were assured of the
voluntary and confidential nature of the approach, and the anonymity of their
responses. As with all research conducted by Leger, any information that could
identify respondents was removed from the data, in accordance with Canada’s
Privacy Act.
Research interviews were conducted
from the Montréal and Winnipeg virtual call centres. Montreal call centre has
three separate divisions of interviewers: one made up exclusively of
English-speaking interviewers, another exclusively of French-speaking
interviewers, and the last of bilingual interviewers. These divisions ensure
that all telephone surveys can easily be conducted in either official language.
Interviews in English were also conducted from the Winnipeg call centre.
The questionnaire
is available in Appendix A2.
Landline
telephone numbers were generated, and household-only cell phone numbers were
purchased using a stratified regional sampling approach. Telephone interviews
were conducted using Leger’s computer-assisted telephone interviewing system
(CATI technology). This system manages the sampling electronically, by
selecting and randomly dialing the phone number to call. To ensure perfect
coverage of a population, the sample included residential telephone numbers
located in all of Canada’s provinces and territories, as well as the cell phone
numbers of Canadians who do not have a residential landline (i.e.,
pre-validated cell numbers only). Quotas were established to ensure a
sufficient number of interviews in each region of Canada. In addition to these
regional quotas, data was collected to ensure proper distribution of
respondents by gender (men and women) and language (English and French), using
flexible quotas.
Canada-Wide Sampling: Households with a Landline
We defined a
Canada-wide sample of telephone numbers. All numbers were randomly selected to
generate this basic sample. Each telephone number in this sampling frame was
associated with a Canadian province. Subsequently, we used this Canada-wide
sample to randomly select numbers by province or region, in proportion with the
provincial or regional quotas established for the project.
Canada-Wide Sampling:
Households with a Cell Phone Number Only
For the portion
of the sample composed of "cell phone only households," candidates
were randomly selected for each province or region taking into account
provincial or regional quotas. We set a minimum quota of 40% respondents from cell
phones only households to match as closely as possible the proportion of
Canadian cell phone only households estimated by the CRTC (48%).
Fieldwork for
the survey was conducted from February 18 to March 31, 2022. The participation
rate for the survey was 5.2%. A pre-test of 39 interviews was completed between
February 18 and February 23, 2022.
To achieve data
reliability in all subgroups, a total sample of 2,919 Canadians who are
eligible voters were surveyed, in all regions of the country.
Since a sample
drawn from an Internet panel is not probabilistic in nature, the margin of
error cannot be calculated for this survey. Respondents for this survey were
selected from among those who have volunteered to participate/registered to
participate in online surveys. The results of such surveys cannot be described
as statistically projectable to the target population. The data have been
weighted to reflect the demographic composition of the target population.
Because the sample is based on those who initially self-selected for
participation, no estimates of sampling error can be calculated.
Based on data
from Statistics Canada’s 2016 national census, Leger weighted the results of
this survey by age, gender within each region of the country.
The following
table details the regional distribution of respondents. The baseline sample
attempted to replicate as closely as possible the actual distribution of the
Canadian population.
Table
A.1 Regional Distribution of Respondents
|
Region
|
Number of Respondents
|
|
British Columbia
|
392
|
|
Alberta
|
361
|
|
Saskatchewan
|
81
|
|
Manitoba
|
114
|
|
Ontario
|
1,104
|
|
Quebec
|
617
|
|
Atlantic
|
217
|
|
Total
|
2,919
|
The overall answer
rate for this study is 5.2%.
Below
is the calculation of the phone survey’s answer rate. The
overall response rate for this study is 16%. The answer rate is calculated
using the following formula: Response rate = R ÷ (U + IS + R). The table below
provides details of the calculation.
Table
A.2 Response Rate Calculation
|
Invalid number
|
128,285
|
|
No service
|
126,903
|
|
Non-residential
|
558
|
|
Fax / modem / pager
|
824
|
|
Unresolved (U)
|
146,546
|
|
No answer
|
58,543
|
|
Answering machine
|
82,162
|
|
Line busy
|
5,841
|
|
In-scope non-responding units
(IS)
|
41,044
|
|
Refusal
|
39,432
|
|
Language Barrier
|
1,612
|
|
Responding units (R)
|
10,495
|
|
Quota attained
|
10
|
|
Unqualified
|
2,670
|
|
Incomplete
|
1,370
|
|
Appointment
|
3,526
|
|
COMPLETED
INTERVIEWS
|
2,919
|
|
Response rate =
R/(U + IS + R)
|
5.2%
|
A response rate
of 5.2% may seem a bit low but given the target population as well as quotas in
specific subgroups of the population with very low incidence, it has been
deemed necessary to have a large number of telephone numbers injected into the
starting sample in order to meet the objectives of the study. This contributed
to the final response rate.
A basic
comparison of the unweighted and weighted sample sizes was conducted to
identify any potential non-response bias that could be introduced by lower
response rates among specific demographic subgroups (see tables below).
The table below
presents the geographic distribution of respondents, before and after
weighting. As shown, the distribution before weighting is almost optimal and
weighting has only corrected for small gaps in the distribution.
Table A.3
Unweighted and Weighted Sample Distribution by Province
|
Region
|
Unweighted
|
Weighted
|
|
British Columbia
|
392
|
376
|
|
Alberta
|
361
|
337
|
|
Saskatchewan
|
81
|
82
|
|
Manitoba
|
114
|
130
|
|
Ontario
|
1,104
|
1,114
|
|
Quebec
|
617
|
629
|
|
Atlantic
|
217
|
217
|
|
Total
|
2,919
|
2,919
|
The following
tables present the demographic distribution of respondents, according to gender
and age.
Regarding
gender, we can see that weighting has adjusted slightly the proportion of male
and female. The adjustments made by weighting are minor, and in no way can we
believe that the small differences observed in the effective samples could have
introduced a non-response bias for either of these two sample subgroups.
Table A.4 Unweighted and Weighted Sample
Distribution by Gender
|
Gender
|
Unweighted
|
Weighted
|
|
Male
|
1,455
|
1,428
|
|
Female
|
1,447
|
1,473
|
|
Total
|
2,902
|
2,901
|
* The complement corresponds to "other" and
"refusal".
Regarding age
distribution, the weighting process has corrected some minor discrepancies. The actual distribution of the sample
generally follows the distribution of age groups in the actual population. The
weighting mainly inflated the weight of owners aged 35 to 54 and reduced the
weight of owners aged 55 and over. In this case, it is unlikely that the
observed distributions introduce a non-response bias for a particular age
group.
Table
A.5 Unweighted and Weighted Sample Distribution by Age Group
|
Age
|
Unweighted
|
Weighted
|
|
Between 18 and 34
|
347
|
443
|
|
Between 35 and 54
|
887
|
1,112
|
|
55 and over
|
1,685
|
1,364
|
|
Total
|
2,919
|
2,919
|
The weighting
mainly had to adjust the weights of respondents with a particular status:
visible minorities, LGBTQ2+, newcomers,
Indigenous people, and people with disabilities. Since these groups were artificially
boosted by quotas, the weighting had to restore the real weight of these groups
so that they did not skew the overall sample.
Table
A.6 Unweighted and Weighted Sample Distribution by Visible Minority Status
|
Visible Minorities
|
Unweighted
|
Weighted
|
|
Yes
|
323
|
527
|
|
No
|
2,596
|
2,392
|
|
Total
|
2,919
|
2,919
|
Table
A.7 Unweighted and Weighted Sample Distribution by LGBTQ2+ Status
|
LGBTQ2+ Status
|
Unweighted
|
Weighted
|
|
Yes
|
113
|
69
|
|
No
|
2,806
|
2,850
|
|
Total
|
2,919
|
2,919
|
Table
A.8 Unweighted and Weighted Sample Distribution by Newcomer Status (last 10
years)
|
Newcomers
|
Unweighted
|
Weighted
|
|
Yes
|
123
|
92
|
|
No
|
2,796
|
2,827
|
|
Total
|
2,919
|
2,919
|
Table
A.8 Unweighted and Weighted Sample Distribution by Disabled Status
|
Disabled
|
Unweighted
|
Weighted
|
|
Yes
|
243
|
203
|
|
No
|
2,676
|
2,716
|
|
Total
|
2,919
|
2,919
|
There is no
evidence from the data that having achieved a different age or gender distribution
prior to weighting would have significantly changed the results for this study.
The relatively small weight factors (see section below) and differences in
responses between various subgroups suggest that data quality was not affected.
The weight that was applied corrected the initial imbalance for data analysis
purposes and no further manipulations were necessary.
The following
tables present the weighting factors applied to the database according to the
different respondent profiles.
Table
A.6 Weight Factors by Profile
|
Age x Gender x Region
|
Weight
|
|
British Columbia Male 18-24
|
0,234
|
|
British Columbia Male 25-34
|
0,677
|
|
British Columbia Male 35-44
|
0,894
|
|
British Columbia Male 45-54
|
1,373
|
|
British Columbia Male 55-64
|
1,591
|
|
British Columbia Male 65+
|
1,87
|
|
British Columbia Female 18-24
|
0,164
|
|
British Columbia Female 25-34
|
0,775
|
|
British Columbia Female 35-44
|
1,227
|
|
British Columbia Female 45-54
|
1,458
|
|
British Columbia Female 55-64
|
1,432
|
|
British Columbia Female 65+
|
2,171
|
|
Alberta Male 18-24
|
0,112
|
|
Alberta Male 25-34
|
0,878
|
|
Alberta Male 35-44
|
1,042
|
|
Alberta Male 45-54
|
1,298
|
|
Alberta Male 55-64
|
1,123
|
|
Alberta Male 65+
|
1,107
|
|
Alberta Female 18-24
|
0,251
|
|
Alberta Female 25-34
|
0,984
|
|
Alberta Female 35-44
|
1,213
|
|
Alberta Female 45-54
|
1,175
|
|
Alberta Female 55-64
|
1,076
|
|
Alberta Female 65+
|
1,297
|
|
Manitoba/Saskatchewan Male 18-24
|
0,213
|
|
Manitoba/Saskatchewan Male 25-34
|
0,518
|
|
Manitoba/Saskatchewan Male 35-44
|
0,543
|
|
Manitoba/Saskatchewan Male 45-54
|
0,763
|
|
Manitoba/Saskatchewan Male 55-64
|
0,833
|
|
Manitoba/Saskatchewan Male 65+
|
0,812
|
|
Manitoba/Saskatchewan Female 18-34
|
0,855
|
|
Manitoba/Saskatchewan Female 35-44
|
0,545
|
|
Manitoba/Saskatchewan Female 45-54
|
0,763
|
|
Manitoba/Saskatchewan Female 55-64
|
0,705
|
|
Manitoba/Saskatchewan Female 65+
|
0,978
|
|
Ontario Male 18-24
|
0,672
|
|
Ontario Male 25-34
|
2,449
|
|
Ontario Male 35-44
|
3,298
|
|
Ontario Male 45-54
|
4,179
|
|
Ontario Male 55-64
|
4,216
|
|
Ontario Male 65+
|
4,46
|
|
Ontario Female 18-24
|
0,59
|
|
Ontario Female 25-34
|
1,604
|
|
Ontario Female 35-44
|
3,417
|
|
Ontario Female 45-54
|
3,861
|
|
Ontario Female 55-64
|
4,261
|
|
Ontario Female 65+
|
5,107
|
|
Quebec Male 18-24
|
0,377
|
|
Quebec Male 25-34
|
1,695
|
|
Quebec Male 35-44
|
1,954
|
|
Quebec Male 45-54
|
2,402
|
|
Quebec Male 55-64
|
2,002
|
|
Quebec Male 65+
|
1,923
|
|
Quebec Female 18-24
|
0,301
|
|
Quebec Female 25-34
|
1,382
|
|
Quebec Female 35-44
|
1,859
|
|
Quebec Female 45-54
|
1,956
|
|
Quebec Female 55-64
|
2,749
|
|
Quebec Female 65+
|
2,918
|
|
Atlantique Male 18-24
|
0,136
|
|
Atlantique Male 25-34
|
0,236
|
|
Atlantique Male 35-44
|
0,567
|
|
Atlantique Male 45-54
|
0,626
|
|
Atlantique Male 55-64
|
0,893
|
|
Atlantique Male 65+
|
1,091
|
|
Atlantique Female 18-24
|
0,057
|
|
Atlantique Female 25-34
|
0,145
|
|
Atlantique Female 35-44
|
0,769
|
|
Atlantique Female 45-54
|
0,858
|
|
Atlantique Female 55-64
|
0,955
|
|
Atlantique Female 65+
|
1,085
|
|
|
|
Education
|
Weight
|
|
Prim/Coll
|
69,246
|
|
Uni ROC
|
24,211
|
|
Uni Quebec
|
6,543
|
|
|
|
Indigenous
|
Weight
|
|
Yes
|
4,33
|
|
No
|
95,67
|
|
|
|
Newcomers (Last 10 years)
|
Weight
|
|
Yes
|
3,14
|
|
No
|
96,86
|
|
|
|
Visible Minority
|
Weight
|
|
Yes
|
18,06
|
|
No
|
81,94
|
|
|
|
LGBTQ2+
|
Weight
|
|
Yes
|
2,35
|
|
No
|
97,65
|
|
|
|
Disabled People
|
Weight
|
|
Yes
|
6,93
|
|
No
|
93,07
|
INTRODUCTION
“Hello / Bonjour (pause), the Government of Canada is
conducting a research survey on energy efficiency. Would you prefer that I
continue in English or French? Préférez-vous continuer en français ou en
anglais?”
IF FRENCH : « Je vous remercie. Quelqu’un vous rappellera bientôt pour
mener le sondage en français. »
“My name is XXXXXX of Léger,
the company hired to do the survey. The survey takes about 20 minutes to
complete. Should you have any questions about the survey, I can give you a
contact person within the Government of Canada / Natural Resources Canada*. Your
participation is voluntary and confidential. Your answers will remain
anonymous, and the information you provide will be administered according to
the requirements of the Privacy Act, the Access to Information Act, and any
other pertinent legislation.
*NOTE TO INTERVIEWER: READ ONLY IF REQUESTED BY RESPONDENT:
Karl St-Pierre
613-290-0763
Karl.St-Pierre@nrcan-rncan.gc.ca
Is this a safe and convenient time for you? May I continue?”
S1. RDD1. Have I reached you on a cellular phone? (DO NOT READ LIST)
o Yes [IF RDD1 = YES, ASK, CELL1]
o No [IF RDD1 = NO, ASK, CELL2]
S2. CELL1. Are you in a safe place to talk on the telephone? (DO NOT
READ LIST)
o Yes
o No
S3. [IF CELL1=NO READ:] We would like to conduct this interview with
you when it is safe and convenient to do. Thank you for your time, we will call
back when it is more convenient.
S4. CELL2. Is this a good time to call? (DO NOT READ LIST)
o Yes [CONTINUE]
o No [RESCHEDULE CALLBACK]
DO NOT READ - ONLY IF REQUESTED BY THE RESPONDENT: If the respondent requests to complete the survey via another
mode, ask if they prefer to complete the survey on paper or via the Internet.
Record the respondent's name, phone number, email address so that we can
conduct the interview with the respondent.
Before we begin the interview, I am required to inform you that for
quality control reasons, this interview may be recorded. May we begin?
• Yes
• No, refusal – THANK AND TERMINATE
[BASE: ALL
RESPONDENTS]
[INFO PAGE]
To begin, I will ask you a few questions about yourself that will
help us classify your answers.
[BASE: ALL
RESPONDENTS]
Q1
Gender
What is your gender?
Female (1)
Male (2)
Other (3)
[Do not read] Prefer not to answer (9)
[BASE: ALL
RESPONDENTS]
Q2.1
Age
In what year were you born?
[Record year – YYYY]
[Do not read] Prefer not to answer (9999)
[BASE: RESPONDENTS
who answered 9999 at Q2.1]
Q2.2
Age2
Would you be willing to tell me in which of the following age
categories you belong?
[Read list]
18 to 24 (1)
25 to 34 (2)
35 to 44 (3)
45 to 54 (4)
55 to 64 (5)
or 65 or older (6)
[Do not read] Prefer not to answer (9)
[BASE: ALL
RESPONDENTS]
Q3
Education
What is the highest level of formal education that you have
completed?
[Read list]
Less than a High School diploma or equivalent (1)
High School diploma or equivalent (2)
Registered Apprenticeship or other trades certificate or diploma (3)
College, CEGEP or other non-university certificate or diploma (4)
University certificate or diploma below bachelor's level (5)
Bachelor's degree (6)
Post graduate degree above bachelor's level (7)
[Do not read] Prefer not to answer (9)
[BASE: ALL
RESPONDENTS]
Q4.1
GeoLoc1
What is your postal code?
[Record – A9A 9A9]
[Do not read] Prefer not to answer (9)
[BASE: RESPONDENTS who answered 9 at Q4.1]
Q4.2
GeoLoc2
Would you be willing to give me the first 3 characters of your
postal code (you share these 3 characters with over 40,000 people)?
[Record – A9A]
[Do not read] Prefer not to answer (9)
[BASE: RESPONDENTS who answered 9 at GeoLoc2]
RECODE: ALL RESPONDENTS BASED ON Q4.1 and Q4.2
Q4.3
Province
In which province or territory do you live?
British Columbia (1)
Alberta (2)
Saskatchewan (3)
Manitoba (4)
Ontario (5)
Quebec (6)
New Brunswick (7)
Nova Scotia (8)
Newfoundland and Labrador (9)
Prince Edward Island (10)
Northwest Territories (11)
Nunavut (12)
Yukon (13)
[Do not read] Prefer not to answer (99)
[BASE: ALL
RESPONDENTS]
Q5.1
MINO
Do you identify as…?
[Accept all that apply]
If needed: A person with a disability is a person who has a
long-term or recurring impairment (such as vision, hearing, mobility,
flexibility, dexterity, pain, learning, developmental, memory or mental
health-related) which limits their daily activities inside or outside the home
(such as at school, work, or in the community in general).
A member of the LGBTQ2 community (1)
A person with a disability (2)
A member of a visible minority group (3)
An Indigenous person (First Nations, Inuk (Inuit) or Métis) (4)
None of the above (5)
[Do not read] Prefer not to answer (99)
[BASE: RESPONDENTS
who answered 4 at Q5.1]
Q5.2
MINO3
More precisely, are you a member of the
First Nations, Inuk (Inuit), or Métis?
First Nations (1)
Inuk (2)
Metis (3)
[Do not read] Prefer not to answer (99)
[BASE: RESPONDENTS
who answered 4 at Q5.1]
Q5.3
RESERVE
Do you live off or on a reserve?
Live on reserve (1)
Live off reserve (2)
[Do not read] Prefer not to answer (99)
[BASE: ALL RESPONDENTS]
Q6.1
BORN
Where were you born?
Born in Canada (1)
Born outside Canada (2)
[BASE: RESPONDENTS
who answered 2 at Q6.1]
Q6.2
YIMM
In what year did you move to Canada?
[DROP DOWN MENU]
NOTE: “Newcomer” if arrived in Canada between 2012 and 2022 inclusively.
[BASE: ALL
RESPONDENTS]
[INFO PAGE]
I will now ask you a few questions about your primary residence.
[BASE: ALL
RESPONDENTS]
Q7
PROP
Are you the sole owner or one of the co-owners of your home that is
the primary residence you currently live in?
Yes (1)
No (2) – TERMINATE
[BASE: ALL
RESPONDENTS]
Q8
BURDEN 1
Based on your best guess, what percentage (%) of your total monthly
household income is dedicated to paying your monthly bills, including your
mortgage and any other loans or debt payments?
NUMERIC RESPONSE = %
Don’t know (98)
[Do not read] Prefer not to answer (99)
[BASE: ALL
RESPONDENTS]
Q9
ENERGYCOST
Based
on your best guess, what is the amount you pay each month
for your home energy bills (electricity, gas, etc.)? Is it…?
Under $50 (1)
Between $51 to $100 (2)
Between $100 to $200 (3)
Over $200 (4)
Don’t know (98)
[Do not read] Prefer not to answer (99)
[BASE: ALL RESPONDENTS]
Q10
DISPOSABLE INCO
Approximately, how much disposable income do you have saved aside if
you needed or wanted to undertake a home improvement project?
[DO NOT Read list – Code accordingly – one answer]
Not more than $1,000 (1)
Between $1,001 and $4,999 (2)
Between $5,000 and $9,999 (3)
Between $10,000 and $14,999 (4)
Between $15,000 and $19,999 (5)
Between $20,000 and $39,999 (6)
Between $40,000 and $79,999 (7)
Between $80,000 and $99,999 (8)
$100,000 or more (9)
No disposable income available for improvement (10)
Don’t know (98)
[Do not read] Prefer not to answer (99)
[BASE: ALL
RESPONDENTS]
Q11
DWELLING
What type of home (primary residence) do you currently live in?
[Read list]
NOTE TO INTERVIEWER, READ IF NECESSARY:
Rowhouse: Row-houses are two or more identical or nearly identical
units that share a common wall on one or both sides of the unit.
Townhouse: Multi-floor home that share one to two walls with
adjacent properties but have their own entrances
Single and semi-detached houses
Row housing
Townhomes
Mobile homes on a permanent foundation (1)
Permanently-moored floating homes (2)
Mixed use buildings (residential portion only) (3)
Low-rise multi-unit residential buildings (three storeys or less
with a footprint of 600m2 or less) (4)
Other (if possible, please specify) (96)
Don’t know (98)
[Do not read] Prefer not to answer (99)
[BASE: IF Q5.1 =
4]
Q12
DWELLING
Do any of the following situations apply to you or your principal
residence?
[Read list]
A.
My primary residence is part of an Indigenous
government or organization (e.g., band council, land claim organization) [SHOW ONLY IF INDIGENOUS 4 AT MINO]
B.
My primary residence is part of a housing
management body that owns home occupied by Indigenous families
Yes (1)
No (2)
[Do not read] Prefer not to answer (99)
[BASE: ALL
RESPONDENTS]
Q13.1
CONSDATE
In what year was your residence built?
[Record year – YYYY]
[Do not read] Not sure/Prefer not to answer (9999)
[BASE: RESPONDENTS
who answered 9999 at Q13.1]
Q13.2
CONSDATE2
Even if you do not know the exact year, would you say your primary
residence was built …
(READ LIST)
…Before 1946
… Between 1946-1960
… Between 1961-1977
… Between 1978-1983
… Between 1984-1995
… Between 1996-2000
… Between 2001 – 2010
… Between 2011 or later
Don’t know (98)
[Do not read] Prefer not to answer (99)
[BASE: ALL
RESPONDENTS]
Q14
SQFOOT
What is the living space in square footage of your home?
NOTE TO INTERVIEWER, READ IF NECESSARY: House living space: all
“heated living areas” including all space within exterior walls, even if the
area includes interior walls and dead space.
NOTE TO INTERVIEWER: Just refer to the square meter if the
respondent requests it.
Under 1000 sq. ft. (under 92 sq. meter) (1)
1000 to 1200 sq. ft. (between 92 and 111 sq. meter) (2)
1201 to 1400 sq. ft. (between 112 and 130 sq. meter) (3)
1401 to 1600 sq. ft. (between 131 and 149 sq. meter) (4)
1601 to 1800 sq. ft. (between 150 and 167 sq. meter) (5)
1801 to 2000 sq. ft. (between 168 and 186 sq. meter) (6)
2001 to 2200 sq. ft. (between 187 and 204 sq. meter) (7)
2201 to 2400 sq. ft. (between 205 and 223 sq. meter) (8)
Over 2400 sq. ft. (224 sq. meter or more) (9)
Don’t know (98)
[Do not read] Prefer not to answer (99)
[BASE: ALL
RESPONDENTS]
Q15
LAST IMPROVEMENT
Based on what you know, when was the last
time that a home improvement was made to make your home more energy efficient?
NOTE TO INTERVIEWER:
READ, IF NECESSARY: EXAMPLES
OF HOME IMPROVEMENTS:
- Caulking & weather-proofing to reduce drafts
- More efficient heating and/or cooling system (includes heat pumps)
- Installing more efficient windows & doors
- Insulating walls, basement and/or attic
- Installing “smart” (automated) thermostats
- Upgrading to more energy efficient appliances
Last 5 years (1)
6 to 10 years ago (2)
11 to 15 years ago (3)
16 to 20 years ago (4)
More than 20 years ago (5)
Was never renovated to improve energy efficiency (6)
Don’t know (98)
[Do not read] Prefer not to answer (99)
[BASE: ALL
RESPONDENTS]
Q16
BURDEN2
Which best describe your home energy costs
(electricity, gas, etc.):
My home energy costs are a significant financial burden (1)
My home energy costs are financially manageable (2)
My home energy costs are not a financial burden (3)
Don’t know (98)
[Do not read] Prefer not to answer (99)
[BASE: ALL RESPONDENTS]
[INFO PAGE]
The next section will focus on improvements to your home
Scenario 1 – Energy Cost is a Financial
Burden (Q16=1)
[BASE: IF Q16=1 –
home energy cost is a financial burden]
Q17A
BURDEN3A
You have mentioned that your home energy costs are a burden to you.
Is that burden significant enough that you would make it a priority to upgrade
your home to bring your home energy bills down or prevent energy and heat loss?
Yes (1)
No (2)
Don’t know (98)
[Do not read] Prefer not to answer (99)
OPEN QUESTION
[BASE
IF 1 (YES) AT Q17A]
Q17AA
In a few words, please tell us why it is a priority?
Please specify: O (96)
Don’t know (98)
[Do not read] Prefer not to answer (99)
OPEN QUESTION
[BASE
IF 2 (NO) AT Q17A]
Q17AAA
In a few words, please tell us why it is not a priority?
Please specify : O (96)
Don’t know (98)
[Do not read] Prefer not to answer (99)
[BASE: RESPONDENTS who answered 1 at Q17A =
yes to prioritize home energy improvements]
Q19
IMPROVEMENT
What energy efficiency improvements do you plan to make to your
home? [Read list – Code accordingly – multiple answers
allowed]
Home insulation (This can include attic, ceiling insulation,
exterior wall insulation, exposed floor, basement, foundation or crawlspace
insulation) (1)
Air Sealing a Home (This can include anything that improves the
air-tightness of your home) (2)
Replacing windows and doors (This can include Replacing doors and
windows with Energy Star certified models) (3)
Smart Thermostats (4)
More energy efficient heating (Can include non-fossil fuel heating
devices, installation of heat pumps) (5)
Installing solar panels (6)
Updates that protect your home from environmental damage (E.g.
buying materials for home that protect it from wildfires, potential flooding,
from wind damage to power failures (i.e. emergency battery back up) (7)
Other – Specify (96)
Don’t know (98)
[Do not read] Prefer not to answer (9)
[BASE: RESPONDENTS
who answered 1 at Q17A = yes to prioritize home energy improvements]
Q18
REPAIR
How much do you think you will need to invest to make energy
improvements to your home in the next 5 years, regardless of where this money
comes from?
[DO NOT Read list – Code accordingly – one answer]
Not more than $1,000 (1)
Between $1,001 and $4,999 (2)
Between $5,000 and $9,999 (3)
Between $10,000 and $14,999 (4)
Between $15,000 and $19,999 (5)
Between $20,000 and $39,999 (6)
Between $40,000 and $79,999 (7)
Between $80,000 and $99,999 (8)
$100,000 or more (9)
Don’t know (98)
[Do not read] Prefer not to answer (99)
[BASE: RESPONDENTS
who answered 1 at Q17A = yes to prioritize home energy improvements]
Q20
RESOURCES
Which of the following sources do you plan to use to minimize the
financial burden of your home energy improvement project?
Disposable income and savings (1)
Financing renovations into my mortgage (2)
Refinancing home/re-mortgage the house to pay for renovations (3)
Using my home loan equity line of credit (4)
Using a personal line of credit (5)
Using money available through credit cards (6)
Leveraging government financial assistance and tax credits for
eco-friendly home renovations (7)
None of the above (95)
[Do not read] Unsure\Prefer not to answer (99)
[BASE: RESPONDENTS
who answered 1 at Q17A = yes to prioritize home energy improvements]
AWARENESSPROGFED
Q21
Are you currently aware of the following
government resources and/or support programs for energy efficiency?
Yes (1)
No (2)
Don't know (8)
[Do not read] Prefer not to answer (9)
A.
Energy Efficiency Regulations: Regulations and
Standards
B.
Energy Efficiency for Homes
C.
Energy Efficiency for Products
D.
CMHC Green Home
E.
Energy Savings Rebate Program
F.
Canada Greener Home Grant
[BASE: RESPONDENTS
who answered 1 (YES) at Q21_F – CGHG]
Q22
FAMILIARITYCGHGI
How familiar are you with the Canada Greener Home Grant Initiative?
[Do not read]
Very familiar (1)
Somewhat familiar (2)
Somewhat unfamiliar (3)
Very unfamiliar (4)
Don't know (8)
[Do not read] Prefer not to answer (9)
[BASE: RESPONDENTS
who answered 1-2-3-4 at Q22]
Q23
APPLIEDCGHGI
Have you applied to the Canada Greener Home Grant?
[Read list]
Yes, I have applied for it (1)
I have not applied for it but I am considering it (2)
I have not applied for it (3)
I am not aware of the Canada Greener Home Grant (4)
Don't know (8)
[Do not read] Prefer not to answer (9)
[BASE: RESPONDENTS
who answered 3 at Q23 – I have not applied for CGHG]
Q24
REASONNOTAPPLY
Why have you not applied for the Canada Greener Home Grant?
[Do not read list – Code accordingly]
Too complicated/unsure about the process (1)
Home improvements are too expensive and outside my budget (2)
The grant that is available is too little to make a difference (3)
Don’t think the home improvements will make a difference in home
efficiency (4)
Friend/family told me that this is not useful for saving money or
helping the environment (5)
I don't trust that specific program (8)
Other – Specify (96)
Don't know (98)
[Do not read] Prefer not to answer (99)
[BASE: ALL
RESPONDENTS EXCEPT RESPONDENTS FROM NB-ON-SK-AB-NWT]
Q25
AWARENESSPROGPROV
Are you currently aware of the following provincial programs and
support for energy efficiency?
READ THE APPROPRIATE LIST BY PROVINCE/TERRITORY
Yes (1)
No (2)
Don't know (8)
[Do not read] Prefer not to answer (9)
Newfoundland and Labrador
· Home Energy Savings Program
(HESP)
PEI
· Building Envelope Upgrade Rebate
· Equipment Upgrade Rebate
· Home Energy Audit Program
· New Home Construction Program
· Winter Warming Program
Nova Scotia
· Appliance Retirement Program
· Clean Energy Financing Program
· Demonstration Homes Program
· Efficient Product Installation Service
· Home Product Rebates
· HomeWarming Program
· New Home Construction
· Solar City Program
· SolarHomes Program
· Home Energy Assessment Program
Quebec
· Chauffez vert
· Novoclimat Homes
· Rénoclimat
· Éconologis
Manitoba
· Advanced HRV Control Program
· First Nations Insulation and Direct Install
· Home Insulation Rebate
· Income Qualified Program
· Metis Energy Efficiency Offers
· New Homes Program
· Pool Pump Program
· SAVE MORE
British Columbia
· CleanBC Better Homes New Construction Program
· Energy Coach Service
· Home Renovation Rebate and EfficiencyBC Program
· CleanBC Better Homes and Home Renovation Rebate Program
Yukon
· Good Energy Program
· Refrigerator Retirement Program
· Incentives for Appliances, Heating Systems & Water Conservation
Nunavut
· Home Renovation Program
[BASE: IF Q16=1 –
home energy cost is a financial burden]
Q26
AWARENESSPROGREGMUNI
Are you currently aware of any regional/municipal programs and
support for energy efficiency?
DO NOT READ - IF YES – probe for many or some programs
Yes, I am aware of many programs for energy efficiency (1)
Yes, I am aware of some programs for energy efficiency (2)
No, I am not aware of any programs for energy efficiency (3)
Don't know (8)
[Do not read] Prefer not to answer (9)
[BASE: who did NOT
select 7 at Q20 and selected at least one of the following: Q21=1; Q25=1; Q26=1
or 2]
Q20.1
TRUST
Overall, do you consider that government propositions on resources and/or support programs for energy efficiency are generally...?
A.
Convenient
B.
Reliable
C.
Responsible / Taking responsibility for their
actions
D.
Respectful
E.
Safe / Privacy protected
Yes (1)
No (2)
[Do not read] Prefer not to answer (99)
[BASE: ALL
RESPONDENTS who answered 1 at Q17A= yes to prioritize home energy improvements]
Q27
REASONTOGOENERGEFF
What are your reasons for making your home more energy efficient?
[Do not read list – Code accordingly]
I have no specific reason to do it (1) (x)
Helping the environment - reducing environmental footprint (2)
Saving money - reducing operating costs/energy costs (3)
Increase property value (4)
It aligns with my values (5)
Replacing or updating old equipment (6)
Aesthetic improvements toward energy efficient updates (7)
Emergency replacement (8)
Taking advantage of government incentives (9)
Increasing resiliency against environmental factors (storms, floods,
etc.) (10)
Making my home more comfortable (less draughty or stuffy, even
temperatures) (11)
To leave a better planet for future generations (12)
Other – Specify (96)
Don't Know (98)
[Do not read] Prefer not to answer (99)
[BASE: RESPONDENTS who answered 2 at Q17A –
NOT prioritize energy efficiency
improvements]
Q28
REASON
What is the main reason or the barriers for NOT prioritizing any
energy efficiency improvements to your home?
[Read list – Code accordingly – multiple answers allowed]
[Do not read] No improvements are currently
necessary (1)
My home needs other repairs before any energy efficiency
improvements (2)
Planning to make improvements in the future (3)
Planning to sell (4)
Improvements are too costly (5)
Do not have time (6)
The home was recently built (7)
The home was recently purchased (8)
Energy efficiency is not a valuable improvement (9)
Other – Specify (96)
Don’t know (98)
[Do not read] Prefer not to answer (99)
Scenario 2 – Energy Cost is NOT a Financial
Burden (Q16=2-3)
[BASE: IF Q16=2-3
– home energy cost is not a financial burden]
Q17B
BURDEN3B
Although you mentioned that energy costs are not a burden to you, is
it a priority for you to make energy efficiency improvements to your home?
Yes (1)
No (2)
Don’t know (98)
[Do not read] Prefer not to answer (99)
OPEN QUESTION
[BASE IF 1 (YES) AT Q17B]
Q17BB
In a few words, please tell us why it is a priority?
Please specify: O (96)
Don’t know (98)
[Do not read] Prefer not to answer (99)
OPEN QUESTION
[BASE IF 2 (NO) AT Q17B]
Q17BBB
In a few words, please tell us why it is not a priority?
Please specify: O (96)
Don’t know (98)
[Do not read] Prefer not to answer (99)
[BASE: RESPONDENTS who answered 1 at Q17B =
yes to prioritize home energy improvements]
Q19B
IMPROVEMENT
What energy efficiency improvements do you plan to make to your
primary residence? [Read list – Code accordingly –
multiple answers allowed]
Home insulation (This can include attic, ceiling insulation,
exterior wall insulation, exposed floor, basement, foundation or crawlspace
insulation) (1)
Air Sealing a Home (This can include anything that improves the
air-tightness of your home) (2)
Replacing windows and doors (This can include Replacing doors and
windows with Energy Star certified models) (3)
Smart Thermostats (4)
More energy efficient heating (Can include non-fossil fuel heating
devices, installation of heat pumps) (5)
Installing solar panels (6)
Updates that protect your home from environmental damage (E.g.
buying materials for home that protect it from wildfires, potential flooding,
from wind damage to power failures (i.e. emergency battery back up) (7)
Other – Specify (96)
Don’t know (98)
[Do not read] Prefer not to answer (9)
[BASE: RESPONDENTS
who answered 1 at Q17B = yes to prioritize home energy improvements]
Q18B
REPAIR
How much do you think you will need to invest to make energy
improvements to your home in the next 5 years, regardless of where the money
comes from?
[DO NOT Read list – Code accordingly – one answer]
Not more than $1,000 (1)
Between $1,001 and $4,999 (2)
Between $5,000 and $9,999 (3)
Between $10,000 and $14,999 (4)
Between $15,000 and $19,999 (5)
Between $20,000 and $39,999 (6)
Between $40,000 and $79,999 (7)
Between $80,000 and $99,999 (8)
$100,000 or more (9)
Don’t know (98)
[Do not read] Prefer not to answer (99)
[BASE: RESPONDENTS
who answered 1 at Q17B = yes to prioritize home energy improvements]
Q20B
RESOURCES
Which of the following financial resources do you plan to use to
minimize the financial burden of this home energy improvement project?
Disposable income and savings (1)
Financing renovations into my mortgage (2)
Refinancing home/re-mortgage the house to pay for renovations (3)
Using my home loan equity line of credit (4)
Using a personal line of credit (5)
Using money available through credit cards (6)
Leveraging government financial assistance and tax credits for
eco-friendly home renovations (7)
None of the above (95)
[Do not read] Unsure\Prefer not to answer (99)
[BASE: RESPONDENTS
who answered 1 at Q17B = yes to prioritize home energy improvements]
AWARENESSPROGFED
Q21B
Are you currently aware of the following
government resources and/or support programs for energy efficiency?
Yes (1)
No (2)
Don't know (8)
[Do not read] Prefer not to answer (9)
A.
Energy Efficiency Regulations: Regulations and
Standards
B.
Energy Efficiency for Homes
C.
Energy Efficiency for Products
D.
CMHC Green Home
E.
Energy Savings Rebate Program
F.
Canada Greener Home Grant
[BASE: RESPONDENTS
who answered 1 at Q21B_F – CGHG]
Q22B
FAMILIARITYCGHGI
How familiar are you with the Canada Greener Home Grant Initiative?
[Do not read]
Very familiar (1)
Somewhat familiar (2)
Somewhat unfamiliar (3)
Very unfamiliar (4)
Don't know (8)
[Do not read] Prefer not to answer (9)
[BASE: RESPONDENTS
who answered 1-2-3-4 at Q22B]
Q23B
APPLIEDCGHGI
Have you applied to the Canada Greener Home Grant?
[Read list]
Yes, I have applied for it (1)
I have not applied for it but I am considering it (2)
I have not applied for it (3)
I am not aware of the Canada Greener Home Grant (4)
Don't know (8)
[Do not read] Prefer not to answer (9)
[BASE: RESPONDENTS
who answered 3 at Q23B – I have not applied for CGHG]
Q24B
REASONNOTAPPLY
Why have you not applied for the Canada Greener Home Grant?
[Do not read list – Code accordingly]
Too complicated/unsure about the process (1)
Home improvements are too expensive and outside my budget (2)
The grant that is available is too little to make a difference (3)
Don’t think the home improvements will make a difference in home
efficiency (4)
Friend/family told me that this is not useful for saving money or
helping the environment (5)
I don't trust that specific program (8)
Other – Specify (96)
Don't know (98)
[Do not read] Prefer not to answer (99)
[BASE: ALL
RESPONDENTS EXCEPT RESPONDENTS FROM NB-ON-SK-AB-NWT]
Q25B
AWARENESSPROGPROV
Are you currently aware of the following provincial programs and
support for energy efficiency?
READ THE APPROPRIATE LIST BY PROVINCE/TERRITORY
Yes (1)
No (2)
Don't know (8)
[Do not read] Prefer not to answer (9)
Newfoundland and Labrador
· Home Energy Savings Program
(HESP)
PEI
· Building Envelope Upgrade Rebate
· Equipment Upgrade Rebate
· Home Energy Audit Program
· New Home Construction Program
· Winter Warming Program
Nova Scotia
· Appliance Retirement Program
· Clean Energy Financing Program
· Demonstration Homes Program
· Efficient Product Installation Service
· Home Product Rebates
· HomeWarming Program
· New Home Construction
· Solar City Program
· SolarHomes Program
· Home Energy Assessment Program
Quebec
· Chauffez vert
· Novoclimat Homes
· Rénoclimat
· Éconologis
Manitoba
· Advanced HRV Control Program
· First Nations Insulation and Direct Install
· Home Insulation Rebate
· Income Qualified Program
· Metis Energy Efficiency Offers
· New Homes Program
· Pool Pump Program
· SAVE MORE
British Columbia
· CleanBC Better Homes New Construction Program
· Energy Coach Service
· Home Renovation Rebate and EfficiencyBC Program
· CleanBC Better Homes and Home Renovation Rebate Program
Yukon
· Good Energy Program
· Refrigerator Retirement Program
· Incentives for Appliances, Heating Systems & Water Conservation
Nunavut
· Home Renovation Program
[BASE: IF Q16=2-3
– home energy cost is not a financial burden]
Q26B
AWARENESSPROGREGMUNI
Are you currently aware of any regional/municipal programs and
support for energy efficiency?
DO NOT READ - IF YES – probe
for many or some programs
Yes, I am aware of many programs for energy efficiency (1)
Yes, I am aware of some programs for energy efficiency (2)
No, I am not aware of any programs for energy efficiency (3)
Don't know (8)
[Do not read] Prefer not to answer (9)
[BASE: who did not
select 7 at Q20B and selected at least one of the following: Q21B=1; Q25B=1;
Q26B=1 or 2]
Q20B.1
TRUST
Overall, do you consider that government propositions on resources and/or support programs for energy efficiency are generally......?
A.
Convenient
B.
Reliable
C.
Responsible / Taking responsibility for their
actions
D.
Respectful
E.
Safe / Privacy protected
Yes (1)
No (2)
[Do not read] Prefer not to answer (99)
[BASE: ALL
RESPONDENTS who answered 1 at Q17B = yes to prioritize home energy
improvements]
Q27B
REASONTOGOENERGEFF
What are your reasons for making your home more energy efficient?
[Do not read list – Code accordingly]
I have no specific reason to do it (1) (x)
Helping the environment - reducing environmental footprint (2)
Saving money - reducing operating costs/energy costs (3)
Increase property value (4)
It aligns with my values (5)
Replacing or updating old equipment (6)
Aesthetic improvements toward energy efficient updates (7)
Emergency replacement (8)
Taking advantage of government incentives (9)
Increasing resiliency against environmental factors (storms, floods,
etc.) (10)
Making my home more comfortable (less draughty or stuffy, even
temperatures) (11)
To leave a better planet for future generations (12)
Other – Specify (96)
Don't Know (98)
[Do not read] Prefer not to answer (99)
[BASE: RESPONDENTS who answered 2 at Q17B –
NOT prioritize energy efficiency
improvements]
Q28B
REASON
What is the main reason or the barriers for not prioritizing any
energy efficiency improvements to your home?
[Read list – Code accordingly – multiple answers allowed]
[Do not read] No improvements are currently
necessary (1)
My home needs other repairs before any energy efficiency
improvements (2)
Planning to make improvements in the future (3)
Planning to sell (4)
Improvements are too costly (5)
Do not have time (6)
The home was recently built (7)
The home was recently purchased (8)
Energy efficiency is not a valuable improvement (9)
Other – Specify (96)
Don’t know (98)
[Do not read] Prefer not to answer (99)
Section 3: All Respondents
[BASE: ALL RESPONDENTS]
[INFO PAGE]
The next section will focus on your opinion and perception regarding
improvement to your home and energy efficiency.
[BASE: ALL
RESPONDENTS]
Q29
FACTORS
When choosing to make home improvements, in what order would you
rank the following priorities when deciding what repairs to do:
[Read list - Accept up to three answers]
Cost (1)
Energy Savings (2)
The look/ Attractive
appearance (3)
Increase resale value (4)
Environmental/Climate concerns (5)
Don’t know (98) (X)
[Do not read] Prefer not to answer (99) (X)
[BASE: ALL
RESPONDENTS]
Q30
INCENTIVE
What incentive would most encourage you to use less energy in and
around your home?
Access to smart system/ app that helps you track your energy
efficiency (1)
Money to pay for energy efficiency upgrades in your home
(insulation, heating systems, based on your household income) (2)
New energy efficient appliances for your home (3)
Coaching from an energy efficiency expert (4)
“Prize” for hitting a target energy efficiency threshold (5)
Other – Specify (96)
None of the above (97) (X)
Don't know (98) (X)
[Do not read] Prefer not to answer (99) (X)
[BASE: RESPONDENTS
who answered 1 at RESERVE]
Q31
LIMITRESERVE
If you are living on a reserve, what is the biggest limitation to
accessing energy efficient improvements for your home?
Too expensive (1)
Living in a rural area – lack of access (2)
Slow to see positive results (3)
Don't have time to make improvements (4)
Other (6)
[Do not read] Prefer not to answer (9)
[BASE: RESPONDENTS
who answered 3 at Q5.1]
Q32
ACCESVISIMINO
As a member of a visible minority, do you feel that your community
(social community, family and friends) has been given fair access to government
grants for energy efficiency improvements?
Yes, absolutely (1)
Some access (2)
No access (3)
Unsure [Do not read] Prefer not to answer (9)
[BASE: ALL
RESPONDENTS]
Q33
PSYCHOGRAPHIC
Please indicate your level of agreement or disagreement with the
following statements:
[Read list and items - accept one answer only for each item]
A.
I am afraid that making efforts to reduce energy
consumption will take up too much of my time
B.
Energy efficiency is an important issue for me,
but I find it very difficult to change my habits
C.
My current lifestyle prevents me from reducing
my energy usage
D.
I feel valued by my friends and family in my
choice to reduce my environmental footprint
E.
I have the knowledge that helps me improve the
energy efficiency of my home
F.
I am thinking about improving the energy
efficiency of my home, but I don't know where to start.
G.
If I had access to one or more programs to
obtain rebates, tax credits or grants to make my home energy efficient, I would
do so.
H.
It's important to me to reduce my environmental
footprint.
I.
I think the actions we take to make our home
energy efficient really make a difference for the environment.
J.
My household is already doing as much as
possible to reduce its energy consumption, I have no reason to do more.
K.
I would pay $10 per month extra in energy bills
to protect the environment
Totally agree (1)
Somewhat agree (2)
Somewhat disagree (3)
Totally disagree (4)
Don't know (8)
[Do not read] Prefer not to answer (9)
[BASE: ALL
RESPONDENTS]
Q34
HEATENERGY
What is the main energy source used for heating your home?
Electricity (1)
Natural Gas (2)
Heating Oil (3)
Wood burning appliances (4)
Propane (5)
Solar (6)
Heat pump (7)
Other -Specify (96)
Don’t know (98)
[Do not read] Prefer not to answer (99)
[BASE: ALL
RESPONDENTS]
Q35
CURRENTOWN
Do you currently own (any of) the following?
[Read list – multiple answers allowed]
A hybrid or electric vehicle (own or lease) (1)
A gasoline- or diesel-powered vehicle (own or lease) (2)
An ENERGY STAR certified refrigerator in your home/residence (3)
An ENERGY STAR certified dishwasher in your home/residence (4)
A heat pump in your home/residence (5)
A smart or adaptive thermostat in your home/residence (6)
Solar panels for your home/residence (7)
Energy efficient windows or doors (ENERGY STAR certified models or
better) in your home/residence (8)
New or improved insulation in your home (last 5 years) (9)
None of the above (95) (X)
Don't know (98) (X)
[Do not read] Prefer not to answer (99) (X)
[BASE: ALL
RESPONDENTS]
Q36
FUTUREPURCHASE
How likely are you to purchase any of the following in the NEXT
SIX MONTHS?
[Read list – multiple answers allowed]
A hybrid or electric vehicle (own or lease) (1)
A gasoline- or diesel-powered vehicle (own or lease) (2)
An ENERGY STAR certified refrigerator in your home/residence (3)
An ENERGY STAR certified dishwasher in your home/residence (4)
A heat pump in your home/residence (5)
A smart or adaptive thermostat in your home/residence (6)
Solar panels for your home/residence (7)
Energy efficient windows or doors (ENERGY STAR certified models or
better) in your home/residence (8)
New or improved insulation in your home (last 5 years) (9)
None of the above (95) (X)
Don't know (98) (X)
[Do not read] Prefer not to answer (99) (X)
[BASE: ALL
RESPONDENTS]
[INFO PAGE]
I will now ask you a few questions about your household composition.
[BASE: ALL
RESPONDENTS]
Q37.1
MENA
Including yourself, how many people live permanently in your home?
Please include children in joint custody, as well as students or
people temporarily away, for example studying in another city or on an
internship or trip abroad.
Enter the number: ___________ (limits: 1-20) 96
[If
MENA>1]
Q37.2
MENA2
Of this number, how many people live under your dependency, i.e.
that you support financially?
Enter the number: ___________ (limits: 1-20) 96
[If
MENA>1]
Q37.3
MENA2
Do you live...?
NOTE TO INTERVIEWER: Since the respondent is included as a person
who lives under their dependency, the answer must be at least 1.
[Read list - accept one answer only]
In couple with children 01
In couple without children 02
Alone with one or more children 03
With your mother and/or father and/or brother and/or sister 04
With one or more roommates 05
In another situation 96 (Please specify) (O)
[BASE: ALL
RESPONDENTS]
Q38.1
MORTGAGE
Which of the following best describes your situation regarding
mortgage?
I currently have a mortgage (1)
My primary residence’s mortgage has been paid off (2)
My primary residence is under a land lease agreement (3)
[Do not read] Prefer not to answer (9)
[BASE: ALL
RESPONDENTS]
Q39
Employment
Which of the following categories best describes your current
employment status? Are you…
[Read list - accept one answer only]
Working full-time, that is, 35 or more hours per week (1)
Working part-time, that is, less than 35 hours per week (2)
Self-employed (3)
Unemployed, but looking for work (4)
A student attending school full-time (5)
Retired (6)
Not in the workforce [Full-time homemaker, unemployed, not looking
for work] (7)
[Do not read] Other—[Do not specify] (96)
[Do not read] Prefer not to answer (99)
[BASE: ALL
RESPONDENTS]
Q40
INCOME
Which of the following best describes your total household income
last year, before taxes, from all sources for all household members?
[Read list - accept one answer only]
Less than $20,000 (1)
$20,000 to less than $40,000 (2)
$40,000 to less than $60,000 (3)
$60,000 to less than $80,000 (4)
$80,000 to less than $100,000 (5)
$100,000 to less than $150,000 (6)
$150,000 to less than $200,000 (7)
$200,000 to less than $250,000 (8)
$250,000 and above (9)
[Do not read] Prefer not to answer (9)
[BASE: ALL
RESPONDENTS]
Q41
Language1
What language(s) do you speak on a regular basis at home?
[Accept all that apply]
English (1)
French (2)
Other [Do not specify] (3)
[Do not read] Prefer not to answer (9)
[BASE: ALL
RESPONDENTS]
Q42
Tel Status
Does your household subscribe to a home phone service, also known as
a landline?
Yes (1)
No (2)
Don’t know (8)
[Do not read] Prefer not to answer (9)
Thank you for your participation.