Canadian Geospatial Web Content User Needs
Natural Resources Canada
Final Report
March 2023
Prepared for:
Natural Resources Canada
Supplier name: Quorus Consulting Group Inc.
Contract award date: January 19, 2023
Delivery date: March 2023
Contract amount (incl. HST): $99,637.75
Contract #: CW2269183
POR number: 115-22
For more information, please contact:
Ce rapport est aussi disponible en français.
Copyright Page
Canadian Geospatial Web Content User Needs
Final Report
Prepared for Natural Resources Canada
Supplier name: Quorus Consulting Group Inc.
March 2023
This report is based on 15 online focus groups that Quorus completed between February 20 and March 2, 2023. One session was with individuals working in industry verticals where geospatial content is used. All other sessions were with individuals from the general population, students, parents, and educators who all have an interest (e.g., academic, personal, etc.) in geospatial content. Focus groups spanned the country and lasted approximately 90 minutes. All participants were informed the research was for the Government of Canada. A total of 104 individuals participated in this study.
Cette publication est aussi disponible en français sous le titre : Besoins des utilisateurs de données géospatiales canadiennes en matière de contenu Web
This publication may be reproduced for non-commercial purposes only. Prior written permission must be obtained from Natural Resources Canada. For more information on this report, please contact Natural Resources Canada at: nrcan.por-rop.rncan@canada.ca
Natural Resources Canada
580 Booth Street
Ottawa, Ontario
K1A 0E4
Catalogue number:
M4-236/2023E-PDF
International Standard Book Number (ISBN):
978-0-660-48106-7
Related publications (registration number: POR #115-22):
Catalogue Number M4-236/2023F-PDF (Final Report, French)
ISBN 978-0-660-48107-4
© His Majesty the King in Right of Canada, as represented by the Minister of Natural Resources, 2023
Political neutrality statement
I hereby certify as Senior Officer of Quorus Consulting Group Inc. that the deliverables fully comply with the Government of Canada political neutrality requirements outlined in the Policy on Communications and Federal Identity and the Directive on the Management of Communications - Appendix C.
Specifically, the deliverables do not include information on electoral voting intentions, political party preferences, standings with the electorate or ratings of the performance of a political party or its leaders.
Signed:

March 13, 2023 Rick Nadeau, President Quorus Consulting Group Inc.
Table of contents
Executive summary
Background and research objectives
The Government of Canada provides geospatial data, maps, and resources to support objectives such as economic growth, environmental and emergency management, and social well-being. New public-facing web presences are being created to organize, develop, and direct content to the appropriate target audiences.
One of the web presences includes the newly launched GEO.ca web platform. It was developed to disseminate the growing collection of data and present this information in a cohesive, singular location. It provides an enhanced experience to users for accessing data and tools on geospatial products and initiatives, focusing on subject-matter and user experience.
Additionally, as part of expanding access to geospatial information, the Canada Centre for Mapping and Earth Observation has begun a renewal of the Atlas of Canada. The Atlas has a long history as an authoritative source of maps, data, and geographic information, providing a national view on Canadian issues.
There has been limited public opinion research on geospatial and mapping activities in the past. As a result, this research will begin the process to obtain information needed to develop and maintain user-focused websites that can leverage the Department’s geospatial capacities. The research will help explore and develop an understanding of Canadians’ need for and use of geospatial content, what type of content benefits them, and what is appealing to non-industry groups.
This research will focus on the general population to determine new geospatial-related content and information that can be made available through various web platforms. Obtaining this information will improve provision of citizen-focused content and ensure that open geospatial and Earth observation information is available to all Canadians.
The content across public-facing web presences will integrate Canadian citizen-focused content, provided as clear and accessible communication.
This development will increase awareness and access to geography, geospatial data, and related initiatives for personal, professional, and educational use.
Specific research objectives include, but are not limited to, capturing:
What is the current level of knowledge and general attitude towards mapping and geospatial data products?
What type of geospatial resources do people interact with?
What is the preferred method to access geospatial information (i.e., data downloads, static maps, interactive maps, data ordering, text/informational, etc.)
What geospatial-related content is most useful in daily life?
What tools, resources, data, and content would be of most interest?
The research will be used to determine the general population’s interest, awareness, and needs for geospatial data and information, and how to best communicate this information.
The findings will guide primarily new content for Canada Centre of Mapping and Earth Observation’s GEO.CA and Atlas of Canada web platforms, and potentially other web products.
These various platforms are to be public and user-focused and their content and site development should be informed based on user needs research in order to address the needs of all Canadians.
Methodology
This report is based on 15 online focus groups that Quorus completed between February 20 and March 2, 2023. Among non-industry segments, three sessions were held with members of the general population interested in maps, three were with post-secondary students, four with parents of children in high school and four with high school and post-secondary educators. One session was held with individuals working in industry verticals for which geospatial content is relevant to the work they do. Eleven sessions were in English and four were in French. All participants were informed the research was for the Government of Canada. Non-industry participants received $125 for participating and industry participants received $200. A total of 104 individuals participated in the focus groups. More details can be found in the methodology section later in the report.
Summary of research results
For most participants, the word “Atlas” invokes images of a book of maps, something they may have used or seen in the past, or that previous generations used. While interesting to some, they are generally seen as obsolete and not a commonly-used resource beyond when needed for school projects or for professional purposes.
Digital atlases are not something many have experience with beyond Google Maps or Google Earth. These were mainly used to get around or to search for specific locations. Students and educators may use them for specific projects and courses, and those in specific industry sectors may use them for their jobs as well.
When asked to explore three different digital atlases (Canadian Geographic’s Indigenous Peoples Atlas of Canada, the Climate Atlas of Canada and NRCan’s Crown-Indigenous Relations and Northern Affairs Canada Map Room), non-industry participants explained that they preferred the first two, as they had intuitive navigation, and were the most visually appealing, user-friendly, engaging and interactive.
Industry participants were also asked to provide feedback on the Climate Atlas of Canada and NRCan’s Crown-Indigenous Relations and Northern Affairs Canada Map Room, as well as a more industry-focused site, the Geoportal of the Belgian Federal Institutions. Feedback on the first two sites was similar to what was expressed in the non-industry groups, while most had very positive feedback for the Geoportal. It, too, was said to be easy to navigate, featuring good interactive maps and the breadth and depth of information this group was looking for from a professional perspective.
Asked to brainstorm The Atlas of Canada, participants came up with a large variety of content they would like to see, namely:
Maps
Demographics/Statistics
Navigation/Travel/Leisure/Events
Including Infrastructure
History
Including Indigenous topics
Climate/Weather
Land use/Industry/Economic information
Natural Resources
Nature
Participants also had a broad wish list for the features of the Atlas, as follows:
Intuitive navigation
Interactivity
Use of multimedia
Accessible and appealing design, layout and information
Access to and use of data
Learning and teaching tools
Integration with other software and links to other sites and further information
Help and feedback features
Mostly, participants felt that the Atlas of Canada should be a stand-alone website or portal, rather than a (small) element of a broader “all things geography” website.
While digitized historical maps were of general interest and seen as something useful to add to a digital Atlas, they would have limited general appeal or usefulness unless they were enhanced with interactive features and/or the opportunity to easily choose and layer/manipulate data.
Educators and parents were interested in adding teaching tools or an Educators/Student section to the Atlas, which could contain features such as quizzes, lesson plans and project examples. In order for this to be appealing to students and useful for educators, it would have to contain the features from their wish list.
When looking at three different ways of presenting maps (a standard interactive map; maps presented through videos, animation and infographics; and a Story map), participants could see that all three approaches would appeal to some and could be useful in certain circumstances. They also said that a combination of the three could be useful.
The standard interactive map was appreciated because it contained detailed data and allowed users to “choose their own story” and dig as little or as much as they wanted, mainly for research purposes.
The example with the video was seen as not necessarily the most useful on its own, but having potential if it were integrated with other features and made to be more interactive or easily customized and manipulated.
The story map was said to have the most universal appeal, as it combined the best of the features they liked in the other two approaches, namely its interactivity, design and effective use of both text and multimedia.
Having access to data behind the maps and information on the Atlas was something that many students, educators and industry participants saw as a key component to the usefulness of the website. They would first and foremost want to manipulate (select and layer) data on the site itself, with an option to download the customized data or outputs (such as maps) they were interested in.
Industry participants were asked about their interest in user support. They generally said that it would be important to be able to get help navigating the site if they were having issues finding or accessing what they were looking for. This could be in the form of an online tutorial, a contact person, or a chat bot.
This group was also asked about their interest in receiving communication regarding information or data on the Atlas. While some said they would appreciate that, it would have to be customizable to their needs and interests, for example by having the option to subscribe to only receive updates on particular data or topics.
Overall, the Atlas, if it contains the content and features they most desire, is generally seen as a useful tool for the audiences in the focus groups.
Qualitative research disclaimer
Research purpose and objectives
The Government of Canada provides geospatial data, maps, and resources to support objectives such as economic growth, environmental and emergency management, and social well-being. New public-facing web presences are being created to organize, develop, and direct content to the appropriate target audiences.
One of the web presences includes the newly launched GEO.ca web platform. It was developed to disseminate the growing collection of data and present this information in a cohesive, singular location. It provides an enhanced experience to users for accessing data and tools on geospatial products and initiatives, focusing on subject-matter and user experience.
Additionally, as part of expanding access to geospatial information, the Canada Centre for Mapping and Earth Observation has begun a renewal of the Atlas of Canada. The Atlas has a long history as an authoritative source of maps, data, and geographic information, providing a national view on Canadian issues.
There has been limited public opinion research on geospatial and mapping activities in the past. As a result, this research will begin the process to obtain information needed to develop and maintain user-focused websites that can leverage the Department’s geospatial capacities. The research will help explore and develop an understanding of Canadians’ need for and use of geospatial content, what type of content benefits them, and what is appealing to non-industry groups.
This research will focus on the general population to determine new geospatial-related content and information that can be made available through various web platforms. Obtaining this information will improve provision of citizen-focused content and ensure that open geospatial and Earth observation information is available to all Canadians.
The content across public-facing web presences will integrate Canadian citizen-focused content, provided as clear and accessible communication.
This development will increase awareness and access to geography, geospatial data, and related initiatives for personal, professional, and educational use.
Specific research objectives include, but are not limited to, capturing:
What is the current level of knowledge and general attitude towards mapping and geospatial data products?
What type of geospatial resources do people interact with?
What is the preferred method to access geospatial information (i.e., data downloads, static maps, interactive maps, data ordering, text/informational, etc.)
What geospatial-related content is most useful in daily life?
What tools, resources, data, and content would be of most interest?
The research will be used to determine the general population’s interest, awareness, and needs for geospatial data and information, and how to best communicate this information.
The findings will guide primarily new content for Canada Centre of Mapping and Earth Observation’s GEO.CA and Atlas of Canada web platforms, and potentially other web products.
These various platforms are to be public and user-focused and their content and site development should be informed based on user needs research in order to address the needs of all Canadians.
Methodology
This report is based on 15 online focus groups that Quorus completed between February 20 and March 2, 2023. Among non-industry segments, three sessions were held with members of the general population interested in maps, three were with post-secondary students, four with parents of children in high school and four with high school and post-secondary educators. One session was held with individuals working in industry verticals for which geospatial content is relevant to the work they do. Eleven sessions were in English and four were in French. All participants were informed the research was for the Government of Canada. Non-industry participants received $125 for participating and industry participants received $200. A total of 104 individuals participated in the focus groups. More details can be found in the methodology section later in the report.
Research results
Exploring the concept of an atlas
As an opening discussion, participants were asked what first came to mind when they heard the word “Atlas.”
Most commonly, they think of maps in general, and somewhat more specifically, a book of maps or a collection of maps. Some participants explained a bit more about the maps in an atlas, for example that they represent countries or parts of the world. Some also refer to colourful maps (blue/green), with mountains and bodies of water. As well, for the most part, participants specifically refer to something old, outdated or of their past, such as a book from their childhood, a coffee table book at their parents’ house, or something they used for school when they were younger.
In a few groups, participants thought of the physical globe they may have or had in the past, or of Atlas, the figure from Greek mythology carrying the world on his shoulders.
Paper atlases are rarely used any more, but participants mentioned that in the past, they may have used them for schoolwork or as a reference, for example to look up geographical information out of curiosity.
While experience with book or printed versions of atlases was quite common, few initially felt they had experience with virtual atlases. This tended to change if someone in the group considered Google Maps an atlas, at which point many participants changed their minds and agreed that their experience with virtual maps was largely limited to Google Maps or similar sites. A few participants remembered using a digital atlas on a CD in the past.
These digital atlases were mainly used for navigation. In some groups there were participants who mentioned they used apps with maps for other purposes, such as for geocaching, aviation or in professional contexts. Students and educators also mentioned using digital maps in class, mainly for geography but some also for related courses, particularly at the post-secondary level.
Participants in the industry group used maps more commonly in their profession, whether for research purposes or for day-to-day tasks. A few mentioned using hard copies, which are typically large maps, for example on mining sites, in the oil and gas industry or for zoning and building sites. Some also use digital maps or software such as ArcGIS, Tableau or Google Maps and Google Earth. Examples of map use included socio-economic research, visualization of regional demographics or resources, navigation, land use (i.e., determining routes for laying pipelines or for zoning), communications and outreach.
Reactions to examples of digital atlases
In all non-industry groups, participants were asked to provide feedback on the following three digital atlases:
Participants were for the most part split between the first two websites when asked which one they preferred the most. They considered these sites visually appealing, easy to navigate and engaging. They also liked that the sites gave some context to the maps that were featured. They felt that they would be much more likely to spend time on those sites compared to the third website. Educators and parents also felt that the first two sites would also be the ones most likely to engage secondary and post-secondary students. Only very few participants preferred the Map Room. Those who did, felt it was easy to navigate and appreciated its simplicity and familiarity as a Government of Canada website.
When asked if these websites reflected what they considered an atlas, few felt the first two sites matched their expectations in that respect. If anything, the third site aligned closest given its particular focus on maps specifically.
More specific positive feedback on the three sites included:
| Website aspect | Indigenous Peoples Atlas of Canada | Climate Atlas of Canada | Map Room |
|---|---|---|---|
| Navigation |
|
|
|
| Features |
|
|
|
| Look and Feel |
|
|
|
| Accessibility |
|
|
|
| Information |
|
|
|
On the other hand, participants found room for improvements on all three sites:
| Indigenous Peoples Atlas of Canada | Climate Atlas of Canada | Map Room | |
|---|---|---|---|
| Navigation |
|
|
|
| Features |
|
|
|
| Look and Feel |
|
|
|
| Accessibility |
|
|
|
| Information |
|
|
|
In the Industry group, the Indigenous Peoples Atlas of Canada was replaced by a more data-focused example that would appeal more to this segment. The following three online atlases were evaluated:
The first two websites were much-preferred over the Map Room, with the Belgian geoportal receiving the most positive feedback from a professional point of view. Regarding the Climate Atlas and the Map Room, feedback was much the same as was received in the non-industry groups. While the Climate Atlas received mainly positive feedback, this was seen as more of personal interest rather than as something they may use professionally.
Regarding the Geoportal of the Belgian Federal Institutions, participants appreciated that it was easy to navigate, that the maps were found easily, and that the maps were interactive, including the option to layer the maps and a good high resolution zoom feature. The depth and breadth of information and data was also a positive point.
Designing the Atlas of Canada
Very few participants were aware of or had used a Government of Canada website called “The Atlas of Canada.” A few post-secondary students said they had used it for a course in the past.
When asked to brainstorm what they would value or be interested in seeing on a Government of Canada website called “The Atlas of Canada,” the types of content (information they wanted to see) spanned a wide range of topics and themes, namely:
Maps: Many participants were interested in seeing traditional map-related content such as major cities, province and territory borders, lakes, rivers and mountains.
Demographics/Statistics: Many would like to access statistics through the Atlas, including data related to the people (population density as well as demographics, for instance by accessing Statistics Canada census data), and to the land (e.g., the area, the climate, topography, etc.)
Navigation/Travel/Leisure/Events: Many participants were interested in using the Atlas as a tool to get around, including for finding tourism “highlights” – in other words things to see and do across the country, how to get there, what to look for, where to stay and where to eat. This was especially interesting to participants in general population and parent focus groups.
Infrastructure: Related to navigation and getting around, some participants were interested in seeing Canada’s infrastructure beyond roads.
History: This included historical maps as well as historical information, and changes over time.
Indigenous topics: Related to history, participants were specifically interested in Indigenous history and geographical information.
Climate/Weather: Past, current and future weather patterns were of interest, as well as information and maps on climate change and its effects.
Land use/Industry/Economic activity: Participants expressed an interest in information about how people made a living across the country, where they could find certain industries and certain jobs.
Natural Resources: Related to the previous topic, many mentioned wanting to know where various natural resources were located across the country.
Nature: The types of flora and fauna found in a given region.
Details pertaining to content
| Theme: Maps | |
|
|
| Theme: Navigation / Travel / Leisure / Events | |
|
|
| Theme: History | |
|
|
| Theme: Demographics and Statistics | |
|
|
| Theme: Indigenous topics | |
|
|
| Theme: Climate / Weather | |
|
|
| Theme: Infrastructure | |
|
|
| Theme: Land use / Industry / Economic activity | |
|
|
| Theme: Natural Resources | |
|
|
| Theme: Nature (flora and fauna) | |
|
|
When asked to brainstorm features (how information was displayed / what they could do on the site) they would like to see on “The Atlas of Canada,” the main themes were:
Navigation: Participants want the site to feature what they consider essential components such as a strong search engine, an intuitive menu bar, and overall intuitive navigation.
Interactivity: Participants want to interact with the content, whether that means being able to zoom in and out on a map or being able to click on the map to access specific types of information on a specific geography. Many were interested in being able to “layer” or filter maps and control the content across a timeline. While static maps may be useful as a starting point, there was an expectation that the Atlas would go beyond that.
Multimedia: Participants want access to multi-media content including pictures, infographics, videos and audio-clips, rather than a text-heavy approach.
Accessibility and Layout: A clean but dynamic layout/appearance was seen as key, as well as a website that was universally accessible. The use of universal design principles was often brought up, such as clear and simple language, text-to-audio capabilities, and presenting content to accommodate different learning styles. Mobile device compatibility was also raised. Bilingualism was also an expectation, with some saying content should also be available in other languages commonly spoken in Canada, including Indigenous languages.
Data: Many participants wanted the underlying data to be available for reference, as well as the ability to manipulate the data on the site. Some would also want to be able to download data and print documents, maps, charts, and image files.
Learning/Teaching Tools: Educators in particular were interested in leveraging the Atlas in their classrooms.
Integration/Links: Industry participants, post-secondary educators and students would like to see links to other documents and data, as well as the ability to integrate the data and information with other systems they may use.
Help and Feedback: Some participants also mentioned that they would want to be able to contact someone for help with the site, or to provide feedback if they found something missing or erroneous.
Details pertaining to features
| Theme: Navigation | |
|
|
| Theme: Interactivity | |
|
|
| Theme: Accessibility and Layout | |
|
|
| Theme: Data | |
|
|
| Theme: Learning and Teaching Tools | |
|
|
| Theme: Multimedia | |
|
|
| Theme: Integration / Links | |
|
|
| Theme: Help and Feedback | |
|
|
Participants do have certain expectations of the website because it would be created and managed by the Government of Canada. Mostly, participants expect all the content to be bilingual, up-to-date, accessible, geared towards a wide audience, and reliable. Some felt that it might turn into the “same old” unattractive and boring government website that will not live up to what they are hoping for based on the content and features they have on their wish list.
While some expect it to be neutral and unbiased, there were also those who were skeptical of this. Generally, there was also a sense that the information on a government website will be credible, but that the design may not be modern or innovative. They also expect this would be a “safe” site to visit without having to worry about scams or contend with advertisements and promotions to purchase anything.
Thematic approach
Participants were asked to provide feedback on the following two broad website concepts:
Concept A: A broad Government of Canada website dedicated to “all things geography” |
Concept B: A Government of Canada website dedicated entirely to the Atlas of Canada. |
Products and Information such as:
Initiatives and Programs – details on:
|
Key home page themes:
|
For the most part, participants gravitated to a website dedicated solely to the Atlas of Canada as explained in Concept B. This seemed more intuitive to them and seemed to better align with what they might be looking for in a site. Industry participants often said that Concept B would be more relevant to their job, and a number of educators echoed this sentiment. Students also tended to agree that it would be better to have a focused site where they can find the facts about whatever it is they are researching or learning about, without the “distractions” of the other information.
There was a sense that Concept A might be too broad or too “government focused.” There was also a concern that Concept A might be overly focused on the federal government promoting what it is accomplishing and what it is funding rather than being focused on communicating neutral data and information. Some said that the map or atlas element would be lost in Concept A.
Those who liked Concept A felt it would allow for a broader understanding of whatever topic they are researching while still providing access to the Atlas of Canada. These participants sometimes said that they typically would not be looking for specific geographic data or information, and that in this way, they would potentially get exposed to the Atlas even though that was not their specific intent. They suggested that a wider audience may end up seeing it. As well, some academics and post-secondary educators appreciated the direct links they may find to research grants or scholarships.
A few suggested that within Concept B, there could be a small section with links to the information provided in Concept A, as they assumed this information would already be available somewhere else on Canada.ca, essentially flipping the script.
Historical content
Participants were shown an example of a digitized and interactive atlas from 1906 and a few of the maps featured in this resource:
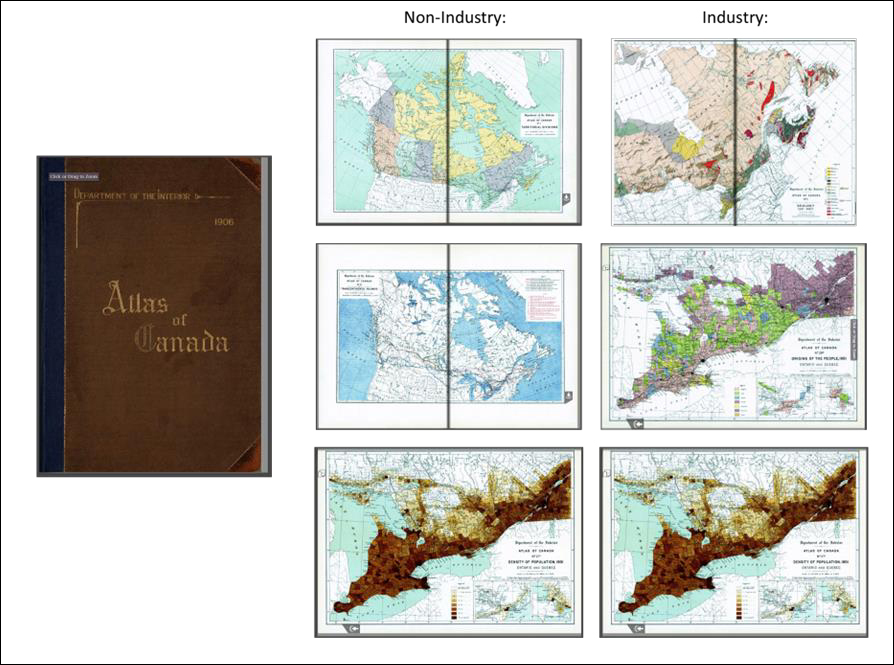
A figure shows the pages from the Atlas of Canada and its cover
A figure shows the cover of the book, "Atlas of Canada," and six pages from the atlas. Three non-industry and three industry maps are given. The non-industry maps represent the physical, rivers, and altitudes. The industry maps represent the resources available and other details related to the land.
There was a great deal of interest in historical data and maps.
As noted earlier, “history” was a key theme in the content participants across all groups were expecting in a digital Atlas of Canada. Most, rather than just looking at old maps or learning about the past, are particularly interested in understanding how certain areas have evolved over time, whether it be in terms of physical appearance (e.g., the change in land use over time), weather/climate, fauna and flora, or the people inhabiting a given land or local area, among many other themes of interest.
Participants would want to control the timeline or the years they would like to compare, as well as the content being mapped, and are interested in layering different information or data they are interested in. There was also interest in downloading historical maps and being able to create historical maps, particularly for educational purposes. Some participants, including those in the industry group, would also be interested in contextual analysis, including brief analysis or explanations behind certain trends or changes over time, as well as in the ability to download or analyze data. Industry participants and students were also interested in knowing the sources of the historical data.
Educational and learning materials
Students, educators and parents were asked a few specific questions about educational and learning materials. Most participants, and especially educators and parents, were interested in being able to access digital learning-based material and resources.
As was expressed when brainstorming desirable features of the Atlas of Canada, most felt that any sort of learning-based material or resource would need to be very dynamic and interactive, as well as accessible to all learners and all levels/ages, including using grade-level appropriate language. Videos were often seen as good resources for young learners. Parents in particular stressed this idea.
Students and post-secondary educators generally felt that tools and resources that could help them navigate the site’s content would be sufficient, including a robust search engine and intuitive navigation. They want access to easily downloadable content and simple access to bibliographical/source information.
Educators, particularly those teaching in high school, are interested in accessing resources that will allow them to engage different learning styles, and also work with the content in unique ways. This included access to strong interactive features, downloadable content and data, and printable and editable maps. There was also interest in quizzes/trivia/fun facts and suggestions for student projects and group discussions. Aligning the content with provincial curriculum was also mentioned. Some teachers suggested that ideas for lesson planning would be helpful.
Participants were also shown the following example of what educational and learning material could represent and asked if it sparked any further ideas:

A figure shows two screenshots from the Atlas of Canada website
A pair of screenshots represent the pages from the Atlas of Canada website. The learning resources and list of topics covered are given in the first page. A collage of students learning from the internet are shown in the learning resources section. Search the Atlas box is present at the top-right corner of the pages. The second page shows the details of the quizzes and the two steps. A figure with different symbols and question marks is present within the quizzes section. Radio buttons are provided to select the subject categories in step 1. Radio buttons are provided to select the level of difficulty in step 2.
This example was said to cater particularly to elementary grades and while some felt it was a “good start,” it also needed more work in order to align with what would keep students engaged. Particularly, this was seen as likely a bit static rather than interactive. The idea of the quiz was generally appreciated, while some also liked the “fun facts” section and the cartography idea.
Presentation of maps in digital content
The following three different approaches to presenting maps in digital content were shown to participants:
| Example 1 – Standard Interactive Map |
| You can have standard interactive maps that show the data and include a legend describing the symbols, and sometimes data tables. Users can interact a little more with the data shown in the map. |
| https://open.canada.ca/data/en/fgpv_vpgf/0a309f2c-4f11-4ddb-bce1-e7ba6f8c20cf |
| Example 2 – Videos, animations, and infographics |
| This form of presentation typically allows the user to play a video that will show a map on a given theme. There might be text and/or audio describing what is being presented. |
| https://atlas.gc.ca/ette/en/index.html |
| Example 3 – Story map |
| This approach can contain other media such as text, images, videos, alongside a map. The map updates as the “story” progresses to show new information related to what is being presented in the text. Users go through the map and story in their own time but have little interaction with the data displayed in the map. |
| https://maps.canada.ca/journal/content-en.html?lang=en&appid=0e585399e9474ccf932104a239d90652&appidalt=11756f2e3c454acdb214f950cf1e2f7d |
Overall, participants felt that there was utility in all three approaches, and that each one could be useful in certain purposes and for certain audiences. Feedback on each approach included the following:
Example 1 - a standard interactive map: Although the example shown had its limitations, given that the data were quite narrow, participants generally appreciated being able to access and interact with a basic map. Choosing your own story by selecting what one would click on to read was seen as a positive aspect of this. However, some felt that it was a bit too much like a “hunt,” as they could imagine themselves having to click around a lot in order to find what they were looking for. High school educators suggested that this may not be of interest to younger students if they could not quickly find what they were looking for. On the other hand, some post-secondary educators appreciated it for its academic look and feel and could see themselves or their students using this resource for research purposes.
Key success factors would include an intuitive legend, a map that does not require too long to download, a map that is not overly cluttered and being able to zoom in and out of the map to focus on a specific geography. A way to effectively search for information was also suggested.
Example 2 – videos, animations, and infographics: Participants liked that this approach was easy to use and could cater to certain learning styles although few seemed to feel that this approach was their preferred one. They felt that the lack of interactivity with the map and the inability to control the specific dates or timeline were important limitations. Many would want more control over the content and the pace of the video or the animation.
This type of video or animation was often seen as complementary, or as one of the teaching tools that could potentially be used or expanded upon. Educators and parents said that while videos were key tools, they would have to cater more to a younger audience used to watching (animated) YouTube videos, rather than the way this example was presented.
Example 3 – story map: Many participants felt this was an ideal way to present and use maps in digital content and that it had “something for everyone.” They felt that having access to short text that was easily digestible was helpful since it gave some context to certain information or data. They also felt that the accompanying map was a dynamic and interesting support to the text and that there was a good number of other types of multi-media including usable links, images, etc. Being able to control their place in the story was also valued. Many felt the story map was a nice combination of the first two types of maps showcased – it was a balance of context/narrative, interactivity and supporting content. Some educators suggested that this tool could be used as the basis for a lecture or student reading assignment.
Few had any particular concerns if a site like the Atlas of Canada featured any of, or a combination of these three types of maps. Participants often suggested that it in fact should include a mix of these approaches in order to appeal to a wide audience and cater to a variety of information needs.
Access to data
In the groups with students, educators and industry, participants were asked whether they would want to access the data so that they could conduct their own analysis. Most were interested in this capability, and in many groups, this had already come up as one of the desired features of the Atlas of Canada.
Participants were asked whether they would prefer different ways to analyze and manipulate data within the website or an option to download data to conduct their own analysis. Most students and educators indicated they would want to be able to manipulate the data directly on the website, for example by selecting the topics, timeframe, and areas they would be interested in, with the ability to filter or layer data/content easily by selecting or unselecting options. They then often wanted the option to download either the output of what they had selected (for example a PDF map) or have the option to download the dataset to manipulate and analyze the data further for themselves.
Industry participants shared this desire to access the data. They would prefer to manipulate the data directly on the website rather than having to download it. Downloading it was mostly seen as a “nice to have,” but also as something that would unnecessarily create large files to download and store that they may only use once. For the most part, participants would be looking for regional-specific data (province or more local such as municipal or health authority, down to neighbourhood level) rather than for national data. National data may be used for comparison purposes.
Searching for data
Industry participants were asked whether they were familiar with the Government of Canada website https://geo.ca/home/. None of the participants had heard of or seen the site before.
To help them contextualize the next few sections of the discussion, participants were shown the homepage, along with the following information about the site:
They were asked to comment on two different ways that this website allows users to search the site, namely through a Geographic Search and a Keyword Search. Some mentioned that this website looked quite complicated and dense, and that it catered to a very niche audience.
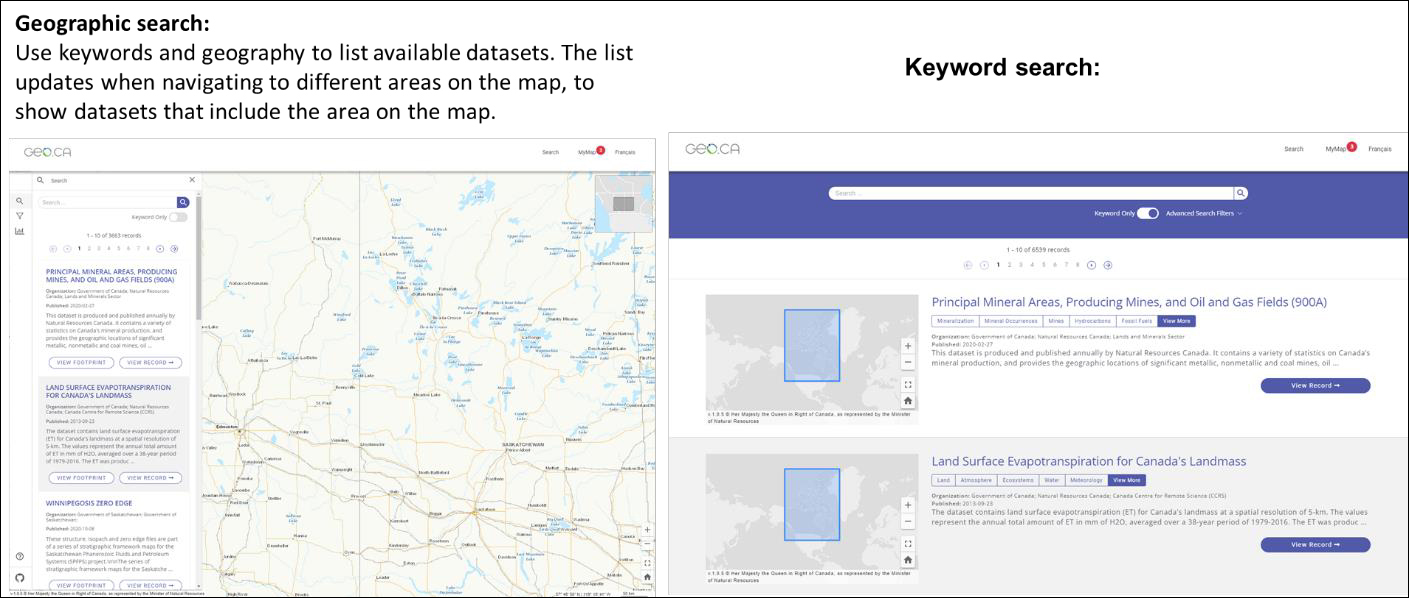
A pair of screenshots represent the geographic and keyword searches
A figure shows two screenshots from the Geo dot C 'A' website. The geographic search and keyword search are shown in the two screenshots. In the geographic search, use keywords and geography to list available datasets. The list updates when navigating to different areas on the map, to show datasets that include the area on the map. The map shows the areas such as Winnipeg and Regina marked by encircled stars. Other important regions are marked by dots. The area names and the links to each area are given. Links to principal mineral areas, land surface evapotranspiration for Canada's landmass, and winnipegosis zero edge are given in the search results. Rail roads and other roadways connecting the important regions are marked out in the map. Three search results and the map are shown. The scale, Global positioning coordinates, zoom in, zoom out buttons, home, and full screen buttons are present at the bottom-right corner. The keyword search page lists the links to principal mineral areas and land surface evapotranspiration for Canada's landmass. View record button is present at the bottom-right corner of each link. Search button is present at the top-center of the page. Search, My map, and francas are the navigation menu buttons which appear at the top-right corner. The keyword only toggle button below the search box is selected in the keyword search page.
Participants saw the value in both search options and could potentially see themselves using both in different circumstances, depending on their needs.
User support and communication material
Industry participants were interested in a variety of help-related tools and resources. They mentioned wanting to have a clear overview of what the site was about, along with a glossary of terms. As well, the ability to reach out for questions or feedback was appreciated, whether that be a phone number, online chat (live or chat bot), webmaster contact, or how-to video tutorials.
There was also some interest in receiving email updates about topics they were interested in. However, it would be important that they could opt-in to topics that were pertinent to them, that the communication would stay focused on that only, and would not be too frequent.
Some also said they would be interested in receiving an alert when the website was updated with new datasets that would be useful to them – again, under the same conditions as the more general update emails.
Final overview
If the proposed Atlas of Canada succeeds in meeting content and feature expectations, nearly all participants believe they would see themselves using the website although the manner and the frequency of that use would depend from segment to segment.
For many participants in the general public and parent sessions, the use would largely be focused on tourism and travel-related activities. They would like to use the atlas to plan a trip and to “learn as they go.” Many in these groups would also see themselves using the site out of sheer curiosity – in these situations, participants could not say why or when they would use the site, they just felt that it would be a nice resource to use whenever they wanted to find something out about Canada. There was a sense that this Government of Canada site would be a trusted source for information, and would therefore potentially become a go-to resource.
Some parents saw themselves using the site as a resource to help their children with their schoolwork, especially younger children. Some also saw it as a way to help their children learn more about Canada in general. That said, parents of high school age children were not convinced that their child would go on this site unless they were required to do so for a project or coursework or unless their teacher pointed them to it as part of their lessons. Focus groups with students revealed similar sentiments among post-secondary students who might use the site for travel-related purposes if they were not using it for a specific course.
Of note, some participants having immigrated to Canada, as well as educators who teach (mainly) newcomers, saw the site as a potentially interesting way for them to learn more about their new country.
Educators seemed quite convinced they would want to leverage the Atlas of Canada in their classroom. Educators would use the site on an ongoing basis if the site content were nicely linked to the curriculum so that they could see how it could support them across different courses or across different segments of a specific course. Educators would also use the site regularly if the site was constantly evolving and adding new content, resources and features, updates which some would gladly learn of through an email notification feature. Updated data and information was seen as key to this. As well this group said it was important to link the content to the daily lives of students and to create or find connections with them and to the world they see around them. Linking the past to this present was also seen as something the Atlas should strive to do.
Some suggested that the creators of the Atlas of Canada look at similar websites from across the world and get ideas of what works there. Industry participants in particular mentioned this, pointing to the geo.be website as one example, and to websites from the U.S. or UK that they were familiar with. As well, some emphasized the need for user-testing among a variety of audiences to ensure it would be functioning optimally and become a go-to-resource for all things geography rather than a frustrating or disappointing experience that would lead to one-time visits. In terms of design, the idea that the Government of Canada should step outside of its usual template and its standard approaches was emphasized as well. In order to ensure a user-friendly and engaging experience, the Government would have to step outside of its “comfort zone.”
Some industry participants would see themselves using the site for professional as well as for personal reasons. They saw it as an additional tool to resources they may already use, especially if it would be integrated. It would also likely become a go-to for them if it would eliminate the need to find and amalgamate information from a variety of sources. They were very interested in having access to data and being able to manipulate it online directly on the website. This was seen as a priority over the option to download the data, which they felt may result in a lot of data that might be slow to download and process on their own systems, and that they would likely only have to use once.
Detailed Methodology
The research methodology consisted of 15 online focus groups with individuals from various regions across the country. Research was conducted between February 20 and March 2, 2023. A total of 104 individuals participated across the focus groups.
Quorus was responsible for coordinating all aspects of the research project including designing and translating the recruitment screener and the moderation guide, coordinating all aspects of participant recruitment, coordinating the online focus group platform and related logistics, moderating all sessions, and delivering required reports at the end of data collection.
Target audience and sample frame
The target audience consisted of the following segments:
General Population: Those with an interest or need for Geospatial Web Content.
Parents: Those with at least one child attending secondary school.
Students: College, CEGEP and/or University students with a personal or academic interest in topics/issues/resources/content related to geospatial web content.
Educators: Those working at the high school level through to post-secondary who teach a topic involving or relevant to geospatial web content.
Industry: Those working in relevant industries including mining, forestry, environmental, energy, etc.
In the design of the recruitment screener, specific questions were inserted to clearly identify whether participants qualified for the research program, and to ensure, where applicable, a good representation of age and gender. Efforts were made to recruit members of visible minorities in all groups.
In addition to the general participant profiling criteria noted above, additional screening measures to ensure quality respondents include the following:
No participant (nor anyone in their immediate family or household) was recruited who worked in the government, whether federal, provincial or municipal, nor in advertising or graphic design, marketing research, public relations, or the media (radio, television, newspaper, film/video production, etc.).
No participant acquainted with another participant was knowingly recruited for the same study, unless they were recruited into separately scheduled sessions.
No participant was recruited who had attended a qualitative research session within the past six months.
No participant was recruited who had attended five or more qualitative research sessions in the past five years.
No participant was recruited who had attended a qualitative research session on the same general topic as defined by the research team in the past two years.
Description of data collection procedures
Data collection consisted of 15 online focus groups, each lasting approximately 90 minutes in duration.
Before participating in the sessions, participants were required to complete a pre-task which involved reviewing three websites containing geographical information and completing a short survey to share their thoughts. The email scripts and pre-task questionnaires can be found in the appendices.
For each session, Quorus recruited eight participants to achieve six to eight participants per focus group. Recruited participants were offered an honorarium of $125 for their participation.
Participants invited to participate in the focus groups were recruited by telephone from the through random digit dialing of the general public as well as through the use of a proprietary opt -in database.
The recruitment of focus group participants followed the screening, recruiting and privacy considerations as set out in the Standards for the Conduct of Government of Canada Public Opinion Research–Qualitative Research. Furthermore, recruitment respected the following requirements:
All recruitment was conducted in the participant’s official language of choice, English and French, as appropriate.
Upon request, participants were informed on how they can access the research findings.
Recruitment confirmed each participant had the ability to speak, understand, read and write in the language in which the session was to be conducted.
Participants were informed of their rights under the Privacy and Access to Information Acts and ensure that those rights were protected throughout the research process. This included: informing participants of the purpose of the research, identifying both the sponsoring department or agency and research supplier, informing participants that the study will be made available to the public in 6 months after field completion through Library and Archives Canada, and informing participants that their participation in the study is voluntary and the information provided will be administered according to the requirements of the Privacy Act.
At the recruitment stage and at the beginning of each focus group, participants were informed that the research was for the Government of Canada/Natural Resources Canada. Participants were also informed of audio/video recording of the focus group sessions, in addition to the presence of NRCan observers. Quorus ensured that prior consent was obtained at the recruitment stage and before participants participated in the online groups.
The online focus groups were held using the Zoom online platform that allowed the client team to observe the sessions. Across all focus groups, a total of 104 individuals participated. All focus groups were moderated by senior Quorus researchers.
The websites and concepts tested were provided by NRCan in both official languages.
The locations, attendance, language and dates for the online focus groups are presented in the grid below:
| Location | Segment | Language | Participants | Date (2023) |
|---|---|---|---|---|
| Ontario (Urban) | General Population (18+) | English | 6 | February 20 |
| Manitoba / Saskatchewan / Alberta / Territories (Rural) | General Population (18+) | English | 6 | February 20 |
| Quebec (Urban) | General Population (18+) | French | 5 | February 21 |
| Quebec | Students (18+) | French | 5 | February 21 |
| Manitoba / Saskatchewan / Alberta / Territories | Students (18+) | English | 7 | February 22 |
| British Columbia | Students (18+) | English | 7 | February 22 |
| Atlantic Canada (Rural) | Parents | English | 8 | February 23 |
| Quebec (Urban) | Parents | English | 8 | February 27 |
| Alberta (Urban) | Parents | English | 8 | February 27 |
| Atlantic Canada | Educators | English | 8 | February 28 |
| British Columbia | Educators | English | 8 | February 28 |
| Quebec | Educators | French | 8 | March 1 |
| Manitoba / Saskatchewan / Alberta | Educators | English | 7 | March 1 |
| National | Industry | English | 7 | March 2 |
| Ontario (Rural) | Parents | English | 6 | March 2 |
| - | - | - | 104 | - |
Qualitative research disclaimer
Appendices
Appendix A: Recruitment screener for general population, students, parents and educators
Specifications (for the general population, students, parents and educators)
Recruit 8 participants per group, for 6 to 8 to show
Participants to be paid $125
Efforts will be made to recruit members of racialized communities in all groups
Efforts will aim for approximately 8 to 10 members of Indigenous communities across all groups
15 online focus groups will be segmented based on 5 unique target audiences:
General Population: Those with an interest or need for Geospatial Web Content. Quorus will work with the client team to create a practical list of topics and resources to which members of the general public can relate to assess relevance of the content for this target audience.
Parents: Those with at least one child attending secondary school.
Students: College, CEGEP and/or University students with a personal or academic interest in topics/issues/resources/content related to geospatial web content.
Educators: Those working at the high school level through to post-secondary who teach a topic involving or relevant to geospatial web content.
Industry*: Those working in relevant industries including mining, forestry, environmental, energy, etc. Quorus will work with the client team to identify a final list of specific industry verticals and linking them to NAICS codes so that targeted lists can be used for recruitment purposes.
*A separate screener will be provided for recruiting industry participants
Locations of focus groups will differ by segment but will consist of:
Ontario
Quebec
Manitoba / Saskatchewan / Alberta / Territories
Atlantic Canada
British Columbia
National (for industry group)
All times are stated in local area time unless specified otherwise.
| Group 1 | Group 2 | Group 3 | Group 4 |
| Ontario (Urban) | Manitoba / Saskatchewan / Alberta / Territories (Rural) | Quebec (Urban) | Quebec |
| February 20 5:00 pm EST GenPop (18+) | February 20 6:00 pm CST GenPop (18+) | February 21 5:00 pm EST GenPop (18+) | February 21 7:00 pm EST Students (18+) |
| Group 5 | Group 6 | Group 7 | Group 8 |
| Manitoba / Saskatchewan / Alberta / Territories | British Columbia | Atlantic Canada (Rural) | Ontario (Rural) |
| February 22 5:00 pm CST Students (18+) | February 22 5:00 pm PST Students (18+) | February 23 6:00 pm AST Parents | February 23 7:00 pm EST Parents |
| Group 9 | Group 10 | Group 11 | Group 12 |
| Quebec (Urban) | Alberta (Urban) | Atlantic Canada | British Columbia |
| February 27 5:00 pm EST Parents | February 27 5:00 pm MST Parents | February 28 5:00 pm AST Educators | February 28 5:00 pm PST Educators |
| Group 13 | Group 14 | ||
| Quebec | Manitoba / Saskatchewan / Alberta | ||
| March 1 5:00 pm EST Educators | March 1 6:00 pm CST Educators |
Questionnaire
A. Introduction
Hello/Bonjour, my name is [NAME] and I am with Quorus Consulting Group, a national public opinion research company. We’re planning a series of online discussion groups on behalf of the Government of Canada with people in your area. Would you prefer to continue in English or French? / Préférez-vous continuer en anglais ou en français?
[INTERVIEWER NOTE: FOR ENGLISH GROUPS, IF PARTICIPANT WOULD PREFER TO CONTINUE IN FRENCH, PLEASE RESPOND WITH, “Malheureusement, nous recherchons des gens qui parlent anglais pour participer à ces groupes de discussion. Nous vous remercions de votre intérêt.” FOR FRENCH GROUPS, IF PARTICIPANT WOULD PREFER TO CONTINUE IN ENGLISH, PLEASE RESPOND WITH, “Unfortunately, we are looking for people who speak French to participate in this discussion group. We thank you for your interest.”]
[INTERVIEWER NOTE 2: IF SOMEONE IS ASKING TO PARTICIPATE IN FRENCH/ENGLISH BUT NO GROUP IN THIS LANGUAGE IS AVAILABLE IN THIS AREA, TALK TO YOUR SUPERVISOR. EFFORTS WILL BE MADE TO INCLUDE THEM IN A GROUP IN THEIR PREFERRED LANGUAGE IN THE NEAREST TIME ZONE TO WHERE THEY LIVE. ONE-ON-ONE INTERVIEWS CAN ALSO BE ACCOMMODATED AS THE NEED ARISES.]
As I was saying – we are planning a series of online discussion groups on behalf of the Government of Canada with people in your area. The research will focus on getting your reactions to various online resources being designed. The groups will last up to 90 minutes (one and a half hours) and people who take part will receive a cash gift to thank them for their time.
Participation is completely voluntary. We are interested in your opinions. No attempt will be made to sell you anything or change your point of view. The format is a group discussion held using the online web conferencing platform Zoom, led by a research professional with about six to eight other participants invited the same way you are being invited. The use of a computer or a tablet (not a smartphone) in a quiet room is necessary for participation, as the moderator will be gauging reactions to concepts and materials. All opinions will remain anonymous and will be used for research purposes only in accordance with laws designed to protect your privacy.
[INTERVIEWER NOTE: IF ASKED ABOUT PRIVACY LAWS, SAY: “The information collected through the research is subject to the provisions of the Privacy Act, legislation of the Government of Canada, and to the provisions of relevant provincial privacy legislation.”]
Before we invite anyone to attend, we need to ask you a few questions to ensure that we get a good mix of people in each of the groups. This will take 5 minutes. May I continue?
Yes 1 CONTINUE No 2 THANK/DISCONTINUE
B. Qualification
Are you currently enrolled as a college, CEGEP or university student?
Yes 1 No 2 SKIP TO Q4 Are you currently studying one or more of the following subjects? SELECT ALL THAT APPLY
Geography 1 History 2 Political Science 3 Environmental Studies / Science 4 Environmental/Forestry technician 5 Conservation and Biology 6 Geology and Geophysics 7 Social Sciences (e.g., sociology, psychology, criminology) 8 None of the above 9 IF ONE OR MORE OPTIONS BETWEEN 1-8 IS SELECTED, RECRUIT AS STUDENT AND SKIP TO Q8
Do you work as a teacher, professor, or educator in high school, CEGEP, college or university?
Yes – high school 1 Yes – CEGEP 2 Yes – college 3 Yes – university 4 No 5 SKIP TO Q6 Do you teach one or more of the following subjects? SELECT ALL THAT APPLY
Geography 1 History 2 Political Science 3 Environmental Studies / Science 4 Environmental/Forestry technician 5 Conservation and Biology 6 Geology and Geophysics 7 Social Sciences (e.g., sociology, psychology, criminology) 8 None of the above 9 IF ONE OR MORE OPTIONS BETWEEN 1-8 IS SELECTED, RECRUIT AS EDUCATOR AND SKIP TO Q8
Are you a parent with at least one child attending high school?
Yes 1 No 2 An important part of this research involves exploring all the different ways that people use virtual maps and the information they can contain. Some people print maps from the Internet. Others use digital navigation maps in their vehicle or on their cell phones to get around, some use interactive maps when shopping for a new home, some enjoy satellite imagery, including weather maps, and others use interactive maps when they go hiking in a National park. These are just a few of the possibilities.
On a scale of one to ten, generally how interested are you in maps and all the kinds of information that can be mapped out?
Not at all interested
Extremely interested
1 2 3 4 5 6 7 8 9 10 IF Q6=YES AND Q7 = 8, 9, OR 10, RECRUIT FOR PARENT GROUPS
IF Q6=NO AND Q7 = 8, 9, OR 10, RECRUIT FOR GENERAL POPULATION GROUP
We are looking to include people of various ages in the group discussion. May I have your age please? RECORD AGE: ______________
RECRUIT A MIX OF AGES
What is your gender identity? [If you do not feel comfortable disclosing, you do not need to do so] [DO NOT READ LIST]
Male 1 Female 2 Prefer to self-describe, please specify: _____ 3 Prefer not to say 4 AIM FOR 50/50 SPLIT OF MALE AND FEMALE, WHILE RECRUITING OTHER GENDER IDENTITIES AS THEY FALL
We want to make sure we speak to a diversity of people. Do you identify as any of the following? SELECT ONE
An Indigenous person (First Nations, Inuit or Métis) 1 A member of a racialized community (other than an Indigenous person) 2 None of the above 3 RECRUIT MEMBERS OF INDIGENOUS AND RACIALIZED COMMUNITIES ACROSS ALL GROUP
[ASK ONLY IF Q10=2] What is your ethnic background?
RECORD ETHNICITY: ______________
RECRUIT A MIX OF ETHNICITIES
Do you currently live in… [READ LIST]
A city or metropolitan area with a population of at least 100,000 1 A city with a population of 30,000 to 100,000 2 A city or town with a population of 10,000 to 30,000 3 A town or rural area with a population under 10,000 4 TAG AS “URBAN” IF Q12=1 OR 2 / TAG AS RURAL IF Q12>2
UNLESS OTHERWISE INDICATED ON PAGE 2, RECRUIT A MIX OF INDIVIDUALS WHO LIVE IN A CITY OR TOWN WITH A POPULATION OF AT LEAST 30,000 AND THOSE WHO LIVE IN SMALLER TOWNS/RURAL
Do you or does anyone in your immediate family or household work in any of the following areas? [READ LIST]
Yes No A marketing research firm 1 2 A magazine or newspaper, online or print 1 2 A radio or television station 1 2 A public relations company 1 2 An advertising agency or graphic design firm 1 2 An online media company or as a blog writer 1 2 The government, whether federal, provincial or municipal 1 2 IF “YES” TO ANY OF THE ABOVE, THANK/DISCONTINUE
Have you ever attended a discussion group or taken part in an interview on any topic that was arranged in advance and for which you received money for participating?
Yes 1 No 2 GO TO Q18 When did you last attend one of these discussion groups or interviews?
Within the last 6 months 1 THANK & TERMINATE Over 6 months ago 2 Thinking about the groups or interviews that you have taken part in, what were the main topics discussed?
RECORD: _______________
THANK/TERMINATE IF RELATED THANK/TERMINATE IF RELATED TO WEBSITE DESIGN/GEOSPATIAL CONTENT/MAPPING RESOURCES AND TOOLS
How many discussion groups or interviews have you attended in the past 5 years?
Fewer than 5 1 Five or more 2 THANK & TERMINATE Participants in group discussions are asked to voice their opinions and thoughts, how comfortable are you in voicing your opinions in an online group discussion with others your age? Are you… READ OPTIONS
Very comfortable 1 MIN 5 PER GROUP Fairly comfortable 2 Not very comfortable 3 THANK & TERMINATE Very uncomfortable 4 THANK & TERMINATE Do you have access to a stable internet connection, capable of sustaining a 90-minute online video conference?
Yes 1 No 2 THANK & TERMINATE Participants will be asked to provide their answers through an online web conferencing platform using a computer or a tablet (not a smartphone) in a quiet room. It is necessary for participation, as the moderator will be gauging reactions to advertising concepts and materials. Is there any reason why you could not participate? (No access to computer or tablet, internet, etc.) If you need glasses to read or a device for hearing, please remember to wear them.
Yes 1 No 2 SKIP TO INVITATION Is there anything we could do to ensure that you can participate?
Yes 1 No 2 THANK AND TERMINATE DK/NR 9 THANK AND TERMINATE What specifically? [OPEN END]
INTERVIEWER TO NOTE FOR POTENTIAL ONE-ON-ONE INTERVIEW
RECRUITER NOTE: WHEN TERMINATING AN INTERVIEW, SAY: “Thank you very much for your cooperation. We are unable to invite you to participate because we have enough participants who have a similar profile to yours.”
C. INVITATION TO PARTICIPATE
I would like to invite you to participate in an online focus group session where you will exchange your opinions in a moderated discussion with other Canadians in your region. The discussion will be led by a researcher from the national public opinion research firm, Quorus Consulting. The session will be recorded but your participation will be confidential. The group will be hosted using an online web conferencing platform, taking place on [DAY OF WEEK], [DATE], at [TIME]. It will last 90 minutes (one and a half hours). People who attend will receive $125 to thank them for their time.
As part of this study, we are asking participants to quickly explore three websites and to answer a very short online survey regarding those websites. This should take you no more than 15 to 20 minutes to complete, however this must be done before you participate in your focus group. We will send you an email with the links to each of the three websites as well as the link to the online survey.
Would you be interested in taking part in this study?
Yes 1 No 2 THANK & TERMINATE The discussion group will be video-recorded. These recordings are used to help with analyzing the findings and writing the report. The results from the discussions will be grouped together in the research report, which means that individuals will not be identified in anyway. Neither your name nor your specific comments will appear in the research report. Is this acceptable?
Yes 1 No 2 THANK & TERMINATE There will be some people from Natural Resources Canada and/or the Government of Canada, and other individuals involved in this project observing the session. They will not take part in the discussion and they will not know your name. Is this acceptable?
Yes 1 No 2 THANK & TERMINATE Thank you. Just to make sure, the group will take place on [DAY OF WEEK], [DATE], at [TIME] and it will last 90 minutes (one and a half hours). Following your participation, you will receive $125 to thank you for your time. Are you interested and available to attend?
Yes 1 No 2 THANK & TERMINATE
To conduct the session, we will be using a screen-sharing application called Zoom. We will need to send you by email the instructions to connect. The use of a computer or tablet (not a smartphone) in a quiet room is necessary since the moderator will want to show material to participants to get their reactions – that will be an important part of the discussion.
We recommend that you click on the link we will send you a few days prior to your session to make sure you can access the online meeting that has been setup and repeat these steps at least 10 to 15 minutes prior to your session.
As we are only inviting a small number of people to attend, your participation is very important to us. If for some reason you are unable to attend, you cannot send someone to participate on your behalf - please call us so that we can get someone to replace you. You can reach us at [INSERT NUMBER] at our office. Please ask for [INSERT NAME].
So that we can contact you to remind you about the focus group or in case there are any changes, can you please confirm your name and contact information for me? [READ INFO AND CHANGE AS NECESSARY.]
First name ______________________________________________________
Last Name ______________________________________________________
Email __________________________________________________________
Day time phone number ___________________________________________
Night time phone number __________________________________________
Thank you!
If the respondent refuses to give his/her first or last name or phone number please assure them that this information will be kept strictly confidential in accordance with the privacy law and that it is used strictly to contact them to confirm their attendance and to inform them of any changes to the focus group. If they still refuse THANK & TERMINATE.
Appendix B: Recruitment screener for industry
Specifications (for industry participants)
Recruit 8 participants per group, for 6 to 8 to show
Participants to be paid $200
One online focus group with the following audience:
Industry: Those operating in relevant industries, with a focus on the following:
Environmental Consulting
Land Resources Management
Urban Planning
Exploration Geophysicists / Geologists
Emergency Operations
Program and Policy Analyst
Insurance / Legal (Risks)
GIS developers
Session will be in English
Participants will be recruited from across Canada
Date and time:
Group 15
Industry (national representation)
March 2
1:00 pm EST
Questionnaire
A. Introduction
Hello, my name ________________. I’m calling from Quorus Consulting, a Canadian public opinion research company and we are calling on behalf of Natural Resources Canada.
Would you prefer to continue in English or French? / Préférez-vous continuer en anglais ou en français?
[INTERVIEWER NOTE: FOR ENGLISH GROUPS/INTERVIEWS, IF PARTICIPANT WOULD PREFER TO CONTINUE IN FRENCH, PLEASE RESPOND WITH, “Malheureusement, nous recherchons des gens qui parlent anglais pour participer à cette recherche. Nous vous remercions de votre intérêt.”]
From time to time, we solicit opinions by sitting down and talking with people. We are preparing to conduct a series of these discussions on behalf of Natural Resources Canada and I would like to speak to someone in your company who uses geospatial content in the work they do. This would include using digital maps and mapping resources to research or analyze data. Examples might include using satellite imagery, geology data, weather maps, urban planning maps, land resource management, so on and so forth. Is there a person available who fits that description?
ONCE APPROPRIATE CONTACT HAS BEEN REACHED – REPEAT INTRO IF NEEDED AND CONTINUE:
We are reaching out to you today to invite you to a research session to get your feedback on a website and online tools that Natural Resources Canada is redesigning. The focus will be on the different ways that industry uses geospatial content – in other words, how organizations like yours use maps, especially virtual maps, and the data they can contain or communicate.
Up to seven other individuals representing a range of industries located across Canada will be taking part in your online group discussion which will be conducted during daytime on a weekday. It is a first-name basis only discussion so nobody, including the Government of Canada, will know the companies or organizations being represented. For their time, participants will receive a cash compensation.
Participation is voluntary and all opinions will remain anonymous and will be used for research purposes only in accordance with laws designed to protect your privacy, including the Privacy Act and the Access to Information Act. We are simply interested in hearing your opinions, no attempt will be made to sell you anything. The format will be an online “round table” discussion lead by a research professional.
[INTERVIEWER NOTE: IF ASKED ABOUT PRIVACY LAWS, SAY: “The information collected through the research is subject to the provisions of the Privacy Act, legislation of the Government of Canada, and to the provisions of relevant provincial privacy legislation.”]
But before we invite you to attend, we need to ask you a few questions to ensure that we get a good mix/variety of businesses. This should only take about 5 minutes. May I ask you a few questions?
| Yes | 1 | CONTINUE |
| No | 2 | THANK & TERMINATE |
B. Qualification
In your current role, do you use hardcopy or online maps for any of the following at least a few times per month: READ LIST – ACCEPT ALL THAT APPLY
Environmental Consulting 1 Land Resources Management 2 Urban Planning 3 Geology or geophysics-related exploration 4 Emergency Operations 5 Program and Policy Analysis 6 Insurance or legal-related purposes, for instance risk-assessment 7 Geographic information system development 8 None of the above 9 Do you use maps or geospatial content for any other purposes at least a few times per month?
Yes – please explain:________________________________________ 1 No 2 IF Q1=9 AND Q2=2, THANK AND TERMINATE
In which industry or sector does your company operate? If you are active in more than one sector, please identify the main sector. DO NOT READ LIST. ACCEPT ONLY ONE RESPONSE. CONFIRM RESULT WITH RESPONDENT AS NECESSARY. RECRUIT A MIX.
Agriculture/Forestry
Oil/Gas/Mining/Alternative Energy
Utilities
Construction
Transportation
Finance and Insurance
Professional, Scientific and Technical Services / IT / Computers
Emergency services
Government (municipal, provincial/territorial/federal)
Other (specify):_________________________
Can you please provide me with your job title? _____________________________________
Where in Canada is your company located? _____________________________________________
AIM FOR A MIX ACROSS CANADA ON A BEST EFFORT BASIS
Participants in discussion groups or interviews are asked to voice their opinions and thoughts, how comfortable are you in voicing your opinions in front of others? Are you… READ OPTIONS
Very comfortable 1 MIN 5 PER GROUP Fairly comfortable 2 Not very comfortable 3 TERMINATE Not at all comfortable 4 TERMINATE Have you ever attended a discussion group or taken part in an interview on any topic that was arranged in advance and for which you received money for participating?
Yes 1 No 2 GO TO Q10 When did you last attend one of these discussion groups or interviews?
Within the last 6 months 1 THANK & TERMINATE Over 6 months ago 2 How many discussion groups or interviews have you attended in the past 5 years?
Fewer than 5 1 Five or more 2 THANK & TERMINATE Participants will be asked to provide their answers through an online web conferencing platform using a computer or a tablet (not a smartphone) in a quiet room. It is necessary for participation, as the moderator will be gauging reactions to advertising concepts and materials. Is there any reason why you could not participate? (No access to computer or tablet, internet, etc.) If you need glasses to read or a device for hearing, please remember to wear them.
Yes 1 No 2 SKIP TO INVITATION Is there anything we could do to ensure that you can participate?
Yes 1 No 2 THANK AND TERMINATE DK/NR 9 THANK AND TERMINATE What specifically? [OPEN END]
INTERVIEWER TO NOTE FOR POTENTIAL ONE-ON-ONE INTERVIEW
RECRUITER NOTE: WHEN TERMINATING AN INTERVIEW, SAY: “Thank you very much for your cooperation. We are unable to invite you to participate because we have enough participants who have a similar profile to yours.”
C. INVITATION TO PARTICIPATE
I would like to invite you to participate in an online focus group session where you will exchange your opinions in a moderated discussion with individuals from a range of industries. The discussion will be led by a researcher from the national public opinion research firm, Quorus Consulting. The session will be recorded but your participation will be confidential. The group will be hosted using an online web conferencing platform, taking place during the day on Thursday, March 2, at 1 pm EST. It will last 90 minutes (one and a half hours). People who attend will receive $200 to thank them for their time.
As part of this study, we are asking participants to quickly explore three websites and to answer a very short online survey regarding those websites. This should take you no more than 15 to 20 minutes to complete, however this must be done before you participate in your focus group. We will send you an email with the links to each of the three websites as well as the link to the online survey.
Would you be interested in taking part in this study?
Yes 1 No 2 THANK & TERMINATE The discussion group will be video-recorded. These recordings are used to help with analyzing the findings and writing the report. The results from the discussions will be grouped together in the research report, which means that individuals will not be identified in anyway. Neither your name nor your specific comments will appear in the research report. Is this acceptable?
Yes 1 No 2 THANK & TERMINATE There will be some people from Natural Resources Canada and/or the Government of Canada, and other individuals involved in this project observing the session. They will not take part in the discussion and they will not know your name. Is this acceptable?
Yes 1 No 2 THANK & TERMINATE Thank you. Just to make sure, the group will take place on Thursday, March 2, at 1 pm EST and it will last 90 minutes (one and a half hours). Following your participation, you will receive $200 to thank you for your time. Are you interested and available to attend?
Yes 1 No 2 THANK & TERMINATE
To conduct the session, we will be using a screen-sharing application called Zoom. We will need to send you by email the instructions to connect. The use of a computer or tablet (not a smartphone) in a quiet room is necessary since the moderator will want to show material to participants to get their reactions – that will be an important part of the discussion.
We recommend that you click on the link we will send you a few days prior to your session to make sure you can access the online meeting that has been setup and repeat these steps at least 10 to 15 minutes prior to your session.
As we are only inviting a small number of people to attend, your participation is very important to us. If for some reason you are unable to attend, you cannot send someone to participate on your behalf - please call us so that we can get someone to replace you. You can reach us at [INSERT NUMBER] at our office. Please ask for [INSERT NAME].
So that we can contact you to remind you about the focus group or in case there are any changes, can you please confirm your name and contact information for me? [READ INFO AND CHANGE AS NECESSARY.]
First name ______________________________________________________
Last Name ______________________________________________________
Email __________________________________________________________
Day time phone number ___________________________________________
Night time phone number __________________________________________
Thank you!
If the respondent refuses to give his/her first or last name or phone number please assure them that this information will be kept strictly confidential in accordance with the privacy law and that it is used strictly to contact them to confirm their attendance and to inform them of any changes to the focus group. If they still refuse THANK & TERMINATE.
Appendix C: Pre-task for Students, Parents, Educators and the General Population
Email script
Subject line: Your NRCan Focus Group Warm-up Exercise
Hello [INSERT PARTICIPANT FIRST NAME],
Thank you again for your interest in participating in a focus group for Natural Resources Canada!
As we explained when we invited you to participate in the group, the research team would like focus group participants to explore a few websites and answer a few quick questions in preparation for their session.
This should take you no more than 15 to 20 minutes. You can complete this task at any time insofar as it is done before you attend your focus group.
Step 1: To get started, visit the three websites listed below. Spend no more than about 5 minutes browsing each website. While you are exploring, make note of any content, features or resources that catch your eye or that you find especially useful!
Canadian Geographic’s Indigenous Peoples Atlas of Canada:
Climate Atlas of Canada:
Crown-Indigenous Relations and Northern Affairs Canada Map Room:
Step 2: Once you have finished exploring all three websites, complete this short online survey [if you cannot click on this link, copy and paste the link into your browser]: [INSERT LINK TO ONLINE SURVEY]
That’s it! Please let us know if you have any problems accessing any of the websites or if you have trouble accessing or completing the short online survey.
Thank you once again and we look forward to your participation in your focus group.
The Quorus Consulting Team
Online survey
[Landing page text] Thank you for visiting the websites – this short survey will help us understand a few of the strengths and weaknesses of these sites. This should take you about 5 minutes to complete – we look forward to your feedback!
Can you please enter your first name: ________________
Which of the three websites did you enjoy the most?
Canadian Geographic’s Indigenous Peoples Atlas of Canada 1 Climate Atlas of Canada 2 Crown-Indigenous Relations and Northern Affairs Canada Map Room 3 Help us understand what made that website the most enjoyable for you?

Considering all three websites, please describe any content, features or resources that you particularly enjoyed or that you found especially useful?
Considering all three websites, was there anything that you particularly disliked?
Thank you for completing this survey – we look forward to meeting you in your focus group!
Appendix D: Pre-task for industry
Email script
Subject line: Your NRCan Focus Group Warm-up Exercise
Hello [INSERT PARTICIPANT FIRST NAME],
Thank you again for your interest in participating in a focus group for Natural Resources Canada!
As we explained when we invited you to participate in the group, the research team would like focus group participants to explore a few websites and answer a few quick questions in preparation for their session.
This should take you no more than 15 to 20 minutes. You can complete this task at any time insofar as it is done before you attend your focus group.
Step 1: To get started, visit the three websites listed below. Spend no more than about 5 minutes browsing each website. While you are exploring, make note of any content, features or resources that catch your eye or that you find especially useful!
Climate Atlas of Canada:
Crown-Indigenous Relations and Northern Affairs Canada Map Room:
Belgium geo.be:
Step 2: Once you have finished exploring all three websites, complete this short online survey [if you cannot click on this link, copy and paste the link into your browser]: [INSERT LINK TO ONLINE SURVEY]
That’s it! Please let us know if you have any problems accessing any of the websites or if you have trouble accessing or completing the short online survey.
Thank you once again and we look forward to your participation in your focus group.
The Quorus Consulting Team
Online Survey
[Landing page text] Thank you for visiting the websites – this short survey will help us understand a few of the strengths and weaknesses of these sites. This should take you about 5 minutes to complete – we look forward to your feedback!
Can you please enter your first name: ________________
Which of the three websites did you enjoy the most?
Climate Atlas of Canada 1 Crown-Indigenous Relations and Northern Affairs Canada Map Room 2 Belgium geo.be 3 Help us understand what made that website the most enjoyable for you?
Considering all three websites, please describe any content, features or resources that you particularly enjoyed or that you found especially useful given your use of maps in the work you do?
Considering all three websites, was there anything that you particularly disliked?
These three websites showcase different ways that geospatial (location-based) content can be presented online. Given the work you do with maps and geospatial content, what other websites would you recommend that feature useful tools, resources or ways of presenting geospatial content?
Thank you for completing this survey – we look forward to meeting you in your focus group!
Appendix E: Moderation guide for the general population, students, parents and educators
Introduction to Procedures (10 minutes)
Thank you all for joining this online focus group!
Introduce moderator/firm and welcome participants to the focus group.
Thanks for attending.
My name is [INSERT MODERATOR NAME] and I work with Quorus Consulting, and we are conducting research on behalf of the Government of Canada, and more specifically Natural Resources Canada.
Today we will be talking about maps and all things related to geospatial content, in other words connecting information to geography.
The discussion will last approximately 90 minutes.
If you have a cell phone or other electronic device, please turn it off.
Describe focus group.
A discussion group is a “round table” discussion, meaning we will discuss something and everyone has an equal chance to express an opinion. We may also be asking you to answer survey questions from time to time to help guide the discussion.
My job is to facilitate the discussion, keeping us on topic and on time.
Your job is to offer your opinions on the topics I’ll be presenting to you tonight/today.
Your honest opinion is valued. There are no right or wrong answers. This is not a knowledge test.
Everyone’s opinion is important and should be respected.
We want you to speak up even if you feel your opinion might be different from others. Your opinion may reflect that of other consumers.
To participate in this session, please make sure your webcam and your microphone are on and that you can hear me clearly. If you are not speaking, I would encourage you to mute your line to keep background noise to a minimum…just remember to remove yourself from mute when you want to speak!
We might use the chat function. [MODERATOR EXPLAINS HOW TO ACCESS THE ZOOM CHAT FEATURE DEPENDING ON THE DEVICE THE PARTICIPANT IS USING]. Let’s do a quick test right now - please open the chat window and send the group a short message (e.g., Hello everyone). If you have an answer to a question and I don’t get to ask you specifically, please type your response in there. We will be reviewing all chat comments at the completion of this project.
Explanations.
Please note that anything you say during these groups will be held in the strictest confidence. We do not attribute comments to specific people. Our report summarizes the findings from the groups but does not mention anyone by name. Please do not provide any identifiable information about yourself.
The final report for this session, and others, can be accessed through the Library of Parliament or Library and Archives Canada’s website once it’s posted.
Your responses will in no way affect your dealings with the Government of Canada.
The session is being audio-video recorded for report writing purposes / verify feedback.
Some of my colleagues involved in this project are watching this session and this is only so they can hear the comments first-hand.
Please note that I am not an employee of the Government of Canada and may not be able to answer questions about what we will be discussing. If questions do come up over the course of the group, we will try to get answers for you before we wrap up the session.
Any questions?
Introductions (5 minutes)
Section 1: Exploring the concept of an atlas (30 minutes)
As a warm-up, let’s discuss the idea of an atlas.
What do you think of when you hear the word “atlas”? What comes to mind?
What have been your experiences with atlases?
What about book versions?
What about digital or online versions?
Before participating in this group, we invited you to explore three websites that are examples of digital atlases.
[MODERATOR SHARES SPECIFIC WEBSITE ONLY AS NEEDED TO REFRESH PARTICIPANTS’ MEMORIES]
Canadian Geographic’s Indigenous Peoples Atlas of Canada:
Climate Atlas of Canada:
Crown-Indigenous Relations and Northern Affairs Canada Map Room:
Generally, what did you think about these digital atlases?
Was there anything you particularly liked about any of the sites you visited? …if we wanted to design a new digital atlas, was there anything in what you explored that you would recommend?
Are any of you aware of or have used a Government of Canada website called “The Atlas of Canada”? [SHOW OF HANDS – CLARIFY AS NEEDED THAT THIS IS NOT THE CLIMATE ATLAS OF CANADA]
Time to put your creative hats on! Let’s imagine we are designing something called “The Atlas of Canada” from scratch.
[MODERATOR OPENS UP A WHITEBOARD SHOWING A GRID WITH TWO COLUMNS TITLED: “CONTENT” AND “FEATURES.” MODERATOR ENTERS RESPONSES AS PARTICIPANTS BRAINSTORM]
What are the types of information you would like to find on this type of website?
What are the types of things you would like to do on this website? AS NEEDED: What features come to mind? …resources? …interactive elements? …anything you would want to download?
In what ways do your expectations of any of this content or resources change, if at all, if this virtual atlas is a Government of Canada website?
Do you have higher expectations of a website that is designed and managed by the Government of Canada?
Section 2: Exploring a thematic approach (5 minutes)
Thank you for all your suggestions! Let’s build on this a bit more – I’d like to run some ideas by you.
The design team has two broad concepts on which they would like your feedback. [MODERATOR SHARES SCREEN TO SHOW THE FOLLOWING]
Concept A: A broad Government of Canada website dedicated to “all things geography”. Products and Information such as:
Initiatives and Programs – details on:
|
Concept B: A Government of Canada website dedicated entirely to the Atlas of Canada. Key home page themes: - Communication and Transportation - Energy and Economy - Land and Water - People and Places - Weather and Environment |
I know these are just concepts, but based on this information, what would you see as the difference between these two approaches?
What other themes would you want to add to the list under Concept B?
Section 3: Exploring historical content (8 minutes)
Something a digital atlas could also do is link geography with history through what are called historical maps.
Here is an example of a digitized and interactive atlas from 1906 and a few of the maps featured in this resource: https://atlas.gc.ca/flip/1906_Atlas/index-h5.html#page=1
MODERATOR QUICKLY SHOWS THREE MAPS:
Territorial divisions
Transcontinental railways
Density of population, Ontario and Quebec
These were just a few examples. What benefits or use, if any, would you get from having online access to past atlases and historical maps?
What kinds of maps would you be most interested in seeing? EDUCATORS/PARENTS: …what about high school, college or university students – in what kinds of maps would they be most interested?
What would you want to be able to do with those maps? IF NEEDED: …download them? …be interactive? …anything else?
Section 4: Educational and learning material (10 minutes)
[ONLY ASK THIS SECTION TO “EDUCATORS”, “STUDENTS” AND “PARENTS”]
Let’s turn our attention to certain kinds of resources we could find on The Atlas of Canada. Could you see yourself/your students/your child who is in high school using learning-based material and resources?
What would this look like to you?
From past experiences what type of material do you like interacting with?
Here is a quick example of what this could look like:
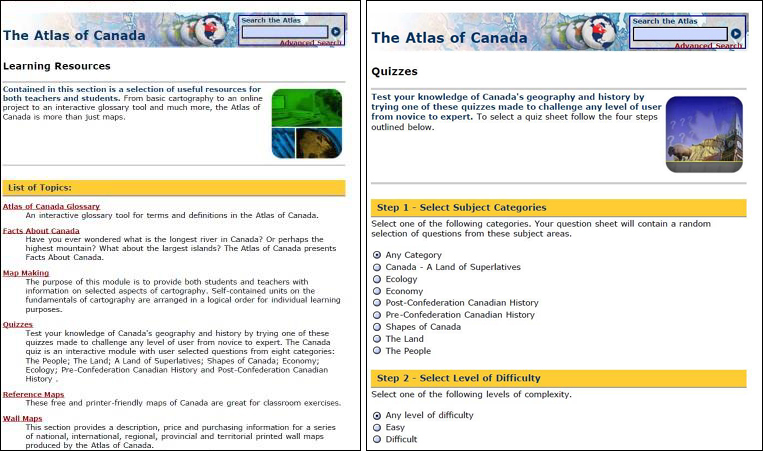
A figure shows two screenshots from the Atlas of Canada website
A pair of screenshots represent the pages from the Atlas of Canada website. The learning resources and list of topics covered are given in the first page. A collage of students learning from the internet are shown in the learning resources section. Search the Atlas box is present at the top-right corner of the pages. The second page shows the details of the quizzes and the two steps. A figure with different symbols and question marks is present within the quizzes section. Radio buttons are provided to select the subject categories in step 1. Radio buttons are provided to select the level of difficulty in step 2.
Does this inspire any new ideas or reactions regarding the types of learning-based material and resources that could be featured on this new site?
Section 5: Presentation of maps in digital content (7 minutes)
Let’s explore a few different ways of presenting maps on a website.
| Example 1 – Standard Interactive Map |
| You can have standard interactive maps that show the data and include a legend describing the symbols, and sometimes data tables. Users can interact a little more with the data shown in the map. |
| https://open.canada.ca/data/en/fgpv_vpgf/0a309f2c-4f11-4ddb-bce1-e7ba6f8c20cf |
| Example 2 – Videos, animations, and infographics |
| This form of presentation typically allows the user to play a video that will show a map on a given theme. There might be text and/or audio describing what is being presented. |
| https://atlas.gc.ca/ette/en/index.html |
| Example 3 – Story map |
| This approach can contain other media such as text, images, videos, alongside a map. The map updates as the “story” progresses to show new information related to what is being presented in the text. Users go through the map and story in their own time but have little interaction with the data displayed in the map. |
| https://maps.canada.ca/journal/content-en.html?lang=en&appid=0e585399e9474ccf932104a239d90652&appidalt=11756f2e3c454acdb214f950cf1e2f7d |
What are your thoughts on these different approaches?
Is there an approach you really don’t like?
Do you have any concerns with any of the approaches given how you would access maps?
EDUCATORS/PARENTS: Would you have any concerns for how high school, college or university students would access maps?
Section 6: Final overview (10 minutes)
We’ve discussed many possible types of content and features that could be included in an online Atlas of Canada.
Let’s bring back the whiteboard we built earlier in our discussion [MODERATOR RETURNS TO WHITEBOARD EXERCISE COMPLETED IN SECTION 1]. Based on what we’ve discussed throughout the session, what else, if anything, would you like to add to the “content” column or the “features” column?
Based on our discussion…
SHOW OF HANDS: How many of you here would see yourselves using a website like this? …help me understand how and for what purpose you would see yourself using it.
What, if anything, would motivate you the most to use this type of website? What stood out for you as a potentially useful or interesting element?
Section 7: Access to data (3 minutes) [Educators/Students]
Beyond seeing and interacting with the maps at a high level, how many of you here would want to access the data so that you could conduct your own analysis?
Would you want different ways to analyze and manipulate data within the website or would you want an option to download data to conduct your own analysis?
Thanks again! The team that invited you to participate in this session will contact you regarding the manner in which you can receive the incentive we promised you.
Thank you – have a nice evening!
Appendix F: Moderation guide for industry participants
Introduction to Procedures (5 minutes)
Thank you all for joining this online focus group!
Introduce moderator/firm and welcome participants to the focus group.
Thanks for attending.
My name is [INSERT MODERATOR NAME] and I work with Quorus Consulting, and we are conducting research on behalf of the Government of Canada, and more specifically Natural Resources Canada.
Today we will be talking about maps and all things related to geospatial content, in other words connecting information to geography.
The discussion will last approximately 90 minutes.
If you have a cell phone or other electronic device, please turn it off.
Describe focus group.
A discussion group is a “round table” discussion, meaning we will discuss something and everyone has an equal chance to express an opinion. We may also be asking you to answer survey questions from time to time to help guide the discussion.
My job is to facilitate the discussion, keeping us on topic and on time.
Your job is to offer your opinions on the topics I’ll be presenting to you tonight/today.
Your honest opinion is valued. There are no right or wrong answers. This is not a knowledge test.
Everyone’s opinion is important and should be respected.
We want you to speak up even if you feel your opinion might be different from others. Your opinion may reflect that of other consumers.
To participate in this session, please make sure your webcam and your microphone are on and that you can hear me clearly. If you are not speaking, I would encourage you to mute your line to keep background noise to a minimum…just remember to remove yourself from mute when you want to speak!
We might use the chat function. [MODERATOR EXPLAINS HOW TO ACCESS THE ZOOM CHAT FEATURE DEPENDING ON THE DEVICE THE PARTICIPANT IS USING]. Let’s do a quick test right now - please open the chat window and send the group a short message (e.g., Hello everyone). If you have an answer to a question and I don’t get to ask you specifically, please type your response in there. We will be reviewing all chat comments at the completion of this project.
Explanations.
Please note that anything you say during these groups will be held in the strictest confidence. We do not attribute comments to specific people or to the company/organization for whom you work. Our report summarizes the findings from the groups but does not mention anyone by name. Please do not provide any identifiable information about yourself.
The final report for this session, and others, can be accessed through the Library of Parliament or Library and Archives Canada’s website once it’s posted.
Your responses will in no way affect your dealings with the Government of Canada.
The session is being audio-video recorded for report writing purposes / verify feedback.
Some of my colleagues involved in this project are watching this session and this is only so they can hear the comments first-hand.
Please note that I am not an employee of the Government of Canada and may not be able to answer questions about what we will be discussing. If questions do come up over the course of the group, we will try to get answers for you before we wrap up the session.
Any questions?
Introductions (5 minutes)
INTRODUCTIONS: Something you all have in common is that you use geospatial content in the work you do. Let’s go around and have each of you introduce yourselves and tell us a little bit about the kind of work you do.
Section 1: Exploring the concept of an atlas (30 minutes)
As a warm-up, let’s discuss how organizations like yours use maps, especially virtual maps, and the data they can contain or communicate.
How important are maps and geospatial content in your day-to-day work?
Before participating in this group, we invited you to explore three websites that are examples of digital atlases.
[MODERATOR SHARES SPECIFIC WEBSITE ONLY AS NEEDED TO REFRESH PARTICIPANTS’ MEMORIES]
Climate Atlas of Canada:
Crown-Indigenous Relations and Northern Affairs Canada Map Room:
Belgium geo.be:
Generally, what did you think about these digital atlases?
Was there anything you particularly liked about any of the sites you visited? …if we wanted to design a new digital atlas, was there anything in what you explored that you would recommend?
Are any of you aware of or have used a Government of Canada website called “The Atlas of Canada”? [SHOW OF HANDS – CLARIFY AS NEEDED THAT THIS IS NOT THE CLIMATE ATLAS OF CANADA]
AMONG USERS: In what way(s) did you use the Atlas of Canada? What are your thoughts on that website in the context of the work you do with geospatial content?
Time to put your creative hats on! Let’s imagine we are designing something called “The Atlas of Canada” from scratch.
[MODERATOR OPENS UP A WHITEBOARD SHOWING A GRID WITH TWO COLUMNS TITLED: “CONTENT” AND “FEATURES.” MODERATOR ENTERS RESPONSES AS PARTICIPANTS BRAINSTORM]
What are the types of information you would like to find on this type of website to support you in the work you do?
What are the types of things you would like to do on this website to support you in the work you do? AS NEEDED: What features come to mind? …resources? …interactive elements? …anything you would want to download?
In what ways do your expectations of any of this content or resources change, if at all, if this virtual atlas is a Government of Canada website? Do you have higher expectations of a website that is designed and managed by the Government of Canada?
Section 2: Exploring a thematic approach (10 minutes)
Thank you for all your suggestions! Let’s build on this a bit more – I’d like to run some ideas by you. The design team has two broad concepts on which they would like your feedback. [MODERATOR SHARES SCREEN TO SHOW THE FOLLOWING]
Concept A: A broad Government of Canada website dedicated to “all things geography”. Products and Information such as:
Initiatives and Programs – details on:
|
Concept B: A Government of Canada website dedicated entirely to the Atlas of Canada. Key home page themes: - Communication and Transportation - Energy and Economy - Land and Water - People and Places - Weather and Environment |
I know these are just concepts, but based on this information, what would you see as the difference between these two approaches?
What other themes would you want to add to the list under Concept B?
Section 3: Exploring historical content (5 minutes)
Something a digital atlas could also do is link geography with history through what are called historical maps.
Here is an example of a digitized and interactive atlas from 1906 and a few of the maps featured in this resource: https://atlas.gc.ca/flip/1906_Atlas/index-h5.html#page=1
MODERATOR QUICKLY SHOWS THREE MAPS:
Geology map (east sheet)
Origins of the people, Ontario and Quebec
Density of population, Ontario and Quebec
These were just a few examples. What benefits or use, if any, would you get from having online access to past atlases and historical maps?
What kinds of maps would you be most interested in seeing?
What would you want to be able to do with those maps? IF NEEDED: …download them? …be interactive? …anything else?
Section 4: Access to and searching for data (20 minutes)
Are any of you aware of or have used a Government of Canada website called “GEO.CA”?
AMONG USERS: In what way(s) did you use Geo.ca? What are your thoughts on that website in the context of the work you do with geospatial content?
I’d like to talk a bit more about GEO.CA. Here is the website and a bit of information about it:
Here is the home page [MODERATOR SHARES HOME PAGE AND SCROLLS SLOWLY DOWN FOR PARTICIPANTS TO SCAN IT]: https://geo.ca/home/
Here is a bit of information about GEO.CA [AT THE BOTTOM OF THE HOME PAGE, MODERATOR CLICKS ON “ABOUT US” AND READS TEXT FOUND IN THE BOX AT THE TOP OF THE PAGE, AND THEN THE SHORT TEXT THAT FOLLOWS:
“Helping Canadians harness the full potential of geospatial data, GEO.ca is the result of seven years of collaborative effort between federal, provincial and territorial stakeholders, led by Natural Resources Canada, to bring together authoritative data, leading-edge technology and applications, and open-source software, for a whole-of-government solution to geospatial data discovery and sharing.”
I’d like to get your feedback on a few features related to this website. Beyond seeing and interacting with the maps at a high level, how many of you here would want to access the data so that you could conduct your own analysis?
Would you want different ways to analyze and manipulate data within the website or would you want an option to download data to conduct your own analysis?
When it comes to doing a search on a website containing geospatial content, which of the following two approaches would you prefer? Help me understand your choice.
AS NEEDED: What do you see as some of the benefits and challenges of each option?
MODERATOR TO SHARE WEBSITE ON SCREEN AS NEEDED AND DEMONSTRATE A FEW EXAMPLES (E.G. USING KEYWORD “CANOLA”): https://app.geo.ca/?keyword_only=&theme=&lang=en&foundational=&type=&keyword=
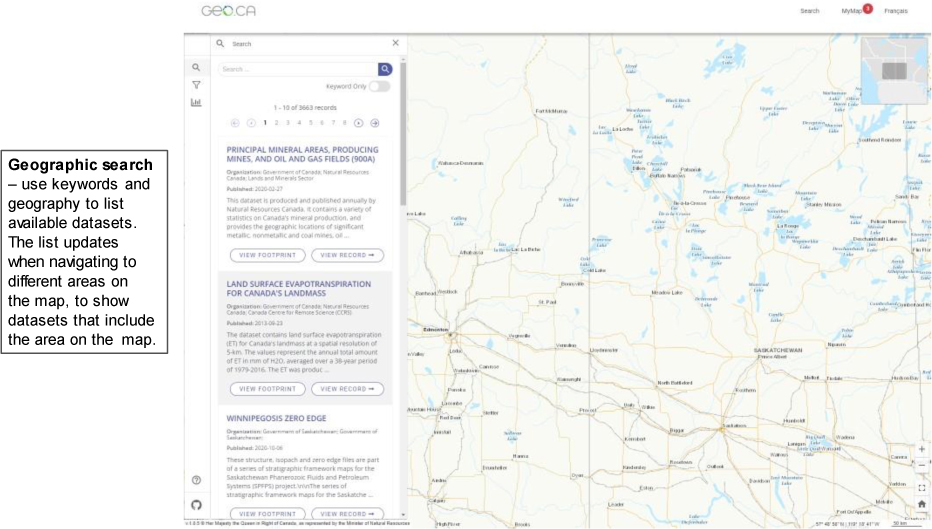
A screenshot illustrates a geographic search in the Geo dot C 'A' website
A screenshot represents a geographic search. The area of the map which is magnified is represented by a box at the top-right corner. The map shows the areas such as Winnipeg and Regina marked by encircled stars. Other important regions are marked by dots. The area names and the links to each area are given. Links to principal mineral areas, land surface evapotranspiration for Canada's landmass, and winnipegosis zero edge are given in the search results. Rail roads and other roadways connecting the important regions are marked out in the map. The search results are opened by clicking the magnifying glass icon. Filter and charts icons are present below the magnifying glass. Help button and another icon are present at the bottom-left corner. A box represents the description for geographic search. Use keywords and geography to list available datasets. The list updates when navigating to different areas on the map, to show datasets that include the area on the map. The scale, Global positioning coordinates, zoom in, zoom out buttons, home, and full screen buttons are present at the bottom-right corner.
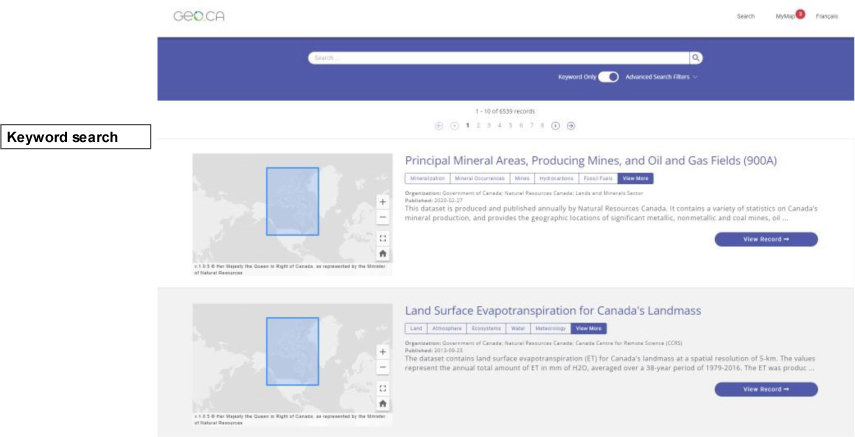
A screenshot represents the keyword search
A screenshot of the Geo dot C 'A' website illustrates a keyword search. The search, my map, and Francas menu buttons are present at the top-right corner. Search button is present at the top-center. The first page of the search result is selected. Links with images of the maps are given in the results. View record button is present in each link. The keyword only toggle button below the search box is selected in the keyword search page. Keywords like mineralization, mineral occurrences, mining, land, atmosphere, ecosystems, water, and more are given below each link.
Section 5: User Support and Communication Material (10 minutes)
Sometimes geospatial content websites have tools and resources to help or support users.
What type of help-related tools or resources, if any, would you consider valuable?
Do you have a preferred format or approach when it comes to accessing support on this type of website (e.g., video tutorials, live chat, telephone number, etc.)?
Would you value resources that could help you learn more about or remain updated on innovations in geospatial-related activities?
What features or topics would you want to learn about?
Do you have a preferred format or approach (e.g., video tutorials, webinars, white papers/articles, etc.)?
Would you want to be kept informed of website content updates? If so, how would you want that to happen?
AS NEEDED: For instance, this could be white papers, articles or news about geospatial-related matters. It could also be notices on the website of recent updates to specific datasets – which is what the Belgian website we invited you to visit does [MODERATOR SHARES SCREEN - https://www.geo.be/home?l=en].
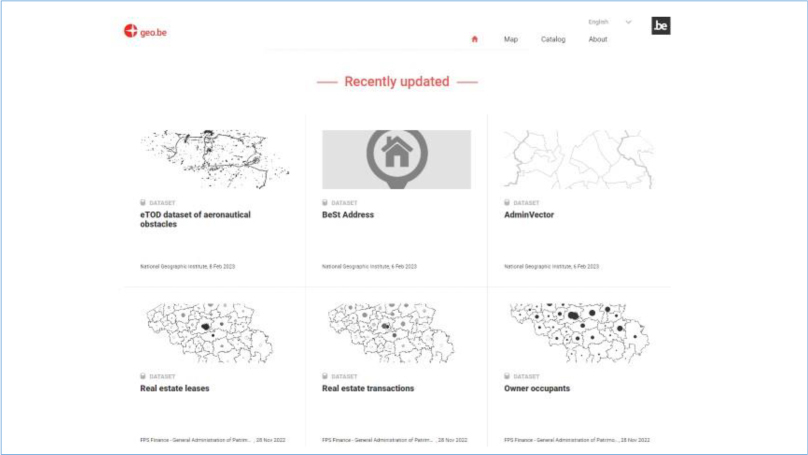
A figure illustrates the recently updated section of the geo dot b e website
A screenshot represents the recently updated section of the home page of the website geo dot b e. Home, Map, catalog, and about menu buttons are present at the top-right corner. English is selected from the language drop-down list box. Links for e TOD dataset of aeronautical obstacles, best address, admin vector, real estate leases, real estate transactions, and owner occupants datasets are given in the recently updated section. The thumbnails of all the datasets except the best address shows different maps. The best address thumbnail shows a home icon. The source links and the date of publishing for each dataset are given.
Section 6: Final overview (10 minutes)
We’ve discussed many possible types of possible content and features related to the Atlas of Canada and to GEO.CA.
Let’s bring back the Atlas of Canada whiteboard we built earlier in our discussion [MODERATOR RETURNS TO WHITEBOARD EXERCISE COMPLETED IN SECTION 1]. Based on what we’ve discussed throughout the session, including any content or features that may have caught your attention in GEO.CA, what else, if anything, would you like to add to the “content” or “features” columns of a new Atlas of Canada?
Based on our discussion…
SHOW OF HANDS: How many of you here would see yourselves using a website like the new Atlas of Canada? …help me understand how and for what purpose you would see yourself using it.
What, if anything, would motivate you the most to use this type of website? What stood out for you as a potentially useful or interesting element?
Thanks again! The team that invited you to participate in this session will contact you regarding the manner in which you can receive the incentive we promised you.
Thank you – have a nice evening!