Psychographic Segmentation of Canadians Regarding COVID-19
Final Report
Prepared for Privy Council Office
Supplier name: Kantar
March 2021
The Privy Council Office (PCO) commissioned Kantar to conduct a public opinion research survey to understand the foundations of the public’s perceptions, behaviours and concerns regarding COVID-19 and develop a segmentation that can be used to inform communication strategies and campaigns for the COVID Alert app and address vaccine hesitancy. This publication reports on the findings of this research.
Cette publication est aussi disponible en français sous le titre: Segmentation psychographique des Canadiens et des Canadiennes en ce qui a trait à la COVID-19
Permission to Reproduce
This publication may be reproduced for non-commercial purposes only. Prior written permission must be obtained from the Privy Council Office. For more information on this report, please contact the PCO at por-rop@pco-bcp.gc.ca or at:
Privy Council Office
Blackburn Building Room 300
85 Sparks Street
Ottawa, ON K1A0A3
Catalogue Number:
CP22-197/2021E-PDF
International Standard Book Number (ISBN):
978-0-660-37869-5
Related publications (registration number: POR 075-20)
Catalogue Number: CP22-197/2021F-PDF (Final Report, French)
ISBN: 978-0-660-37870-1
© Her Majesty the Queen in Right of Canada, as represented by the Privy Council Office, 2021
1.1 Research Purpose and Objectives
1.5 Statement of Political Neutrality
2. Psychographic Segmentation of Canadians Regarding COVID-19
2.5.1 The Concerned – 21% of survey respondents
2.5.2 The Engaged – 29% of survey respondents
2.5.3 The Trusters – 17% of survey respondents
2.5.4 The Stoics – 22% of survey respondents
2.5.5 The Skeptics – 11% of survey respondents
3. Appendix B: English Survey Instrument
4. Appendix C: French Survey Instrument
1. Executive Summary
1.1 Research Purpose and Objectives
In response to the ongoing COVID-19 pandemic, the Privy Council Office (PCO) wanted to develop a psychographic segmentation of Canadians that would fill key knowledge gaps surrounding values-based attitudinal profiles. More specifically, a segmentation would aid PCO in developing an understanding of the relationship between Canadians’ social values and attitudes and Canadians’ perceptions, behaviours, and concerns regarding public health measures, particularly as it concerns the COVID Alert app and vaccination hesitancy.
To this end, the results of this research will be used to complement existing demographic segmentations of the population to fill key knowledge gaps surrounding values-based attitudinal profiles.
The overall objective of the research is to understand the foundation of the public’s perceptions, behaviours and concerns regarding COVID-19. Specific objectives include:
• Segment Canadians in order to inform communication strategies and advertising campaigns for the COVID Alert app and address vaccine hesitancy; and
• Provide input that will help reshape and target messaging as required.
1.2 Summary of Findings
The results of the segmentation provided us with five distinct segments:
• The Concerned (21% of survey respondents);
• The Engaged (29% of survey respondents);
• The Trusters (17% of survey respondents);
• The Stoics (22% of survey respondents); and
• The Skeptics (11% of survey respondents).
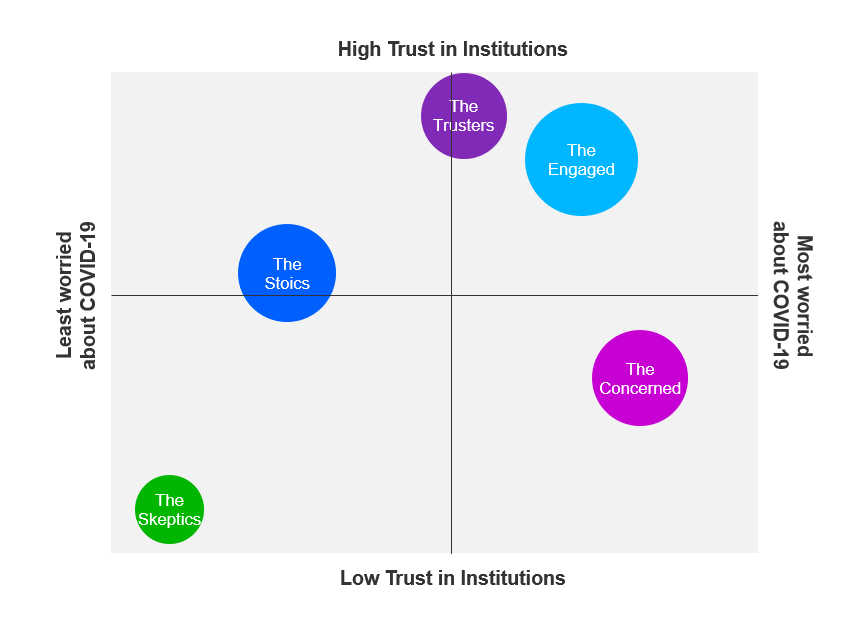
At a broad level, the segments can be thought of as falling on a quadrant with concern about COVID-19 on the x-axis, and trust in institutions on the y-axis.
The Concerned
Overall, the Concerned have a somewhat lower level of trust in institutions, particularly in businesses. Further, they do not feel the government wants to hear from people like them.
The Concerned are very worried about the transmission of COVID-19. They are afraid of personally getting the virus and strongly believe it will seriously affect their health if a family member or themselves contracts COVID-19.
The Concerned wholly understand and believe in asymptomatic spread. This segment gets very angry when they see others not adhering to public health measures, and features the largest majority of people who say government restrictions have not gone far enough.
The Engaged
The Engaged have a lot of trust in scientists and Canadian medical professionals. They are more likely to actively seek out information on COVID-19 and to closely follow the news on the pandemic.
For this segment, the COVID-19 situation is very serious. Further, they believe COVID-19 will seriously affect their health if a family member or themselves contracts COVID-19 and, they get very angry when they see others not adhering to public health measures. The Engaged are the segment most careful to adhere to all health and safety measures. A majority say government restrictions have not gone far enough.
The Trusters
As their name suggests, Trusters are characterized by very high levels of trust in all institutions, including governments, businesses, scientists, medical professionals, the pharmaceutical industry, and the news media. Further, they feel the government wants to hear from people like them and that experts always provide good advice. The Trusters are also the most likely to trust other Canadians in general.
The Trusters believe the COVID-19 situation is very serious. They are not overtly fearful but believe COVID-19 would greatly affect them if they contracted it. They are the segment most likely to say that recommendations from public health officials have been clear and easy to understand, and as such are careful to adhere to all health and safety measures.
Trusters are the only segment where a majority say that restrictions imposed by government have been about right, neither having gone too far nor not far enough.
The Stoics
The Stoics are quite trusting of institutions. Among all segments, they are the most likely to trust businesses.
The Stoics do not feel their health would be seriously affected by COVID-19 if they contract the virus and are the segment most likely to erroneously believe that COVID-19 cannot be spread asymptomatically.
The Stoics tend to not mind so much when they see others defying public health guidelines. Nevertheless, when it comes to their own behaviour, they are more likely to adhere to public health measures than to ignore them. Comparatively, though, they are less cautious than other groups.
The Stoics do not feel they would be seriously affected by COVID-19 if they contract it and erroneously believe that COVID-19 cannot be spread asymptomatically.
Generally speaking, the Stoics feel that the death rate has been deliberately and greatly exaggerated. They also believe it is difficult to find reliable and trustworthy information about COVID-19.
The Skeptics
Overall, the Skeptics are unique in their very strong mistrust of all institutions (government, business, the pharmaceutical industry, the news media, etc.). They believe experts are out of touch with ordinary people. They do not trust the government to do what is right nor do they believe the government wants to hear from people like them.
The Skeptics are the segment most likely to believe that the COVID-19 situation is overblown and that the death rate has been deliberately and greatly exaggerated. The vast majority of Skeptics believe government restrictions have gone too far. They also are the only segment who believe wearing masks should be a personal choice rather than mandated by government.
The Skeptics are the least likely to know someone who has had COVID-19 and the least afraid to contract COVID-19 themselves. The Skeptics are the most likely to say they are tired of hearing about COVID-19 and the least likely to care when they see others not adhering to public health guidelines. Skeptics find it difficult to get reliable and trustworthy information on COVID-19 and do not find it easy to understand the recommendations by public health officials.
1.3 Methodology
An online survey was conducted among 2,002 Canadians, aged 18 years and older. Data collection was conducted from January 29th to February 5th and the survey was conducted using a panel sample. As such this constitutes a non-probabilistic sample, and margin of error therefore cannot be calculated nor can the findings be extrapolated to the broader Canadian population.
The results of the survey were used to undertake a Multi-Domain Segmentation (MDS). Multi-Domain Segmentation starts by finding linkages both within and between domains (attitudes, values, behaviours and profile characteristics) and uses these to divide the population into meaningful, addressable groups.
The key to the MDS analysis is to identify linkages between the various domains of information used to create the segmentation. We begin by separating the variables into two buckets, typically defined as “Key Behaviours” and those variables which can be used to explain those behaviours.
A canonical correlation analysis determines the strength of the relationship between the two sets of variables identified. Factors are identified across the two sets of variables, with loadings to determine the variables that contribute to each canonical dimension. Multiple iterations of this canonical correlation analysis allow us to determine the optimal set of variables to use across the two dimensions. The canonical factors then serve as the basis for deriving segments through the cluster analysis.
1.4 Contract Value
The total contract value for the project was $148,862.36 including applicable taxes.
1.5 Statement of Political Neutrality
I hereby certify as a representative of Kantar that the deliverables fully comply with the Government of Canada political neutrality requirements outlined in the Policy on Communications and Federal Identity and the Directive on the Management of Communications. Specifically, the deliverables do not include information on electoral voting intentions, political party preferences, standings with the electorate or ratings of the performance of a political party or its leaders.
Tanya Whitehead
Kantar
Senior Director, Public Practice Leader
2. Psychographic Segmentation of Canadians Regarding COVID-19
2.1 Background and Objectives
The overall objective of the research is to understand the foundation of the public’s perceptions, behaviours and concerns regarding COVID-19. Specific objectives include:
• Segment Canadians in order to inform communication strategies and advertising campaigns for the COVID Alert app and address vaccine hesitancy; and
• Provide input that will help reshape and target messaging as required.
2.2 Segmentation
Successful segmentation of the general population depends upon exploiting the diversity in the population and offering Canadians experiences, services, and messages tailored to their needs or values.
Using population segmentation works well when we can identify the hidden commonalities of needs and behaviours and tailor messaging to address them. The population groupings that result from this analysis should respond differently to one or more communications variables and can therefore be targeted with greater effectiveness.
Segmentation is a goal, not a particular analysis. A successful segmentation is one that provides useable insights. Because of this, there is not a single correct segmentation solution, nor a single correct analytical technique to use in segmentation.
Since there is not a single “correct” segmentation solution, there is not a single analytic technique that is best under all circumstances. In most types of analysis, it is best to be as consistent as possible from one study to the next, allowing comparisons to be made easily. There is no similar benefit in segmentation. If the analytic approach used last time to form segments fails to work, there is no reason to not try another approach. The design of the study and the analysis of the results should be driven by the questions to be answered. In this study, what are the foundations for the public’s perceptions, behaviours and concerns related to COVID-19 and how can they be used to information communications strategies and address vaccine hesitancy in particular? The analytic approaches need to be fitted to the uses of the segmentation and the data at hand.
2.3 Analytic Approach
The key to the MDS analysis is to identify linkages between the various domains of information used to create the segmentation. We begin by separating the variables into two buckets, typically defined as “Key Behaviours” and those variables which can be used to explain those behaviours.
A canonical correlation analysis[1] determines the strength of the relationship between the two sets of variables identified. Factors are identified across the two sets of variables, with loadings to determine the variables that contribute to each canonical dimension. Multiple iterations of this canonical correlation analysis allow us to determine the optimal set of variables to use across the two dimensions. The canonical factors then serve as the basis for deriving segments through the cluster analysis. Use of these canonical factors forces the resulting segments to be maximally different across all domains. Without the use of the canonical correlation step, the cluster analysis tends to yield segments focused on only one domain. The result is a segmentation that is highly actionable, since they are clearly differentiated on:
· Who they are, such that targeting is more effective due to sharper delineation of demographics and use of media and information channels.
· What they do, so the segments can be prioritized based upon expected behaviours associated with restrictions, prevention and tracking of COVID-19.
· Why they do it, allowing marketing and communications to each segment that is easily tailored to those factors or values that will motivate desired actions.
The Segmentation Solution
Initially, many potential segmentation variables were included in the canonical correlation phase (details can be found in the table below). If the resulting underlying themes are informative, descriptive and complementary, while meeting certain statistical criteria (e.g., eigenvalues, statistical significance, proportion of variance explained), we use those themes as inputs into the clustering phase of the analysis. However, this step generally requires several iterations in which individual items are removed or moved from one side of the equation to another in order to arrive at a more compelling solution.
Once we have identified a set of acceptable themes, we proceed to generate a set of solutions from the cluster analysis which look at different numbers of segments (typically 4-7). Each respective cluster solution is assessed with respect to relative segment sizes, predictability, and the ability of each segment to provide a compelling story while maintaining clear distinction from one another.
In this analysis, this iterative process was repeated more than 20 times, with each step used to assess and refine the approach from the previous version. Ultimately, we arrived at a solution that used all variables from the “Included in Final Version” column of the table below as primary inputs to the analysis (included at the canonical correlation phase), while all other variables were used as additional profiling characteristics to assist in the evaluation and comparison with the resulting cluster solutions.
Table 1 Variables Included in the Final Segmentation
|
Variable |
Segments |
||||
|
|
Included in Final Version |
Tested in Iterative Process |
Not Included |
||
|
|
|
|
|
||
|
Q003 - QGEN: GENDER |
|
X |
|
||
|
Q005 - QAGE: AGE |
|
X |
|
||
|
Q006 - PROV: PROVINCE |
|
X |
|
||
|
Q007 - QPSYGR1: PSYCHOGRAPHIC1 |
X |
|
|
||
|
Q008 - QTRUST: TRUST |
X |
|
|
||
|
Q009 - QVACTRST: Trust in vaccines |
X |
|
|
||
|
Q010 - QFLUSH: Flu Shot |
X |
|
|
||
|
Q011 - QPSYGR2: : PSYCHOGRAPHIC2 |
X |
|
|
||
|
Q012 - QVBD: General COVID-19 Attitudinal statements |
X |
|
|
||
|
Q013 - QRESTR: Government Restrictions |
X |
|
|
||
|
Q014 - QCOVAPP: Downloaded COVID Alert |
X |
|
|
||
|
Q015 - QWHYND: Why not download |
|
|
X |
||
|
Q016 - QGETVAC: Getting the COVID-19 vaccine |
X |
|
|
||
|
Q017 - QWHENVAC: Getting the COVID-19 vaccine |
X |
|
|
||
|
Q018 - QWHYNOTVAC: Why not get vaccinated? |
|
|
X |
||
|
Q019 - QMessM: Messaging More Likely |
X |
|
|
||
|
Q020 - QMessL: Messaging Less |
X |
|
|
||
|
Q021 - QLKFWD: Activity Looking Forward To |
|
|
X |
||
|
Q022 - QKNOW: KNOW SOMEONE |
|
|
X |
||
|
Q023 - QMEDIA: Traditional Media |
|
X |
|
||
|
Q024 - QFLLW: Follow News Media |
|
X |
|
||
|
Q025 - QPRM: Primary Source of News Media |
|
|
X |
||
|
Q026 - QTRSRC: Trusted Source of Information |
X |
|
|
||
|
Q027 - QEDU: EDUCATION |
|
X |
|
||
|
Q028 - QLANG_SPOKE: LANGUAGES SPOKEN |
|
|
X |
||
|
Q029 - QEMP: EMPLOYMENT STATUS |
|
X |
|
||
|
Q030 - QWKH: WORK FROM HOME |
|
|
X |
||
|
Q031 - QHHINCOME: HOUSEHOLD INCOME |
|
X |
|
||
|
Q032 - QHHNum: Number of People in Household |
|
X |
|
||
|
Q033 - BORN: BORN IN CANADA |
|
X |
|
||
|
Q034 - YR_EMG: YEAR EMIGRATED |
|
|
X |
||
|
Q035 - QINDG: INDIGENOUS |
|
X |
|
||
|
Q036 - ETH: ETHNICITY |
|
X |
|
||
2.4 Segments
The results of the segmentation provided us with five distinct segments.
At a broad level, the segments can be thought of as falling on a quadrant with concern about COVID-19 on the x-axis, and trust in institutions on the y-axis. For example, the Concerned segment is low on trust in institutions and high on concern about COVID-19. Consequently, this segment is placed in the bottom right quadrant. Conversely, the Engaged segment is high on both trust and fear, which places the segment into the upper right quadrant. The Skeptics segment is the least concerned about COVID-19’s health impacts and least likely to say they trust the government or medical professionals; thus, they fall into the bottom left quadrant. Both Stoics and Trusters fall towards the centre line on the grid, as they are only moderately concerned about COVID-19’s health impacts. However, they are differentiated when it comes to trust; as their name suggests, the Trusters have the highest trust in institutions.
Given that the segments tend to fall on a spectrum from low to high concern about COVID-19, throughout the remainder of the report the segments are presented in the following order to facilitate comprehension:
· The Concerned;
· The Engaged;
· The Trusters;
· The Stoics; and
· The Skeptics
2.5 Segment Profiles
2.5.1 The Concerned – 21% of survey respondents
Social Values
The Concerned distinguish themselves in worrying a lot about their future, along with feeling they have little control over how their life turns out. Overall, the Concerned have a somewhat lower level of trust in institutions, particularly in businesses. Further, they do not feel the government wants to hear from people like them.
COVID-19
The Concerned are very worried about the transmission of the COVID-19. They are afraid of personally getting the virus and strongly believe it will seriously affect their health if a family member or themselves contracts COVID-19.
The Concerned wholly understand and believe in asymptomatic spread. This segment gets very angry when they see others not adhering to public health measures, and features the largest majority of people who say government restrictions have not gone far enough.
The economic fallout of COVID-19 has been particularly hard on the Concerned, the segment by far the most likely to say the pandemic has had a negative impact on their personal financial situation.
The Concerned strongly believe that government restrictions have not gone far enough. They believe that too much priority has been given to economy over health during the pandemic and are the second most likely segment to say that wearing masks should be mandated by government rather than a personal choice.
The Concerned are the least likely segment to have heard of the COVID Alert app; and among those in this segment who say they are unwilling to download the app, the most likely to cite distrust of the government to handle their data privately as the reason why they will not download the app.
While a slight majority of the Concerned say they will definitely get a COVID-19 vaccine, this segment also features the largest number of people who say they will probably get the vaccine only once they are confident it is safe. Messages that are most likely to encourage vaccine uptake among this segment include a vaccination requirement for travel, family and friends having taken the vaccine, and, most importantly, a personal recommendation from their doctor or other health care provider while reports of serious side effects posted on social media are most likely to reduce vaccine uptake.
Post COVID-19 Activities
The Concerned are looking forward to the same things everyone else in Canada is looking forward to, seeing friends and family, travelling internationally, and eating in restaurants.
Information Sources
Media consumption of the Concerned is very similar to the general population with a focus on traditional mainstream media and a reliance on live TV and online news sources for information on COVID-19. Their most trusted source of information on COVID-19 is their doctor or health care provider.
Demographics
The Concerned skew slightly younger (aged 18 to 34) and female. This segment also skews towards those not regularly employed (i.e., unemployed, part-time, students, homemakers) and has the lowest income profile among all segments.
2.5.2 The Engaged – 29% of survey respondents
Social Values
The Engaged stand out in their collectivist belief that they have a duty to help other people in their community.
They also have a great deal of trust in scientists and Canadian medical professionals. The Engaged feel they have control over how their life turns out and tend to carefully consider all of the facts before making decisions.
COVID-19
The Engaged are the segment most likely to actively seek out information on COVID-19, the most likely to be closely following the news on the pandemic, and the most careful to adhere to all health and safety measures.
For the Engaged, the COVID-19 situation is very serious and they believe COVID-19 will seriously affect their health if a family member or themselves contracts COVID-19. The Engaged get very angry when they see others not adhering to public health measure and a majority say government restrictions have not gone far enough.
Like Canadians generally, the Engaged are fairly divided on whether or not they will download the COVID Alert app. Barriers to uptake for this group tend to be technological in nature, such as the perceived hassle of installing the app and are less likely to be about mistrust or data privacy.
The Engaged exhibit very strong trust in vaccines in general, are the most likely segment to get an annual flu shot, and the most definitive among all segments in saying they will get the COVID-19 vaccine when it becomes available.
No factors are likely to significantly deter the Engaged from vaccination.
Post COVID-19 Activities
The Engaged are the segment most likely to be looking forward to seeing friends and family when the pandemic is over.
Information Sources
The Engaged tune into larger, mainstream, more traditional media outlets to obtain accurate information on the news.
Their primary source of information on COVID-19 is TV-based news and they are less likely to turn to social media to provide information on COVID-19. For the Engaged, the most trusted source of information on COVID-19 is their doctor or health care provider.
Demographics
The Engaged tend to skew older (aged 55+), White, English speaking and well educated (with a university degree). This segment also skews towards retired and smaller households.
2.5.3 The Trusters – 17% of survey respondents
Social Values
As their name suggests, the Trusters are characterized by very high levels of trust in all institutions, including governments, businesses, scientists, medical professionals, the pharmaceutical industry, and the news media. Further, they feel the government wants to hear from people like them and that experts always provide good advice. The Trusters are also the most likely to trust other Canadians in general.
The Trusters are uniquely inclined to never worry about their future, are the most likely to say their life is well planned, and are also most likely to believe they have complete control over how their life turns out.
COVID-19
The Trusters believe the COVID-19 situation is very serious. They are not overtly fearful but believe COVID-19 would greatly affect them if they contracted it. They are the segment most likely to say that recommendations from public health officials have been clear and easy to understand, and are careful to adhere to all health and safety measures. They are in fact the second-most compliant segment after the Engaged.
The Trusters are the only segment where a majority say that restrictions imposed by government have been about right, neither having gone too far nor far enough.
Like Canadians generally, the Trusters are fairly divided on whether or not they will download the COVID Alert app. The primary barrier tends to be the fact that they do not have a smartphone.
The Trusters have very strong trust in vaccines in general, and are the second-most definitive among all segments in saying they will get the COVID-19 vaccine when it becomes available. They trail only the Engaged in vaccine intent. A personal recommendation from their doctor or health care provider is most likely to positively impact the willingness of the Trusters to get vaccinate while no factors are likely to dissuade them from getting vaccinated.
Post COVID-19 Activities
The Trusters are the segment most likely to look forward to eating out at restaurant once the pandemic is over
Information Sources
The Trusters look to larger, mainstream, traditional media outlets to get accurate information on the news. Their primary source of COVID-19 information is TV-based news and they are less likely to turn to social media.
The Trusters are the most likely segment to trust government officials and the mainstream media for reliable COVID-19 information.
Demographics
The Trusters skew towards Quebec, francophones and White males born in Canada. The Trusters also skew towards the highest income profile among all segments.
2.5.4 The Stoics – 22% of survey respondents
Social Values
The Stoics stand out in their belief that they have little or no control over how their life turns out.
They also tend to be highly disciplined people, make decisions based on their gut or intuition, are more religious than other segments, and place more trust in business than do others. That said, the Stoics generally trust institutions and people across the board.
COVID-19
The Stoics tend to not mind so much when they see others defying public health guidelines. Nevertheless, when it comes to their own behaviour, they are more likely to adhere to public health measures than to ignore them. Comparatively, the Stoics are less cautious than other groups.
The Stoics do not feel they would be seriously affected by COVID-19 if they contract it and erroneously believe that COVID-19 cannot be spread asymptomatically.
Generally speaking, the Stoics feel that the death rate has been deliberately and greatly exaggerated. They also believe it has been difficult to find reliable and trustworthy information about COVID-19.
Despite their lower level of concern with COVID-19, Stoics tend to say that government restrictions have been about right.
The Stoics are slightly more inclined than the general population to download the COVID Alert app. Among those who are not interested in downloading the app, the Stoics are the segment most likely to cite the impact on their mental health as a reason for not doing so.
The Stoics are lukewarm about getting the COVID-19 vaccine. They are the segment most likely to say they will probably get a vaccine only once they are confident it will work. Seeing friends and family get the vaccine, as well as politicians, health professionals and/or celebrities doing so on camera would most encourage the Stoics to take the vaccine while reports of serious side effects posted on social media, lack of decline in case counts, and inconvenience in getting vaccinated would discourage uptake.
Post COVID-19 Activities
The Stoics are looking forward to the same post-pandemic activities as other Canadians, but to a lesser extent seeing family and friends.
Information Sources
The Stoics rely on both mainstream, larger, traditional media and smaller, alternative, new media outlets to get accurate information on the news.
Compared to other segments, the primary source of COVID-19 information for the Stoics is more likely to be social media but TV and online news sources are also key sources. With a tendency to say it has been difficult to find reliable and trustworthy information about COVID-19, the Stoics are more prone than any other segment to look towards social media and friends and family as trusted sources of information on the pandemic.
Demographics
The Stoics tend to skew younger (aged 18-54), male, and/or working full-time. This group also tends to have larger household sizes, is overrepresented by individuals born outside of Canada, and is disproportionately composed of visible minorities, notably Blacks, South Asians, and Chinese.
2.5.5 The Skeptics – 11% of survey respondents
Social Values
The Skeptics are traditionalists that believe our country should stick to traditional values and the old ways. For them, personal freedom comes first, they live their life moment to moment and are not afraid of taking risks.
Overall, the Skeptics are unique in their very strong mistrust of all institutions (government, business, the pharmaceutical industry, news media, etc.). They believe experts are out of touch with ordinary people. The Skeptics do not trust the government to do what is right nor do they believe the government wants to hear from people like them.
COVID-19
The Skeptics are the segment most likely to believe that the COVID-19 situation is overblown and that the death rate has been deliberately and greatly exaggerated. The vast majority of the Skeptics believe government restrictions have gone too far, with too much priority being given to health at the expense of the economy and too much damage being done to mental health. They also are the only segment who believe wearing masks should be a personal choice rather than mandated by government.
The Skeptics are the least likely to know someone who has had COVID-19 and the least afraid to contract COVID-19 themselves. The Skeptics are the most likely to say they are tired of hearing about COVID-19 and the least likely to care when they see others not adhering to public health guidelines. The Skeptics find it difficult to get reliable and trustworthy information on COVID-19 and do not find it easy to understand the recommendations by public health officials.
Skeptics overwhelmingly refuse to download the COVID Alert app. Their main reasons include not trusting the government to handle their data and perceiving the app to be an invasion of privacy.
Skeptics have a strong distrust of vaccines in general and are by far the least likely to get the COVID-19 vaccine. Close to half of the Skeptics will definitely not get the COVID-19 vaccine. Reasons provided for their refusal include safety concerns, lack of trust, and the perceptions that the vaccine was developed too quickly.
Skeptics are unlikely to be moved much by any messaging. That said, a vaccination requirement for travel would have the most impact on increasing vaccination intent among this group – albeit likely a moderate impact if any. On the other hand, reports of serious side effects posted on social media would have the most negative impact in terms of reducing vaccine uptake.
Post COVID-19 Activities
Skeptics are looking forward to many of the same post-pandemic activities as other Canadians. However, they are significantly more motivated than other segments by the prospect of attending large social gatherings such as weddings, parties, concerts, sporting events, or going to a bar/nightclub.
Information Sources
Skeptics prefer smaller, alternative, new media outlets to get accurate information on the news.
While Skeptics are less likely to be following the news on COVID-19, their primary source of information about the pandemic consists of online news sources. They tend to not follow the news on TV.
Skeptics are more likely than other segments, with the exception of Stoics, to turn to social media and family and friends for trusted information on the virus. Conversely, unlike any other segment, they express virtually no trust in government officials to provide reliable information about COVID-19.
Demographics
2.5.6 Detailed Results
Tables 2a and 2b General Pyschographics provide the results of a battery of “either or” statements where respodents are asked wth a sliding scale (from 1-10) which statement best describes how they feel. Top 3 box represents the percentage of respondents who identify with the first statement and selected 1,2 or 3 on the scale and bottom 3 box represents people who identify with the second statement on the spectrum and selected 8, 9 or 10 on the scale.
Table 2a General Psychographics
|
Top 3 Box % |
|
|
|
Segments |
|
|
|
|
Total |
The Concerned 21% |
The Engaged 29% |
Trusters 17% |
Stoics 22% |
Skeptics 11% |
|
Base=actual |
2002 |
415 |
578 |
348 |
448 |
213 |
|
My personal freedom comes first/I have a duty to help other people in my community |
28% |
37% |
36% |
22% |
23% |
12% |
|
Governments want to hear from people like me/Governments do not want to hear from people like me |
26% |
36% |
22% |
8% |
19% |
60% |
|
I live life spontaneously from moment to moment/My life is very well planned |
31% |
29% |
34% |
40% |
25% |
25% |
|
People would describe me as social, talkative, and outgoing/People would describe me as quiet, reserved, and thoughtful |
33% |
38% |
32% |
34% |
28% |
34% |
|
People would describe de as a fun-loving and easygoing person/People would describe me as a highly disciplined person |
18% |
16% |
15% |
18% |
24% |
19% |
|
I worry a lot about my future/I never worry about my future |
16% |
2% |
9% |
43% |
18% |
15% |
|
I have complete control over how my life turns out/I have little or no control in how my life turns out |
11% |
17% |
5% |
3% |
20% |
11% |
|
I carefully consider all the facts before making decisions/I go with intuition and gut feel when making decisions |
11% |
10% |
7% |
7% |
19% |
9% |
|
Experts always provide good advice/Experts are too often out of touch with ordinary people |
19% |
21% |
15% |
6% |
21% |
45% |
|
People would describe me as someone not afraid of taking risks/People would describe me as someone who doesn’t like taking risks |
27% |
31% |
28% |
24% |
28% |
22% |
|
Our country needs to stick with the old ways and traditional values/Our country needs to update its values to keep up with changes in society |
41% |
54% |
42% |
43% |
35% |
23% |
|
I consider myself to be a religious person/I do not consider myself to be a religious person |
48% |
55% |
50% |
55% |
34% |
49% |
Q007 - QPSYGR1: PSYCHOGRAPHIC1: Which of the following two statements best describes how you feel and/or behave?
Table 2b General Psychographics
|
Bottom 3 Box % |
|
|
|
Segments |
|
|
|
|
Total |
The Concerned 21% |
The Engaged 29% |
Trusters 17% |
Stoics 22% |
Skeptics 11% |
|
Base=actual |
2002 |
415 |
578 |
348 |
448 |
213 |
|
My personal freedom comes first/I have a duty to help other people in my community |
20% |
15% |
11% |
24% |
24% |
37% |
|
Governments want to hear from people like me/Governments do not want to hear from people like me |
22% |
19% |
24% |
34% |
22% |
5% |
|
I live life spontaneously from moment to moment/My life is very well planned |
15% |
19% |
9% |
12% |
18% |
20% |
|
People would describe me as social, talkative, and outgoing/People would describe me as quiet, reserved, and thoughtful |
28% |
30% |
27% |
31% |
24% |
30% |
|
People would describe de as a fun-loving and easygoing person/People would describe me as a highly disciplined person |
34% |
41% |
31% |
38% |
28% |
34% |
|
I worry a lot about my future/I never worry about my future |
35% |
72% |
26% |
8% |
32% |
39% |
|
I have complete control over how my life turns out/I have little or no control in how my life turns out |
36% |
25% |
38% |
56% |
27% |
37% |
|
I carefully consider all the facts before making decisions/I go with intuition and gut feel when making decisions |
45% |
47% |
51% |
55% |
30% |
44% |
|
Experts always provide good advice/Experts are too often out of touch with ordinary people |
25% |
27% |
24% |
35% |
26% |
8% |
|
People would describe me as someone not afraid of taking risks/People would describe me as someone who doesn’t like taking risks |
22% |
22% |
18% |
28% |
20% |
26% |
|
Our country needs to stick with the old ways and traditional values/Our country needs to update its values to keep up with changes in society |
13% |
10% |
11% |
6% |
13% |
38% |
|
I consider myself to be a religious person/I do not consider myself to be a religious person |
20% |
18% |
18% |
17% |
24% |
24% |
Q007 - QPSYGR1: PSYCHOGRAPHIC1: Which of the following two statements best describes how you feel and/or behave?
Table 3 General Trust provides the results of an agree/disagree battery where the top 3 boxes represent the percentage of respondents who strongly agree (8,9,10 on a scale of 1-10).
Table 3 General Trust
|
Top 3 Box % |
|
|
|
Segments |
|
|
|
|
Total |
The Concerned 21% |
The Engaged 29% |
Trusters 17% |
Stoics 22% |
Skeptics 11% |
|
Base=actual |
2002 |
415 |
578 |
348 |
448 |
213 |
|
Governments to do what is right |
18% |
10% |
15% |
31% |
26% |
4% |
|
Businesses to do what is right |
14% |
11% |
10% |
19% |
23% |
9% |
|
Medical professionals in Canada |
53% |
49% |
66% |
68% |
43% |
20% |
|
The pharmaceutical industry |
25% |
21% |
23% |
39% |
27% |
9% |
|
Scientists |
51% |
53% |
61% |
65% |
42% |
20% |
|
Other Canadians in general |
24% |
18% |
24% |
27% |
29% |
23% |
|
Information provided by Canadian news media |
25% |
20% |
28% |
35% |
28% |
5% |
Q008 - QTRUST: TRUST: Please rate your trust in each of the following.
Table 4 Experience with COVID-19
|
|
|
|
|
Segments |
|
|
|
|
Total |
The Concerned 21% |
The Engaged 29% |
Trusters 17% |
Stoics 22% |
Skeptics 11% |
|
Base=actual |
2002 |
415 |
578 |
348 |
448 |
213 |
|
I have tested positive for COVID-19 |
3% |
4% |
1% |
1% |
5% |
1% |
|
I personally know someone who has tested positive for COVID-19 |
36% |
42% |
40% |
30% |
34% |
25% |
|
I personally know someone who has been hospitalized with COVID-19 |
13% |
16% |
10% |
11% |
16% |
7% |
|
I personally know someone who has died from COVID-19 |
12% |
15% |
11% |
11% |
13% |
5% |
Q022 - QKNOW: KNOW SOMEONE: Which of the following statements apply to you?
Table 5 COVID-19 Attitudes and Behaviours provides the results of an agree/disagree battery where the top 3 box represents the percentage of respondents who strongly agree (8,9,10 on a scale of 1-10).
Table 5 COVID-19 Attitudes and Behaviours
|
Top 3 Box % |
|
|
|
Segments |
|
|
|
|
Total |
The Concerned 21% |
The Engaged 29% |
Trusters 17% |
Stoics 22% |
Skeptics 11% |
|
Base=actual |
2002 |
415 |
578 |
348 |
448 |
213 |
|
If a family member catches COVID-19, it will seriously affect their health |
52% |
68% |
61% |
48% |
45% |
16% |
|
A person infected with COVID-19 can transmit the virus, even if they aren't showing any symptoms |
80% |
92% |
95% |
89% |
50% |
59% |
|
Recommendations from public health officials are clear and easy to understand |
46% |
42% |
56% |
64% |
37% |
22% |
|
The COVID-19 death rate has been deliberately and greatly exaggerated |
15% |
3% |
2% |
4% |
29% |
59% |
|
If I catch COVID-19, it won’t seriously affect my health |
14% |
6% |
6% |
13% |
24% |
33% |
|
I am afraid of getting COVID-19 myself |
43% |
65% |
49% |
32% |
41% |
8% |
|
It has been difficult for me to find reliable and trustworthy information about COVID-19 |
17% |
20% |
6% |
9% |
24% |
43% |
Q012 - QVBD: General COVID-19 Attitudinal statements: How much do you disagree or agree with the following statement?
Tables 6a and 6b COVID-19 Attitudes and Behaviours provide the results of a battery of “either or” statements where respodents are asked wth a sliding scale (from 1-10) which statement best describes how they feel. Top 3 box represents the percentage of respondents who identify with the first statement and selected 1,2 or 3 on the scale and bottom 3 box represents people who identify with the second statement on the spectrum and selected 8, 9 or 10 on the scale.
Table 6a COVID-19 Attitudes and Behaviours
|
Top 3 Box % |
|
|
|
Segments |
|
|
|
|
Total |
The Concerned 21% |
The Engaged 29% |
Trusters 17% |
Stoics 22% |
Skeptics 11% |
|
Base=actual |
2002 |
415 |
578 |
348 |
448 |
213 |
|
I am very careful to adhere to all health and safety measures/I don’t really pay much attention to whether I adhere to the health and safety measures |
5% |
0% |
0% |
0% |
15% |
12% |
|
The COVID-19 situation is very serious/The COVID-19 situation is overblown |
10% |
0% |
1% |
1% |
15% |
57% |
|
Wearing masks should be mandated by government/Wearing masks should be a personal choice |
10% |
2% |
1% |
3% |
13% |
51% |
|
I think we have prioritized health over the economy too much during the COVID-19 pandemic/I think we have prioritized the economy over health too much during the COVID-19 pandemic |
26% |
48% |
28% |
12% |
21% |
10% |
|
The pandemic has had a negative impact on my financial situation/The pandemic has NOT had a negative impact on my financial situation |
36% |
10% |
45% |
79% |
19% |
31% |
|
I am tired of hearing about COVID-19/I seek out as much information as possible on COVID-19 |
31% |
34% |
38% |
37% |
26% |
3% |
|
I get very angry when I see someone else not adhering to the latest public health guidelines/When other people don’t adhere to the latest public health guidelines, I don’t really mind |
9% |
1% |
1% |
2% |
19% |
39% |
|
The restrictions put in place to limit the spread of COVID-19 are necessary even at the expense of mental health/The restrictions put in place to limit the spread of COVID-19 are doing too much damage to mental health |
14% |
6% |
2% |
4% |
17% |
67% |
Q011 - QPSYGR2: : PSYCHOGRAPHIC2: Which of the following two statements best describes how you feel and behave in the current COVID-19 (Coronavirus) situation?
Table 6b COVID-19 Attitudes and Behaviours
|
Bottom 3 Box % |
|
|
|
Segments |
|
|
|
|
Total |
The Concerned 21% |
The Engaged 29% |
Trusters 17% |
Stoics 22% |
Skeptics 11% |
|
Base=actual |
2002 |
415 |
578 |
348 |
448 |
213 |
|
I am very careful to adhere to all health and safety measures/I don’t really pay much attention to whether I adhere to the health and safety measures |
78% |
90% |
95% |
90% |
46% |
57% |
|
The COVID-19 situation is very serious/The COVID-19 situation is overblown |
71% |
92% |
90% |
81% |
48% |
6% |
|
Wearing masks should be mandated by government/Wearing masks should be a personal choice |
70% |
88% |
91% |
81% |
44% |
19% |
|
I think we have prioritized health over the economy too much during the COVID-19 pandemic/I think we have prioritized the economy over health too much during the COVID-19 pandemic |
21% |
9% |
10% |
22% |
26% |
61% |
|
The pandemic has had a negative impact on my financial situation/The pandemic has NOT had a negative impact on my financial situation |
28% |
61% |
12% |
3% |
29% |
40% |
|
I am tired of hearing about COVID-19/I seek out as much information as possible on COVID-19 |
30% |
31% |
19% |
21% |
26% |
84% |
|
I get very angry when I see someone else not adhering to the latest public health guidelines/When other people don’t adhere to the latest public health guidelines, I don’t really mind |
62% |
84% |
81% |
63% |
35% |
20% |
|
The restrictions put in place to limit the spread of COVID-19 are necessary even at the expense of mental health/The restrictions put in place to limit the spread of COVID-19 are doing too much damage to mental health |
57% |
65% |
73% |
75% |
38% |
8% |
Q011 - QPSYGR2: : PSYCHOGRAPHIC2: Which of the following two statements best describes how you feel and behave in the current COVID-19 (Coronavirus) situation?
Table 7 COVID-19 Government Restrictions
|
|
|
|
|
Segments |
|
|
|
|
Total |
The Concerned 21% |
The Engaged 29% |
Trusters 17% |
Stoics 22% |
Skeptics 11% |
|
Base=actual |
2002 |
415 |
578 |
348 |
448 |
213 |
|
Gone too far |
13% |
3% |
2% |
2% |
13% |
81% |
|
Haven’t gone far enough |
46% |
66% |
61% |
35% |
34% |
4% |
|
Are about right |
36% |
28% |
31% |
57% |
47% |
7% |
|
Don’t know |
6% |
4% |
6% |
7% |
6% |
8% |
Q013 - QRESTR: Government Restrictions: Thinking about the restrictions that governments in Canada have put in place during the pandemic, do you think the restrictions have. . . ?
Table 8 Downloaded the COVID Alert App
|
|
|
|
|
Segments |
|
|
|
|
Total |
The Concerned 21% |
The Engaged 29% |
Trusters 17% |
Stoics 22% |
Skeptics 11% |
|
Base=actual |
2002 |
415 |
578 |
348 |
448 |
213 |
|
Yes, I have downloaded the app |
31% |
35% |
33% |
33% |
34% |
5% |
|
No, but I plan to download the app |
14% |
15% |
13% |
13% |
20% |
1% |
|
No, I will not download the app |
40% |
33% |
42% |
38% |
30% |
76% |
|
No, I have never heard of the COVID Alert app |
9% |
15% |
6% |
5% |
9% |
14% |
|
Don’t know |
7% |
2% |
7% |
12% |
7% |
3% |
Q014 - QCOVAPP: Downloaded Covid Alert: Have you downloaded the COVID Alert app?
Table 9 Why COVID Alert App Not Downloaded
|
|
|
|
|
Segments |
|
|
|
|
Total |
The Concerned 21% |
The Engaged 29% |
Trusters 17% |
Stoics 22% |
Skeptics 11% |
|
Base=actual |
2002 |
415 |
578 |
348 |
448 |
213 |
|
It’s too much hassle to install the app |
6% |
8% |
7% |
3% |
10% |
4% |
|
Not enough people will install the app so it won’t be effective |
18% |
25% |
18% |
19% |
17% |
14% |
|
It would have a negative impact on my mental health |
8% |
9% |
4% |
8% |
11% |
10% |
|
I don’t trust the app/government to handle my data privately |
33% |
45% |
22% |
21% |
21% |
58% |
|
I think it is an invasion of privacy |
28% |
37% |
17% |
16% |
16% |
58% |
|
I don't want the government to have access to my location data |
28% |
35% |
17% |
22% |
23% |
50% |
|
I don't believe I will catch the virus |
4% |
1% |
2% |
4% |
7% |
8% |
|
I don't own a smart phone |
17% |
16% |
25% |
26% |
11% |
4% |
|
My smartphone is not compatible with the app |
4% |
3% |
6% |
5% |
4% |
3% |
|
I don’t have a data plan on my phone |
15% |
14% |
20% |
13% |
11% |
11% |
|
I don’t know how to download the app |
2% |
3% |
2% |
1% |
5% |
1% |
|
The app is not fully functional in my province/territory |
4% |
4% |
8% |
1% |
3% |
2% |
Q015 - QWHYND: Why not download: Why won’t you download the COVID Alert app?
Table 10 Attitudes Towards Vaccinations
|
Top 3 Box % |
|
|
|
Segments |
|
|
|
|
Total |
The Concerned 21% |
The Engaged 29% |
Trusters 17% |
Stoics 22% |
Skeptics 11% |
|
Base=actual |
2002 |
415 |
578 |
348 |
448 |
213 |
|
Vaccines feel very safe |
52% |
50% |
71% |
68% |
34% |
16% |
|
I get my flu shot whenever I can |
45% |
48% |
58% |
51% |
35% |
16% |
Q009 - QVACTRST: Trust in vaccines: When thinking about vaccines in general, they feel…
Q010 - QFLUSH: Flu Shot: Please rate the extent to which you disagree or agree with the following statement:
Table 11 Attitudes Towards the COVID-19 Vaccine
|
|
|
|
|
Segments |
|
|
|
|
Total |
The Concerned 21% |
The Engaged 29% |
Trusters 17% |
Stoics 22% |
Skeptics 11% |
|
Base=actual |
2002 |
415 |
578 |
348 |
448 |
213 |
|
I will definitely get a COVID-19 vaccine as soon as it becomes available to me |
49% |
52% |
72% |
63% |
26% |
10% |
|
I will probably get a COVID-19 vaccine once I am confident it is safe |
20% |
26% |
19% |
13% |
24% |
12% |
|
I will probably get a COVID-19 vaccine once I am confident it will work |
15% |
15% |
4% |
10% |
31% |
15% |
|
I will probably not get a COVID-19 vaccine |
5% |
3% |
1% |
5% |
11% |
10% |
|
I will definitely not get a COVID-19 vaccine |
7% |
3% |
2% |
2% |
3% |
45% |
|
Will you get the COVID-19 Vaccine |
61% |
67% |
85% |
71% |
38% |
16% |
|
Will you get the COVID-19 Vaccine - Mean |
7. 6 |
8. 1 |
9. 1 |
8. 3 |
6. 6 |
3. 6 |
Q017 - QWHENVAC: Getting the COVID-19 vaccine: Which ONE of the following statements best describes you?
Q016 - QGETVAC: Getting the COVID vaccine: When a COVID-19 vaccine becomes available, how likely or unlikely will you be to get vaccinated?
Table 12a Influence on Likelihood to Take Vaccine
|
|
|
|
|
Segments |
|
|
|
|
Total |
The Concerned 21% |
The Engaged 29% |
Trusters 17% |
Stoics 22% |
Skeptics 11% |
|
Base=actual |
2002 |
415 |
578 |
348 |
448 |
213 |
|
Vaccination Is A Requirement For People To Travel (within Canada Or Outside Of Canada) |
|
|
|
|
|
|
|
A lot more likely to take COVID-19 vaccine |
34% |
46% |
39% |
29% |
28% |
22% |
|
A little more likely to take COVID-19 vaccine |
19% |
20% |
11% |
12% |
34% |
17% |
|
Would make no difference |
39% |
30% |
45% |
48% |
30% |
49% |
|
My family and friends have taken it |
|
|
|
|
|
|
|
A lot more likely to take COVID-19 vaccine |
23% |
31% |
24% |
24% |
22% |
6% |
|
A little more likely to take COVID-19 vaccine |
20% |
20% |
16% |
12% |
36% |
11% |
|
Would make no difference |
48% |
43% |
53% |
50% |
32% |
75% |
|
My doctor or health care provider personally recommends i get vaccinated |
|
|
|
|
|
|
|
A lot more likely to take COVID-19 vaccine |
35% |
48% |
44% |
33% |
25% |
9% |
|
A little more likely to take COVID-19 vaccine |
21% |
22% |
14% |
16% |
35% |
14% |
|
Would make no difference |
36% |
24% |
36% |
40% |
30% |
67% |
|
Seeing Politicians, Health Professionals, And/or Celebrities Get Vaccinated On Camera |
|
|
|
|
|
|
|
A lot more likely to take COVID-19 vaccine |
13% |
17% |
7% |
14% |
23% |
4% |
|
A little more likely to take COVID-19 vaccine |
14% |
15% |
8% |
7% |
30% |
4% |
|
Would make no difference |
68% |
66% |
81% |
71% |
40% |
89% |
Q019 - How would each of the following influence your likelihood of taking a COVID-19 vaccine?
Table 12b Influence on Likelihood to Take Vaccine
|
|
|
|
|
Segments |
|
|
|
|
Total |
The Concerned 21% |
The Engaged 29% |
Trusters 17% |
Stoics 22% |
Skeptics 11% |
|
Base=actual |
2002 |
415 |
578 |
348 |
448 |
213 |
|
It is inconvenient to get vaccinated |
|
|
|
|
|
|
|
A lot less likely to take COVID-19 vaccine |
7% |
5% |
1% |
5% |
16% |
9% |
|
A little less likely to take COVID-19 vaccine |
16% |
16% |
8% |
9% |
29% |
14% |
|
Would make no difference |
67% |
68% |
82% |
71% |
44% |
66% |
|
COVID-19 cases are not declining even though more Canadians are getting vaccinated |
|
|
|
|
|
|
|
A lot less likely to take COVID-19 vaccine |
11% |
10% |
3% |
7% |
22% |
18% |
|
A little less likely to take COVID-19 vaccine |
19% |
21% |
9% |
13% |
35% |
17% |
|
Would make no difference |
57% |
56% |
73% |
64% |
34% |
54% |
|
Reports of serious side effects are posted on social media |
|
|
|
|
|
|
|
A lot less likely to take COVID-19 vaccine |
16% |
26% |
6% |
7% |
23% |
27% |
|
A little less likely to take COVID-19 vaccine |
25% |
28% |
23% |
14% |
36% |
17% |
|
Would make no difference |
45% |
34% |
56% |
58% |
30% |
44% |
Q020 - How would each of the following influence your likelihood of taking a COVID-19 vaccine?
Table 13 Post-COVID-19 Activities Most Looking Forward To
|
|
|
|
|
Segments |
|
|
|
|
Total |
The Concerned 21% |
The Engaged 29% |
Trusters 17% |
Stoics 22% |
Skeptics 11% |
|
Base=actual |
2002 |
415 |
578 |
348 |
448 |
213 |
|
Attending a concert or music festival |
11% |
15% |
8% |
11% |
12% |
15% |
|
Traveling or going on a vacation in Canada |
22% |
19% |
26% |
24% |
19% |
26% |
|
Traveling or going on a vacation outside of Canada |
36% |
38% |
41% |
32% |
31% |
34% |
|
Eating out at restaurants |
36% |
34% |
37% |
47% |
31% |
29% |
|
Going to a gym |
11% |
10% |
9% |
8% |
16% |
12% |
|
Going to bars or nightclubs |
6% |
9% |
3% |
4% |
9% |
10% |
|
My children being back in school or daycare in-person |
4% |
4% |
3% |
4% |
5% |
3% |
|
Going back to workplace in-person |
5% |
5% |
4% |
2% |
8% |
5% |
|
Attending a sporting event |
7% |
6% |
7% |
5% |
7% |
11% |
|
Attending a large social gathering like a wedding, party, etc. |
10% |
11% |
10% |
5% |
9% |
19% |
|
Going to a religious service in person |
6% |
4% |
7% |
5% |
8% |
7% |
|
Going to a movie theatre |
11% |
15% |
8% |
13% |
12% |
10% |
|
Seeing family and/or friends |
57% |
62% |
69% |
64% |
41% |
37% |
|
Attending classes for myself in person |
4% |
4% |
2% |
1% |
9% |
5% |
|
Participating in sports |
6% |
6% |
6% |
4% |
8% |
5% |
|
Shopping at a store/mall |
16% |
15% |
14% |
16% |
21% |
16% |
|
Physical contact like hugs or handshakes |
25% |
28% |
29% |
29% |
16% |
21% |
Q021 - QLKFWD: Activity Looking Forward To: Which THREE activities do you MOST look forward to once the COVID-19 pandemic is over?
Table 14 Media Consumption
|
|
|
|
|
Segments |
|
|
|
|
Total |
The Concerned 21% |
The Engaged 29% |
Trusters 17% |
Stoics 22% |
Skeptics 11% |
|
Base=actual |
2002 |
415 |
578 |
348 |
448 |
213 |
|
Traditional Media |
|
|
|
|
|
|
|
I look to larger, mainstream, traditional media outlets to get accurate information on the news |
64% |
66% |
78% |
74% |
52% |
26% |
|
I look to smaller, alternative, new media outlets to get accurate information on the news |
18% |
15% |
7% |
8% |
30% |
39% |
|
Follow News Media |
|
|
|
|
|
|
|
Very closely |
30% |
33% |
40% |
33% |
22% |
13% |
|
Primary Source of News Media |
|
|
|
|
|
|
|
Live TV news channel or TV news program on a regular TV set |
46% |
41% |
57% |
58% |
33% |
28% |
|
AM/FM radio from a regular receiver |
6% |
6% |
3% |
6% |
7% |
9% |
|
Printed newspapers |
2% |
2% |
1% |
1% |
4% |
1% |
|
Online news sources (Newspapers, TV, or Radio) |
29% |
33% |
30% |
24% |
26% |
31% |
|
Podcasts |
2% |
1% |
1% |
1% |
3% |
2% |
|
Social media (e. g. , Facebook, Twitter, or YouTube) |
13% |
14% |
6% |
7% |
23% |
20% |
|
Trusted Source of Information |
|
|
|
|
|
|
|
Government officials |
21% |
23% |
21% |
33% |
19% |
4% |
|
My doctor or health care provider |
29% |
41% |
36% |
19% |
21% |
23% |
|
Mainstream media (e.g., Newspapers, TV news, Radio, etc.) |
27% |
22% |
32% |
34% |
27% |
17% |
|
Social media (e. g., Facebook, Twitter, YouTube, etc.) |
5% |
6% |
0% |
1% |
13% |
8% |
|
Family and friends |
5% |
2% |
1% |
3% |
13% |
11% |
Q023 - QMEDIA: Which of the following statements best describes you?
Q024 - QFLLW: How closely would you say you are following the news on COVID-19?
Q025 - QPRM: Primary Source of News Media: What has been your PRIMARY source of information on COVID-19?
Q026 - QTRSRC: Trusted Source of Information: Which ONE of the following do you trust the MOST to provide reliable information about COVID-19?
Table 15 Demographics
|
|
|
|
|
Segments |
|
|
|
|
Total |
The Concerned 21% |
The Engaged 29% |
Trusters 17% |
Stoics 22% |
Skeptics 11% |
|
Base=actual |
2002 |
415 |
578 |
348 |
448 |
213 |
|
Gender |
|
|
|
|
|
|
|
Male |
49% |
42% |
46% |
57% |
57% |
44% |
|
Female |
51% |
57% |
54% |
43% |
43% |
56% |
|
Age |
|
|
|
|
|
|
|
18-34 |
28% |
38% |
14% |
17% |
45% |
32% |
|
35-54 |
33% |
30% |
28% |
30% |
40% |
39% |
|
55+ |
39% |
32% |
58% |
52% |
15% |
30% |
|
Region |
|
|
|
|
|
|
|
BC + Yukon Territory |
14% |
16% |
16% |
9% |
12% |
15% |
|
Prairies + Other territories |
18% |
21% |
18% |
13% |
14% |
25% |
|
Ontario |
39% |
45% |
40% |
29% |
43% |
32% |
|
Quebec |
23% |
12% |
19% |
39% |
26% |
21% |
|
Atlantic |
7% |
6% |
7% |
9% |
5% |
6% |
|
Education |
|
|
|
|
|
|
|
High School Or Less |
25% |
27% |
22% |
27% |
21% |
33% |
|
Apprenticeship/College |
36% |
38% |
35% |
35% |
35% |
37% |
|
University or Higher |
38% |
35% |
42% |
36% |
43% |
31% |
|
Languages Spoken |
|
|
|
|
|
|
|
English |
76% |
86% |
82% |
57% |
73% |
77% |
|
French |
22% |
11% |
17% |
40% |
26% |
21% |
|
Employment Status |
|
|
|
|
|
|
|
Working full-time, that is, 35 or more hours per week |
42% |
37% |
35% |
40% |
57% |
40% |
|
Working part-time, that is, less than 35 hours per week |
10% |
11% |
9% |
8% |
13% |
11% |
|
Self-employed |
5% |
6% |
6% |
2% |
5% |
7% |
|
Unemployed, but looking for work |
6% |
9% |
3% |
5% |
5% |
8% |
|
A student attending school full-time |
4% |
7% |
2% |
2% |
6% |
4% |
|
Retired |
24% |
17% |
39% |
34% |
6% |
16% |
|
Not in the workforce (Full-time homemaker, unemployed, not looking for work) |
7% |
11% |
4% |
6% |
6% |
9% |
|
Employed |
57% |
53% |
50% |
50% |
75% |
58% |
|
Unemployed |
6% |
9% |
3% |
5% |
5% |
8% |
|
Others |
36% |
36% |
46% |
43% |
18% |
33% |
|
Work from home |
35% |
30% |
29% |
30% |
53% |
30% |
|
Household Income |
|
|
|
|
|
|
|
Under $60K |
40% |
48% |
36% |
32% |
43% |
45% |
|
$60-100K |
28% |
22% |
30% |
28% |
30% |
26% |
|
$100K-150K |
16% |
18% |
15% |
19% |
12% |
15% |
|
Over $150K |
7% |
3% |
7% |
11% |
6% |
7% |
|
Number of People in Household |
2. 4 |
2. 6 |
2. 2 |
2. 4 |
2. 7 |
2. 5 |
|
One |
22% |
22% |
25% |
24% |
17% |
23% |
|
Two |
36% |
32% |
47% |
41% |
23% |
32% |
|
Three Or More |
39% |
44% |
26% |
34% |
53% |
42% |
|
Born in Canada |
|
|
|
|
|
|
|
Yes |
80% |
80% |
84% |
86% |
67% |
87% |
|
No |
19% |
19% |
15% |
14% |
31% |
13% |
|
Indigenous |
4% |
5% |
2% |
3% |
7% |
3% |
|
Ethnicity |
|
|
|
|
|
|
|
White |
72% |
70% |
84% |
80% |
46% |
87% |
|
South Asian (e. g. , East Indian, Pakistani, Sri Lankan) |
4% |
5% |
2% |
3% |
11% |
0% |
|
Chinese |
7% |
9% |
5% |
4% |
13% |
3% |
|
Black |
4% |
4% |
2% |
2% |
8% |
2% |
|
Filipino |
1% |
1% |
1% |
1% |
2% |
0% |
|
Latin American |
2% |
1% |
1% |
0% |
4% |
1% |
|
Arab |
1% |
1% |
1% |
1% |
4% |
0% |
|
Southeast Asian (e. g. , Vietnamese, Cambodian, Malaysian, Laotian) |
1% |
2% |
0% |
0% |
3% |
0% |
|
West Asian (e. g. , Iranian, Afghan) |
0% |
1% |
0% |
0% |
0% |
0% |
|
Korean |
1% |
2% |
0% |
1% |
1% |
0% |
|
Japanese |
1% |
1% |
1% |
0% |
1% |
0% |
2.6 Methodological Overview
Survey Administration
An online survey was conducted using computer assisted web interviewing (CAWI) technology. CAWI ensures the interview flows as it should with pre-programmed skip patterns. It also controls responses to ensure appropriate ranges and data validity. Surveys were conducted in English or French as chosen by the respondent. All participants were informed of the general purpose of the research, the supplier and that all of their responses would be confidential. At the end of the survey, respondents were informed of the sponsor to avoid inducing bias in responses.
2.7 Pretest
A pretest was undertaken on January 29th that included 43 completes of which, at least 10 were in French. No changes were made to the survey and as such the completion were included in the final data set.
2.8 Data Collection
Respondents were randomly selected from Kantar’s online panel and invited to participate in the survey by email and/or personal online dashboard via Kantar Profile’s website. Panellists who participate in surveys are incentivized through a points system that is redeemable for a variety of gift cards. As such, points were provided as remuneration for participating in the survey.
Table 16 Sample Quotas
|
Atlantic |
Quebec |
Ontario |
Prairies+ NWT +Nunavut |
BC+ Yukon |
Totals |
|
|
18-34 |
37 |
131 |
225 |
108 |
79 |
580 |
|
35-54 |
44 |
154 |
264 |
126 |
93 |
680 |
|
55+ |
47 |
167 |
287 |
137 |
101 |
740 |
|
Totals |
128 |
452 |
776 |
371 |
273 |
2000 |
Given that this is an online panel, Canadians without internet access (6% of Canadians) will not be reached. Additionally, this survey will not cover Canadians who are not members of a panel; however, the total number of those who are not members of a panel cannot be calculated, as Kantar’s panel partner may supplement or blend panel with external Canadian panel suppliers.
2.9 Weighting
To aim for the sample to be representative of the Canadian adult population 18+, the design first implemented controls using quota sampling. Quota variables included age and region. In addition to the previously mentioned quotas, the final sample was weighted using age, gender and region information available from Statistics Canada outlined below.
Table 17 Unweighted
|
|
|
|
|
Region |
|
|
|
|
Total |
Atlantic |
Quebec |
Ontario |
Prairies, NWT & Nunavut |
B. C. & Yukon |
|
Base=actual |
2002 |
128 |
451 |
776 |
374 |
273 |
|
Male 18 to 34 |
142 |
6 |
24 |
65 |
31 |
16 |
|
|
7% |
5% |
5% |
8% |
8% |
6% |
|
Male 35 to 54 |
279 |
21 |
62 |
104 |
60 |
32 |
|
|
14% |
16% |
14% |
13% |
16% |
12% |
|
Male 55+ |
581 |
40 |
145 |
212 |
96 |
88 |
|
|
29% |
31% |
32% |
27% |
26% |
32% |
|
Female 18 to 34 |
438 |
31 |
107 |
161 |
77 |
62 |
|
|
22% |
24% |
24% |
21% |
21% |
23% |
|
Female 35 to 54 |
401 |
23 |
88 |
162 |
67 |
61 |
|
|
20% |
18% |
20% |
21% |
18% |
22% |
|
Female 55+ |
161 |
7 |
25 |
72 |
43 |
14 |
|
|
8% |
5% |
6% |
9% |
11% |
5% |
Table 18 Weighted
|
Region |
||||||
|
Total |
Atlantic |
Quebec |
Ontario |
Prairies, NWT & Nunavut |
B. C. & Yukon |
|
|
Base=actual |
2002 |
128 |
451 |
776 |
374 |
273 |
|
Male 18 to 34 |
292 |
16 |
61 |
118 |
57 |
40 |
|
|
15% |
12% |
13% |
15% |
16% |
14% |
|
Male 35 to 54 |
325 |
20 |
75 |
123 |
62 |
44 |
|
|
16% |
15% |
16% |
16% |
17% |
16% |
|
Male 55+ |
371 |
28 |
91 |
140 |
59 |
53 |
|
|
19% |
21% |
20% |
18% |
17% |
19% |
|
Female 18 to 34 |
276 |
16 |
57 |
111 |
54 |
38 |
|
|
14% |
12% |
13% |
14% |
15% |
14% |
|
Female 35 to 54 |
328 |
21 |
73 |
128 |
61 |
46 |
|
|
16% |
16% |
16% |
16% |
17% |
16% |
|
Female 55+ |
410 |
31 |
99 |
158 |
64 |
58 |
|
|
20% |
23% |
22% |
20% |
18% |
21% |
2.10 Online Completion Rate
A total of 7637 invitations were sent to panellists, of which n=2,002 completed the survey. The overall completion rate achieved for the online study was 63%. The following table outlines the sample disposition and response rate as per the former Marketing Research and Intelligence Association guidelines.
Table 19 Completion Rate
|
|
|
|
Total Invitations Sent |
7637 |
|
Contacts |
3200 |
|
Completes |
2002 |
|
Break Offs[2] |
200 |
|
Over Quota[3] |
925 |
|
Non-Qualifiers[4] |
75 |
|
Completion Rate[5] |
63% |
|
Incidence Rate |
96% |
2.11 Non-response Bias
A non-response bias analysis is the process that results in the quantification of estimated nonresponse bias, and identification of potential sources of nonresponse bias on estimates. To ensure a representative sample, this research used completion quotas and as such a non-response bias analysis cannot be undertaken.
2.12 Margin of Error
As mentioned previously, panel sample was used for this study. Panel surveys are considered a non-random sample and as such margin of error does not apply nor can the results be extrapolated to the Canadian population.
Tabulated Data
Detailed tables are included under separate cover.
3. Appendix B: English Survey Instrument
|
||||
|
||||
|
||||
|
||||
|
|
||
|
||
|
||
|
|
|
||||||
|
||||||
|
||||||
|
||||||
|
|
||
|
||
|
||
|
||
|
|
||||||||||||||||||||||||
|
||||||||||||||||||||||||
|
||||||||||||||||||||||||
|
||||||||||||||||||||||||
|
||||||||||||||||||||||||
|
||||||||||||||||||||||||
|
||||||||||||||||||||||||||||||||||||||||||
|
||||||||||||||||||||||||||||||||||||||||||
|
||||||||||||||||||||||||||||||||||||||||||
|
||||||||||||||||||||||||||||||||||||||||||
|
||||||||||||||||||||||||||||||||||||||||||
|
|
|
||||||||||||||||||||||||||||||||||||
|
||||||||||||||||||||||||||||||||||||
|
||||||||||||||||||||||||||||||||||||
|
||||||||||||||||||||||||||||||||||||
|
||||||||||||||||||||||||||||||||||||
|
||||||||||||||||||||||||||||||||||||
|
|
|||||||||||||||||||||||||||||||||||||||||||||||||||||||||||||||||||||||||||||||||||||||||||||||||||||||||||||||||||||
|
|||||||||||||||||||||||||||||||||||||||||||||||||||||||||||||||||||||||||||||||||||||||||||||||||||||||||||||||||||||
|
|||||||||||||||||||||||||||||||||||||||||||||||||||||||||||||||||||||||||||||||||||||||||||||||||||||||||||||||||||||
|
|||||||||||||||||||||||||||||||||||||||||||||||||||||||||||||||||||||||||||||||||||||||||||||||||||||||||||||||||||||
|
|||||||||||||||||||||||||||||||||||||||||||||||||||||||||||||||||||||||||||||||||||||||||||||||||||||||||||||||||||||
|
|||||||||||||||||||||||||||||||||||||||||||||||||||||||||||||||||||||||||||||||||||||||||||||||||||||||||||||||||||||
|
|
||||||||||||||||||||||
|
||||||||||||||||||||||
|
||||||||||||||||||||||
|
||||||||||||||||||||||
|
|
||||||||||||||||||||||
|
||||||||||||||||||||||
|
||||||||||||||||||||||
|
||||||||||||||||||||||
|
|
||||||||||||||||||||||||
|
||||||||||||||||||||||||
|
||||||||||||||||||||||||
|
||||||||||||||||||||||||
|
||||||||||||||||||||||||
|
||||||||||||||||||||||||
|
|
|||||||||||||||||||||||||||||||||||||||||||||||||||||||||||||||||||||||||||||||||||||||||||||||||||||||||||||||||||||
|
|||||||||||||||||||||||||||||||||||||||||||||||||||||||||||||||||||||||||||||||||||||||||||||||||||||||||||||||||||||
|
|||||||||||||||||||||||||||||||||||||||||||||||||||||||||||||||||||||||||||||||||||||||||||||||||||||||||||||||||||||
|
|||||||||||||||||||||||||||||||||||||||||||||||||||||||||||||||||||||||||||||||||||||||||||||||||||||||||||||||||||||
|
|||||||||||||||||||||||||||||||||||||||||||||||||||||||||||||||||||||||||||||||||||||||||||||||||||||||||||||||||||||
|
|||||||||||||||||||||||||||||||||||||||||||||||||||||||||||||||||||||||||||||||||||||||||||||||||||||||||||||||||||||
|
|
||||||||
|
||||||||
|
||||||||
|
||||||||
|
|
|
|
||||||||||
|
||||||||||
|
|
||||||||||
|
||||||||||
|
|
||||||||||||||||||||||||||||
|
||||||||||||||||||||||||||||
|
||||||||||||||||||||||||||||
|
||||||||||||||||||||||||||||
|
||||||||||||||||||||||||||||
|
||||||||||||||||||||||||||||
|
|
||||||||||||||||||||||
|
||||||||||||||||||||||
|
||||||||||||||||||||||
|
||||||||||||||||||||||
|
|
||||||||||||
|
||||||||||||
|
||||||||||||
|
||||||||||||
|
|
||
|
||
|
||
|
||
|
||
|
|
|
||||||||||||||||||||||||||||||||||||
|
||||||||||||||||||||||||||||||||||||
|
||||||||||||||||||||||||||||||||||||
|
||||||||||||||||||||||||||||||||||||
|
||||||||||||||||||||||||||||||||||||
|
||||||||||||||||||||||||||||||||||||
|
|
||||||||||||||||||||||||||||||
|
||||||||||||||||||||||||||||||
|
||||||||||||||||||||||||||||||
|
||||||||||||||||||||||||||||||
|
||||||||||||||||||||||||||||||
|
||||||||||||||||||||||||||||||
|
|
|
|
|
||||||||||||||||||||||||||||||||||||||
|
||||||||||||||||||||||||||||||||||||||
|
||||||||||||||||||||||||||||||||||||||
|
||||||||||||||||||||||||||||||||||||||
|
||||||||||||||||||||||||||||||||||||||
|
|
||||||||||||
|
||||||||||||
|
||||||||||||
|
||||||||||||
|
||||||||||||
|
|
|
|
||||||
|
||||||
|
||||||
|
||||||
|
|
||||||||||
|
||||||||||
|
||||||||||
|
||||||||||
|
|
||||||||||||||||
|
||||||||||||||||
|
||||||||||||||||
|
||||||||||||||||
|
||||||||||||||||
|
||||||||||||||||
|
|
||||||||||||||
|
||||||||||||||
|
||||||||||||||
|
||||||||||||||
|
||||||||||||||
|
|
|
|
||||||||
|
||||||||
|
||||||||
|
||||||||
|
||||||||
|
||||||||
|
|
||||||||||||||||
|
||||||||||||||||
|
||||||||||||||||
|
||||||||||||||||
|
|
||||||||||||||||||
|
||||||||||||||||||
|
||||||||||||||||||
|
||||||||||||||||||
|
||||||||||||||||||
|
|
||||||||
|
||||||||
|
||||||||
|
||||||||
|
||||||||
|
|
||||||||||||||||
|
||||||||||||||||
|
||||||||||||||||
|
||||||||||||||||
|
|
||
|
||
|
||
|
||
|
|
||||||
|
||||||
|
||||||
|
||||||
|
|
||
|
||
|
||
|
||
|
ADD: Prefer not to answer OPTION
|
||||||
|
||||||
|
||||||
|
|
||||||
|
||||||
|
|
||||||||||||||||||||||||||
|
||||||||||||||||||||||||||
|
||||||||||||||||||||||||||
|
||||||||||||||||||||||||||
|
||||||||||||||||||||||||||
|
||||||||||||||||||||||||||
|
|
||
|
||
|
||
|
||
|
||
|
||
|
||
|
||
|
|
|
||
|
||
|
||
|
4. Appendix C: French Survey Instrument
|
||||
|
||||
|
||||
|
||||
|
|
||
|
||
|
||
|
|
|
||||||
|
||||||
|
||||||
|
||||||
|
|
||
|
||
|
||
|
||
|
|
||||||||||||||||||||||||
|
||||||||||||||||||||||||
|
||||||||||||||||||||||||
|
||||||||||||||||||||||||
|
||||||||||||||||||||||||
|
||||||||||||||||||||||||
|
||||||||||||||||||||||||||||||||||||||||||
|
||||||||||||||||||||||||||||||||||||||||||
|
||||||||||||||||||||||||||||||||||||||||||
|
||||||||||||||||||||||||||||||||||||||||||
|
||||||||||||||||||||||||||||||||||||||||||
|
|
|
||||||||||||||||||||||||||||||||||||
|
||||||||||||||||||||||||||||||||||||
|
||||||||||||||||||||||||||||||||||||
|
||||||||||||||||||||||||||||||||||||
|
||||||||||||||||||||||||||||||||||||
|
||||||||||||||||||||||||||||||||||||
|
|
|||||||||||||||||||||||||||||||||||||||||||||||||||||||||||||||||||||||||||||||||||||||||||||||||||||||||||||||||||||
|
|||||||||||||||||||||||||||||||||||||||||||||||||||||||||||||||||||||||||||||||||||||||||||||||||||||||||||||||||||||
|
|||||||||||||||||||||||||||||||||||||||||||||||||||||||||||||||||||||||||||||||||||||||||||||||||||||||||||||||||||||
|
|||||||||||||||||||||||||||||||||||||||||||||||||||||||||||||||||||||||||||||||||||||||||||||||||||||||||||||||||||||
|
|||||||||||||||||||||||||||||||||||||||||||||||||||||||||||||||||||||||||||||||||||||||||||||||||||||||||||||||||||||
|
|
||||||||||||||||||||||
|
||||||||||||||||||||||
|
||||||||||||||||||||||
|
||||||||||||||||||||||
|
|
||||||||||||||||||||||
|
||||||||||||||||||||||
|
||||||||||||||||||||||
|
||||||||||||||||||||||
|
|
||||||||||||||||||||||||
|
||||||||||||||||||||||||
|
||||||||||||||||||||||||
|
||||||||||||||||||||||||
|
||||||||||||||||||||||||
|
||||||||||||||||||||||||
|
|
|||||||||||||||||||||||||||||||||||||||||||||||||||||||||||||||||||||||||||||||||||||||||||||||||||||||||||||||||||||
|
|||||||||||||||||||||||||||||||||||||||||||||||||||||||||||||||||||||||||||||||||||||||||||||||||||||||||||||||||||||
|
|||||||||||||||||||||||||||||||||||||||||||||||||||||||||||||||||||||||||||||||||||||||||||||||||||||||||||||||||||||
|
|||||||||||||||||||||||||||||||||||||||||||||||||||||||||||||||||||||||||||||||||||||||||||||||||||||||||||||||||||||
|
|||||||||||||||||||||||||||||||||||||||||||||||||||||||||||||||||||||||||||||||||||||||||||||||||||||||||||||||||||||
|
|
||||||||
|
||||||||
|
||||||||
|
||||||||
|
|
|
|
||||||||||
|
||||||||||
|
||||||||||
|
||||||||||
|
|
||||||||||||||||||||||||||||
|
||||||||||||||||||||||||||||
|
||||||||||||||||||||||||||||
|
||||||||||||||||||||||||||||
|
||||||||||||||||||||||||||||
|
||||||||||||||||||||||||||||
|
|
||||||||||||||||||||||
|
||||||||||||||||||||||
|
||||||||||||||||||||||
|
||||||||||||||||||||||
|
|
||||||||||||
|
||||||||||||
|
||||||||||||
|
||||||||||||
|
|
||
|
||
|
||
|
Pourquoi ne vous ferez-vous pas vacciner contre la COVID-19?
|
||
|
||
|
|
|
||||||||||||||||||||||||||||||||||||
|
||||||||||||||||||||||||||||||||||||
|
||||||||||||||||||||||||||||||||||||
|
||||||||||||||||||||||||||||||||||||
|
||||||||||||||||||||||||||||||||||||
|
|
||||||||||||||||||||||||||||||
|
||||||||||||||||||||||||||||||
|
||||||||||||||||||||||||||||||
|
||||||||||||||||||||||||||||||
|
||||||||||||||||||||||||||||||
|
|
|
|
|
||||||||||||||||||||||||||||||||||||||
|
||||||||||||||||||||||||||||||||||||||
|
||||||||||||||||||||||||||||||||||||||
|
||||||||||||||||||||||||||||||||||||||
|
||||||||||||||||||||||||||||||||||||||
|
|
||||||||||
|
||||||||||
|
||||||||||
|
||||||||||
|
||||||||||
|
|
|
|
||||||
|
||||||
|
||||||
|
||||||
|
|
||||||||||
|
||||||||||
|
||||||||||
|
||||||||||
|
|
||||||||||||||||
|
||||||||||||||||
|
||||||||||||||||
|
||||||||||||||||
|
||||||||||||||||
|
||||||||||||||||
|
|
||||||||||||||
|
||||||||||||||
|
||||||||||||||
|
||||||||||||||
|
||||||||||||||
|
|
|
|
||||||||
|
||||||||
|
||||||||
|
|
||||||||
|
||||||||
|
|
||||||||||||||||
|
||||||||||||||||
|
||||||||||||||||
|
||||||||||||||||
|
|
||||||||||||||||||
|
||||||||||||||||||
|
||||||||||||||||||
|
||||||||||||||||||
|
||||||||||||||||||
|
|
||||||||
|
||||||||
|
||||||||
|
||||||||
|
||||||||
|
|
||||||||||||||||
|
||||||||||||||||
|
Lequel des énoncés suivants décrit le mieux le revenu total de votre ménage l’an dernier, avant impôt, de toutes les sources et pour tous les membres du ménage?
|
||||||||||||||||
|
||||||||||||||||
|
|
||
|
||
|
||
|
||
|
|
||||
|
||||
|
||||
|
||||
|
Je préfère ne pas répondre
|
||
|
||
|
||
|
||
|
Je préfère ne pas répondre
|
||||||
|
||||||
|
||||||
|
|
||||||
|
||||||
|
|
||||||||||||||||||||||||||
|
||||||||||||||||||||||||||
|
||||||||||||||||||||||||||
|
||||||||||||||||||||||||||
|
||||||||||||||||||||||||||
|
||||||||||||||||||||||||||
|
|
||
|
||
|
||
|
||
|
||
|
||
|
||
|
||
|
|
|
||
|
||
|