Use of Public Health Measures (PHMs), Advice and Risk Assessment Survey
Final Report
Prepared for the Public Health Agency of Canada by Abacus Data
March 2023
The Public Health Agency of Canada commissioned Abacus Data to conduct a public opinion research survey to understand how people make decisions regarding the use of public health measures (PHMs) during the COVID-19 pandemic and beyond. A total of 6200 Canadians were surveyed using an online panel to reflect the Canadian population. The online survey was conducted between February 7 and 24, 2023. In addition, a total of 9 focus groups were conducted online in the Fall of 2022. This publication reports on the findings of this research.
Cette publication est aussi disponible en français sous le titre: L'utilisation des conseils sur les mesures de santé publique (MSP) et l'évaluation des risques.
Permission to Reproduce
This publication may be reproduced for non-commercial purposes only. Prior written permission must be obtained from the Public Health Agency of Canada. For more information on this report, please contact:
The Public Health Agency of Canada (PHAC) needs to understand how people make decisions regarding the use of Public Health Measures (PHMs) during the COVID-19 pandemic and beyond. PHMs have been one of the primary tools available to public health organizations to reduce COVID-19 transmission in communities during the pandemic and for other public health issues. A key area of interest is understanding how people assess and understand their risk and how this informs their decisions about the use of PHMs.
The results of the research will inform future development of public facing PHM guidance products, tools, and messaging.
1.2. Research Objectives
The overall objectives of the research are to:
Understand how people use and understand risk assessments to make decisions during the COVID-19 pandemic and going forward.
Measure and understand how people access PHM information; and
Evaluate how people use PHM advice to protect themselves and those around them.
1.3. Methodology
Qualitative Research
The purpose of the qualitative, focus group phase is to inform the development of the survey and to test assumptions. The qualitative phase of the research consisted of nine (9) online focus groups with the Canadian public conducted between November 28 and December 1, 2022.
Details of the focus groups are shown in the table opposite.
In total, there were 82 participants.
Each focus group was 90 minutes in length.
Observers from PHAC and other government stakeholders attended each focus group.
The focus groups were moderated based on an approved discussion guide and included a review of materials developed by PHAC.
Quantitative Research
The online quantitative survey was conducted between February 7 and February 24, 2023. A total of 6,200 surveys were completed across Canada using an online panel. As a non-probability sample, the results cannot be extrapolated to the general population, and there is no margin of error associated with the findings.
Sub-group analyses and rounding
In addition to descriptive analysis, analysis was undertaken to establish any differences in views based on personal demographic characteristics, such as location (province and rural versus urban), gender, and identity (e.g., Indigenous). Where appropriate, analysis of differences based on experiences (previous COVID-19 illness), vaccination status, and attitudes (such as trust) were also undertaken.
Key sub-groups analyzed throughout the report are: demographics (e.g., age, gender, geographic location), at-risk status, and vaccination status. The full breakdown of the results is included in the accompanying data tables under separate cover.
Those at high risk of severe illness and negative health outcomes due to COVID-19 include those who haven't received all of their recommended COVID-19 vaccine doses as well as those with a number of other age and heath factors. For the purposes of this report, those at-risk due to age and health factors will be differentiated from those at-risk due to their vaccination status as these groups vary significantly in their perceptions of risk, attitudes and behaviours relating to COVID-19.
Within the report when discussing those at-risk due to age and health factors, they will be identified as 'at-risk' and are based on the following characteristics:
Being immune compromised.
living with obesity.
having a chronic medical condition.
being pregnant.
being over the age of 60.
Those who have not received their recommended COVID-19 vaccine doses also remain at high risk but have been reported on separately within the report. Not vaccinated are anyone who has not received the primary series.
Note that due to rounding, in some cases it may appear that merged categories collapsed together are different by a percentage point from how they are presented individually, and totals may not add up to 100%.
1.4. Contract value
The total contract value for the project was $172,236.86 including applicable taxes.
1.5. Statement of Political Neutrality
I hereby certify as a representative of Abacus Data that the deliverables fully comply with the Government of Canada political neutrality requirements outlined in the Communications Policy of the Government of Canada and Procedures for Planning and Contracting Public Opinion Research. Specifically, the deliverables do not include information on electoral voting intentions, political party preferences, standings with the electorate or ratings of the performance of apolitical party or its leaders.
Richard Jenkins, Ph.D., CAIP
1.6. Summary of Findings
Perceptions of Risk
Three aspects of risk (likelihood of getting an infection, susceptibility to having a severe consequence, and the perceived severity of the illness) were tested for three illnesses (COVID-19, Respiratory syncytial virus (RSV), and Influenza (the flu)).
Influenza has the highest perceived likelihood of getting an infection (mean=4.2 out of 10) followed by COVID-19 (4.1) and RSV (3.4).
The flu has the lowest perceived susceptibility to severe outcomes from an illness (mean=3.5) and COVID-19 has the highest (3.8).
COVID-19 is widely viewed as a serious illness by respondents, as 32% think it is either life-threatening or requiring hospitalization, but RSV is also recognized as either life-threatening or requiring hospitalization (39%). Only 17% think the flu is that serious.
Perceptions of all three constructs, likelihood of infection, susceptibility to sever consequences and seriousness of the illness are driven by similiar demographic and attitudinal differences. The multivariate regression indicates that the three most important drivers of perceived risk for all three concepts are:
Being at-risk because of having a health condition (chronic illness, immune compromised, obese, or pregnant) or being over 60 years of age is a driver of perceived risk. In particular, at-risk individuals think they are more susceptible to having a severe outcome from COVID-19, RSV or the flu.
Those who are vaccinated against COVID-19 are more likely to think they could get COVID-19, more likely to think they are susceptible to a serious illness, and more likely to think it is a serious illness. Those with 2 or more boosters are even more likely than those with only the primary series to have higher likelihood, susceptibility, and to think COVID-19 is serious.
Trust in government and to a lesser degree, trust in hospitals/health care workers, is associated with higher perceived risk on all three measures.
Focus group participants have some confusion regarding their assessment of their risk of getting infected compared to the amount of risk they are willing to accept. Several mention that though they believe the risk of infection remains high, they are not as concerned about severe outcome on a personal level (for reasons such as being vaccinated, perception that newer variants of COVID are not as severe, and personal experience with a previous infection).
In the survey, the top information that survey participants respondents identify they use to assess their risk are their health status (54%), vaccination status (47%), and reported data on the illness (35%). Other types of information that are important include information about the people one will be interacting with (30%), experience of friends (29%), reported information about circulating variants (28%), information about the places that will be visited (26%), and previous experience with respiratory infectious diseases (25%).
Focus group participants are sensitive to the risk of interacting with others and will seek information about how many people will be present and assess whether they know and trust them. Information about the places visited that are salient among focus group participants include space and ability to distance, ventilation, and the availability of fresh air. The sense of personal control and risk to others, especially those at a high-risk, is also noted as important in the focus groups.
Survey respondents express higher concern about COVID-19 (mean=4.7 out of 10) than for RSV (4.2) and the flu (4.2). While a large proportion of respondents have a low level of concern (e.g., 41% rate their concern 1, 2, or 3), there is a group of 14-20% who are highly concerned with getting each illness.
At the time of the survey (February 2023), the perceived risk of various social activities are quite modest for most respondents. Attending a concert (55% very or extremely risky) and going to a bar to meet with friends (41%) are viewed as the riskiest. In comparison, only 27% think shopping in a large retail grocery or department store has this level of risk. Similarly, only 28% think having a dinner party with people from different households is very risky. People who are concerned with the illness are more likely to think it is risky to engaged in these behaviours.
Trust and Information Sources
Trust, particularly in the Government and health care sector, is central to the effectiveness of public health measures. While respondents have a lot of trust in hospitals and healthcare workers (mean=7.3 out of 10), trust in the federal government (e.g., the Public Health Agency of Canada) is much lower (5.7). In fact, 24% have very little trust (1, 2, or 3 on a 10-point scale) compared with 32% with high trust (8-10).
Traditional news outlets (53%), the Public Health Agency of Canada (50%), and local health authorities (47%) are the top 3 sources of information about COVID-19 and other respiratory infectious diseases. Friends and family (35%) are another important source for many. Social media, either generally (20%) or government accounts (20%), are less important.
Focus group participants appeared to be clearly informed about COVID-19 and the resulting public health measures and those in the high-risk groups appeared to have spent more time researching and looking for information. Trust is a key factor in explaining how the participants used information sources, with several participants identifying social media as not credible or trustworthy, which is reflected in its use as indicated by survey respondents.
Attitudes about and Adherence to Public Health Measures
A large majority of survey respondents believe they have the skills/capabilities to use public health measures. More than eight in ten agree or somewhat agree that it's easy to use public health measures (82%) and 85% know how to use them.
Three quarters (74%) of respondents are motivated to use PHMs when they are concerned about getting sick. A similar proportion of respondents think PHMs are effective (77%) and say that using public health measures is important to them (78%).
Almost two thirds (64%) are more likely to use a mask when they see others around them using a mask.
When deciding whether to attend an event or gathering, respondents indicate that their health status is the most important consideration (46% very important). The next most important considerations are a range of other information factors, such as current local public health recommendations (33%), the number of COVID-19 cases in the community (32%), level of other respiratory illnesses in the community (31%), and the size of the gathering (31%).
A large majority (85%) think it is important for people to stay home and away from others when they have symptoms of a respiratory infectious disease; a small (11%) group rejects this idea.
To test how people decide to cancel (or not) plans due to illness, an experiment was conducted in the survey. Each respondent was randomized to consider a scenario where they had cold or flu symptoms and either: 1. had not tested for COVID-19; 2. had a negative COVID-19 test; or 3. had a positive COVID-19 test.
In considering the scenario of going to a restaurant for a meal, those who had a positive COVID-19 test are the most likely to cancel plans (58%), and those who tested negative are least likely to cancel (41%). Those who did not take a test are in the middle of these two other groups (49%). Surprisingly, among those who tested positive for COVID-19, one in ten are not at all likely to cancel plans for going to a restaurant.
For those in the positive test group, there is little variation in cancelling plans across the different scenarios. These individuals are the most likely to cancel plans for going to work (63%) and least likely to cancel plans for going shopping in a large retail grocery or department store (53%). There is more variation across the scenarios for the negative or no test groups. The no test group were most likely to cancel plans for visiting someone at-risk (59%) and least likely to cancel plans for going to work (41%) or shopping (41%). The negative test group is also most likely to cancel visiting someone at-risk (53%) and least likely to cancel plans for going to work (32%) or going to a pub to meet friends (33%).
Attitudes about Masks, Mandates and Staying Home
Participant attitudes about masks are generally positive regarding their effectiveness and use. Three quarters (75%) at least somewhat agree that masks are an effective way to reduce the transmission of respiratory infectious diseases. Many respondents (65%) indicate they always have a mask when they go out, and 63% have a specific plan for when they will wear a mask.
When it comes to mask mandates, respondents are supportive of mask mandates when there are high number of cases (75% at least somewhat agree). That said, 35% of respondents don't think mask mandates are effective.
Health status is again the most important consideration (46% very important) for deciding on wearing a mask, followed by current local public health recommendations (35%), the number of COVID-19 cases in the community (36%), level of other respiratory illnesses in the community (34%), and the size of the gathering (33%).
Always wearing a mask in different situations is common for a relatively small group. For example, only 9% of respondents always wear a mask outside and 10% in a private indoor setting with people outside their household. The most likely situations that prompt wearing a mask is when feeling sick around others (33% always) or when interacting with someone who is at a risk of more severe outcomes from a respiratory illness (32% always).
The top reason for wearing a mask is to protect more vulnerable individuals (35%). The next most mentioned reasons are the reduced likelihood of getting COVID-19 and other viruses (32%), mask mandates (31%), and reducing the spread of illnesses, including COVID-19 (31%). One in five (21%) respondents say that public health recommendations are in their top 3.
The top reason cited for not wearing a mask is that it is not required (26%). The next most mentioned reasons are they forget to have one (19%), masks are uncomfortable (18%), no one else is wearing a mask (14%), and they are sick and tired of wearing a mask (14%). Just over a quarter of respondents said there are no reasons for them not wearing a mask.
In the focus group discussions, the most common measures that participants mention taking to mitigate their risk at this stage in the pandemic (November – December 2022) include the use of hand sanitizer and masking (though, most participants freely admit it is limited to specific activities/scenarios, i.e., they do not generally mask). Some also continue to stay at home as much as possible and limit contact with others as much as possible. However, in general, most participants are not nearly as conscientious about public health measures as they were during the height of the pandemic. This is a result of a confluence of factors: pandemic fatigue, vaccinations, and the perception that COVID outcomes are not as severe as before.
COVID-19 Other Illnesses and Actions Taken
Almost half (45%) of respondents report that they have tested positive for COVID-19 since the start of the pandemic, and 11% have had multiple infections. More than a quarter (28%) of those who tested positive since the start of the pandemic have had an infection since October 2022.
For those who tested positive for COVID-19 at some point, most (83%) isolated themselves from people outside their household, and 88% of those who work outside the home avoided going to work the last time they tested positive for COVID-19. Most respondents (76%) also wore a mask when around others because of their positive test. Not as many (57%) isolated themselves from others in their household. Half (51%) were instructed by health authorities to isolate but instructions to isolate were more prominent among those whose last infection was in 2020 (62% were instructed) compared with the first two months of 2023 (36%). The fewer instructions to isolate likely is related to the fact that the testing regime changed from clinic testing site (where the instructions could be given) to at home rapid tests.
For those who tested positive and isolated from others, 92% isolated for at least 5 days and 33% for 10 or more days. Over time, the frequency of isolating for 10 or more days declined. In 2020, 41% isolated for 10 or more days compared with only 18% of those whose last infection was in the first 2 months of 2023. In addition, 19% left the house during their isolation and may have come into contact with other people. Leaving the house was most likely early in the pandemic (28% in 2020) and in the first couple months of 2023 (29%).
Respondents were also asked about how they dealt with having other illnesses or suspected COVID-19 in the past 30 days. Those who were sick with something other than COVID-19 or suspected they might have COVID-19 (unconfirmed by a test) were less likely than those who tested positive for COVID-19 to take precautions. Most commonly, these respondents isolated themselves from people outside of their household (69%) and avoided going to work (68%). Of those who isolated, 72% isolated for 5 days or more. Almost four in ten (38%) left their house during their isolation. Leaving the house was most likely early in the pandemic (57% in 2020) and declined in 2022 (39%) and 2023 (35%).
COVID-19 Vaccination Status and At-Risk Health
More than eight in ten (85%) respondents reported that they have received the primary series of the COVID-19 vaccine, and 33% have had at least one booster.
A series of health conditions such as being obese, immune compromised, having a chronic medical condition and being pregnant increase the risk that individuals face from a COVID-19 illness.[2] Forty-one percent had one of these health conditions. Those who are 60 years and older are also at a greater risk. Using these two qualifications (age and health), 56% of respondents are at a greater risk. The at-risk population is 61% if those who are not fully vaccinated are included.
2. Detailed Findings from the Qualitative Research
2.1. Concerns about COVID-19
Many participants indicated they were not that concerned about COVID-19 during the very early stages (when it was predominantly in Asia and Europe). Some of the reasons given included being young and healthy (not high risk), the belief it would "blow over" and that Canada would not be as affected as elsewhere. Their level of concern increased as it became apparent that it was serious with severe consequences.
The Federal Government's announcement to stop all travel was a turning point for many who started to feel COVID-19 was far more serious than they initially thought. From this point on, concerns about getting COVID-19 were high (though a few were still not overly concerned). The fear of the unknown, as well as reports of severe health outcomes and fatalities were major contributors to the high levels of concern.
Although most English participants who are in the high risk category were more likely to be concerned about getting infected with COVID-19, most participants in the French group echoed the other groups. Despite the fact they were at higher risk, most francophone participants indicated they were more concerned for loved ones than themselves. That being said, they also had a heightened awareness of the progress of the pandemic and the measures to be taken.
It was more common for participants to be more concerned about COVID-19 for their elderly parents, very young children or others with health issues than for themselves.
2.2. Actions Related to COVID-19
All participants took at least some precautions once it was apparent COVID-19 posed very serious health issues. The measures they took included:
Sanitizing and hand hygiene – this was one of the most broadly mentioned actions taken. Most participants mentioned always using hand sanitizer and wiping down things (from food to handles). Many participants in the French groups expressed concerns about fresh produce being contaminated, and also claimed they washed their groceries upon returning home.
Isolating – staying home and avoiding people (especially crowds) was one of the most common actions that was taken, most notably early on in the pandemic.
Social distancing – keeping a good distance from others while being out, whether at a store or even for a walk, was widely adhered to.
Masking – everyone used masks as it was mandated; however, a few participants noted that there was mixed messaging early on about the need for masks and also about the types of masks to be worn. For several in the French groups, this led to confusion and lack of credibility of the messaging with regard to mask-wearing, and the seriousness of the pandemic in general.
Minimizing contact – several participants mentioned restricting the number of people they would keep in physical contact with (i.e. maintain a small bubble) as a means to reducing the chance of getting infected.
None of the participants voluntarily mentioned ventilation as a measure to mitigate COVID-19 spontaneously, but once it was raised many claimed they did this as well (although many also said this was impractical during the winter months).
2.3. Perceptions of Risk
When the topic of risk was raised there was considerable inconsistency with respect to participants' assessment of the risk of getting infected vs. the amount of risk they are willing to accept. Many participants first indicated they felt the "risk" was low, but then contradicted themselves by saying they realized there is risk, but they are willing to accept that risk to return to more "normal lives." In addition, participants tended to confuse their perceived risk of contracting COVID-19 (or other respiratory illnesses), with having severe outcomes.
The ways in which participants gauged the risk of getting COVID-19 differs from person to person. Ways in which they assess this risk include:
Personal factors, such as age and health.
Exposure to others, specifically, the size of gatherings. For most participants, more people equals greater risk, i.e. who they might be seeing, including those who may be sick.
Knowing and trusting who is in the gathering. Generally, participants felt that there was less risk if they knew (and trusted) who was in the gathering, since they could trust people to stay away if they had symptoms.
Ability to distance. Participants felt there was less risk where they could keep their distance from others, and conversely there was greater risk if they could not distance
Ventilation and availability of outdoor air. Staying outdoors constituted no to low risk, whereas indoor rooms with little outdoor air circulation was considered higher risk.
Level of infection in the community, i.e. case counts, hospitalizations, etc.
Personal control. Participants tended to feel that risk was lower when they felt they had a sense of control over the variables above.
Using common sense – acting in a way the minimizes the chances of getting infected such as staying away from crowded settings, masking and using hand sanitizer.
Many participants were more sensitive to the risk of infection to others, especially high risk groups, than for themselves.
Several mentioned that though they believe the risk of infection remains high, they are not as concerned on a personal level (for reasons such as being vaccinated, perception that newer variants of COVID-19 are not as severe, and personal experience with a previous infection).
2.4. Risk Over Time
The perception about the risk of contracting COVID-19 has evolved over time. There is general agreement that this risk was very high at the outset of the pandemic though there is some divergence of opinion on the current risk.
Several participants believe that the risk of contracting COVID-19 today is higher than before due to complacency, burn out and roll back of mandates. Large crowds, no masking and lack of social distancing are now commonplace. However, many also feel that while the risk of contracting respiratory illnesses is higher, the risk of severe outcomes is much lower.
Other participants felt that the risk of both contracting and severe outcomes is lower, primarily because of high vaccination rates and many Canadians having already been infected.
Some participants pointed out that the risk remains high for some groups such as the elderly, the unvaccinated, and the immunocompromised.
Participants' perception of the level of risk has changed drastically if they had already contracted COVID-19. Many participants indicated that once they had lived through COVID-19, their fear of severe outcomes dissipated, and while they felt the risk was still present of contracting COVID-19, they were no longer afraid of severe outcomes. That being said, there were several participants who felt the reverse; having had COVID-19 with severe symptoms previously, they felt the risk was higher and took greater care since they wanted to avoid repeating that experience.
In the French groups, there was a general consensus that the risk of contracting not only COVID-19, but other respiratory illness as well, has become omnipresent and we (as a society) must learn to live with it. Participants felt that high vaccination rates and having already contracted COVID-19 means that, while there remains the risk of contracting the virus, the risk of severe outcomes is still low. This view was even shared in the high-risk group.
The combination of pandemic fatigue, discomfort of wearing a mask, and the feeling COVID-19 does not result in as severe outcomes contributes to a much lower likelihood of compliance with a mask recommendation (vs. a mandate).
Use of risk assessment tools is not generally used at a personal level. Several participants stated they do use these tools as a requirement for work or to gain access to services (e.g. dentist, hospitals).
"I look at risk as what I have going on at that time in my life and who am I going to be around. For the holidays, I will be more selective about where I go knowing I'm going to see my family." – English Ontario, Female (30-39)
"I am more fearful for my mother now because things are so much more open now." – English High Risk, Female (60+)
« Il n'y a plus de risque J'ai fini avec le masque. Je ne peux pas réspirer. C'est pas confortable…." - SAME PARTICIPANT LATER: Oui, il y a de risque dans tout maintenant. On ne peut pas arrêter de vivre. Il faut continuer avec la vie. » (There's no more risk. I'm finished with masks. I can't breathe. It's not comfortable. LATER : Yes, there's risk in everything now. We can't stop living. We have to continue with life). - National French, Female 40-60+
"A lot of this has become routine to me, it's been 2 years …social distancing, avoiding crowds, it's like mowing the lawn." – English Atlantic, Male (40-49)
2.5. Scenarios
Going to a grocery store or other large surface store (e.g. Home Reno, Canadian Tire, etc.)
There was a fairly wide range of opinions on the risk of going to a large store. There were some who categorized it as low risk (can control when you go), many who viewed it as a medium risk (can be a large number or people, masking is not required anymore, lots of things to touch), and some who consider it as high risk (large numbers of people, mostly unmasked).
« Risque élevé. Je vois toujours des gens qui toussent sur les légumes. » (High risk – I always see people coughing on the produce). French, Male, (18-39)
« Ces magasins sont très grands. Il y a beaucoup d'espace…je peux garder une bonne distance. Il n'y a pas beaucoup de risque » (These stores are very big. There's lots of space. I can keep a good distance. There's not much risk) French, Female, (18-39
Overall assessment (varied opinions)
Having a dinner party in your home with 8-10 people from outside your immediate household during the holidays
The perceived risk of a dinner party varied widely. Several participants felt it was a lower risk activity, as they could control who was invited, and believed that if their guest felt unwell they would not attend. Conversely, several others argued it was a high risk activity, since it would take place in close quarters, involves sharing food, and attendees would likely let their guard down. Several participants in the French groups claimed they have already decided not to have holiday gatherings at their house.
Overall assessment (varied opinions)
Going to a wedding or funeral (difficult to avoid, mid-to-large size gathering)
Most participants felt going to a wedding or funeral was a high risk activity. The reasons for this included the large number of attendees (many who would be unknown), potential for lots of close proximity (dancing, drinking), and increased social contact (handshakes, hugs, kisses). In addition, participants generally felt that with alcohol consumption came less inhibition and more risky behaviour. Also, while many participants viewed this as a high risk, several also said that masking and taking other measures was easier and more accepted, so they could mitigate that risk. Several participants mentioned that funeral homes and churches tended to continue to request that guests take precautions such as mask-wearing, hand sanitizer and distancing.
« Je suis allée à une funéraille la semaine dernière. Il y avait beaucoup de gens, mais la plupart étaient respectueux. Plusieurs portaient le masque et il y avait un effort pour garder les distances. Cela étant dit, il y avait beaucoup d'embrasses et de bizous. »
(I went to a funeral last week. There was a lot of people, but most were respectful. Many wore a mask and people made an effort to keep their distance. That said, there was a lot of hugging and kissing.) Female, French, High Risk (50-59)
Overall assessment (high risk)
Going out to a crowded restaurant or bar
Being at a crowded restaurant or bar is also viewed by many as being a high risk activity (enclosed space, drinking, eating, close proximity, other patrons and servers). A few participants felt it was a low to medium risk as they could control who was going to be seated with them at a restaurant (only go with others they trust), and they can limit exposure to others. Others felt it was a high risk, and many participants (especially older ones and/or high risk) indicated they are still avoiding this situation altogether.
Overall assessment (medium to high risk)
Going to a New Year's Eve party with dinner, music and dancing in a public setting
New Year's Eve parties were almost universally considered a high risk event based on the nature of the event where people will let their guard down and be uninhibited (dancing, drinking, yelling, hugging). The close proximity combined with lack of masking, and lower inhibitions as a result of alcohol consumption, all combine for participants to see this situation as a higher risk.
"People are drinking, they're not too worried about what's going on." – English Atlantic, Male (40-60+)
Overall assessment (high risk)
Going to a concert in an arena
Concerts were generally rated as high risk. The main reason provided is the density of people in a concert, combined with potentially uninhibited behaviour (singing, dancing, drinking). Several participants indicated that they had recently attended concerts even though they were well aware of the risk. One high-risk participant indicated that her mother who accompanied her wore a mask, but she didn't, as she felt it was worth taking the risk to have a good time. She also said she contracted COVID-19 as a result.
"The amount of people that are there, and how close they are to each other." – English West/North, Female (18-39)
Overall assessment (high risk)
Going to the gym or working out in an indoor public setting
Opinions were divided about the risk of going to an indoor gym. Some felt it was a low risk, as they can control when to go (avoid when it is crowded), ability to distance from others and the high degree of sanitation procedures that gyms have implemented. Those who felt it was a medium risk cited hygiene (sweat, unknown people touching the equipment) and large numbers of people.
« C'est le pire. Il n'y a pas de ventilation. Les petites essuies sont là, mais bien utilisée ? Les gens respirent plus fort. » (It's the worst. There's no ventilation. The little wipes are there, but properly used? People are breathing harder.) - Male, French High Risk (30-39)
Overall assessment (low to medium risk)
Going to an outdoor picnic with 6-8 people from outside your immediate household
There was consensus that an outdoor picnic is a low risk activity. The rationale was that it is outdoors (fresh air), there is the ability to distance, as well as control over who attends the picnic.
"It's low. You're outside, you're not all that close, it's a different atmosphere." – English High Risk, Male (60+)
Overall assessment (low risk)
2.6. Dealing with Risks
Examples of other high risk situations raised by participants included taking public transit and going to a hospital or medical clinic/office.
Irrespective of whether a scenario was rated a high, medium or low risk, many participants indicated they would still participate in these activities (for example, some had attended weddings, funerals, large concerts, etc.). The understanding of the risk often does not lead to avoidance of these types of situations, though some (not all) will take measures to mitigate the risk of infection. However, those in the high risk group did, in some cases, indicate they are not ready to participate in what they consider high risk activities (i.e. weddings, going to restaurants/bars, any large public indoor gatherings).
The most common measures that participants take to mitigate risk today include the use of hand sanitizer and masking (though most freely admit it is limited to specific activities, i.e. they do not generally mask). Some also continue to stay at home as much as possible and limit contact with others as much as possible. However, in general, most participants are not nearly as conscientious about public health measures as they were during the height of the pandemic. This is a result of a confluence of factors: pandemic fatigue, vaccinations, personal experience with a previous mild infection, and the perception that COVID-19 outcomes are not as severe as before.
Most participants believe the pandemic has changed how cold and flu symptoms are viewed. They and those in their household will now do a rapid test, stay home (not go to work/school) and isolate if they are not well.
3. Detailed Findings from the Quantitative Research
3.1. Perceptions of Personal Risk and Vulnerability
Understanding Risk
The survey was designed to capture three different dimensions of risk, including perceived likelihood of getting an infection, individual susceptibility to severe consequence, and severity of the illness. Perceived risk was assessed across three different illnesses: COVID-19, Respiratory syncytial virus (RSV), and influenza (flu).
On their own, the variables tested in multivariate analysis do not explain much of the variation in the three types of perceived risk for COVID-19, as show in Appendix C. An aggregate index of the three combined also points to a relatively small role for standard demographics.
Older people are less likely to perceive risk of COVID-19 across all three constructs (controlling for other variables).
The largest contribution to perceptions of risk are being at-risk because of having a chronic illness, immune compromised, obese, or pregnant.
Those who have experienced COVID-19 have a higher perceived likelihood of getting COVID-19, while vaccinated people are more likely to perceive all constructs of risk as higher.
Finally, trust in government is associated with higher perceived risk as is trust in hospitals/healthcare workers.
Likelihood of Getting COVID-19 and Other Illnesses
When it comes to the likelihood of getting the illness (Table 1), COVID-19 and Influenza are viewed to be almost equally likely to occur, with mean scores of 4.1 and 4.2 out of 10, respectively. Respondents perceived respiratory syncytial virus (RSV) as somewhat less likely to be contracted overall (3.4).
Table 1. Mean Likelihood of Getting Illness
Base n=actual (n=6200)
Mean
Bottom 3 box (1-3)
Top 3 box (8-10)
COVID-19
4.1
46%
12%
Respiratory syncytial virus (RSV)
3.4
59%
8%
Influenza (flu)
4.2
45%
13%
Q1. On a 10-point scale where 1 is not at all likely and 10 is extremely likely, how likely do you think it is for you personally to get each of the following in the next month?
Only a small group of survey respondents view getting these illnesses as highly likely (top 3 box).
Interestingly, older people are less likely to perceive that they will get the illnesses. For example, among those 65 and older, the average perceived likelihood of getting COVID-19 is 3.6, and only 8% score in the top 3 boxes on the scale (scores 8, 9 or 10). For those 18 to 24 years, the average is 4.2 out of 10.
Those who are at-risk perceive a higher likelihood of getting all three illnesses, but it is those with a specific health risk factor (e.g., anyone who is immune compromised, lives with obesity, has a chronic medical condition or is pregnant) that drives the higher perceived likelihood.
Indigenous respondents are more likely to think they will get RSV (3.8), the flu (4.6), and COVID-19 (4.4).
Those living in remote parts of the country are more likely to perceive a higher likelihood of getting all three illnesses.
The measures of likelihood are highly correlated with each other. The Pearson correlation coefficient for the relationship between COVID-19 and RSV is 0.72, and 0.73 for COVID-19 and the flu. Effectively, this means that those who think there is a high likelihood of getting COVID-19 are also likely to think there is a high likelihood of getting RSV and the flu.
Perceived Risk of Severe Consequence of Illnesses (Individual Susceptibility)
A slightly different pattern emerges in respondents' perceptions of individual susceptibility to a severe consequence from an illness (Table 2). In this case, the flu has the lowest perceived susceptibility to severe consequences (mean of 3.5 out of 10) and COVID-19 has the highest (3.8). In all cases, the majority thinks they have low susceptibility (indicating a value of 1, 2 or 3 on the 10-point scale).
As with the likelihood of getting the illnesses, there is a high correlation between the perceived individual susceptibility to severe consequences. The Pearson correlation coefficient for the relationship between for COVID-19 and RSV is 0.83, and 0.83 for COVID-19 and the flu.
Table 2. Risk of Severe Consequences from Illnesses
Base n=actual (n=6200)
Mean
Bottom 3 box (1-3)
Top 3 box (8-10)
COVID-19
3.8
55%
13%
Respiratory syncytial virus (RSV)
3.6
57%
11%
Influenza (flu)
3.5
59%
9%
Q2. On a 10-point scale where 1 is not at all likely and 10 is extremely likely, how likely do you think it is for you personally to have a severe consequence (e.g., requiring hospitalization or death) as a result of being infected from the following?
Perceived susceptibility is higher among certain groups (Table 3):
Older people are slightly less likely to perceive that they will get severe outcomes from COVID-19 and the flu, but this is not the case for RSV. For example, among those 65 and older the mean score for perceived susceptibility to severe outcomes from COVID-19 is 3.6 out of 10, compared with 3.9 for those 18 to 24.
Indigenous respondents are more likely to think they will have serious outcome from COVID-19. For example, the average perceived susceptibility to serious outcomes from COVID-19 is 4.3 out of 10 for Indigenous People, compared with 3.8 for non-Indigenous respondents. Similarly, Indigenous People are more likely to perceive greater susceptibility to severe consequences from the flu (4.0 compared with 3.5), but not from RSV.
Those living in remote locations[5] are more likely to perceive greater individual susceptibility to severe consequences from COVID-19 (4.5), RSV (4.3), and the flu (4.2), compared with the average respondent.
Those who are at-risk because of age and health see themselves as more susceptible to severe consequences from COVID-19 (4.0 vs. 3.4 for not at-risk), RSV (3.9 vs. 3.2) and the flu (3.7 vs. 3.2).
Table 3. Risk of Severe Consequences from COVID-19 by Sub-Group
Base n=actual
Base
Mean Out of 10
Total
(6200)
3.8
Vaccination Status
Not vaccinated
(5326)
3.1
Vaccinated with primary series
(660)
3.9
Indigenous Identification
Indigenous
(317)
4.3
Non-Indigenous
(5883)
3.8
Age
18 to 24 years
(542)
3.9
25 to 34 years
(991)
4.0
35 to 44 years
(1248)
4.0
45 to 54 years
(996)
3.7
55 to 64 years
(1112)
3.7
65 and older
(1311)
3.6
Q2. On a 10-point scale where 1 is not at all likely and 10 is extremely likely, how likely do you think it is for you personally to have a severe consequence (e.g., requiring hospitalization or death) as a result of being infected from the following?
Given that vaccinations can reduce the impact of getting ill from a disease, it is interesting to compare how vaccination status is related to perceived susceptibility to severe outcomes from COVID-19. In general, those who have not had their primary series of COVID-19 vaccine are the least likely to perceive that they are susceptible to serious outcomes from COVID-19, and those that have more doses perceive a higher level of individual susceptibility to severe consequences of COVID-19.
Perceived Severity of Illnesses
Perceptions of disease severity represent an important dimension of risk. COVID-19 is considered the most serious illness (20% think it is life threatening and 12% expect it to require hospitalization). In comparison, much fewer think RSV or the flu are serious. In fact, almost half (48%) of respondents think the flu results in manageable symptoms or can be ignored.
About one in four (24%) of those who are considered at-risk (due to health factors, age) think COVID-19 is life threatening. Those who have had COVID-19 at least once are less likely to think it is life threatening (17%).
Older people perceived COVID-19 as more serious (24% of those 65 and older think it is life threatening, compared with 11% of those 18 to 24 years). This trend is not found for perceived severity of RSV or the flu.
Indigenous respondents perceive the severity of COVID-19 similarly to non-Indigenous respondents (36% vs. 32% require hospitalization or is life threatening). The same trend is found for perceived severity of RSV and the flu.
Those who are not vaccinated are less likely to perceive the illnesses as serious. For example, 39% of unvaccinated respondents believe that COVID-19 can be ignored or leads to manageable symptoms, compared with 31% of those who are vaccinated.
Table 4. Perceived Seriousness of Each Illness
Base n=actual (n=6200)
COVID-19
Respiratory syncytial virus (RSV)
Influenza (flu)
Life-threatening
20%
13%
7%
Requiring hospitalization
12%
26%
10%
Seriously ill, but not requiring hospitalization
29%
25%
30%
Manageable symptoms
29%
18%
44%
Can be ignored
4%
3%
4%
Not sure
5%
16%
5%
Q3-5. How serious do you think [COVID-19; RSV (Respiratory syncytial virus); influenza (flu)] illness is in general?
Multivariate Analysis
Perceptions of all three constructs just discussed, likelihood of infection, susceptibility to severe consequences and seriousness of the illness are related and share many of the same bivariate indicators. To better understand how people think about the three different constructs, a multivariate regression analysis was undertaken (see Section 6.3 for details).
Regression analysis was conducted with 4 dependent variables. Each of likelihood of infection, susceptibility to severe consequences and seriousness of the illness were tested as well as a composite index variable that equally weights each of the three separate measures. Independent variables include demographics, vaccination status, at-risk status, and trust.
The analysis from the regression models indicates that the three most important drivers of perceived risk for all three concepts are:
Being at-risk because of having a health condition (chronic illness, immune compromised, obese, or pregnant) or being over 60 years of age is a driver of perceived risk. In particular, at-risk individuals think they are more susceptible to having a severe outcome from COVID-19, RSV or the flu.
Those who are vaccinated against COVID-19 are more likely to think they could get COVID-19 (likelihood), more likely to think they are susceptible to a series illness, and more likely to think it is a serious illness. Those with 2 or more boosters are even more likely than those with only the primary series to have higher likelihood, susceptibility, and to think COVID-19 is serious.
Trust in government and to a lesser degree, trust in hospitals/health care workers, is associated with higher perceived risk on all three measures.
Specific Risks
Respondents were asked to evaluate the risk associated with five specific activities (attending a concert, going to a pub to meet friends, going to a restaurant, shopping in a large retail grocery or department store, or having a dinner party) that could lead to getting sick from a respiratory infectious disease, such as COVID-19, RSV, or the flu (Table 5). Respondents rate attending a concert as the riskiest activity (24% extremely), followed by going to a pub or bar to meet friends (15%). In contrast, only 7% think that going to a restaurant for a meal is extremely risky. Going to a restaurant for a meal was assessed as a similar level of risk as shopping in a large retail, grocery, or department store (8% indicate that this would be extremely risky) and having dinner at home with people from other households (9%).
Perceptions of risk do not vary much by demographic characteristics. For example, age differences are evident but small when it comes to going to eat in a restaurant, 12% of those 18 to 24 think it is extremely risky, compared with 5% of those aged 65 and older.
Indigenous respondents perceived most of these activities as riskier than the average respondent. For example, 20% of Indigenous respondents think going to a large retail grocery or department store is extremely risky, compared with only 8% of all respondents. Indigenous respondents are also more likely to think going to a pub (16% versus 7% for non-Indigenous respondents), restaurant (16% vs. 7%), or having a dinner party with people from other households (16% vs. 9%) is extremely risky.
Those who have not been vaccinated are more likely to say that all these activities are not at all risky, compared to vaccinated respondents.
Table 5. Risks Associated with Activities
Base n=actual (n=6200)
Not at all risky
Somewhat risky
Very risky
Extremely risky
Not sure
Attending a concert
9%
32%
31%
24%
3%
Going to a pub or bar to meet with friends
12%
43%
26%
15%
3%
Going to a restaurant for a meal
18%
54%
17%
7%
3%
Shopping in a large retail grocery or department store
18%
53%
19%
8%
3%
Having a dinner party at your house with people from different households
19%
49%
19%
9%
3%
Q6. At the moment, how risky do you think each of the following activities are in terms of getting sick from a respiratory infectious disease like COVID-19, RSV or influenza (flu)?
Not surprisingly, those who perceive a higher likelihood of getting COVID-19 tend to view attending several of the activities as higher risk (Table 6). For example, 42% of those who perceive a high likelihood of getting COVID-19 think that attending a concert is very or extremely risky. In comparison, only 21% of those who think there is a low likelihood of getting COVID-19 feel this way.
Table 6. Perceived Risk of Activities by Perceived Likelihood of Getting COVID-19
% who think activity is very or extremely risky
Low Risk of Getting COVID-19 (1-3)
Moderate Risk of Getting COVID-19
(4-7)
High Risk of Getting COVID-19
(8-10)
Base n=actual (n=6200)
(2848)
(2579)
(773)
Attending a concert
21%
29%
42%
Going to a pub or bar to meet with friends
14%
19%
33%
Going to a restaurant for a meal
8%
10%
20%
Shopping in a large retail grocery or department store
8%
11%
22%
Having a dinner party at your house with people from different households
10%
12%
25%
Q6. At the moment, how risky do you think each of the following activities are in terms of getting sick from a respiratory infectious disease like COVID-19, RSV or influenza (flu)?
Information Used to Assess Risk
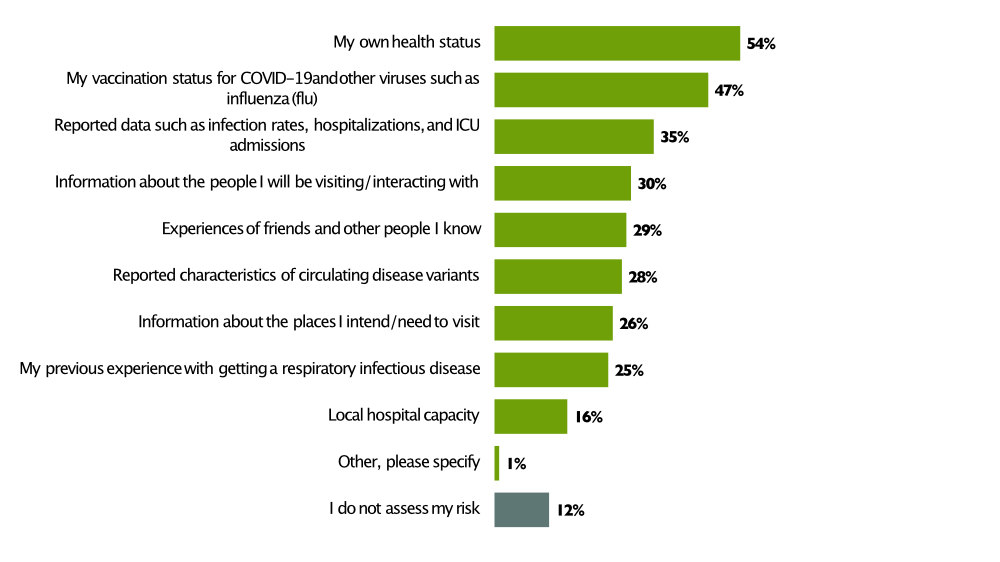
The top information used to assess risk are one's own health status (54%), one's vaccination status (47%), and reported data on the illness (35%). Other types of information that are important to respondents include information about the people one will be interacting with (30%), experience of friends (29%), reported information about circulating variants (28%), information about the places that will be visited (26%), and previous experience with respiratory infectious diseases (25%). Notably, 12% do not assess their risk.
Figure 1. Information Used to Assess Risk
Figure 1Chart showing the distribution of responses to the following question, Q11 "Which of the following platforms/sources do you use to keep informed about COVID-19 and other respiratory infectious diseases (e.g., RSV and influenza (flu))? Select all that apply."
Information used to assess risk
% of respondents
My own health status
54%
My vaccination status for COVID-19 and other viruses such as influenza (flu)
47%
Reported data such as infection rates, hospitalizations, and ICU admissions
35%
Information about the people I will be visiting/ interacting with
30%
Experiences of friends and other people I know
29%
Reported characteristics of circulating disease variants
28%
Information about the places I intend/need to visit
26%
My previous experience with getting a respiratory infectious disease
25%
Local hospital capacity
16%
Other, please specify
1%
I do not assess my risk
12%
Base: Unweighted
6200
Base: Weighted
6200
Information used to assess risk varies by age and health status.
Older respondents report using more sources of information (those 65 and older on average use 3.5 sources compared with only 2.5 for those 18 to 24 years). For example, they are more likely to use reported data such as infection rates, hospitalizations, and ICU admissions (e.g., 44% among those 65 and older, compared with only 24% of those 18 to 24). They are also more likely to use their own health status (67% vs. 41%), their vaccination status (69% vs. 35%), and reported characteristics of circulating variants (36% vs 22%).
Those who are at-risk are more likely to use their own health status (57%) and vaccination status (51%) to assess their risk, compared to those who are not at risk (48% and 38%, respectively).
Those who perceive COVID-19 to be more severe (e.g., requiring hospitalization or life threatening) are more likely than those who think it can be ignored to use their vaccination status (54% vs. 10%), reported data such as infection rates, hospitalizations, and ICU admissions (44% vs. 12%), their own health status (56% vs. 32%), reported characteristics of circulating disease variants (34% vs. 11%), information about the places they will be visiting (33% vs. 10%), and the people they will interact with (35% vs. 9%) to assess the risk of getting a respiratory infectious disease. Those who are not at-risk are only slightly more likely to not assess their risk (15% versus 9%).
Concern
Overall, levels of concern with getting respiratory infectious diseases are aligned with perceived likelihood, susceptibility, and severity of getting the three illness. Although, concern is generally a little higher. As with perceived likelihood and susceptibility, concern is higher for COVID-19 than it is for the other two illnesses. While a large proportion of respondents have a low level of concern (e.g., 41% rate their concern 1,2 or 3 out of 10), there is a group of 14-20% who are highly concerned with getting each illness. For COVID-19, 20% are highly concerned while concern is slightly lower for RSV (15%) and the flu (14%).
The level of concern associated with each illness are highly correlated; the Pearson correlation coefficient is 0.81 for both the relationship between COVID-19 and RSV, as well as COVID-19 and the flu.
Table 7. Concern about Illnesses
Base n=actual (n=6200)
Mean
Low concern (1-3)
High concern (8-10)
COVID-19
4.7
41%
20%
Respiratory syncytial virus (RSV)
4.3
46%
15%
Influenza (flu)
4.2
46%
14%
Q8. On a 10-point scale where 1 is not at all concerned and 10 is extremely concerned, how concerned are you about getting the following respiratory infectious diseases?
Concern is higher among certain groups.
Women tend to be slightly more concerned about getting COVID-19 (mean = 4.9 out of 10), RSV (4.4), and the flu (4.4) than men (4.5, 4.1 and 4.1 respectively).
Compared with those living in urban locations (4.8), those living in rural but not remote locations are less likely to be concerned about getting COVID-19 (4.4). Those in remote locations are more likely to be concerned (5.0). Those living in remote locations are also more likely to be concerned about getting RSV (4.8) and the flu (4.9), compared to those in rural but not remote (4.0 and 4.0) or urban locations (4.2 and 4.2).
Those who are at-risk because of age or health conditions are generally more likely to be concerned about getting COVID-19 (4.9 vs. 4.5 for not at-risk), RSV (4.5 vs. 4.0), and the flu (4.5 vs. 4.0).
Consistent with the earlier findings, those who have not had a dose of COVID-19 vaccine are the least likely to be concerned about getting COVID-19. Those that have more doses are more likely to be concerned (Table 9).
Table 9. Concern about COVID-19 by Vaccination Status
Base n=actual (n=6200)
Mean
(10 point scale)
Low concern (1-3)
High concern (8-10)
Total
4.7
41%
20%
I have received the primary series + 2 or more boosters
5.1
35%
23%
I have received the primary series + 1 booster
4.8
38%
20%
I have received the primary series*
4.4
46%
19%
I have not received the full primary series but have received one dose
5.1
29%
17%
I have not received any doses of a COVID-19 vaccine
3.0
69%
10%
Rather not say
3.3
59%
7%
Q8. On a 10-point scale where 1 is not at all concerned and 10 is extremely concerned, how concerned are you about getting the following respiratory infectious diseases? [COVID-19]
The survey includes several measures of trust, which are discussed in-depth in the next section (Section 2.3). There is a strong relationship between the level of trust a person has in the federal government (e.g., The Public Health Agency of Canada) and concern about COVID-19. For those with low trust (1-3 on a 10-point scale), the average concern is only 3.2 out of 10 compared with 5.6 for those with high trust (8-10).
Table 8. Concern with COVID-19 by Trust in Federal Government
Base n=actual (n=6200)
Mean
(10 point scale)
Low concern (1-3)
High concern (8-10)
Total
4.7
41%
20%
Low trust (1 -3)
3.2
66%
10%
Moderate trust (4-7)
4.9
33%
17%
High trust (8-10)
5.6
31%
32%
Q8. On a 10-point scale where 1 is not at all concerned and 10 is extremely concerned, how concerned are you about getting the following respiratory infectious diseases? COVID-19
3.2. Trust and Information
Trust
A key variable in understanding whether the public follows recommended public health measures is the level of trust that people have in those developing, recommending, and communicating them. While respondents indicate a high level of trust in hospitals and healthcare workers (mean=7.3 out of 10), trust in the federal government (e.g. the Public Health Agency of Canada) is much lower (5.7). In fact, 24% of respondents indicate a low level of trust in the federal government (1, 2, or 3 on a scale of 1-10).
Celebrities and the people respondents follow on social media are trusted the least by respondents. Notably, journalists and reporters working for large media organizations are trusted less than the federal government by survey respondents.
Table 9. Trust in Institutions and Organizations
Base n=actual (n=6200)
Mean
Very Low Trust
(1-3)
Very High trust
(8-10)
Hospitals and healthcare workers (e.g., doctors and nurses)
7.3
9%
56%
Scientists and researchers
7.0
11%
52%
Friends and family
6.7
9%
42%
The federal government (e.g., The Public Health Agency of Canada)
5.7
24%
32%
Your provincial government
5.4
27%
26%
Journalists and reporters working for large media organizations
5.0
30%
18%
Ordinary people
4.9
26%
12%
People I follow on social media
3.9
46%
8%
Celebrities
3.6
54%
8%
Q9. Using a 10 point scale where 1 is no trust and 10 is a very high level of trust, how much do you trust the following people and organizations?
Overall, trust in the federal government (e.g., the Public Health Agency of Canada) is modest (mean=5.7), but higher among certain groups.
Among those 65 and older trust is much higher (6.3) compared to those 18 to 24 years (5.4).
Indigenous People are less trusting (5.1) than the average respondent (5.7).
Trust is lowest in New Brunswick (5.0), Alberta (5.3), and Saskatchewan (5.5). It is also lower in rural and remote areas (5.2), compared with urban locations (5.9).
Trust is very low among those who are not vaccinated (3.0).
How People Keep Informed
Traditional news outlets (53%), the Public Health Agency of Canada (PHAC) (50%), and local health authorities (47%) are the top 3 sources of information about COVID-19 and other respiratory infectious diseases that are used to stay informed. Friends and family (35%) are also an important source for many. Social media, either generally or government accounts, are less important.
Young people look to traditional news media, PHAC, and local public health authorities less than older people. For example, only 35% of those under 35 years rely on traditional media, compared with 70% of those 55 and older. The younger respondents are more likely to use general social media (30%) than those who are over 55 (13%).
Table 10. Sources/Platforms Used to Stay Informed by Age
Total
18 to 34 years
35 to 54 years
55 years and older
Base n=actual
(6200)
(1533)
(2244)
(2423)
Traditional news outlets (e.g., television, radio, and news)
53%
35%
46%
70%
Public Health Agency of Canada
50%
42%
47%
59%
Local public health authorities
47%
37%
43%
58%
Conversations with friends and family
35%
37%
32%
36%
General social media
20%
30%
22%
13%
Government social media accounts
20%
22%
21%
17%
School/Workplace sources
15%
23%
18%
6%
People I follow on social media
10%
18%
9%
4%
Blogs
5%
9%
6%
2%
Other
2%
1%
2%
3%
None of the above
9%
10%
12%
6%
Q11. Which of the following platforms/sources do you use to keep informed about COVID-19 and other respiratory infectious diseases (e.g., RSV and influenza (flu))? Select all that apply.
3.3. Attitudes about Public Health Measures
General attitudes about PHMs can help explain the actions people do or do not take in the face of public health advice around COVID-19 or other respiratory infectious diseases.
A large majority of respondents believe they have the skills/capabilities to perform PHMs. More than eight in ten at least somewhat agree that it's easy to use public health measures and that they know how to use them.
Three quarters (74%) of respondents are motivated to use PHMs when they are concerned about getting sick. A similar proportion of respondents think PHMs are effective (77%) and say that using public health measures is important to them (78%).
Almost two thirds (64%) are more likely to use a mask when they see others around them using a mask.
Attitudes about PHMs are related to age.
94% of those 65 years and older think it is easy for them to use PHMs (agree or somewhat agree), compared to only 62% of those 18 to 24 years.
95% of those 65 years and older say they know how to use PHM, compared with only 63% of those 18 to 24 years.
91% of those 65 years and older say using PHMs is important to them, compared with only 60% of those 18 to 24 years.
89% of those 65 years and older think PHMs are effective, compared with only 60% of those 18 to 24 years.
There is no age difference when it comes to the impact of seeing others using a mask.
Those who live in remote areas are less supportive of PHMs compared with the average respondent. Only 63% of those living in a remote area think that PHMs are effective (agree or somewhat agree) and the same percentage indicate that using PHMs is important to them. Notably, those in remote areas are also less likely to feel that using PHMs is easy (65%) and that they know how (65%).
Unvaccinated respondents are less likely to think PHMs are effective (48% agree or somewhat agree) than those who are vaccinated (82%). Likewise, they are less likely (46% vs. 83%) to think using PHMs is important, that using PHMs is easy (59% vs. 86%), and that they know how (71% vs. 85%).
Table 11. Knowledge, Attitudes and Beliefs about PHMs
Base n=actual (n=6200)
Agree
Somewhat agree
Somewhat disagree
Disagree
Not sure
It is easy for me to use individual public health measures (i.e., wearing a mask, staying home when sick, improving indoor ventilation)
50%
32%
9%
6%
4%
I know how to use individual public health measures to reduce the spread of respiratory infectious diseases (COVID-19, RSV, influenza (flu))
49%
36%
7%
4%
4%
Using public health measures is important to me
42%
36%
11%
7%
4%
Public health measures are effective at reducing the spread of respiratory infectious disease such as COVID-19, RSV, and influenza (flu)
41%
36%
11%
8%
5%
I use individual public health measures (e.g., wearing a mask, staying home when sick, improving indoor ventilation) because I'm concerned about getting sick
38%
34%
13%
11%
4%
I'm more likely to use a mask when I see others around me using one
31%
33%
16%
16%
4%
Q10. How much do you agree or disagree with each of the following? SCALE: Agree, somewhat agree, somewhat disagree, disagree, not sure
Trust in the federal government is strongly related to overall attitudes. Those who have a high level of trust (8-10 on a 10-point scale) in the federal government are more likely to think PHMs are effective (93% at least somewhat agree), compared with 48% of those who have low trust (1-3). In addition, those with high trust are more likely to indicate that using PHMs is important to them (93% vs. 50%), using PHMs is easy (92% vs. 64%), and that they know how to use them (92% vs. 77%).
3.4. Adherence to Public Health Measures
Importance for Attending Events/Gatherings
When deciding whether to attend an event or gathering, one's health status was the most important consideration (46% indicate this consideration is very important). The next most important considerations are a range of other information such as the current local public health recommendations (33%), the number of COVID-19 cases in the community (32%), level of other respiratory illnesses in the community (31%), and the size of the gathering at the event (31%).
Those who trust the federal government are more likely to place a high importance on each of the factors when considering whether to attend an event or gathering. The table below shows that those with a high level of trust are between 10 and 40 points more likely to indicate that the factors are very important.
Table 12. Importance Drivers of When Considering Attending a Gathering (% Very Important)
% very important
Total
At-risk
Not At-risk
Low Trust Federal Government (1-3)
High Trust Federal Government (8-10)
Base n=actual
(6200)
(3444)
(2756)
(1976)
(1531)
My health status / presence of influenza (flu)-like symptoms
46%
53%
38%
31%
63%
The current local public health recommendations
33%
40%
24%
15%
55%
The number of COVID-19 cases in the community at the time
32%
38%
25%
19%
49%
The size of the gathering/number of people who will be attending
31%
37%
24%
21%
46%
The level of other respiratory infectious diseases in the community at the time (e.g., RSV, influenza (flu))
31%
37%
24%
19%
46%
The ability to distance myself from other people
29%
35%
22%
19%
42%
The number of public health measures in place at the setting
29%
34%
21%
16%
44%
The ventilation and availability of outside air at the event
28%
32%
23%
19%
40%
Knowing and trusting the people who are going to be at the gathering
27%
31%
23%
20%
39%
Q13. How important are each of the following when considering whether to attend an event or gathering? SCALE: Very important, important, somewhat important, not important, not sure
Older respondents place a greater level of importance on each of these factors when considering whether to attend an event or not. In addition, older respondents have a clear ranking of importance, whereas younger respondents tend to give most of the factors an equal level of importance. Notable differences include:
63% of those 65 years and older think it is very important to consider their health status when considering whether to attend a gathering (very important or important), compared to only 29% of those 18 to 24 years.
49% of those 65 years and older think it is very important to consider current local public health recommendations, compared with only 21% of those 18 to 24 years.
40% of those 65 years and older think it is very important to consider the ability to distance themselves from other people, compared with only 19% of those 18 to 24 years.
For people who are at-risk (because of their age and health status), there is heightened importance on the following:
53% of those who are at-risk feel that their health status is very important in deciding to attend a gathering, compared to 38% of those not at-risk.
38% of those who are at-risk feel that the number of COVID-19 cases in the community is very important (compared to 25% of those not at-risk) and 37% feel the level of other respiratory diseases in the community is very important (compared to 24%).
37% say that the size of the gathering/number of people who will be attending is very important, compared to 24% of those not at-risk.
35% say that the ability to distance oneself from others is very important, compared to 22% of those not at-risk.
Importance for Deciding Whether or Not to Wear a Mask
The same considerations are important when deciding whether to wear a mask. One's health status is the most important information (46% very important), followed by current local public health recommendations (35%), the number of COVID-19 cases in the community (36%), level of other respiratory illnesses in the community (34%), and the size of the gathering at the event (33%).
Age influences how much importance respondents place on different factors when considering whether to wear a mask. Older respondents place a greater level of importance on each of the factors. In addition, older respondents have a clear ranking of importance, whereas younger respondents tend to give most of the factors an equal level of importance.
89% of those 65 years and older think it is important to consider their health status when considering whether to wear a mask (very important or important), compared with only 59% of those 18 to 24 years.
83% of those 65 years and older think it is important to consider current local public health recommendations, compared with only 51% of those 18 to 24 years.
77% of those 65 years and older think it is important to consider the ability to distance themselves from other people, compared with only 50% of those 18 to 24 years.
Those with more trust in the federal government are more likely to place a high importance on each of the factors when deciding whether to wear mask. For example, among those with a high level of trust (8-10 on 10-point scale), 64% indicate that one's health status is very important, compared with only 30% of those with a low level of trust (1-3).
Unvaccinated respondents place less importance on all the considerations despite being more vulnerable than they would be if they were vaccinated. People who are at-risk because of their age and health status place a higher level of importance on the following:
54% of those who are at-risk think that their health status is very important in deciding to where a mask, compared to 35% of those not at-risk.
43% of those who are at-risk feel that the number of COVID-19 cases in the community is very important (compared to 27% of those not at-risk) and 41% feel the level of other respiratory diseases in the community is very important (compared to 25%).
39% of those at-risk say that the size of the gathering/number of people who will be attending is very important, compared to 25% of those not at-risk.
33% of those at-risk say that knowing and trusting the people who are going to be at the gathering is very important, compared to 21% of those not at-risk.
Table 13. Importance Drivers of Mask Wearing
% very important
Total
At-risk
Not At-risk
Low Trust Federal Government (1-3)
High Trust Federal Government (8-10)
Base n=actual
(6200)
(3444)
(2756)
(1976)
(1531)
My health status / presence of influenza (flu)-like symptoms
46%
54%
35%
30%
64%
The number of COVID-19 cases in the community at the time
36%
43%
27%
21%
53%
The current local public health recommendations
35%
42%
27%
17%
57%
The level of other respiratory infectious diseases in the community at the time (e.g., RSV, influenza (flu))
34%
41%
25%
20%
50%
The size of the gathering/number of people who will be attending
33%
39%
25%
20%
48%
The ability to distance myself from other people
31%
36%
24%
20%
44%
The ventilation and availability of outside air at the event
29%
34%
23%
19%
42%
Knowing and trusting the people who are going to be at the gathering
28%
33%
21%
20%
41%
Q14. How important are each of the following when considering whether or not to wear a mask? SCALE: Very important, important, somewhat important, not important, not sure
3.5. Mask Wearing
A small group of respondents never wear a mask, but the majority wear them at least sometimes in certain situations (Table 14). The most likely situations that prompt wearing a mask are when feeling sick around others (59% of respondents report always or often wear a mask) or when interacting with someone who is at a risk of more severe outcomes from a respiratory illness (58% always or often wear a mask). Wearing a mask in a public outdoor setting (19% always or often) or in a private indoor setting with people outside their household (23%) are less common.
A high percentage of respondents indicate that in the last three months they always or often wear a mask in a long-term care home (58%) and on public transportation (45%).
Table 14. Frequency of Wearing Masks by Situation
Base n=actual (n=6200)
% Applicable *
% Often/ Always Among Applicable
When you are feeling sick and are around others
82%
59%
When interacting with someone who is at risk of more severe disease or outcomes from respiratory infectious diseases (e.g., older adult, pregnant person, someone who is immunocompromised, etc.)
83%
58%
In a long-term care home
55%
58%
On public transportation (bus, metro, streetcar, cab)
66%
45%
When at a large public indoor gathering (i.e., concert, wedding, funeral, etc.)
76%
39%
In a public indoor setting (e.g., grocery store)
97%
36%
In a private indoor setting with people outside your household (e.g., friend's house)
90%
23%
In a public outdoor setting (e. g., park)
91%
19%
Q12. In the past 3 months how often have you worn a mask in the following situations? SCALE: Always, often, sometimes, rarely, never, not applicable
* Respondents were given the option to say not applicable to them
The demographic and attitudinal drivers of wearing a mask vary by situation (n.a. removed).
Older respondents are more likely (always or often) to wear a mask when interacting with someone who is at risk (71% of those 65 and older, compared with 41% for those 18 to 24 years), when they are feeling sick (73% vs. 48%), or in a large public indoor setting (50% vs. 32%). They are not more likely to do so in a large public outdoor gathering or private indoor setting.
Unvaccinated people are much less likely to wear a mask regardless of the situation. For example, when it comes to attending a large public indoor gathering, 42% of vaccinated but only 23% of unvaccinated indicate that they wear a mask always or often. The difference is more pronounced for wearing a mask when you are feeling sick around others (62% vs. 34%).
Those with more trust in the federal government are more likely to wear a mask across all situations. For example,71% of those with a high level of trust (8-10 on a 10-point scale) always or often wear a mask when interacting with someone who is at risk of more severe disease or outcomes from respiratory infectious diseases, compared with only 41% of those with a low level of trust (1-3).
Regression analysis (for details see Section 6.3) was used to understand the drivers of wearing a mask in an indoor public setting. The dependent variable is how often the respondent wears a mask in a public indoor setting (e.g. grocery store). Independent variables include, demographics, health status, perceived risk, COVID-19 experience, trust and attitudes about PHMs.
Overall, demographics are minor drivers of wearing a mask. Trust in the federal government is associated with wearing a mask, as is the perceived seriousness of COVID-19. Adding attitude, belief, and behavioural variables reduces the role of perceived risk (likelihood, susceptibility, and severity), vaccination status, and COVID-19 experiences. Attitude, belief, and behavioural variables that drive mask wearing are always carrying a mask when you are out, wearing a mask to avoid getting sick, believing that masks are effective, and feeling that using PHMs is important.
Drivers of Mask Wearing
The top reason for wearing a mask indicated by respondents is to protect more vulnerable individuals (35%). In fact, 66% mention at least one altruistic reason for wearing a mask in their 3 mentions.
The next most frequently mentioned type of reason is reinforcement (47%), which includes public health recommendations (22%) and mask mandates (31%).
Beliefs about consequences (49%) are the next most mentioned reasons. These reasons are about reducing risk such as getting COVID-19 and other viruses (32%) and reducing the spread of illnesses, including COVID-19 (31%). Self-efficacy (22%) and social influences (9%) are the next most mentioned types of reasons for wear a mask.
The reasons for mask wearing are similar across different groups, but there are several differences that stand out.
Older respondents (e.g., those 65 and older) are much more likely than younger respondents to wear a mask because it reduces the likelihood of getting COVID-19 (46% vs. 22% for those 18 to 24), reduces the likelihood of the spread of viruses (38% vs. 23%), and to protect more vulnerable individuals (40% vs. 29%).
Unvaccinated respondents are more likely to say there are no reasons to lead them to wear a mask than vaccinated respondents (39% vs. 4%).
Table 15. Top Reasons for Wearing a Mask
Base n=actual (n=6200)
%
NET: ALTRUISTIC GOALS
66%
To protect more vulnerable individuals
35%
To protect the health of my community
18%
To protect the healthcare system
16%
NET: REINFORCEMENT
47%
Recommendations by local public health authority
21%
Recommendations by employer
9%
Mask mandates
31%
NET: BELIEFS ABOUT CONSEQUENCES
49%
I will reduce the likelihood of getting COVD-19 and other viruses, such as the influenza (flu)
32%
I will reduce the spread of COVD-19 and other viruses, such as the influenza (flu)
31%
I will feel better about myself
8%
NET: SOCIAL INFLUENCES
9%
I am concerned what friends and family will think if I don't wear a mask
5%
Support/encouragement from friends and family
5%
NET: SELF-EFFICACY
22%
It is easy for me to do
14%
It is part of my routine now
11%
No reasons
8%
Q17. Which of the following are the top 3 reasons that would lead you to wear a mask? Please select up to 3
Drivers of Not Wearing a Mask
The top reason cited for not wearing a mask is that it is not required (26%). The lack of a requirement to do so is directly related to the idea of reinforcement.
Almost three in ten (29%) respondents mention at least one reason that relates to their beliefs about the consequences of wearing a mask, such as they are uncomfortable (29%), they won't prevent the spread of COVID-19 (8%), and they won't protect them from getting COVID-19 (9%). The next most cited factors related to beliefs about capabilities. These include forgetting to have one (19%), not having access (6%), or it being challenging to wear a mask (8%).
Priority/goal-related factors account for reasons given by 25% of respondents, and 24% mention social influences.
The reasons for not wearing a mask vary somewhat by age and COVID-19 status.
Older respondents (e.g., those 65 and older) are much less likely to say there are no reasons to not wear a mask (42%) compared to those 18 to 24 years (11%). The younger respondents are more likely to say it makes things more difficult (19% of those 18-24 years), it won't protect them (10%), and it won't have a big impact (10%).
Unvaccinated respondents are more likely than vaccinated respondents to say that a mask won't protect them (23% vs. 7%), that it won't help prevent the spread of COVID-19 (21% vs. 6%), and that they aren't effective at stopping transmission of respiratory infections (22% vs. 7%).
Table 16. Top Reasons for Not Wearing a Mask
Base n=actual (n=6200)
%
NET: BELIEFS ABOUT CONSEQUENCES
29%
Masks are uncomfortable
18%
It won't help prevent the spread of COVID-19
8%
It won't help prevent the spread of other viruses, such as the influenza (flu)
6%
It won't protect me from getting COVID-19
9%
It won't protect me from getting other viruses, such as the influenza (flu)
6%
Masks aren't effective at stopping transmission of respiratory infections
8%
It won't have a big impact
6%
NET: SELF-EFFICACY
28%
I forget to bring a mask with me when I go out
19%
I don't have access to masks
6%
It's challenging for me to wear a mask
8%
NET: REINFORCEMENT
26%
It's not required
26%
NET: PRIORITIES/ GOALS
25%
It's not important to me
5%
It makes doing other things more difficult (i.e., job or other daily tasks)
12%
There are better ways to protect myself from getting sick
8%
NET: SOCIAL INFLUENCES
24%
No one else is wearing a mask
14%
I don't like being told what to do
4%
I am concerned what friends and family will think if I wear a mask
4%
Friends/family pressure me to not wear a mask
4%
NET: BURNOUT
13%
I am sick and tired of wearing a mask
13%
No reasons
26%
Q18. For you personally, which of the following are the top 3 reasons for not wearing a mask? Please select up to 3
Attitudes about Masks, Mandates, and Staying Home
The majority of respondents (85%) think it is important for people to stay home and away from others when they have symptoms of a respiratory infectious disease. A small group (11%) rejects this idea.
Young people are much less likely to endorse staying at home and away from others. Only 65% of those 18 to 24 at least somewhat agree, compared to 98% of those 65 and older.
Unvaccinated respondents are less likely to agree (71%) compared to those who are vaccinated (89%).
Attitudes about the effectiveness and purpose of masks are generally positive. Three quarters of respondents (75%) at least somewhat agree that masks are an effective way to reduce the transmission of respiratory infectious diseases. Many respondents (65%) indicate they always have a mask with them when they go out, and 63% have a specific plan for when they will wear a mask. Many, however, would only wear a mask if it was required to attend certain public events or locations (56%).
Young people are much less likely to view masks as effective. Only 57% of those 18 to 24 are supportive of mask mandates when cases are high (at least somewhat agree), compared to 89% of those 65 and older. Additionally, those 18 to 24 are also less likely to have a mask with them (46% vs. 84%) or a plan for when they will wear a mask (48% vs. 76%) compared to older respondents.
Indigenous respondents are less likely to have a mask with them when they go out (53%), compared to those who are non-Indigenous (65%).
When compared to vaccinated individuals, those who are unvaccinated are less likely to think masks are effective (40% vs. 81%) and are less likely to have a mask when they go out in public (39% vs. 69%).
Table 17. Attitudes about Masks, Mandates and Staying Home (% Agree or Somewhat Agree)
% agree or somewhat agree
Total
18 to 34 years
35 to 54 years
55 years and older
Base n=actual (n=6200)
(6200)
(1533)
(2244)
(2423)
It is important that people stay home and away from others when they have symptoms of a respiratory infectious disease (COVID-19, RSV, influenza (flu))
86%
74%
84%
95%
I am supportive of mask mandates, when COVID-19 cases are high
75%
63%
72%
86%
Masks are an effective way to reduce the transmission of respiratory infectious diseases
75%
65%
70%
85%
I always have a mask with me when I go out in public
65%
52%
58%
79%
I have a specific plan for when I will wear a mask
63%
52%
61%
72%
I would only wear a mask if it was required to attend certain public events or locations
56%
59%
59%
52%
I don't think mask mandates are effective
35%
43%
39%
26%
Q19. How much do you agree or disagree with each of the following? SCALE: Agree, somewhat agree, somewhat disagree, disagree, not sure
Respondents are generally supportive of mask mandates when there are a high number of COVID-19 cases (75% at least somewhat agree). That said, 35% don't think mask mandates are effective.
Young people are much less likely to view masks as effective. Only 58% of those 18 to 24 are supportive of mask mandates when cases are high (agree or somewhat agree), compared to 90% of those 65 and older. Young people are also more likely to say that mask mandates are not effective (40% vs. 22%).
Compared to non-Indigenous respondents, Indigenous respondents are more likely to think mask mandates are not effective (51% vs. 34%) and are less supportive of mandates when cases are high (64% vs. 76%).
Unvaccinated individuals are more likely than vaccinated individuals to think mask mandates are not effective (61% vs. 31%) and are less supportive of mandates when cases are high (41% vs. 81%).
3.6. Staying Home when Ill/ Isolating
The survey assessed how respondents would act if they had cold or flu symptoms. Three scenarios were tested, including different COVID-19 test outcomes: no COVID-19 test, a COVID-19 test that was negative, and a COVID-19 test that was positive. Respondents were then asked about what they would do in one of these scenarios.
Testing positive, as opposed to negative, increases the proportion of individuals who are very likely to cancel plans to go to work, meet with people from different households, go to a restaurant for a meal, go to a pub, attend a concert or sporting event, or shop in a large retailer (see Table 17).
Respondents who were asked about having cold or flu symptoms in the absence of a COVID-19 test tend to be more likely to cancel plans across most of the scenario plans than those who tested negative, but less likely to cancel than those who tested positive. The only exception is for shopping in a large store; in this case, only those who tested positive are very likely to cancel those plans.
Table 18. Cancelling Plans under Different Scenarios (% Very Likely to Cancel)
(% Very Likely to Cancel)
Cold or flu symptoms but have not taken a COVID-19 test
Cold or flu symptoms with negative COVID-19 test
Cold or flu symptoms with positive COVID-19 test
Base n=actual (n=6200)
(2026)
(2019)
(2155)
Visiting those who are at risk of more severe disease or outcomes
59%
53%
55%
Meeting with people from different households either at your place or theirs
50%
43%
59%
Going to a restaurant for a meal
49%
41%
58%
Go to work*
41%
32%
63%
Shopping in a large retail grocery or department store
41%
40%
53%
Going to a pub or bar to meet with friends
49%
33%
56%
Attend concert or sporting events
47%
40%
56%
Q16. If you had cold or influenza (flu) symptoms such as runny nose, fatigue, coughing, sneezing or fever but have [SPLIT SAMPLE: not yet taken a COVID-19 test/ have taken a COVID-19 test and tested negative/ have taken a COVID-19 test and tested positive], how likely are you to cancel plans for each of the following? Each respondent received one of the three split sample scenarios. SCALE: Very likely, somewhat likely, not very likely, not at all likely, not applicable to me
**Only asked if respondent works outside of the home
Notably, older respondents are more likely to cancel plans across all scenarios and are more impacted by a positive test than younger people. For example, a positive test increases the proportion of 18 to 24 years old who are very likely to cancel plans to go to a restaurant by 6 points compared to a negative test. In contrast, a positive test increases the likelihood of cancelling these plans by 25 points over a negative test for those 65 and older.
Table 19. Cancelling Plans because of Cold or Flu Symptoms by Age (% Very Likely to Cancel)
% Very Likely to Cancel
Base
18 to 24
25 to 34
35 to 44
45 to 54
55 to 64
65 and older
Base n=actual (n=6200)
(542)
(991)
(1248)
(996)
(1112)
(1311)
Visiting those who are at risk of more severe disease or outcomes
No COVID-19 test
40%
51%
49%
64%
63%
75%
Negative COVID-19 test
37%
45%
48%
52%
62%
66%
Positive COVID-19 test
36%
50%
55%
68%
71%
80%
Going to a restaurant for a meal
No COVID-19 test
30%
40%
41%
55%
53%
63%
Negative COVID-19 test
26%
33%
36%
42%
52%
52%
Positive COVID-19 test
32%
45%
48%
62%
69%
77%
Shopping in a large retail grocery or department store
No COVID-19 test
22%
32%
35%
45%
44%
57%
Negative COVID-19 test
16%
26%
26%
31%
45%
41%
Positive COVID-19 test
28%
43%
44%
54%
64%
70%
Q16. If you had cold or influenza (flu) symptoms such as runny nose, fatigue, coughing, sneezing or fever but have [SPLIT SAMPLE: not yet taken a COVID-19 test/ have taken a COVID-19 test and tested negative/ have taken a COVID-19 test and tested positive], how likely are you to cancel plans for each of the following? Each respondent received one of the three split sample scenarios. SCALE: Very likely, somewhat likely, not very likely, not at all likely, not applicable to me
COVID-19 Infection Experiences
Almost half (45%) of the survey respondents report that they have tested positive for COVID-19 since the start of the pandemic, and 11% have had multiple infections.
Older respondents are less likely to have got COVID-19 at least once (30% of those 65 and older, compared to 57% of those 18 to 24 years).
Indigenous respondents are no more likely to have got COVID-19 than non-Indigenous respondents (50% at least once, compared to 45%).
Respondents from British Columbia are the least likely to have experienced a COVID-19 illness (40%), followed by those from Ontario (42%).
Respondents living in remote locations are more likely to have had COVID-19 (56% at least once), than those living in rural but not remote (42%) or urban locations (45%).
Table 20. COVID-19 Infection Experience
Base n=actual (n=6200)
Yes, once
34%
Yes, more than once
11%
No, I have not tested positive for COVID-19
55%
Q25. Have you tested positive for COVID-19 since the start of the pandemic in 2020?
More than a quarter (28%) of those who tested positive since the start of the pandemic have had an infection since October 2022.
Table 21. Timing of Last Positive COVID-19 Illness
Base n=actual (n=2775)
2023 (January/February)
4%
2022 (Oct-Dec)
24%
2022 (July-September)
30%
2022 (April-June)
26%
2022 (January-March)
20%
2021
24%
2020
12%
Q26. When did your most recent COVID-19 infection occur?
Actions Taken When Sick with COVID-19
When asked about the last time they tested positive for COVID-19, most respondents (83%) isolated themselves from people outside their household, and 88% of those who work outside the home avoided going to work. Additionally, most respondents (76%) wore a mask when around others. However, not as many respondents (57%) isolated themselves from others in their household while sick. Half (51%) were instructed by health authorities to isolate.
Isolating from people outside of the household was much more likely among older individuals; 93% of those aged 65 and older isolated, compared to only 67% of those aged 18 to 24. Older respondents are also more likely to wear a mask around others when sick with COVID-19 (79% of those aged 65 and older, compared to 68% of those aged 18-24).
Notably, those aged 18 to 24 who work outside the home were much less likely (76%) to avoid going to work, compared to older individuals who work outside the home, of which 93% of those 55 and older indicated that they avoided going to work.
Unvaccinated respondents were the least likely to take any action when sick with COVID-19, such as isolating from people outside their household (65%) or wearing a mask around others (60%).
Table 22. Actions Taken When Sick with COVID-19
Base n=actual (n=2815)
Yes
No
Not applicable
Avoided going to work*
88%
8%
4%
Isolated myself from people outside my household
83%
14%
3%
Wore a mask when around others
76%
14%
11%
Isolated myself from people in my household
57%
34%
10%
Was instructed to isolate from others by health authorities
51%
40%
10%
Q27. In regard to the last time you tested positive with COVID-19, which of the following applies to you?
* Only asked if respondent works outside of the home
The time of respondents' last COVID-19 infection is related to what actions they took. As time went on, respondents were more likely to avoid going to work. Additionally, they were more likely to isolate from people outside of their household (though this declines for recent, 2023 infections). There is also a decline after 2021 in isolating from people in their household and reporting that health authorities instructed them to isolate.
Table 23. Actions Taken When Sick with COVID-19 by Time of Infection
% Yes
2020
2021
2022
2023
(Jan/Feb)
Base n=actual (n=2815)
(300)
(633)
(1774)
(108)
Avoided going to work*
77%
86%
90%
94%
Isolated myself from people outside my household
67%
77%
89%
82%
Wore a mask when around others
62%
75%
78%
75%
Isolated myself from people in my household
61%
61%
55%
36%
Was instructed to isolate from others by health authorities
62%
63%
44%
36%
Q27. In regard to the last time you tested positive with COVID-19, which of the following applies to you?
* Only asked if respondent works outside of the home
Of the respondents who were sick with COVID-19 and isolated from others, 92% isolated for at least 5 days. Isolation length was much longer for those who tested positive before 2023. In 2020, 41% isolated for 10 or more days, but in the first few months of 2023, only 18% isolated for this long.
Older individuals were more likely to isolate for 10 or more days (42% of those 65 and older, compared to 22% of those aged 18-24) since the pandemic began.
Table 24. Length of Isolation Period for COVID-19 Cases Among those who Isolated
Total
2020
2021
2022
2023
(Jan/Feb)
Base n=actual
(2523)
(237)
(555)
1637)
(94)
Less than 5 days
6%
7%
6%
5%
11%
5 days
26%
22%
24%
27%
31%
6 to 9 days
33%
27%
30%
34%
38%
10 or more days
33%
41%
38%
31%
18%
Don't remember
2%
4%
2%
2%
2%
Q28. How long did you isolate yourself from others?
Of those respondents who indicated they isolated, one in five left the house and may have come into contact with other people during the period they were isolated.
Leaving isolation was much higher among younger people; 30% of those aged 18 to 24 years left the house, compared to 11% of those aged 65 and older.
The percentage of respondents leaving the house during their isolation was also higher among men (25%, compared to 14% of women) and Indigenous People (39%, compared to 18% of non-Indigenous individuals).
Table 25. Leaving the House During Isolation Period
Base n=actual (n=2775)
Yes
19%
No
78%
Don't remember
3%
Q29. During the period you were isolated, did you leave your house for any reason where you may have come into contact with other people?
Past 30 Days Suspected Covid-19 Infection or Been Sick with Non-Covid-19 Illness
In the past 30 days, 20% of respondents indicate they were sick with either a suspected COVID-19 infection (11%) or a non-COVID-19 illness (17%).
Compared with the average, young people are more likely to suspect that they had COVID-19 (25% of those 18 to 24), as are Indigenous respondents (22%) and those living in remote locations (28%).
Table 26. Experience of Non-COVID-19 Illness or Suspect a Covid-19 Infection in the Past 30 Days
Base
Yes
No
Been sick with a non-COVID-19 illness such as influenza (flu)
(6200)
17%
83%
Suspected you had COVID-19*
(6092)*
11%
89%
Q30. In the past 30 days have you…?
* not asked if reported COVID-19 infection in last 30 days
Actions Taken in the Past 30 Days among those with non-COVID-19 Illness or a Suspected COVID-19 Illness
Only 69% of those who indicated they were sick in the past 30 days isolated themselves from people outside their household, and fewer (48%) isolated themselves from others in their household. Just over 6 in 10 (64%) of those who were sick in the past 30 days with suspected COVID-19 or another illness wore a mask around others. Among those working outside of the home, 68% avoided going to work.
Compared with those who had a confirmed COVID-19 case, those who were ill with a non-COVID-19 illness or only suspected they might have COVID-19 were less likely to undertake measures to reduce their exposure or risk of transmission to others.
Table 27. Actions Taken When Sick with Non-COVID-19 Illness or Suspected COVID-19 in the Past 30 Days
Base n=actual (n=1228)
Yes
No
Not applicable
Isolated myself from people outside my household
69%
26%
5%
Avoided going to work*
68%
27%
5%
Wore a mask when around others
64%
27%
10%
Isolated myself from people in my household
48%
40%
12%
Q31. Which of the following actions did you take when you determined you were sick?
* Only asked if respondent works outside of the home
For those that isolated from others due to a non-COVID-19 illness or suspected COVID-19 infection, 71% isolated for at least 5 days.
Table 28. Length of Isolation When Sick with Non-COVID-19 Illness or Suspected COVID-19 in the Past 30 Days
Base n=actual (n=940)
Less than 5 days
25%
5 days
30%
6 to 9 days
25%
10 or more days
16%
Don't remember
4%
Q32. How long did you isolate yourself from others?
Almost four in ten people who isolated left the house to go somewhere where they may have come into contact with other people.
Table 29. Leaving the House During Period of Isolation
Base n=actual (n=940)
Yes
38%
No
58%
Don't remember
4%
Q33. During the period you were isolated, did you leave your house for any reason where you may have come into contact with other people?
3.7. Vaccinations and At-risk Characteristics
Vaccinations
More than 8 in 10 (85%) adults report that they have received a primary series[6] of the COVID-19 vaccine, and 33% have had at least one booster.
While younger respondents are the most likely to not have their primary series (11% for those 18 to 24 years, compared to 5% of those 65 and older), the largest gap is when it comes to booster doses. Among those 65 and older, 68% have received 2 or more boosters, compared with only 39% of those 18 to 24 years.
Indigenous respondents are less likely to have 2 boosters (29%) and more likely to have not received any doses of COVID-19 vaccine (18%).
89% of respondents who are at-risk because of their age and health factors have at least their primary series, and 61% have at least 2 booster doses. Those not at-risk are less likely to have their primary series (81%) and at least 2 booster doses (41%).
Respondents from British Columbia (60%) and Quebec (59%) are the most likely to have 2 or more boosters, followed by PEI (56%) and Manitoba (53%).
Those living in rural locations are the most likely to not have received any doses (11%, compared to the average 8%).
Table 30. Vaccination Status
Base n=actual (n=6200)
I have received the primary series + 2 or more boosters
52%
I have received the primary series + 1 booster
18%
I have received the primary series*
15%
I have not received the full primary series but have received one dose
2%
I have not received any doses of a COVID-19 vaccine
8%
Rather not say
4%
Net: Vaccination (at least primary series)
85%
Net: Not vaccinated
10%
Q24. Which of the following best describes your COVID-19 vaccination status? Select one.
At-risk Individuals
There are four health characteristics (being immune compromised, living with obesity, a chronic health condition, and being pregnant), in addition to being over the age of 60, which are associated with a higher risk of negative health outcomes from COVID-19.
The four-health related characteristics are shown in the table below Overall, 41% of respondents have at least one of these characteristics. This is higher among older (58% of those 65 years and older) and Indigenous respondents (49%).
Table 31. Presence of Medical Conditions that Increase Risk
Base n=actual (n=6200)
Yes
No
Prefer not to answer
Obesity
15%
82%
3%
Immune compromised
15%
83%
2%
Chronic medical condition
32%
66%
2%
Pregnant
3%
96%
2%
Q21. Do you live with obesity (BMI over 40)?
Q20. Do you have any conditions that affect your immune system (e.g., autoimmune diseases, HIV, treatment for cancer, treatment for inflammatory diseases, anti-rejection drugs for organ transplants, etc.)?
Q22. Do you have a chronic medical condition such as asthma, dementia, diabetes, heart disease, high blood pressure, kidney disease, liver disease, lung disease, or stroke?
Q23. Are you currently pregnant?
Adding anyone 60 years of age and older, the total at-risk population grows to 56%. In the analysis throughout the report, the at-risk population includes anyone with a health condition or who is older than 60 years of age. Although non-vaccinated people are more likely to be at-risk for serious health outcomes, they are treated as a separate group in the analysis.
4. Segmentation Analysis
To better understand how attitudes, behaviour, and demographics fit together, a segmentation analysis was conducted using Latent Class Analysis (LCA). Latent Class Analysis identifies latent subpopulations within a population based on a set of variables. Like other segmentation approaches, LCA approaches are very sensitive to the variables entered and the maximum number of sub-populations that are allowed to exist.
Variable included:
Demographic/profile variables: age, gender, community size, education, Indigeneity, at-risk health indicators (e.g., obesity, being pregnant, being immune compromised, having a chronic health condition and being 60 years and older), and vaccination status.
Attitude variables: perceived likelihood of getting illnesses, susceptibility to serious outcomes, perceived severity of illnesses, concern about illnesses, and attitudes about masks and PHMs.
The analysis identified 5 key respondent groups and offers an interesting view of how different groups within the public approach public health measures.
Hyper-Worriers (14% of the population) – A group that is defined by their worry. These individuals are the most likely to perceive themselves to have a high likelihood of getting COVID-19 and susceptibility to serious outcomes from COVID-19. In fact, 44% think COVID-19 is life threatening. The high risk and concern could be due to, in part, their own health-related risk factors: 33% are immune compromised and 45% have a chronic health condition. While they are the most concerned, they are not the most committed to PHMs, even though they have a high level of trust in the federal government and the health sector.
PHM Endorsers (24%) – With a modest level of perceived risk, the defining feature of this group is its general embrace of PHMs and, specifically, of the use of masks. Seven in ten individuals in this group have 2 or more booster doses of the COVID-19 vaccine. Endorsers are motivated by perceiving a higher likelihood of getting ill, but are the most positive in thinking that PHMs, and masks specifically, are effective. Like the Hyper-worriers, they have a high level of trust. Members of this group have the second highest average age.
Risk Tolerant (28%) – The group with the highest proportion of older individuals and a relatively high vaccination rate (60% have at least 2 booster doses). Individuals in this group perceive a low level of risk at this time in terms of both likelihood and severity. They have the second lowest perceived personal risk of severe consequences of COVID-19 and do not see activities like going to a restaurant as being high-risk. This is not to say that they reject PHMs. In fact, most agree that it is important to follow PHM advice. While not as positive about PHMs as Endorsers, they generally see PHMs as effective.
Skeptics (20%) – One of the younger groups, the Skeptics recognize the risks of getting COVID-19 but are much less concerned than the Endorsers and the Hyper-worriers. Only 9% of this group think COVID-19 is life threatening. While they have a moderate level of trust in hospitals and healthcare workers (mean=6.1/10), they have the second lowest trust in the federal government (4.9). This group is the second least likely to have 2 or more boosters (46%). Only 60% agree or somewhat agree that following PHMs is important to them. PHMs are less likely to be viewed as effective (57% agree or somewhat agree), especially compared with Hyper-worriers (85%) and PHM Endorsers (97%).
COVID-19 Rejectors (14%) – Rejectors do not perceive there to be significant risk of getting or suffering serious consequences from a COVID-19 illness. About one third (34%) are unvaccinated. This group are less likely to believe PHMs are effective (29% agree or somewhat agree). Importantly, a large proportion (38%) do not assess the risk of getting sick. The Rejector group has the highest percentage of young respondents (only 7% are aged 65 and older). This group has very low levels of trust in the federal government (mean = 2.1/10).
4.1. Segments and Use of PHMs
There are some differences in where segments get their information. Endorsers are the most likely to use information from PHAC, local public health authorities, and traditional news outlets. Hyper-worriers and the Risk Tolerant also use these sources, but to lesser degrees. Skeptics are paying much less attention to these outlets, as are Rejectors.
Table 32. Information Used to Keep Informed by Segment
Hyper-Worriers
PHM Endorsers
Risk Tolerant
Skeptics
Rejectors
Base n=actual (n=6200)
(887)
(1487)
(1714)
(1257)
(855)
Public Health Agency of Canada (PHAC)
54%
72%
57%
38%
14%
Local public health authorities
49%
68%
54%
34%
16%
Traditional news outlets
53%
75%
62%
36%
19%
Conversations with friends and family
35%
39%
39%
28%
29%
General social media
28%
18%
20%
21%
16%
Government social media accounts
29%
26%
20%
15%
5%
School/Workplace sources
22%
16%
14%
15%
7%
Blogs
11%
2%
3%
6%
5%
People I follow on social media
18%
5%
7%
12%
9%
Other, please specify
1%
3%
2%
1%
6%
Q11. Which of the following platforms/sources do you use to keep informed about COVID-19 and other respiratory infectious diseases (e.g., RSV and influenza (flu))? Select all that apply
The segmented groups approach assessing risk differently. PHM Endorsers are the most active in consuming and using information to assess risk, whereas Rejectors are the least likely to use any of the sources of information; in fact, 38% indicate they do not assess their risk. The Hyper-Worriers are slightly less likely to use their own vaccination status or reported data on infection rates, hospitalizations, and ICU admissions than Endorsers, despite feeling at-risk.
Table 33. Information Used to Assess Risk by Segment
Base n=actual (n=6200).
Hyper-Worriers
PHM Endorsers
Risk Tolerant
Skeptics
Rejectors
Base n=actual (n=6200)
(887)
(1487)
(1714)
(1257)
(855)
My vaccination status for COVID-19 and other viruses such as influenza (flu)
50%
68%
60%
42%
39%
Reported data such as infection rates, hospitalizations, and ICU admissions
47%
72%
58%
29%
10%
Reported characteristics of circulating disease variants
38%
56%
36%
25%
10%
Information about the people I will be visiting/ interacting with
35%
44%
27%
17%
9%
Information about the places I intend/need to visit
35%
44%
32%
23%
11%
Experiences of friends and other people I know
32%
36%
27%
22%
9%
My previous experience with getting a respiratory infectious disease
30%
37%
30%
23%
21%
Local hospital capacity
28%
33%
23%
21%
20%
I do not assess my risk
27%
21%
13%
15%
5%
Other
4%
3%
9%
14%
38%
Q7. What information do you use to assess the risk of getting a respiratory infectious diseases such as COVID-19, RSV or influenza (flu)? Select all that apply
Hyper-worriers and PHM Endorsers have considerable trust in government. Skeptics and Rejectors have low trust in the federal government (PHAC).
Table 34. Trust in Federal Government by Segment
Base n=actual (n=6200)
Hyper-Worriers
PHM Endorsers
Risk Tolerant
Skeptics
Rejectors
Base n=actual (n=6200)
(887)
(1487)
(1714)
(1257)
(855)
Mean
7.4
7.0
6.1
4.9
2.1
Low trust (1-3)
10%
7%
19%
23%
83%
High trust (8-10)
60%
48%
36%
8%
3%
Q9. Using a 10 point scale where 1 is no trust and 10 is a very high level of trust, how much do you trust the following people and organizations? The federal government (e.g., The Public Health Agency of Canada)
Mask Wearing
Mask wearing behaviour is different across the segments. Table 35 highlights the results for the frequency of wearing a mask in the past three months in a public indoor setting. Hyper-worriers (39%) and Endorsers (30%) are the most likely to always wear a mask in these settings. Rejectors (6%) and Skeptics (7%) are the least likely to always wear a mask. In fact, 64% of Rejectors never wear a mask in these settings.
Table 35. Frequency of Wearing a Mask in Public Indoor Setting by Segment
Base n=actual (n=6200)
Hyper-Worriers
PHM Endorsers
Risk Tolerant
Skeptics
Rejectors
Base n=actual (n=6200)
(887)
(1487)
(1714)
(1257)
(855)
Always
39%
30%
16%
7%
6%
Often
22%
19%
14%
14%
4%
Sometimes
20%
25%
19%
26%
8%
Rarely
10%
16%
20%
26%
11%
Never
7%
10%
28%
22%
64%
Not applicable
2%
1%
1%
5%
8%
Q12a. In a public indoor setting (e.g., grocery store): In the past three months, how often have you worn a mask in the following situations?
When asked about the reasons for mask use, the Endorsers are the most likely to wear a mask to reduce the likelihood of getting COVID-19 and other viruses (48%) and to reduce the spread of COVID-19 (45%). The Endorsers (40%) and the Risk Tolerant (43%) segments also indicate a desire to protect more vulnerable people.
Skeptics are less motivated (8% have no reason to wear one and cite fewer reasons) to wear masks, and an even greater percentage of Rejectors (40%) indicate having no reasons to wear a mask.
Table 36. Top Reasons for Wearing a Mask by Segment
Base n=actual (n=6200)
Hyper-Worriers
PHM Endorsers
Risk Tolerant
Skeptics
Rejectors
Base n=actual (n=6200)
(887)
(1487)
(1714)
(1257)
(855)
I will reduce the likelihood of getting COVD-19 and other viruses, such as the influenza (flu)
38%
49%
34%
22%
8%
I will reduce the spread of COVD-19 and other viruses, such as the influenza (flu)
34%
45%
34%
23%
8%
To protect more vulnerable individuals
31%
40%
42%
30%
21%
To protect the healthcare system
21%
18%
18%
15%
7%
I don't trust others to stay home when sick
21%
23%
19%
15%
9%
To protect the health of my community
20%
25%
19%
15%
8%
Mask mandates
20%
28%
39%
29%
31%
Recommendations by local public health authority
18%
24%
27%
17%
9%
It is part of my routine now
15%
14%
10%
10%
5%
It is easy for me to do
14%
14%
13%
15%
10%
I will feel better about myself
11%
6%
7%
13%
4%
I am concerned what friends and family will think if I don't wear a mask
10%
2%
3%
8%
3%
Support/encouragement from friends and family
10%
3%
4%
8%
4%
Recommendations by employer
10%
4%
9%
12%
9%
No reasons
1%
0%
2%
8%
40%
Q17. Which of the following are the top 3 reasons that would lead you to wear a mask? Please select up to 3
5. Conclusions
Understanding how people use and understand risk assessments to make decisions during the COVID-19 pandemic and going forward.
Three aspects of risk (perceived likelihood of infection, perceived susceptibility to a severe consequence, and perceived severity of the illness) tend to be related to each other, but there is a tendency for the overall concern to reflect all three aspects. The specific disease or illness (COVID-19, RSV or the flu) across the three measures of risk does vary. For example, the flu has the highest perceived likelihood of infection but is viewed as the least severe compared to COVID-19 and RSV.
Nevertheless, there are three common drivers of perceived risk for all three concepts. The first is being at-risk because of health conditions or age. Those who are at-risk are aware of it. The second is the role of vaccinations. Those who are vaccinated against COVID-19 perceive the risk to be higher. Finally, the third driver is trust in government, hospitals, and health care workers, which is associated with higher perceived risk.
At the time of the survey (February 2023), the perceived risk of various social activities was quite modest for most respondents. Nevertheless, people who are concerned with illnesses are more likely to think it is risky to engage in these behaviours. In fact, those who perceive there to be a higher risk were consistently more likely to take more precautions (e.g., wear mask, or avoid certain activities) than those who did not perceive high risk.
While focus group participants did not use specific tools to measure their risk, they were sensitive to the risk of interacting with others and seek information about how many people are attending and whether they know and trust them. Additional information about the places visited that are salient among focus group participants included space and ability to distance, ventilation, and the availability of fresh air.
Consistent with the focus group participants, the top information used to assess risk by survey respondents are one's own health status (54%), their vaccination status (47%), and reported data on the illness such as infection rates, hospitalizations and ICU admissions (35%).
Measure and understand how people access PHM information.
Accessing public health information about COVID-19 and other respiratory infectious diseases is primarily from traditional news outlets (53%), the Public Health Agency of Canada (50%), and local health authorities (47%) according to survey respondents. Trust is a key factor in explaining how the participants used information sources, with several participants identifying social media as not credible or trustworthy, which is reflected in its use as indicated by survey respondents. Trust, particularly in the Government and health care sector, is also central for survey respondents in assessing the effectiveness of public health measures.
Focus group participants appeared to be clearly informed about COVID-19 and the resulting public health measures. Moreover, those in the high-risk groups appeared to have spent more time researching and looking for information.
The survey results show that a majority think it's easy to use public health measures (82% agree or somewhat agree) and 85% know how to use them. Attitudes about masks are generally positive regarding their effectiveness and use. Three quarters (75%) at least somewhat agree that masks are an effective way to reduce the transmission of respiratory infectious diseases and 77% agree that PHMs generally are effective. That said, 35% of respondents don't think mask mandates are effective.
Evaluate how people use PHM advice to protect themselves and those around them
There is overall agreement (85%) that it is important for people to stay home and away from others when they have symptoms of a respiratory infectious disease. In addition, 74% of respondents are motivated to use PHMs when they are concerned about getting sick. Most focus group participants (November 2022) also believed the pandemic changed how cold and flu symptoms are viewed; they and those in their household were using rapid tests, staying home (not go to work/school), and isolating if they were not well.
The survey assessed how people used PHM advice to protect themselves and others in the context of a few specific PHM and scenarios: first, how people use masks; second, how people decide on whether to attend a situation in terms of its risk; and finally, what people did when they got COVID-19.
When it comes to masks:
The top reason for wearing a mask is to protect more vulnerable individuals (35%). The next most mentioned reasons are the reduced likelihood of getting COVID-19 and other viruses (32%), mask mandates (31%), and reducing the spread of illnesses, including COVID-19 (31%).
The top reason cited for not wearing a mask is that it is not required (26%). The next most mentioned reasons are they forget to have one (19%), masks are uncomfortable (18%), no one else is wearing a mask (14%), and they are sick and tired of wearing a mask (14%). Just over a quarter of respondents said there are no reasons for them not wearing a mask.
Only a small group of respondents always wear a mask across different situations, but the riskier the situation, the higher frequency of mask wearing. For example, only 10% always wear a mask in a private indoor setting with people outside their household, but 33% do so when feeling sick around others (33% always) or when interacting with someone who is at a risk of more severe outcomes from a respiratory illness (32% always).
In the focus groups, the most common measures that participants indicated they take to mitigate risk today include the use of hand sanitizer and masking (though most freely admit it is limited to specific activities, i.e., they do not mask across all contexts).
Attending an event or gathering:
Health status is the most important consideration (46% very important) when considering whether to attend a gathering, followed by current local public health recommendations (33%), the number of COVID-19 cases in the community (32%), level of other respiratory illnesses in the community (31%), and the size of the gathering (31%).
This mirrored the qualitative discussion, irrespective of whether a scenario was rated as high, medium, or low risk, many participants indicated they would still participate in these activities (for example, some had attended weddings, funerals, large concerts, etc.).
An experiment investigating what prompts people to cancel plans, showed that having symptoms of illness paired with a positive COVID-19 test is more likely to prompt cancellation than having these symptoms with either a negative or no test situation. For the negative test or no-test group, cancelling plans is more likely to be plan contingent. For example, the negative test group is most likely to cancel visiting someone at-risk (53%) and least likely to cancel plans for going to work (32%) or going to a pub to meet friends (33%).
How people responded to a COVID-19 illness:
For those who tested positive for COVID-19 at some point, most (83%) isolated themselves from people outside their household, and 88% of those who work outside the home avoided going to work the last time they tested positive for COVID-19.
For those who tested positive and isolated from others, 92% isolated for at least 5 days and 33% for 10 or more days. Over time, the frequency of isolating for 10 or more days declined. For people whose infection was in 2020, 41% isolated for 10 or more days compared with only 18% of those whose last infection was in the first 2 months of 2023.
19% left the house during their isolation and may have come into contact with other people. Leaving the house was most likely early in the pandemic (28% in 2020) and in the first couple months of 2023 (29%).
In the focus groups, many participants indicated that once they had lived through COVID-19, their fear of severe outcomes dissipated, and while they felt the risk was still present of contracting COVID-19, they were no longer afraid of severe outcomes. Although, there were several participants who felt the reverse; having had COVID-19 with severe symptoms previously, they felt the risk was higher and took greater care since they wanted to avoid repeating that experience.
6. Appendices: Detailed Methodology
6.1. Quantitative Methodology
The online quantitative survey was conducted between February 7 and February 24, 2023. A total of 6,200 surveys were completed across Canada using an online panel.
Questionnaire
The questionnaire (both English and French) was developed by Abacus Data in close consultation with the Public Health Agency of Canada and Health Canada to ensure the survey captured the key areas of interest around the public's attitudes and behaviour related to public health measures.
Survey Pretest
The online survey pretest was completed on February 7, 2023. Twenty interviews were completed (10 in each official language). Pretest results were kept in the final data as changes did not impact the results.
Response Rate
Abacus Data calculates two rates that reflect the participation rate for the survey. The first is the Completion rate which is the % of completed or disqualified respondents divided by the total number of respondents who started the survey.
There is a possibility of non-response bias, which is introduced because certain types of individuals may be more or less likely to respond to the survey. The survey does not, for example, include members of the population who do not have access to the Internet. In addition, there are some groups within the population that are systemically less likely to answer surveys.
To address the issue of non-response bias, data were weighted to be reflective of the population of Canada using age, gender, and province.
Sample Distribution
The following table shows the breakdown of the completions by province/territory as well as other key groups. An oversample of Indigenous Peoples (+150 respondents) and those living in rural/remote areas (+100) was included in the survey plan to boost the total number of respondents in these groups.
The sample targets were based on the share of the population for the main 5000 respondents. The additional 1200 completions were from sample allocated to small provinces/territories or to Indigenous Peoples and people living in remote areas.
Table 37. Sample Distribution (unweighted)
Provinces
Target Completions
FINAL COMPLETIONS
Newfoundland and Labrador
142
155
Prince Edward Island
112
114
Nova Scotia
328
341
New Brunswick
313
324
Quebec
1150
1164
Ontario
1925
1991
Manitoba
357
375
Saskatchewan
344
354
Alberta
585
617
British Columbia
675
695
Territories
69
70
Yukon
23
27
Northwest Territories
23
25
Nunavut
23
18
INDIGENOUS CANADIANS
100
317
RURAL/REMOTE
100
264
Canada
6200
6,200
Weighting
Weighting adjustments were applied to the final edited, clean data to ensure the data is reflective of the population by age, gender, and province for 2021. In addition, the remote and Indigenous oversamples were weighted to reflect the size of these populations in Canada.
Margin of Error / Confidence Interval
No margin of error is reported because the sample was not a probability sample of the Canadian population. Respondents were sourced from a panel. Because it is a non-probability sample, the results cannot be extrapolated to a broader audience.
Segmentation Analysis
A segmentation analysis was conducted using Latent Class Analysis (LCA). Latent Class Analysis identifies latent subpopulations within a population based on a set of variables. Like other segmentation approaches, LCA approaches are very sensitive to the variables entered and the maximum number of sub-populations that are allowed to exist.
Variable included:
Demographic/profile variables: age, gender, community size, education, Indigeneity, at-risk health indicators (e.g., obesity, being pregnant, being immune compromised, having a chronic health condition and being 60 years and older), and vaccination status.
Attitude variables: perceived likelihood of getting illnesses, perceived severity of illnesses, susceptibility to serious outcomes, concern about illnesses, and attitudes about masks and PHMs.
Tabulated Data
Detailed tables are included under separate cover.
6.1. Qualitative Methodology
The qualitative phase of the research consisted of nine (9) online focus groups with the Canadian public conducted between November 28 and December 1, 2022.
In total, there were 82 participants across all nine focus groups. Each focus group was 90 minutes in length. Observers from PHAC and other government stakeholders attended each focus group.
The focus groups were moderated based on an approved discussion guide and included a review of materials developed by PHAC (see Appendix A).
Focus group results were used to inform the development of the quantitative research instruments.
Group Composition and Schedule
The table below provides an outline of the timing and composition of the focus groups. A person could be in more than one target audiences (i.e., Indigenous and rural/remote). The at-risk group was defined as someone with a health condition, over 60 years of age or not vaccinated.
Table 38. Focus Group Composition
Group #
Region/Language
Target Audience
Date
# of participants
1
Ontario-English
Gen Pop 18+
Indigenous
Rural and Remote
Nov 28
9
2
Atlantic English
Gen Pop 18+
Indigenous
Rural and Remote
Nov 28
11
3
Atlantic English
Gen Pop 18+
Indigenous
Rural and Remote
Nov 28
8
4
East-French
Gen Pop 18+
Indigenous
Rural and Remote
Nov 28
9
5
East-French
Gen Pop 18+
Indigenous
Rural and Remote
Nov 29
10
6
West/North (English)
Gen Pop 18+
Indigenous
Rural and Remote
Nov 29
8
7
West/North English
Gen Pop 18+
Indigenous
Rural and Remote
Nov 29
9
8
National English
High Risk Individuals (12)
Dec 1
10
9
National French
High Risk Individuals (12)
Dec 1
8
6.2. Survey Instrument
Thank you for agreeing to take part in this survey. We anticipate that the survey will take approximately 18 minutes to complete.
Background information
This research is being conducted by Abacus Data, a Canadian public opinion research firm on behalf of the Public Health Agency of Canada.
The purpose of this online survey is to collect opinions and feedback from Canadians that will be used by the Public Health Agency of Canada to help inform government actions and decisions.
How does the online survey work?
You are being asked to offer your opinions and experiences through an online survey. You have to be 18 or over in order to participate in this survey.
We anticipate that the survey will take 18 minutes to complete.
Your participation in the survey is completely voluntary.
Your responses are confidential and will only ever be reported in aggregate - never in any way that can identify any individual respondent or their responses.
Your decision on whether or not to participate will not affect any dealings you may have with the Government of Canada.
What about your personal information?
The personal information you provide to Health Canada is governed in accordance with the Privacy Act. We only collect the information we need to conduct the research project.
Purpose of collection: We require your personal information, such as demographic information, to better understand the views of survey respondents. However, your responses are always combined with the responses of others for analysis and reporting; you will never be identified.
Your rights under the Privacy Act: In addition to protecting your personal information, the Privacy Act gives you the right to request access to and correction of your personal information. For more information about these rights, or about our privacy practices, please contact survey@abacusdata.ca. You also have the right to file a complaint with the Privacy Commissioner of Canada if you think your personal information has been handled improperly.
If you are experiencing technical issues while responding to the survey, please contact Abacus's technical support team at survey@abacusdata.ca
Your help is greatly appreciated, and we look forward to receiving your feedback.
This research is being conducted by Abacus Data, a CRIC member company that follows the CRIC Pledge to Canadians. This project is a research initiative and is not selling or marketing products. It is registered with the CRIC Research Verification Service which allows you to verify its legitimacy and share your feedback. If you have feedback on this research, you can share it by going to: https://www.canadianresearchinsightscouncil.ca/rvs
[CONTINUE]
Screening Questions
SCR1. What is your gender identity? This refers to your current gender, which may be different from sex assigned at birth or from what is indicated on legal documents
None of the above............................................................................... 5
I prefer not to answer......................................................................... 9
SCR4 In which province or territory do you currently live?
[LIST PROVINCES AND TERRITORIES]
SCR5 Would you say you live in an urban area or a rural area?
Urban (in a city or large town with population ≥ 1,000)............ 1 [SKIP SCR6]
Rural (outside a city or large town with population < 1,000).... 2
SCR6 [IF RURAL] Do you live in area that is located more than 350 km from the nearest healthcare services having year-round road access by land and/or water routes normally used in all weather conditions?
Do not know.................................... 03
Main Survey
Risk Assessment Overall
On a 10-point scale where 1 is not at all likely and 10 is extremely likely, how likely do you think it is for you personally to get each of the following in the next month? [RANDOMIZE] [LIKELIHOOD]
COVID-19
Respiratory syncytial virus (RSV)
Influenza (flu)
On a 10-point scale where 1 is not at all likely and 10 is extremely likely, how likely do you think it is for you personally to have a severe consequence (e.g., requiring hospitalization or death) as a result of being infected from the following?? [RANDOMIZE] [SUSCEPTIBILITY]
COVID-19
Respiratory syncytial virus (RSV)
Influenza (flu)
[RANDOMIZE THE NEXT THREE QUESTIONS]
How serious do you think COVID-19 illness is in general? [RANDOMIZE] [SEVERITY]
Can be ignored................................................................................. 5
Not sure.............................................................................................. 9
At the moment, how risky do you think each of the following activities are in terms of getting sick from a respiratory infectious disease like COVID-19, RSV or influenza (flu)? [RANDOMIZE] [OVERALL RISK ASSESSMENT]
Attending a concert
Going to a restaurant for a meal
Going to a pub or bar to meet with friends
Having a dinner party at your house with people from different households
Shopping in a large retail grocery or department store
[SCALE: Not at all risky, somewhat risky, very risky, extremely risky, not sure]
What information do you use to assess the risk of getting a respiratory infectious diseases such as COVID-19, RSV or influenza (flu)? Select all that apply. [RANDOMIZE] [INFORMATION IN RISK ASSESSMENT]
Reported data such as infection rates, hospitalizations, and ICU admissions.............................. 1
Reported characteristics of circulating disease variants.................................................................. 2
Local hospital capacity........................................................................................................................... 3
Information about the places I intend/need to visit......................................................................... 4
Information about the people I will be visiting/ interacting with................................................... 5
My own health status............................................................................................................................. 6
My previous experience with getting a respiratory infectious disease.......................................... 7
My vaccination status for COVID-19 and other viruses such as influenza (flu)............................ 8
Experiences of friends and other people I know............................................................................... 9
I do not assess my risk........................................................................................................................... 10
On a 10-point scale where 1 is not at all concerned and 10 is extremely concerned, how concerned are you about getting the following respiratory infectious diseases?
COVID-19
Respiratory syncytial virus (RSV)
Influenza (flu)
Trust
Using a 10 point scale where 1 is no trust and 10 is a very high level of trust, how much do you trust the following people and organizations? [RANDOMIZE]
Ordinary people
The federal government (e.g. The Public Health Agency of Canada)
Your provincial government
Hospitals and healthcare workers (e.g., doctors and nurses)
Scientists and researchers
Journalists and reporters working for large media organizations
People I follow on social media
Celebrities
Friends and family
Attitudes about Public Health Measures and Individual Empowerment
How much do you agree or disagree with each of the following? [RANDOMIZE]
I use individual public health measures (e.g. wearing a mask, staying home when sick, improving indoor ventilation) because I'm concerned about getting sick. [MOTIVATION]
I know how to use individual public health measures to reduce the spread of respiratory infectious diseases (COVID-19, RSV, influenza (flu)) [SKILLS]
I'm more likely to use a mask when I see other around me using one [SOCIAL INFLUENCES]
It is easy for me to use individual public health measures (i.e., wearing a mask, staying home when sick, improving indoor ventilation) [BELIEFS ABOUT CAPABILTITIES]
Using public health measures is important to me [GOALS]
Public health measures are effective at reducing the spread of respiratory infectious disease such as COVID-19, RSV and influenza (flu) [BELIEFS ABOUT CONSEQUENCES]
[SCALE: Agree, somewhat agree, somewhat disagree, disagree, not sure]
Which of the following platforms/sources do you use to keep informed about COVID-19 and other respiratory infectious diseases (e.g., RSV and influenza (flu))? Select all that apply. [RANDOMIZE]
Public Health Agency of Canada
Local public health authorities
Traditional news outlets (e.g., television, radio and news)
Conversations with friends and family
General social media
Government social media accounts
School/Workplace sources
Blogs
People I follow on social media
Other, please specify
None of the above
Following Public Health Measures
[PROVIDE FOLLOWING NOTE ON QUESTIONS WITH 'MASK' IN THIS SECTION]
The word mask refers to a respirator (e.g., N95, KN95), medical mask (e.g. blue surgical mask) or non-medical mask (e.g. cloth mask).
In the past three months, how often have you worn a mask in the following situations?
In a public indoor setting (e.g. grocery store)
When at a large public indoor gathering (i.e., concert, wedding, funeral, etc.)
In a private indoor setting with people outside your household (e.g. friend's house)
On public transportation (bus, metro, streetcar, cab)
In a long-term care home
When interacting with someone who is at risk of more severe disease or outcomes from respiratory infectious diseases (e.g. older adult, pregnant person, someone who is immunocompromised, etc.)
In a public outdoor setting (e.g. park)
When you are feeling sick and are around others
[SCALE: Always, often, sometimes, rarely, never, not applicable]
How important are each of the following when considering whether to attend an event or gathering? [RANDOMIZE]
The number of COVID-19 cases in the community at the time
The level of other respiratory infectious diseases in the community at the time (e.g. RSV, influenza (flu))
The size of the gathering/number of people who will be attending
The ability to distance myself from other people
The ventilation and availability of outside air at the event
Knowing and trusting the people who are going to be at the gathering
The current local public health recommendations
The number of public health measures in place at the setting
My health status / presence of influenza (flu)-like symptoms
[SCALE: Very important, important, somewhat important, not important, not sure]
How important are each of the following when considering whether or not to wear a mask? [RANDOMIZE]
The number of COVID-19 cases in the community at the time
The level of other respiratory infectious diseases in the community at the time (e.g. RSV, influenza (flu))
The size of the gathering/number of people who will be attending
The ability to distance myself from other people
The ventilation and availability of outside air at the event
Knowing and trusting the people who are going to be at the gathering
The current local public health recommendations
My health status / presence of influenza (flu)-like symptoms
[SCALE: Very important, important, somewhat important, not important, not sure]
Which of the following best describes your work situation?
I am not currently employed
I am employed but work from home 100% of the time
I am employed and have to attend an office or other work setting at least some of the time.
If you had cold or influenza (flu) symptoms such as runny nose, fatigue, coughing, sneezing or fever [SPLIT SAMPLE, 1/3 GET EACH OF THREE: but have not yet taken a COVID-19 test; have taken a COVID-19 test and tested negative; have taken a COVID-19 test and tested positive], how likely are you to cancel plans for each of the following?
Go to work [SKIP IF DOES NOT GO TO WORK LOCATION]
Attend concert or sporting events
Going to a restaurant for a meal
Going to a pub or bar to meet with friends
Meeting with people from different households either at your place or theirs
Visiting those who are at risk of more severe disease or outcomes
Shopping in a large retail grocery or department store
[SCALE: Very likely, somewhat likely, not very likely, not at all likely, not applicable to me]
Which of the following are the top 3 reasons that would lead you to wear a mask? Please select up to 3. [RANDOMIZE]
Recommendations by local public health authority
Recommendations by employer
Mask mandates
I will reduce the spread of COVD-19 and other viruses, such as the influenza (flu)
I will reduce the likelihood of getting COVD-19 and other viruses, such as the influenza (flu)
I will feel better about myself
To protect the healthcare system
It is part of my routine now
To protect more vulnerable individuals
To protect the health of my community
Support/encouragement from friends and family
I am concerned what friends and family will think if I don't wear a mask
I don't trust others to stay home when sick
It is easy for me to do
No reasons
For you personally, which of the following are the top 3 reasons for not wearing a mask? Please select up to 3. [RANDOMIZE]
It's not required
I don't have access to masks
I forget to bring a mask with me when I go out
Masks are uncomfortable
It's challenging for me to wear a mask
It makes doing other things more difficult (i.e., job or other daily tasks)
No one else is wearing a mask
I am concerned what friends and family will think if I wear a mask
Friends/family pressure me to not wear a mask
It won't protect me from getting COVID-19
It won't protect me from getting other viruses, such as the influenza (flu)
It won't help prevent the spread of COVID-19
It won't help prevent the spread of other viruses, such as the influenza (flu)
There are better ways to protect myself from getting sick
It won't have a big impact
Masks aren't effective at stopping transmission of respiratory infections
It's not important to me
I don't like being told what to do
I am sick and tired of wearing a mask
No reasons
Do you agree or disagree with each of the following? [RANDOMIZE]
I am supportive of mask mandates, when COVID-19 cases are high [ENVIRONMENTAL CONTEXT]
I don't think mask mandates are effective. [BELIEFS ABOUT CONSEQUENCES]
Masks are an effective way to reduce the transmission of respiratory infectious diseases [BELIEFS ABOUT CONSEQUENCES]
I would only wear a mask if it was required to attend certain public events or locations [REINFORCEMENT]
It is important that people stay home and away from others when they have symptoms of a respiratory infectious diseases (COVID-19, RSV, influenza (flu)) [SOCIAL/PROFESSIONAL ROLE AND IDENTITY]
I always have a mask with me when I go out in public [RESOURCES]
I have a specific plan for when I will wear a mask [ACTION PLANNING]
[SCALE: Agree, somewhat agree, somewhat disagree, disagree, not sure]
Health Status
We would like to ask some questions about your health.
Do you have any conditions that affect your immune system (e.g., autoimmune diseases, HIV, treatment for cancer, treatment for inflammatory diseases, anti-rejection drugs for organ transplants, etc.)?
Do you have a chronic medical condition such as asthma, dementia, diabetes, heart disease, high blood pressure, kidney disease, liver disease, lung disease, or stroke?
Yes, more than once......................................................................... 2 [COMPLACENCY]
No, I have not tested positive for COVID-19................................ 3
[IF HAD COVID-19/HAD COVID-19 MORE THAN ONCE] When did your most recent COVID-19 infection occur?
Month/Year dropdown
[IF YES TESTED POSITIVE] In regard to the last time you tested positive with COVID-19, which of the following applies to you? [Yes/No/ Not applicable for each] [RANDOMIZE]
Was instructed to isolate from others by health authorities..... 1
Isolated myself from people outside my household................... 2
Isolated myself from people in my household............................. 3
Wore a mask when around others................................................. 4
Avoided going to work……………………………………………………………5 [ONLY ASK IF EMPLOYED OUTSIDE HOME]
[IF ISOLATED OR TOLD TO ISOLATE] How long did you isolate yourself from others?
6 to 9 days....................................... 3
10 or more days.............................. 4
I didn't isolate from others........... 5
Don't remember............................. 9
[IF ISOLATED OR TOLD TO ISOLATE] During the period you were isolated, did you leave your house for any reason where you may have come into contact with other people?
In the past 30 days have you …? [YES/ NO for each]
Suspected you had COVID-19......................................................... 1 [HIDE IF HAD COVID IN PAST 30 DAYS]
Been sick with a non-COVID-19 illness such as influenza (flu).. 2
[IF HAD OTHER ILLNESS IN PAST MONTH OR SUSPECTED COVID-19] Which of the following actions did you take when you determined you were sick? [Yes/No/Not applicable for each] [RANDOMIZE]
Isolated myself from people outside my household................... 1
Isolated myself from people in my household............................. 2
Wore a mask when around others................................................. 3
Avoided going to work..................................................................... 4 [ONLY ASK IF EMPLOYED OUTSIDE HOME]
[IF ISOLATED] How long did you isolate yourself from others?
Prefer not to answer................................................................................................................................. □
D6. Which of the following categories best describes your current living situation?
Living with parents/guardians....................................................... 1
Living with a boyfriend, girlfriend, or partner/spouse................ 2
Living with roommates..................................................................... 3
Living on your own, without roommates...................................... 4
Other, please specify_________________________
Prefer not to answer........................................................................ 9
D7. Which of the following categories best describes your total household income? That is, the total income of all persons in your household combined, before taxes? SELECT ONE ONLY
Under $20,000
Between $20,000 and $40,000
Between $40,000 and $60,000
Between $60,000 and $80,000
Between $80,000 and $100,000
Between $100,000 and $150,000
$150,000 and above
Prefer not to say
D8. What are the first three digits of your postal code?
[OPEN TEXT: VALIDATION - FORCE THE TEXT FORMAT TO BE A9A]
A9A [FORMAT]
I prefer not to answer A9A
Thank you for your time on this important study! The results, once compiled, can be found on the Library and Archives website. [https://www.bac-lac.gc.ca/].
6.3. Focus Group Discussion Guide
Introduction (10 minutes)
Thank you all for joining the focus group today/this evening!
Introduce moderator/firm and welcome participants to the focus group.
Thanks for attending/value you being here.
Tonight/today, we're conducting research on behalf of the Public Health Agency of Canada (PHAC).
We will be talking about how you think about your chances of getting COVID-19 and other viruses like RSV and influenza ("the flu")
The discussion will last approximately 90 minutes.
If you have a cell phone or other electronic device, please turn it off.
To participate in this session, please make sure your webcam and your microphone are on and that you can hear me clearly. As well, in the list of participants, we will make sure only your first name appears (moderator can edit the names of participants as needed to remove last names).
Describe focus group
A discussion group is a "round table" discussion. My job is to facilitate the discussion, keeping us on topic and on time.
Your job is to offer your open and honest opinions. You're in a "safe space", there is no judgement here. There are no right or wrong answers. This is not a knowledge test, and you will not be penalized based on the thoughts and opinions you share.
I realize that there may be sharp differences of opinion on this subject, but everyone's opinion is equally important and should be respected.
We want you to speak up even if you feel your opinion might be different from others. Your opinion may reflect that of other Canadians who are not in the room tonight/today.
We will be making regular use of the chat function. To access that feature, please scroll over the bottom of your screen until the command bar appears. There you will see a function called "chat". It will open a chat screen on the far right of your screen. I'd like to ask you to use chat throughout our discussion tonight. Let's do a quick test right now - please open the chat window and send the group a short message (e.g. Hello everyone). If you have an answer to a question and I don't get to ask you specifically, please type your response in there. We will be reviewing all chat comments at the completion of this project.
Explanations:
Please note that anything you say during these groups will be held in the strictest confidence. We do not attribute comments to specific people. Our report summarizes the findings from the groups but does not mention anyone by name. Please do not provide any identifiable information about yourself.
The report can be accessed through the Library of Parliament or Archives Canada in about six to eight months.
Your responses will in no way affect your dealings with the Government of Canada.
The session is being audio-video recorded. The recordings remain in our possession and will not be released to anyone, even to the Government of Canada, without your written consent. The recording is only for report writing purposes / verify feedback.
Observers:
There are individuals from PHAC involved in this project who may be watching this online; this is only so they can hear the comments first-hand.
Any questions?
Please note that the moderator is not an employee of the Government of Canada and may not be able to answer questions about what we will be discussing. If questions do come up over the course of the discussion, we will try to get answers for you before we wrap up the session.
If you are not speaking, I would encourage you to mute your line to keep background noise to a minimum…just remember to remove yourself from mute when you want to speak!
Also, since it is difficult to understand if more than one of you speak at the same time, please use the "Raise Hand" feature (SHOW IF NECESSARY) so I can make sure I hear from all of you.
Roundtable introduction: To get us started off, I'd like to hear a little bit from each of you. Please tell us your first name and what you enjoy doing in your spare time.
General Discussion on COVID and Personal Risks (20 minutes)
I'd like to start off the discussion by asking each of you how you dealt with the COVID pandemic, from the beginning to now.
How concerned were you with getting infected with COVID-19?
How concerned were you that those close to you would get infected?
What did you do to avoid getting infected, other than getting vaccination?
Probe on various PHMs, including staying at home when ill, mask-wearing, physical distancing, hand-washing,,, etc.
AVOID direct questioning on specific measures (social desirability bias, politicization)
Where did you get your information how to keep yourself safe from COVID-19 during the pandemic? What sources of information did you follow most closely? Were there any sources of information which you discounted or didn't believe?
How did you decide what to do? Explain your thinking process in detail.
What specific information or factors influenced what you decided to do?
How did this change throughout the pandemic? Is this the same or different in different situations or environments?
Concept of Risk and Risk Assessment (20 minutes)
What does the word "risk" mean to you?
For our discussion today/this evening, we'll be talking about the actions/measures that may be used to lower the chances, or risk, of getting infected with COVID-19 or other respiratory viruses like the flu. We're interested in measures like wearing a mask, staying distanced from others in public, avoiding gatherings, staying home when sick, opening windows for fresh air, and cleaning and disinfecting in your home. We're going to avoid discussions about COVID-19 vaccines, drugs, and testing for today.
How would you characterize the risk of getting infected with COVID-19 now? What about other respiratory illnesses (like influenza or RSV)?
Deep probe. What makes you say that? What things do you think about when you're determining your risk?
How about the risk to yourself vs. the risk to others?
Do you think your risk of getting infected with COVID-19 has changed over the course of the pandemic?
Time permitting: If yes, why? What factors led to a change?
Where did you get your information to help understand your risk of getting COVID-19 earlier in the pandemic? Where do you get it now? How much attention do you pay to that information?
Have you ever used any tools such as online questionnaires to assess the level of risk?
Do you think that certain people are at higher risk of getting infected with COVID-19? What about other respiratory illnesses? What about having more severe symptoms? What people do you think are at "higher risk"?
After thinking about some of the questions above, do you think that you do a 'risk assessment' before making decisions about using certain measures to lower your risk? Probe: What does 'personal risk assessment' mean to you?
Risk Scenarios and Use of PHMs (20 minutes)
Now, I'm going to give you a few scenarios, and I would like you to write your answers in a direct chat message to me as to what the chances are you would get infected with COVID or other respiratory illnesses in these types of situations, indicating "high", "medium" or "low" risk. Once all have responded, read responses anonymously, probe and discuss.
FOR EACH SCENARIO – PROBE ON PERCEIVED LEVEL OF RISK, HOW THEY ASSESS THAT RISK, AND ANY MEASURES used in response.
Going to a grocery store or other large surface store (e.g. Home Reno, Canadian Tire, etc.)
Having a dinner party in your home with 8-10 people from outside your immediate household during the holidays
Going to a wedding or funeral (difficult to avoid, mid-to-large size gathering)
Going out to a crowded restaurant or bar
Going to a New Year's Eve party with dinner, music and dancing in a public setting
Going to a concert in an arena
Going to the gym or working out in an indoor public setting
Ok, Now that I have each of your individual responses. I want us to reflect on how you made each of these decisions about how 'risky' each situation is. What did you consider?
I need to understand your reasoning, i.e. how you make your decision, as to how "risky" each situation is.
How do you decide which, if any, measures to use, specifically:
Wearing a mask
Staying home when you're sick
Staying distanced from others in public
Improving indoor ventilation, like opening a window or using a portable air cleaner
Coughing or sneezing into the bend of your arm or a tissue
Washing your hands more often
Increasing cleaning and disinfecting, especially high-touch surfaces and objects
What are some other situations where you think the risk of contracting COVID would be higher? How would you handle that situation? What would you do if you felt you couldn't avoid the situation? Probe on which PHMs they would use and reasoning
Has anyone in the group had cold or flu symptoms in the last few months? (Runny nose, cough, fever, chills, fatigue, etc.)
How, if at all, did this affect your behaviour? Probe on staying at home when sick, isolating from others, wearing a mask, using other PHMs
What about if you didn't have symptoms, but someone else in your household did?
How did you feel about the risk of becoming infected yourself?
How, if at all, did this affect your behaviour? Probe for adherence to isolation/quarantine guidelines.
Again, please explain your decision process. What factors are you considering when you decide what to do / not to do? What information are you using? Where do you get that information?
Reactions to Key PHM Messages (15 minutes)
I'm going to share my screen with you and show you a number of messages about different public health measures, that is, things you can do to help prevent the spread of COVID and other respiratory illnesses.
For each message ask:
Have you heard about this before? Do you remember where?
Do you believe it? Is it credible?
Do you think it's important to do this? In which situations? Why? Why not?
SHARE SCREEN. SHOW ONE MESSAGE PER SLIDE. MESSAGES:
When deciding what type of mask to wear, choose the best quality and best fitting respirator or mask that's available to you.
In general, while non-medical masks can help prevent the spread of COVID-19, medical masks and respirators provide better protection.
No matter which type of mask you choose, proper fit is a key factor in its effectiveness.
Don't use masks or respirators with exhalation valves or vents. They allow infectious respiratory particles to escape. They do not help prevent the spread of COVID-19.
___________________________
Stay home and limit your contact with others when you're sick or experiencing any COVID-like symptoms, even if mild. This will help prevent others in your community from getting sick.
____________________________
Good ventilation exchanges indoor air for outdoor air. This helps reduce the buildup of potentially infectious respiratory particles in the air indoors. Opening windows or doors if possible, even for a few minutes at a time, can improve ventilation.
____________________________
Respiratory etiquette means, when coughing or sneezing, you should:
cough or sneeze into a tissue or the bend of your arm, not your hand, if you're not wearing a mask
throw any tissues you've used into a plastic-lined waste container as soon as possible
clean your hands immediately afterwards
_____________________________
Hand hygiene means washing your hands regularly with soap and water for at least 20 seconds. If soap and water aren't available, use a hand sanitizer containing at least 60% alcohol. For example, clean your hands:
before and after touching a mask
before touching your eyes, nose or mouth
after using the washroom
after touching frequently touched surfaces and objects
after coughing or sneezing
before and after eating or handling food
______________________________________
Are these things you do more now than before the pandemic? Have your behaviours changed as a result of being informed of these messages?
SHOW MASK INFOGRAPH
Have you seen this information before? Do you remember where?
How much do you think this message would influence your decision to wear a mask and/or which type of respirator or mask?
Observer Questions (5 minutes)
Observers will have the opportunity to provide questions throughout the focus group using the chat function (direct messaging me). The Moderator will proceed to ask these questions of the group.
Thank Participants and Adjourn
6.4. Regression Analysis
Understanding Risk
The bivariate results give a sense of what factors are associated with COVID-19 risk perceptions. To further understand what is driving perceptions of risk, a multivariate regression model was developed and tested with the three measures of risk (perceived likelihood, susceptibility and severity) and an aggregate index that equally weighs these three indicators into a single dependent variable.
Dependent variable: perceived likelihood of getting COVID-19, perceived susceptibility to a severe outcome from COVID-19, perceived severity of COVID-19, and the index of risk.
Independent variables:
Demographics: Age, gender, education, location (remote versus rural versus urban), province, Indigenous identification
Health status: At-risk because of chronic health condition, immune compromised, obese, or pregnant
COVID-19 Experience: Previous exposure to COVID, vaccination status
Trust: Federal government, hospitals, and health care workers
Overall, the variables tested do not explain much of the variation in the three types of perceived risk as the adjusted R2 is around 0.1. The model where the dependent variable is an index of the three individual risk elements does a little better with an R2 of 0.17.
The results point to a relatively small role for standard demographics.
Older people are less likely to perceive risk of COVID-19 across all three constructs (controlling for other variables).
The largest contribution to perceptions of risk are being at-risk because of chronic illness, immune compromised, obese, or pregnant.
Those who have experienced COVID-19 have a higher perceived likelihood of getting COVID-19, while vaccinated people are more likely to perceive all constructs of risk as being higher.
Finally, trust in government is associated with higher perceived risk, as is trust in hospitals/healthcare workers.
Table 39. OLS Regression Analysis of Perceived Risk*
Base n=actual (n=6200)
Likelihood
Susceptibility
Severity
RISK INDEX
ADJ-R2
0.13
0.10
0.11
0.17
Male
-0.04
0.00
0.01
-0.01
Age
-0.12
-0.11
-0.02
-0.11
Ontario
-0.02
-0.05
0.04
-0.01
Atlantic
0.02
0.00
0.02
0.01
Alberta
-0.04
-0.03
0.01
-0.03
Quebec
0.02
-0.01
0.02
0.01
Manitoba/Saskatchewan
-0.03
-0.04
0.00
-0.03
Education
0.05
0.04
-0.01
0.04
Lives in remote location
0.03
0.05
0.04
0.05
Lives in urban location
0.01
0.00
0.04
0.02
Identifies as Indigenous
0.02
0.05
0.02
0.04
At-risk
0.09
0.18
0.14
0.18
Experienced COVID-19
0.19
0.04
-0.07
0.07
Vaccination Status
0.07
0.05
0.12
0.10
Trust in Federal Government
0.14
0.17
0.17
0.22
Trust in Hospitals/Healthcare workers
0.07
0.06
0.07
0.09
DEPENDENT VARIABLES
Likelihood:On a 10-point scale where 1 is not at all likely and 10 is extremely likely, how likely do you think it is for you personally to get each of the following in the next month?
Susceptibility:On a 10-point scale where 1 is not at all likely and 10 is extremely likely, how likely do you think it is for you personally to have a severe consequence (e.g., requiring hospitalization or death) as a result of being infected from the following?
Severity:How serious do you think [COVID-19; RSV (Respiratory syncytial virus); influenza (flu)] illness is in general?
RISK INDEX: A variable that adds the three risk constructs together into a single variable. Each has an equal weight.
* Values are Beta cofefficients
Drivers of Mask Wearing in an Indoor Public Setting
Wearing a mask in an indoor public setting is a good question to understand the drivers of mask wearing, since respondents identified these settings as more risky. For example, 71% think it is at least somewhat risky to shop in a large retail grocery or department store.
Dependent variable: In the past three months, how often have you worn a mask in the following situations? In a public indoor setting (e.g. grocery store)
Independent variables:
Demographics: Age, gender, education, location (remote versus rural versus urban), province, Indigenous identification
Health status: At-risk because of chronic health condition, immune compromised, obese, or pregnant
Perceived risk: Likelihood, susceptibility, and severity
COVID-19 Experience: Previous exposure to COVID, vaccination status
Trust: Federal government, hospitals, and health care workers
Attitudes about PHMs
Three different models were run with additional independent variables added to each model to better understand the impact of adding them.
Model 1, containing demographic, COVID-19 experience, and trust variables, has an adjusted R2 of 0.13. This is a relatively low level of explained variance in frequency of wearing a mask.
The most important driver in this model is trust in the federal government; higher trust is associated with increased mask wearing.
Those who have more doses of the vaccine are also more likely to wear a mask, while those who have had COVID-19 in the past are less likely.
Residents of Alberta and Quebec are less likely.
Model 2, which includes the three constructs of risk (likelihood, susceptibility, and severity), has a better model fit (R2 =0.20).
The perceived seriousness of COVID-19 is the most important predictor, followed by trust in the federal government, and individual perceived susceptibility to COVID-19.
The risk of getting COVID-19 (likelihood) was not found to be a predictor of mask wearing.
Model 3, including attitudes about PHMs, results in a better model fit (R2 =0.43).
Adding attitude variables reduces the role of perceived risk (likelihood, susceptibility, and severity), vaccination status, and COVID-19 experience. This is what would be expected if there is a relationship between these variables and attitudes about PHMs.
Wearing a mask in this setting is, however, more likely among those who always carry a mask when they are out, those who wear a mask to avoid getting sick, those who believe masks are effective, and those who indicate that following PHMs is important to them.
Table 40. OLS Regression Analysis of Drivers of Mask Wearing
Base n=actual (n=6200)
Model 1
Model 2
Model 3
ADJ-R2
0.13
0.20
0.43
Male
-0.01
-0.02
0.02
Age
0.04
0.06
-0.05
Ontario
0.05
0.04
0.04
Atlantic
0.01
0.00
0.01
Alberta
-0.05
-0.05
-0.04
Quebec
-0.06
-0.06
-0.03
Manitoba/Saskatchewan
-0.04
-0.03
-0.02
Education
0.06
0.06
0.05
Lives in remote location
0.00
-0.01
0.00
Lives in urban location
0.04
0.03
0.02
Identifies as Indigenous
0.04
0.03
0.03
At-risk
0.05
0.00
-0.01
Experienced COVID-19
-0.06
-0.05
0.01
Vaccination Status
0.13
0.10
-0.01
Trust in Federal Government
0.25
0.19
0.04
Trust in Hospitals/Healthcare workers
-0.03
-0.06
-0.10
Likelihood of getting COVID-19
0.00
-0.01
Susceptibility of serious illness from COVID-19
0.13
0.09
Seriousness of COVID-19
0.22
0.08
Public health measures are effective at reducing the spread of respiratory infectious disease
-0.06
I use PHM because I'm concerned about getting sick
0.23
Using public health measures is important to me
0.09
Masks are an effective way to reduce the transmission
0.06
I always have a mask with me when I go out in public
0.30
I have a specific plan for when I will wear a mask
0.08
It is easy for me to use individual public health measures
0.02
I know how to use individual public health measures
-0.04
I am supportive of mask mandates, when COVID-19 cases are high
0.02
I don't think mask mandates are effective.
-0.05
DEPENDENT: In the past three months, how often have you worn a mask in the following situations? In a public indoor setting (e.g. grocery store)