Figure 1 - Text description
| Highly knowledgeable (4-5) | Moderately knowledgeable (3) | Not knowledgeable (1-2) | |
|---|---|---|---|
| 2023 | 28% | 53% | 19% |
| 2020 | 24% | 51% | 25% |
Prepared for the Public Health Agency of Canada
Supplier Name: Nanos Research
Contract Number: 6D016-225811
Contract Value: $179,941.20 (including HST)
Award Date: 2023-01-06
Delivery Date: 2023-07-10
Registration number: POR-103-22
For more information on this report, please contact Health Canada at: HC.cpab.por-rop.dgcap.SC@canada.ca.
Ce rapport est aussi disponible en français
Stigma related to dementia in Canada Survey
Final Report
Prepared for the Health Promotion and Chronic Disease Prevention Branch, Public Health Agency of Canada (PHAC) by Nanos Research
July 2023
This publication may be reproduced for non-commercial purposes only. Prior written permission must be obtained from Health Canada. For more information on this report, please contact the Public Health Agency of Canada at: HC.cpab.por-rop.dgcap.SC@canada.ca.
©His Majesty the King in Right of Canada, as represented by the Minister of Public Services and Procurement Canada, 2023.
Communications Branch
Health Canada
200 Eglantine Driveway
AL 1915C, Tunney's Pasture
Ottawa, ON K1A 0K9
Catalogue Number: H14-461/2023E-PDF
International Standard Book Number (ISBN): 978-0-660-68199-3
Aussi disponible en français sous le titre La stigmatisation liée à la démence au Canada.
Numéro de catalogue : H14-461/2023F-PDF
Numéro international normalisé du livre (ISBN) : 978-0-660-68200-6
With a mandate to improve the health care, protect the health and prevent disease among Canadians, the Public Health Agency of Canada (PHAC) retained Nanos Research to conduct public opinion research among Canadians related to stigma associated with dementia. Specifically, to conduct a national survey which examines Canadians' knowledge of and attitudes towards dementia and stigma related to dementia.
Dementia is an umbrella term that describes symptoms affecting brain function caused by neurodegenerative and vascular diseases and injuries and is characterised by a decline in cognitive abilities, including memory, language, judgment, and planning, as well as mood and behaviour.
Dementia has a significant impact on Canadians and the impact continues to grow, with about 6.5% of Canadians 65 years of age and older living with diagnosed dementia as of 2019-20, disproportionately impacting women.[i] This figure excludes those under 65 who may have an early onset diagnosis or those not diagnosed but living with the symptoms – meaning its impact is likely even more significant. As Canada's aging population continues to increase, the proportion of Canadians living with dementia is expected to increase as well.
PHAC plans to utilize the research findings to support the continued implementation of Canada's first national dementia strategy, A Dementia Strategy for Canada: Together we Aspire, as required under the National Strategy for Alzheimer's Disease and Other Dementias Act which came into effect in 2017.
The research findings will also inform efforts to help develop a better understanding of dementia among Canadians, including how to be supportive when interacting with individuals living with dementia to make communities more welcoming and inclusive. It also builds on the baseline study conducted in 2020 and will measure any changes in attitudes, knowledge and perceptions related to dementia and dementia-related stigma.
The specific research objectives included, but were not limited to:
The survey is comprised of 5,056 Canadians, 18 years of age and older, including 1,604 self-identified unpaid caregivers (defined as someone who provides or has provided unpaid care and support to someone living with dementia in the last five years)*, 756 Canadians who identify as members of Black (n=181), Hispanic (n=68), Southeast Asian (n=254), or South Asian (n=253) ethnic groups and 188 individuals who identify as Indigenous. The survey was conducted across Canada in each province and territory between March 11th and 29th, 2023 and additional supplementary fieldwork was conducted between June 7th and 25th, 2023 in an effort to target more individuals in these key ethnic communities who are disproportionately impacted by dementia. There were 4,689 interviews conducted during the original fieldwork period, and an additional 367 interviews were completed during the supplementary June fieldwork.
The sample was drawn from two sources:
The resulting sample contains Canadians who were all randomly recruited by telephone, thus allowing a margin of error to be associated with the research. Of note, 2,406 interviews of the 5,056 total interviews were recruited from the Nanos Online Probability Panel and the other 2,650 interviews were recruited directly by a dual frame Random Digit Dialled sample of land- and cell-line numbers and administered the survey online.
The randomly recruited probability sample has a margin of error of +/-1.4% at a 95% confidence interval. The margin of error for each of the key target groups is between 2.4 (unpaid caregivers) and 12.1 (self-identified Hispanics) percentage points due to their varying and comparatively smaller sample sizes.
Results are weighted to population proportions for region, age, and gender from the 2021 Census. A Chi-square test and pairwise Z-tests were used to compare subgroups to each other (e.g. women versus men, Ontario vs Quebec). Comparison between subgroups and to the total sample (e.g. Ontario versus Canada overall; 65 to 74 years old versus Canadians overall) were made by observing significance based on the margin of error.
All respondents self-administered the survey online. Please see Appendix A for the detailed methodology.
*Of note, the benchmark survey which was completed in 2020 included 938 unpaid caregivers (22% of the total sample). Where relevant, the analysis provides any differences of note between the results of this survey and the 2020 survey. The significance of the differences between the surveys can be observed based on the margin of error of plus or minus 1.4 percentage points (95% confidence interval) for the 2023 survey and plus or minus 1.5 percentage points (95% confidence interval) for the 2020 survey.
The contract value was $179,941.20 (HST included).
Supplier name: Nanos Research
PWGSC contract number: 6D016-225811
Original contract date: 2023-01-06
For more information, contact the Public Health Agency of Canada at HC.cpab.por-rop.dgcap.SC@canada.ca
This certification is to be submitted with the final report submitted to the Project Authority.
I hereby certify, as a Representative of Nanos Research, that the deliverables fully comply with the Government of Canada political neutrality requirements outlined in the Government of Canada's Policy on Communications and Federal Identity and Directive on the Management of Communications. Specifically, the deliverables do not include information on electoral voting intentions, political party preferences, party standings with the electorate, or ratings of the performance of a political party or its leaders.
Nik Nanos
Chief Data Scientist and President
Nanos Research
nik@nanos.co
613-234-4666 x237
Most Canadians believe dementia is having a moderate (38%) to large (51%) in Canada today, with a notable increase in those who say the impact is large compared to the 2020 benchmark survey (35% said large impact in 2020).
Around one in four Canadians consider themselves knowledgeable about dementia (28%), which is an increase of 4 percentage points compared to the 2020 benchmark survey (24%). Despite Canadians not considering themselves to be very knowledgeable, most are able to correctly identify whether a series of statements about dementia are true or false. A majority correctly note that it is true that there are things we can do to reduce the risk of dementia (81%, an increase in 7 percentage points from 74% in 2020) and that the rate of dementia in the population increases notably after age 80 (75%). A majority correctly identify it is false that people living with dementia all have similar symptoms (77%) and that dementia is an inevitable (i.e., normal) part of aging.
Only one in four (25%) correctly identified that it is false that genetics is the most important factor determining the level of individual risk for dementia, while 28% correctly identified that higher levels of education may reduce the risk of developing dementia as true.
Readers should note that this survey contained 1,604 unpaid caregivers (32% of the total sample) compared to 938 included in the 2020 benchmark (22% of the total sample). This should be kept in mind when comparing results from the two surveys, especially as it relates to proximity to dementia.
Just under four in five Canadians report knowing someone that is living or has lived with dementia (77%, consistent with findings from 2020), most commonly an extended family member (44%), a parent (25%) or a friend (24%). One in five (20%) report they do not know anyone who is living or has lived with dementia.
Close to one in three Canadians surveyed (32%) say they have provided some form of unpaid care to someone living with dementia in the last five years, reporting they have assisted with errands such as grocery shopping (21%)*, general health care and health monitoring (16%), activities of daily living (16%; 24% in 2020),with financial affairs (15%) and 5% reported having provided other types of unpaid care. *Note: This response option was not provided in 2020.
For Canadians who reported having provided unpaid care and support to a person living with dementia, around three in four (72%) say they have experienced some issues or difficulties while they were with the person they were providing care for. Over one in two say they have had people talk to them rather than the person living with dementia (51%), while over two in five say they have encountered people who focused on the things the person living with dementia can no longer do instead of the things they can (45%). Around one in five each say they have had trouble accessing appropriate housing for the person living with dementia (20%), have been unable to go where they needed or wanted due to accessibility issues (17%) or have had difficulty navigating a public space such as a grocery store, bus or train (17%). About one in four (26%) reported they did not experience any of these issues or difficulties.
Around two in five Canadians (37%) among those who report they are providing or provided unpaid care and support for someone living with dementia say they have experienced at least one challenge when accessing or using dementia recommendations or advice related to the care they are providing. Close to one in ten each say the advice does not consider the cultural context for those to whom they provide care (12%), the advice is too expensive to obtain (11%), the advice is too complicated to understand or communicate (11%). Less than one in ten each say they do not trust the source of the advice (7%) or the advice is not in the right language (5%). Almost one in two say they have not encountered any challenges or barriers (46%).
Consistent with findings from 2020, close to one in four surveyed Canadians (24%) report they work in a sector where they may need or may have needed to interact with people living with dementia, most often reporting working in the following sectors of interest: health care (14%), retail (9%), financial services (8%), and community and religious/faith organizations (5%). Also consistent with the benchmark survey, one in five (20%) report they have volunteered in a sector that may need or may have needed to interact with people living with dementia.
Negative perceptions towards older people can be observed to impact views related to dementia stigma.
Canadians who strongly agree that people should generally retire at 65 because their ability to perform at a high-level declines were more likely to strongly agree that people living with dementia face a lower quality of life (31%) compared to those who strongly disagree that people should retire at 65 (18%). As well, those who strongly agree people should retire at 65 are more likely to strongly disagree/disagree that people living with dementia are sometimes able to work for years after the onset of symptoms (35% vs 18% of those who strongly disagree about the retirement age) and less likely to strongly agree/agree (52%) that people living with dementia can often continue activities they enjoy (78% of those who strongly disagree about people needing to retire at 65).
In addition, those who strongly agree that older people are less likely to be informed of the latest developments are more likely to strongly agree/agree that people living with dementia face lower quality of life (79%) than those who strongly disagree that older people are less informed (58%).
An increasing proportion of Canadians report they have taken steps in the last 12 months to specifically reduce their own risk for developing dementia (34%, a significant increase from 22% in 2020), while 54% report they have not (70% in 2020).
Among those who report taking steps, they most often mention challenging their brain to keep it active (learning new skills, memory games, etc.) (60%), followed by being physically active on a regular basis (58%), eating healthy foods (35%) and being socially active (e.g., volunteering, social events, working) (13%).
Canadians are more likely to agree that they worry about the possibility of someone close to them developing dementia (70%) than the possibility of personally developing dementia (63%). A significant increase can be noted for concern related to personally developing dementia compared to 2020, with 63% who agree they are worried about this compared to 49% in 2020. Worry about the possibility of someone close to them developing dementia has also increased, from 64% in 2020 to 70% in 2023.
If they develop dementia, Canadians are most concerned about losing their sense of self, their independence or becoming a burden. More than nine in ten Canadians strongly agree/agree that if they were living with dementia they would worry about becoming less independent (93%) and they would worry about becoming a burden to others (92%). Just under nine in ten (89%) agree that they would worry about losing their sense of self if they were living with dementia.
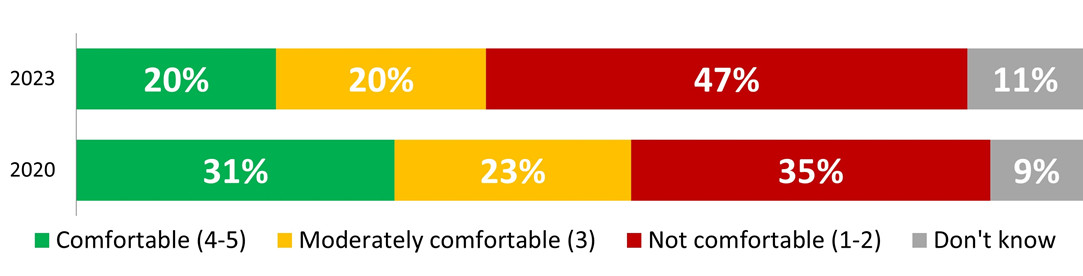
Eight in ten Canadians say they would feel at least moderately comfortable interacting with someone living with dementia (very comfortable (score of 4-5): 43%; moderately comfortable (score of 3): 37%), while 14% say they would not be comfortable (score of 1-2). The proportion of those who feel very comfortable has declined by 7 percentage points from one in two (50%) in 2020 to just over two in five (43%) in 2023.
Canadians who say they would feel very comfortable most often say this is because they currently know or have known people living with dementia (35%), followed by the reasons that people living with dementia are still people/everyone deserves to be cared for (31%), that they are generally confident in dealing with most situations/are patient (24%), and that they have information on supporting people living with dementia (9%). Among those who say they would feel uncomfortable, reasons cited most often are not being sure how to talk to or support/help the person (22%), followed by being worried about or unsure of how the person will behave/react (17%) and not having enough information about dementia (15%).
Most Canadians agree that people living with dementia are sometimes able to continue to do a variety of things after diagnosis, specifically continuing to be active in their communities (72%), continuing to live in their own home (70%) and continuing to do activities they enjoy (69%). Despite these positive perceptions, nearly two in three Canadians agree (65%) that people living with dementia generally face a lower quality of life than people without dementia, although this has declined since the benchmark 2020 survey (70%).
Canadians are less likely to agree that people living with dementia are sometimes able to continue working for years after the onset of symptoms (41%), which is a decrease of 6 percentage points from the 2020 findings (47%).
Almost 7 in 10 Canadians say they would be very comfortable asking a health care provider for information about dementia symptoms leading to an assessment and diagnosis (68%).
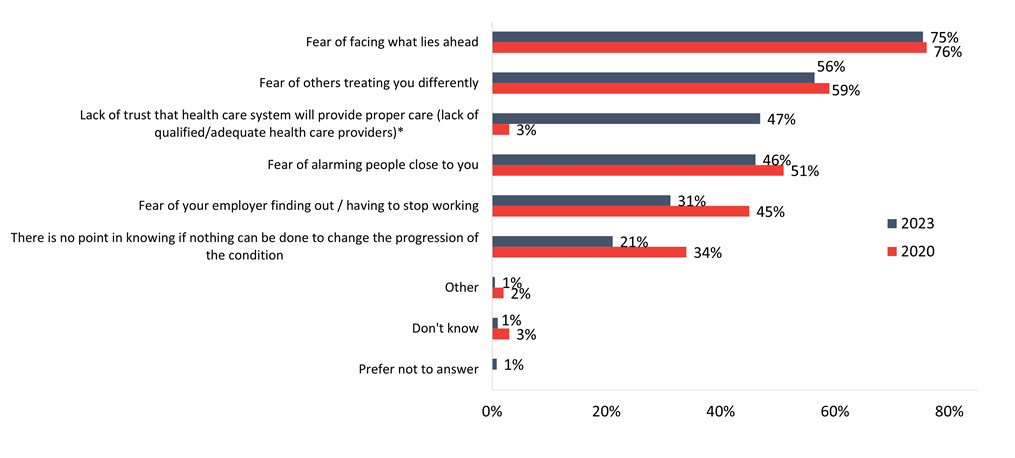
Among Canadians who say they would not be comfortable doing this (7%), they most often say it is because they are afraid of facing what lies ahead (75%), a fear of others treating them differently (56%), a lack of trust that the health care system will provide proper care (47%; 3% in 2020*) and a fear of alarming those close to them (46%; 51% in 2020). Close to one in three say they are uncomfortable because of a fear of their employer finding out and having to stop working (31%; a decrease from 45% in 2020) or that there is no point in knowing if nothing can be done to change the progression (21%; decreased from 34% in 2020).
*Of note, having a lack of trust in the health care system was not prompted on in the 2020 benchmark survey, but was mentioned verbatim by respondents. It was included as a prompted response option in this survey.
When it comes to sharing a dementia diagnosis, Canadians are more likely to say they would be very comfortable telling a close family member (57%; 64% in 2020) or friends (40%; 49% in 2020) about the diagnosis than neighbours or others in the community (24%; 31% in 2020) or an employer (20%; 31% in 2020). Comfort has declined across the board compared to the 2020 benchmark survey, with the biggest decrease being in comfort telling an employer about a diagnosis which declined by 11%.
Canadians are nearly twice as likely to disagree (33%) rather than agree (18%) that dementia is portrayed accurately in popular culture, such as in newspapers, film, television, and social media. More than one in four neither agree nor disagree with this (28%) and 21% are unsure.
Among those who disagree that dementia is portrayed accurately, close to six in ten say it is portrayed more negatively than it really is (60%), while 17% think it is portrayed more positively, 8% think it is portrayed in some other way, such as in a way that is not accurate or realistic (2%) or not portrayed at all or rarely shown (2%). Fifteen per cent say they are unsure.
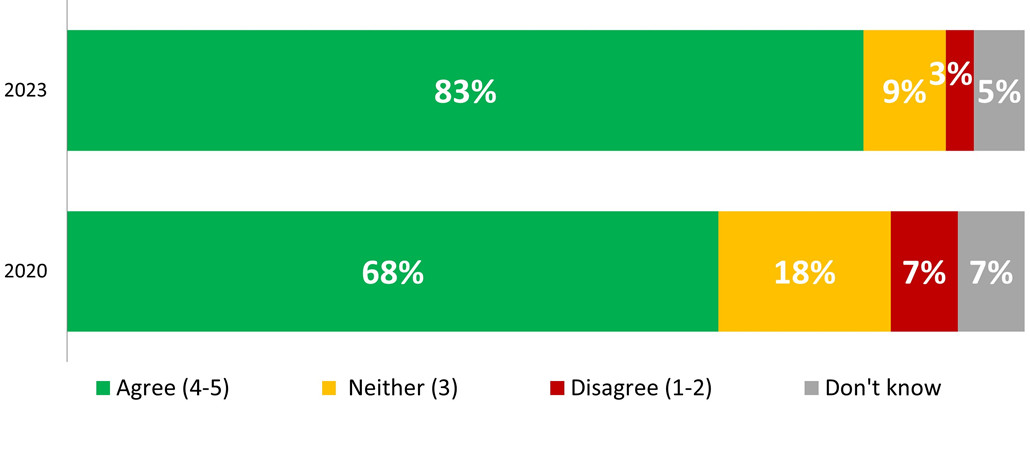
Most Canadians agree that people have negative assumptions about the abilities of people living with dementia (83%; an increase of 15 percentage points compared to the 2020 benchmark survey), that people living with dementia are usually perceived as needing others to make most of their decisions (80%) and are usually viewed as needing supervision in case of dangerous behaviour (80%). Three in five agree (59%) that people living with dementia usually are viewed as needing around the clock assistance with daily living. Agreement is much lower regarding the statement that people in their community are knowledgeable, respectful, and supportive of people living with dementia (27%) and that people living with dementia are usually viewed as being able to communicate their ideas and wishes to others (24%).
Canadians are over 10 times more likely to describe the quality of life of people living with dementia as poor (43%) rather than excellent (4%), while 41% describe it as moderate and 12% are unsure.
Nearly three in five Canadians say their views towards dementia have not changed in the past five years (59%) while more than one in three say their views have changed and are either more negative now (10%) or more positive now (26%) while 6% are unsure. Those who say their views have changed most often say this is due to knowing or caring for someone living with dementia (46%), followed by general information from sources other than the media (25%), and now being worried about getting dementia/now experiencing aging (9%).
This report begins with an executive summary outlining key findings and conclusions, followed by a detailed analysis of the results. A detailed dataset of "banner tables" is provided under separate cover; this presents results for all survey questions by key segments such as region, age, and gender.
The quantitative results in the report are expressed as percentages unless otherwise noted. Base size is the sample of n=5,056 unless otherwise specified.
Detailed findings are presented in the sections that follow. Overall results are presented in the main portion of the narrative and are typically supported by a graphic or tabular presentation of results. Results for the proportion of respondents in the sample who either said "don't know" or did not provide a response may not be indicated in the graphic representation of the results in all cases, particularly where they are not sizable (e.g., 10% or less). Net results cited in the text may not exactly match individual results shown in the charts due to rounding. Results may not add to 100% due to rounding or multiple responses.
Where relevant, the analysis provides any differences of note between the results of this survey and the 2020 survey. The significance of the differences between the surveys can be observed based on the margin of error of plus or minus 1.4 percentage points (95% confidence interval) for the 2023 survey and plus or minus 1.5 percentage points (95% confidence interval) for the 2020 survey.
The bullets under the charts also note any statistically significant differences between sub-groups of respondents in different demographic groups. Only demographic differences that are significantly different based on the margin of error of plus or minus 1.4 percentage points (95% confidence interval) and using a Chi-square test and pairwise Z-tests are presented.
Key demographic patterns of interest are described throughout the report, in the following order: gender, age, province/territory, and groups disproportionately affected by dementia. Groups disproportionately affected by dementia are defined as those who report caring for someone they know who is living with dementia and those in four ethnic groups with a higher-than-average risk of developing dementia: those of Hispanic, Southeast Asian or South Asian descent or Black Canadians, as well as Indigenous Peoples where the sample size is large enough to report.
Details of the methodology and sample characteristics can be found in Appendix A. The final survey instrument can be found in Appendix B.
The following table outlines the sample composition. Please note this is the unweighted sample. For the weighted and unweighted composition, please see Appendix A. The questions asked to obtain the sample characteristics are contained in the final survey instrument in Appendix B.
| Demographic | Sample Total |
|---|---|
| Age | n=5,056 |
| 18-24 | 5% |
| 25-34 | 14% |
| 35-44 | 17% |
| 45-54 | 17% |
| 55-64 | 22% |
| 65 plus | 25% |
| Gender | n=5,056 |
| Male | 53% |
| Female | 47% |
| Prefer to self-identify | <1% |
| Education | n=5,056 |
| High school diploma or equivalent | 15% |
| Registered Apprenticeship or other trades certificate or diploma | 6% |
| College, CEGEP or other non-university certificate or diploma | 21% |
| University certificate or diploma below bachelor's level | 7% |
| Bachelor's degree | 27% |
| Post graduate degree above bachelor's level | 23% |
| Prefer not to answer | 2% |
| Total household income | n=5,056 |
| Under $40,000 | 12% |
| Between $40,000 and $80,000 | 25% |
| $80,000 or above | 52% |
| Prefer not to answer | 12% |
| Language spoken at home | n=5,056 |
| English | 85% |
| French | 10% |
| English and French equally | 2% |
| Other | 3% |
| Region | n=5,056 |
| British Columbia | 14% |
| Alberta | 10% |
| Saskatchewan | 6% |
| Manitoba | 6% |
| Ontario | 23% |
| Quebec | 12% |
| New Brunswick | 6% |
| Nova Scotia | 7% |
| Prince Edward Island | 3% |
| Newfoundland and Labrador | 5% |
| Nunavut | 2% |
| Northwest Territories | 3% |
| Yukon | 3% |
| Minorities | n=5,056 |
| Indigenous (First Nations, Métis or Inuit) | 4% |
| Hispanic | 1% |
| Black | 4% |
| Other visible minority | 10% |
| None of the above | 77% |
| Don't know | <1% |
| Prefer not to answer | 4% |
| Key ethnic or cultural groups | n=6,415* |
| British | 45% |
| French | 16% |
| Other Western European | 14% |
| Eastern European | 9% |
| Scandinavian | 6% |
| South Asian | 5% |
| Southeast Asian | 5% |
| Indigenous (First Nations, Métis or Inuit) | 4% |
| Southern European | 4% |
| African | 3% |
| Latin American | 2% |
| American | 2% |
| Another ethnic group | 3% |
| None | 9% |
| Prefer not to answer | 2% |
| Sexual orientation | n=5,056 |
| Heterosexual | 89% |
| Bisexual | 3% |
| Gay | 2% |
| Lesbian | 1% |
| Other | 1% |
| Prefer not to answer | 5% |
*Based on multiple mentions – indicates the percentage of respondents who self-identified as belonging to that ethnic group, may exceed 100%
Consistent with findings from 2020, close to one in four surveyed Canadians (24%) report they work in a sector where they may need or may have needed to interact with people living with dementia, most often reporting working in the following sectors of interest: health care (14%), retail (9%), financial services (8%), and community and religious/faith organizations (5%). Also consistent with the benchmark survey, one in five (20%) report they have volunteered in a sector that may need or may have needed to interact with people living with dementia.
| Q49 – Do you (or did you) work in a sector where you may need (or may have needed) to interact with people living with dementia? | Total (n=5,056) |
|---|---|
| Yes | 24% |
| No | 72% |
| Don't know | 4% |
| Q51 – Do you (or did you) volunteer in a sector where you may need (or may have needed) to interact with people living with dementia? | Total (n=5,056) |
| Yes | 20% |
| No | 77% |
| Don't know | 3% |
Base: All respondents, n=5,056.
Gender
Age
Province/territories
Populations disproportionately affected by dementia
Education
Sexual orientation
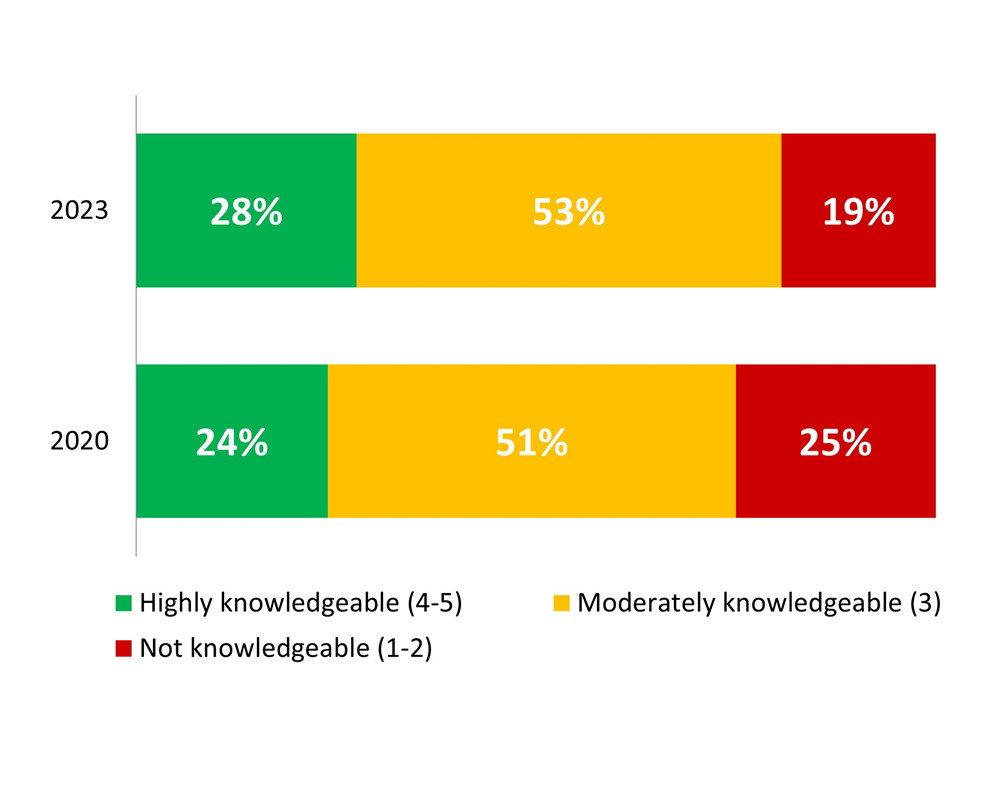
Around three in ten Canadians consider themselves highly knowledgeable about dementia (28%).
Q2 - How knowledgeable would you say you are about dementia?
| Highly knowledgeable (4-5) | Moderately knowledgeable (3) | Not knowledgeable (1-2) | |
|---|---|---|---|
| 2023 | 28% | 53% | 19% |
| 2020 | 24% | 51% | 25% |
Base: All respondents, n=5,056
Gender
Age
Province/territories
Populations disproportionately affected by dementia
Education
Sexual orientation
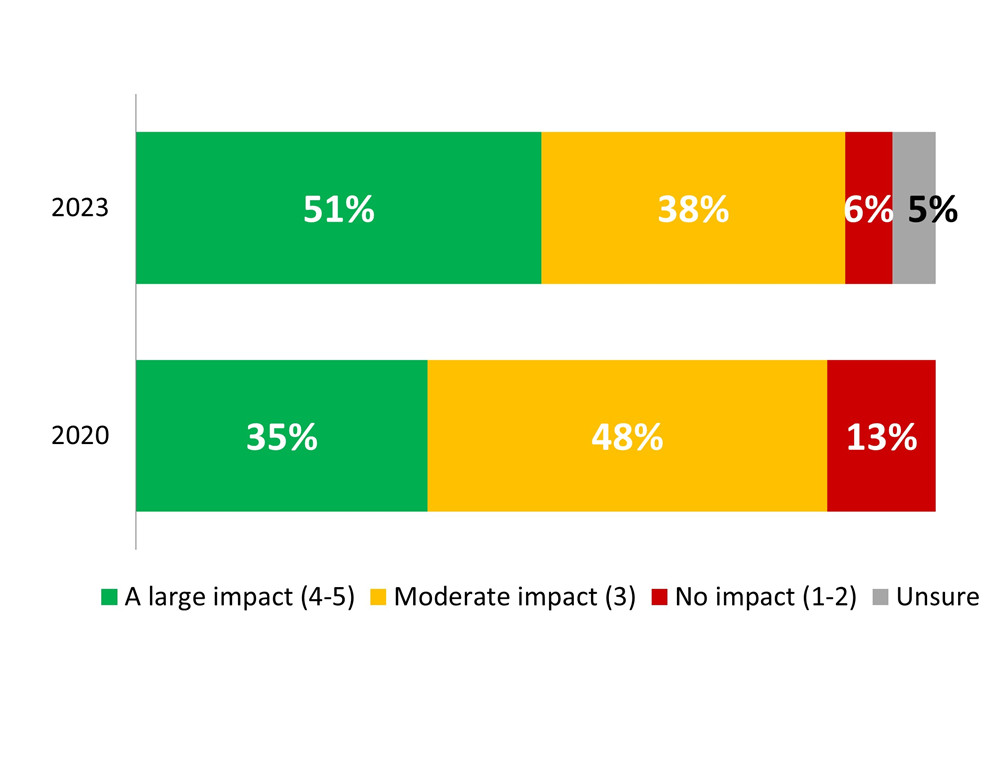
A majority of Canadians believe dementia is having a moderate (38%) to large impact (51%) in Canada today, with a notable increase in those who say the impact is large compared to the 2020 benchmark survey (35% said large impact in 2020).
Q3 - Overall, how much of an impact do you think dementia is having in Canada today?
| A large impact (4-5) | Moderate impact (3) | No impact (1-2) | Unsure | |
|---|---|---|---|---|
| 2023 | 51% | 38% | 6% | 5% |
| 2020 | 35% | 48% | 13% | 0% |
Base: All respondents, n=5,056.
Gender
Age
Province/territories
Populations disproportionately affected by dementia
Education
Sexual orientation
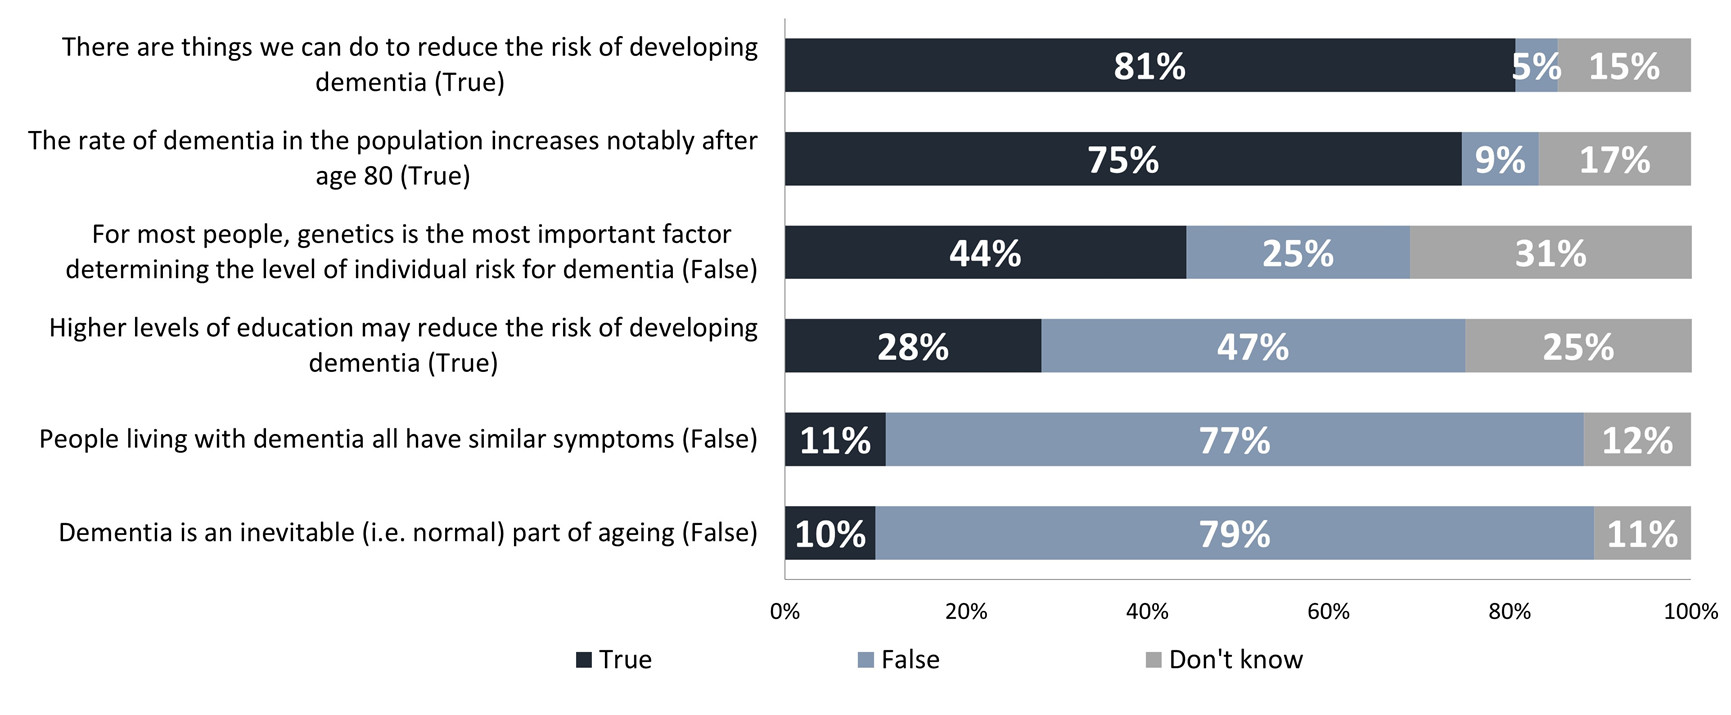
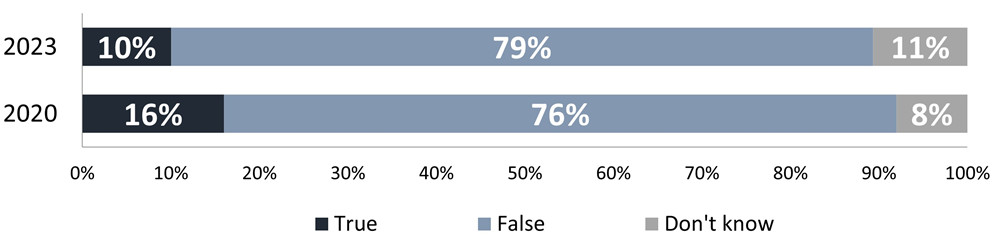
Despite many Canadians not considering themselves to be highly knowledgeable about dementia, most are able to correctly identify whether a series of statements about dementia are true or false. A majority correctly note that it is true that there are things we can do to reduce the risk of dementia (81%, a 9% increase from 74% in 2020) and that the rate of dementia in the population increases notably after age 80 (75%), while a majority correctly identify it is false that that dementia is an inevitable (i.e., normal) part of aging (79%) and that people living with dementia all have similar symptoms (77%).
However, only one in four (25%) correctly identified that it is false that genetics is the most important factor determining the level of individual risk for dementia, while only 28% correctly identified that higher levels of education may reduce the risk of developing dementia is true.
Q4-9 – To the best of your knowledge, please indicate if each of the following are true or false:
| True | False | Don't know | |
|---|---|---|---|
| Dementia is an inevitable (i.e. normal) part of ageing (False) | 10% | 79% | 11% |
| People living with dementia all have similar symptoms (False) | 11% | 77% | 12% |
| Higher levels of education may reduce the risk of developing dementia (True) | 28% | 47% | 25% |
| For most people, genetics is the most important factor determining the level of individual risk for dementia (False) | 44% | 25% | 31% |
| The rate of dementia in the population increases notably after age 80 (True) | 75% | 9% | 17% |
| There are things we can do to reduce the risk of developing dementia (True) | 81% | 5% | 15% |
Base: All respondents, n=5,056
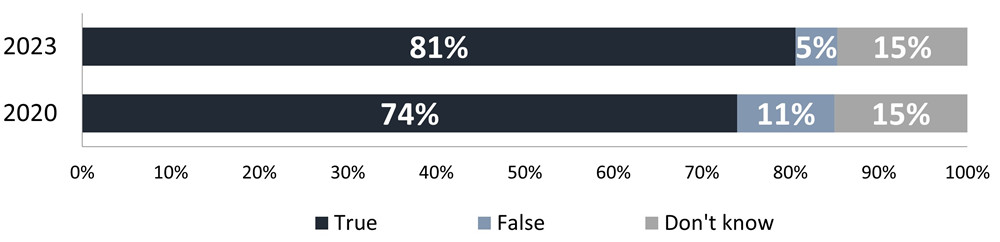
Q4 – To the best of your knowledge, please indicate if each of the following are true or false: There are things we can do to reduce the risk of developing dementia [TRUE]
| True | False | Don't know | |
|---|---|---|---|
| 2020 | 74% | 11% | 15% |
| 2023 | 81% | 5% | 15% |
Base: All respondents, n=5,056.
Q9 – To the best of your knowledge, please indicate if each of the following are true or false: Dementia is an inevitable (i.e., normal) part of aging [FALSE]
| True | False | Don't know | |
|---|---|---|---|
| 2020 | 16% | 76% | 8% |
| 2023 | 10% | 79% | 11% |
Base: All respondents, n=5,056.
Gender
Age
Province/territories
Populations disproportionately affected by dementia
Education
Sexual orientation
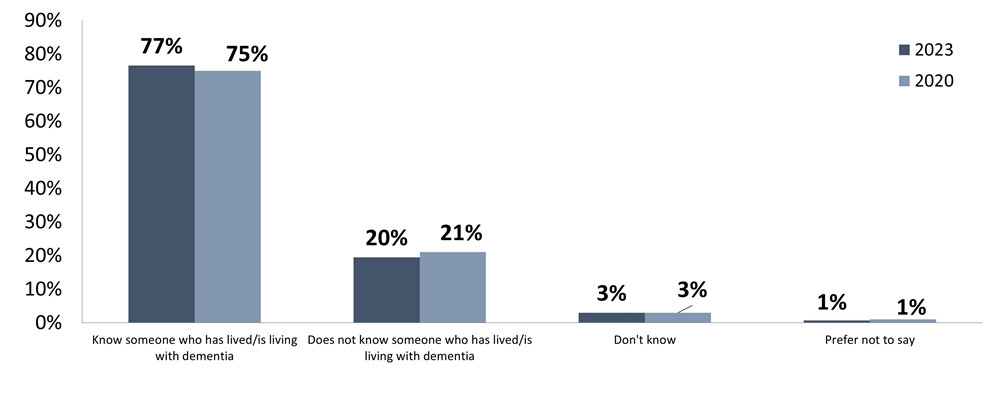
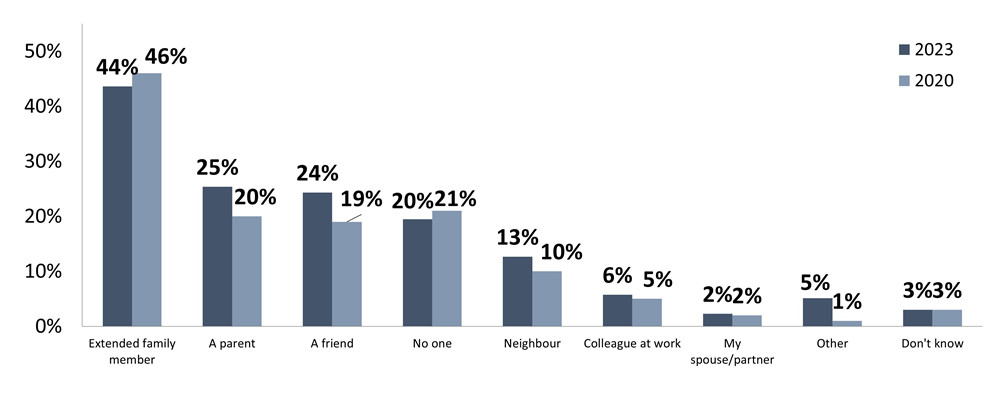
More than three in four Canadians report knowing someone that is living or has lived with dementia (77%), most commonly an extended family member (44%), a parent (25%) or a friend (24%). One in five (20%) report they do not know anyone who lives or has lived with dementia and 3% are unsure.
Q10 – Who do you know (if anyone) that is living/has lived with dementia? Select all that apply:
| 2023 | 2020 | |
|---|---|---|
| Know someone who has lived/is living with dementia | 77% | 75% |
| Does not know someone who has lived/is living with dementia | 20% | 21% |
| Don't know | 3% | 3% |
| Prefer not to say | 1% | 1% |
| 2023 | 2020 | |
|---|---|---|
| Extended family member | 44% | 46% |
| A parent | 25% | 20% |
| A friend | 24% | 19% |
| No one | 19% | 21% |
| Neighbour | 13% | 10% |
| Colleague at work | 6% | 5% |
| My spouse/partner | 2% | 2% |
| Other | 5% | 1% |
| Don't know | 3% | 3% |
Base: All respondents, n=5,056, based on multiple mentions
Gender
Age
Province/territories
Populations disproportionately affected by dementia
Education
Sexual orientation
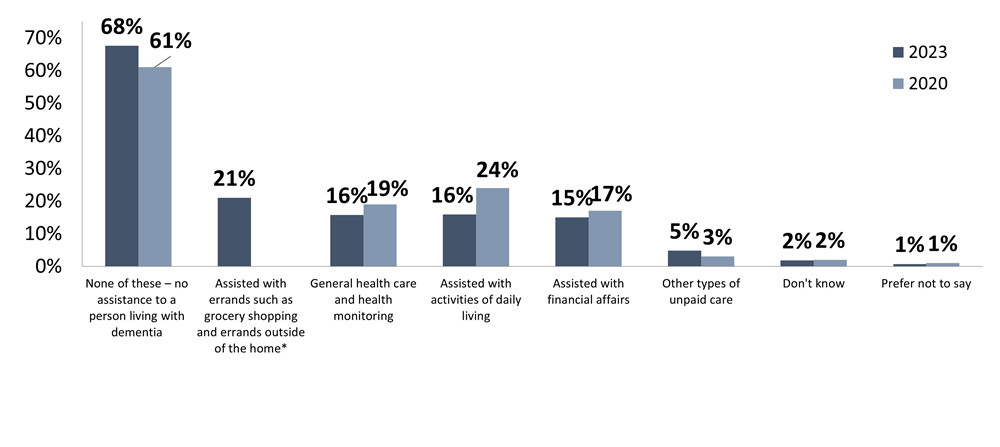
Nearly one in three Canadians (32%) say they have provided some form of unpaid care to someone living with dementia in the last five years, reporting they have assisted with errands such as grocery shopping (21%)*, general health care and health monitoring (16%), with activities of daily living (16%, 24% in 2020) and with financial affairs (15%) and 5% reported having provided other types of unpaid care.
*Note: This response option was not provided in 2020.
Q11 – An unpaid caregiver may do a range of things to care for someone living with dementia (an unpaid caregiver is defined as a person who provides or has provided care and support to a person living with dementia). Have you done any of the following in the last five years for a person living with dementia, without getting paid?
| 2023 | 2020 | |
|---|---|---|
| None of these – no assistance to a person living with dementia | 68% | 61% |
| Assisted with errands such as grocery shopping and errands outside of the home* | 21% | 0% |
| General health care and health monitoring | 16% | 19% |
| Assisted with activities of daily living | 16% | 24% |
| Assisted with financial affairs | 15% | 17% |
| Other types of unpaid care | 5% | 3% |
| Don't know | 2% | 2% |
| Prefer not to say | 1% | 1% |
Base: All respondents, n=5,056, based on multiple mentions.
Gender
Age
Province/territories
Populations disproportionately affected by dementia
Education
Sexual orientation
For Canadians who reported having provided unpaid care and support to a person living with dementia, around three in four (72%) say they have experienced some issues or difficulties while they were with the person living with dementia to whom they provide care.
Over one in two say they have had people talk to them rather than the person living with dementia (51%), while two in five say they have encountered people who focused on the things the person living with dementia can no longer do instead of the things they can (45%). Around one in five each say they have had trouble accessing appropriate housing for the person living with dementia (20%), have been unable to go where they needed or wanted due to accessibility issues (17%) or have had difficulty navigating a public space such as a grocery store, bus or train (17%).
Q12 – In the last five years, have you experienced any of the following while you were with the person living with dementia to whom you provide care.
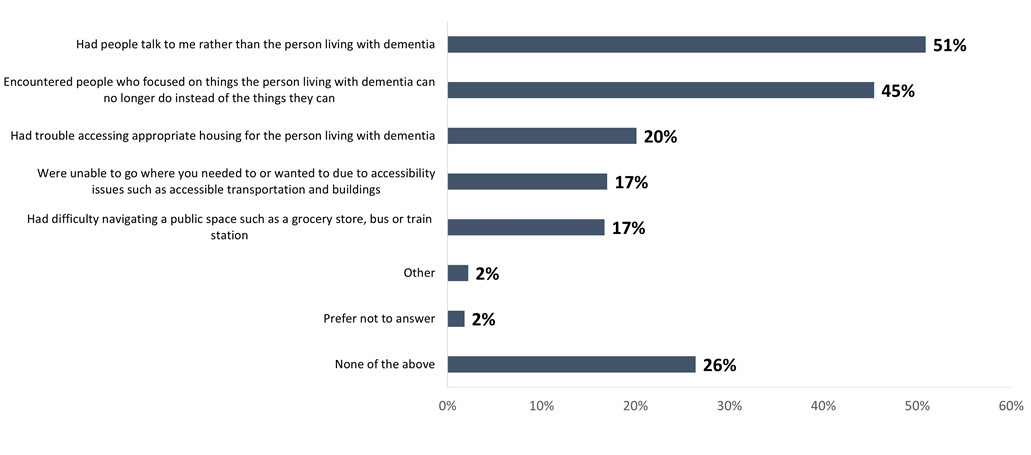
| Series 1 | |
|---|---|
| Had people talk to me rather than the person living with dementia | 51% |
| Encountered people who focused on things the person living with dementia can no longer do instead of the things they can | 45% |
| Had trouble accessing appropriate housing for the person living with dementia | 20% |
| Were unable to go where you needed to or wanted to due to accessibility issues such as accessible transportation and buildings | 17% |
| Had difficulty navigating a public space such as a grocery store, bus or train station | 17% |
| Other | 2% |
| Prefer not to answer | 2% |
| None of the above | 26% |
Base: Respondents who reported providing unpaid care to people living with dementia, n=1,603.
Gender
Age
Province/territories
Populations disproportionately affected by dementia
Education
Sexual orientation
Around two in five Canadians (37%) among those who report they are providing or provided unpaid care and support for someone living with dementia say they have experienced at least one challenge when accessing or using dementia recommendations or advice related to the care they are providing. Close to one in ten each say the advice does not consider the cultural context for those to whom they provide care (12%), the advice is too expensive to obtain (11%), the advice is too complicated to understand or communicate (11%). Less than one in ten each say they do not trust the source of the advice (7%) or the advice is not in the right language (5%).
Close to one in two (46%) report they have not encountered any challenges or barriers when accessing or using dementia recommendations and advice.
Q13 – Which of the following challenges, if any, have you encountered when accessing or using dementia recommendations and advice related to the care you are providing?
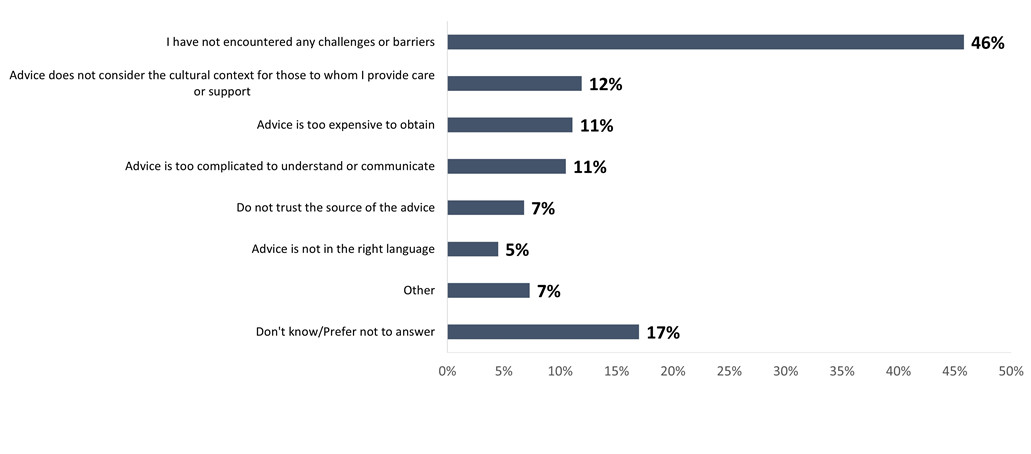
| Series 1 | |
|---|---|
| I have not encountered any challenges or barriers | 46% |
| Advice does not consider the cultural context for those to whom I provide care or support | 12% |
| Advice is too expensive to obtain | 11% |
| Advice is too complicated to understand or communicate | 11% |
| Do not trust the source of the advice | 7% |
| Advice is not in the right language | 5% |
| Other | 7% |
| Don't know/Prefer not to answer | 17% |
Base: Respondents who reported providing unpaid care to people living with dementia, n=1, 604.
Gender
Age
Province/territories
Populations disproportionately affected by dementia
Education
Sexual orientation
About seven in ten Canadians strongly disagree/disagree (71%) that people should generally retire at 65 because their ability to perform at a high-level declines.
Close to one in two Canadians neither agree nor disagree that older people are more able to contribute to solving today's challenges than younger people (45%), while around one in four each strongly disagree/disagree (27%) and strongly agree/ agree (24%).
Canadians are somewhat more likely to strongly agree/agree (48%) that older people are less likely to be informed of the latest developments (technology, news, etc.) than to strongly disagree / disagree (36%).
Q14-16 – To what extent do you agree or disagree with the following statements?
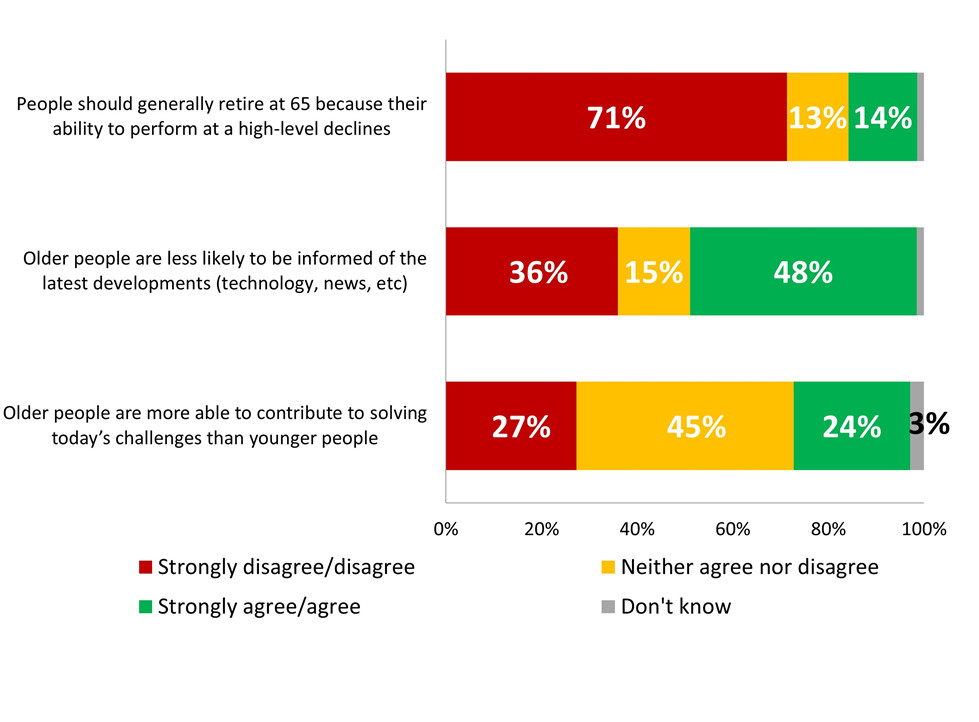
| Strongly disagree/disagree | Neither agree nor disagree | Strongly agree/agree | Don't know | |
|---|---|---|---|---|
| Older people are more able to contribute to solving today's challenges than younger people | 27% | 45% | 24% | 3% |
| Older people are less likely to be informed of the latest developments (technology, news, etc) | 36% | 15% | 47% | 1% |
| People should generally retire at 65 because their ability to perform at a high-level declines | 71% | 13% | 14% | 1% |
Base: All respondents, n=5,056
Gender
Age
Province/territories
Populations disproportionately affected by dementia
Education
Sexual orientation
An increasing proportion of Canadians report they have taken steps in the last 12 months to specifically reduce their own risk for developing dementia (34%, a 55% increase from 22% in 2020), while 54% report they have not (70% in 2020).
Q17 - In the last 12 months, have you taken any steps to specifically reduce your own risk for developing dementia?
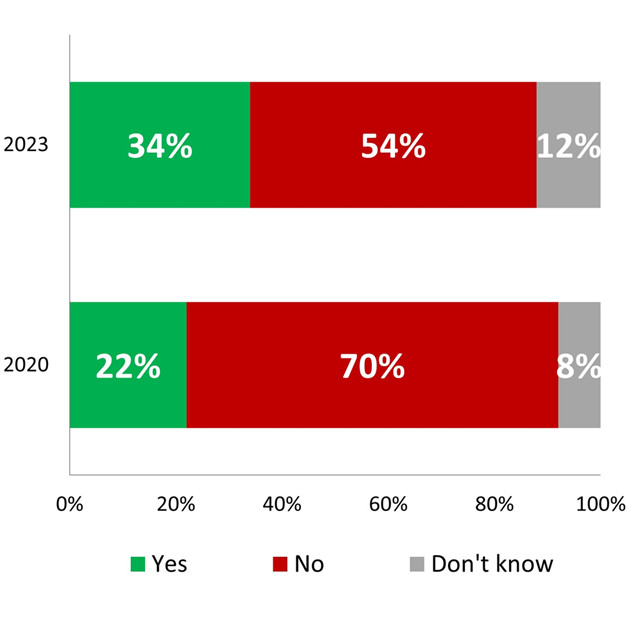
| Yes | No | Don't know | |
|---|---|---|---|
| 2020 | 22% | 70% | 8% |
| 2023 | 34% | 54% | 12% |
Base: All respondents, n=5,056
Q18 – [IF YES] What steps did you take/are you taking?
Base: All respondents, n=1,844, based on multiple mentions.
Gender
Age
Province/territories
Populations disproportionately affected by dementia
Education
Sexual orientation
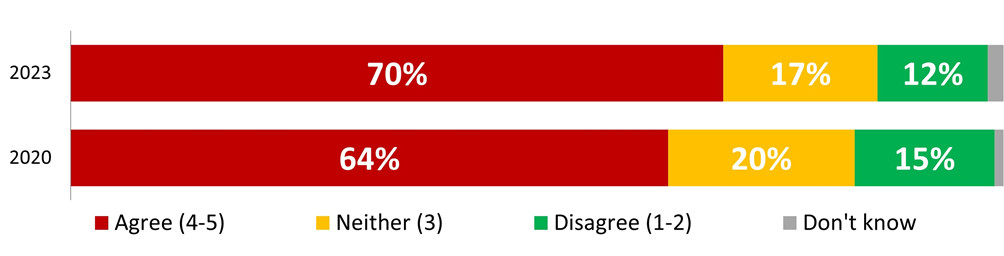
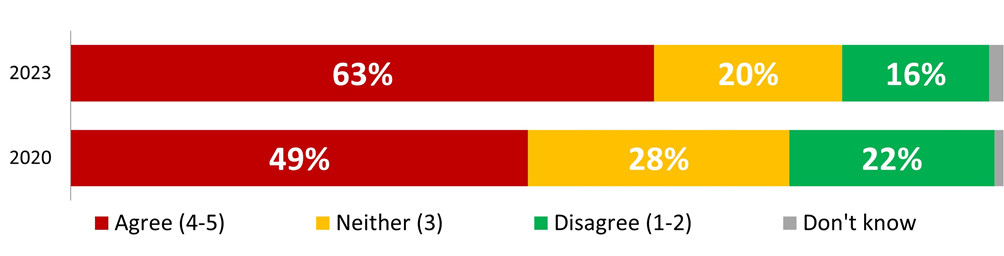
Canadians are more likely to worry about the possibility of someone close to them developing dementia (70% strongly agree/ agree they worry about this) than the possibility of personally developing dementia (63% strongly agree/ agree). An increase can be noted for concern related to personally developing dementia compared to 2020, with 63% who agree they are worried about this compared to 49% in 2020. Worry about the possibility of someone close to them developing dementia has also increased, from 64% in 2020 to 70%.
Most Canadians are concerned about losing their sense of self, their independence or becoming a burden if they were living with dementia, with more than nine in ten Canadians who strongly agree/agree that they would worry about becoming less independent (93%) and would worry about becoming a burden to others (92%). Just under nine in ten (89%) agree that they would worry about losing their sense of self if they were living with dementia.
Q19-23 – To what extent do you agree or disagree with the following...?
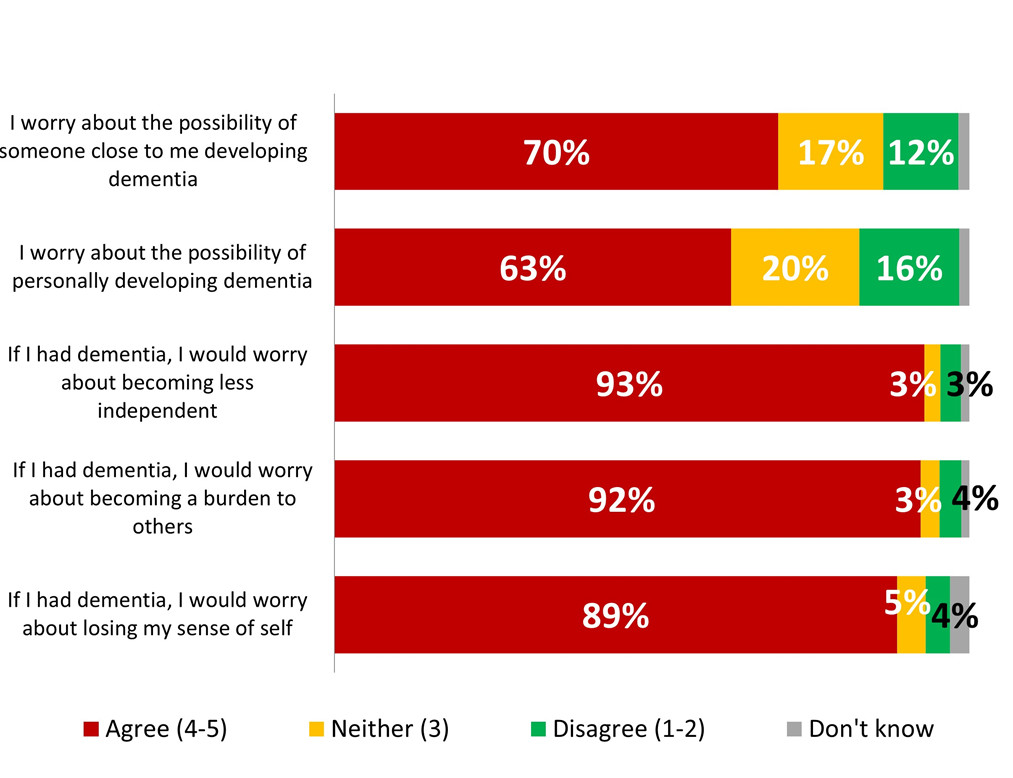
| Agree (4-5) | Neither (3) | Disagree (1-2) | Don't know | |
|---|---|---|---|---|
| I worry about the possibility of someone close to me developing dementia | 70% | 17% | 12% | 2% |
| I worry about the possibility of personally developing dementia | 63% | 20% | 16% | 2% |
| If I had dementia, I would worry about becoming less independent | 93% | 3% | 3% | 1% |
| If I had dementia, I would worry about becoming a burden to others | 92% | 3% | 3% | 1% |
| If I had dementia, I would worry about losing my sense of self | 89% | 5% | 4% | 3% |
Base: All respondents, n=5,056.
Q20 – To what extent do you agree or disagree with the following...? I worry about the possibility of someone close to me developing dementia
| Agree (4-5) | Neither (3) | Disagree (1-2) | Don't know | |
|---|---|---|---|---|
| 2023 | 70% | 17% | 12% | 2% |
| 2020 | 64% | 20% | 15% | 1% |
Base: All respondents, n=5,056.
Q19 – To what extent do you agree or disagree with the following...? I worry about the possibility of personally developing dementia
| Agree (4-5) | Neither (3) | Disagree (1-2) | Don't know | |
|---|---|---|---|---|
| 2023 | 63% | 20% | 16% | 2% |
| 2020 | 49% | 28% | 22% | 1% |
Base: All respondents, n=5,056.
Gender
Age
Province/territories
Populations disproportionately affected by dementia
Education
Sexual orientation
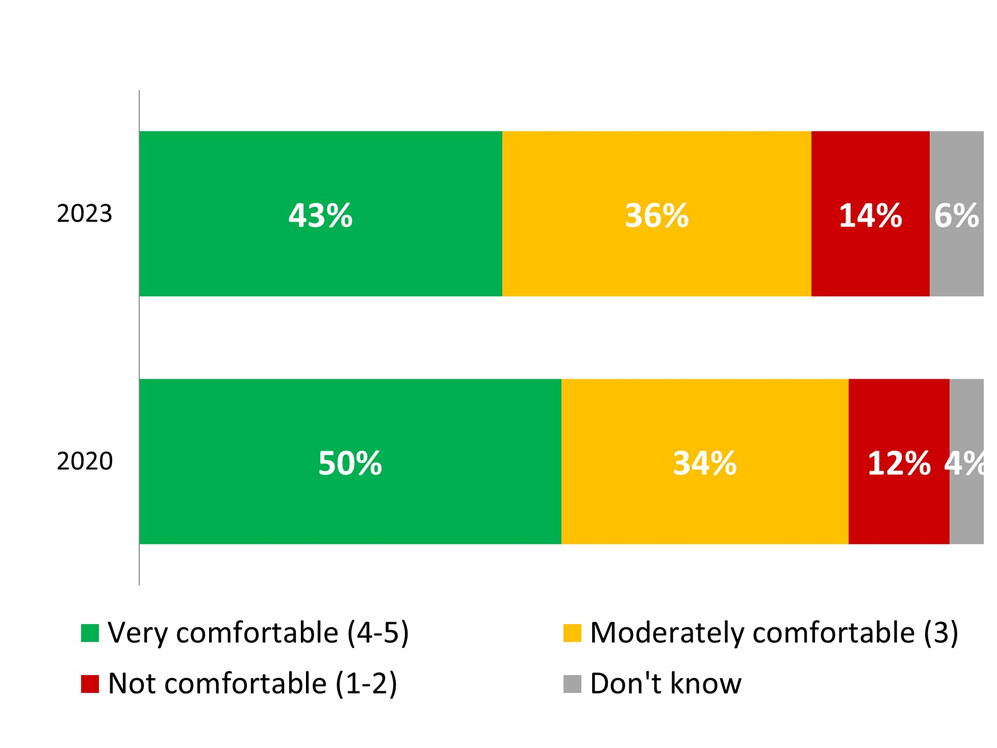
Eight in ten Canadians say they would feel at least moderately comfortable interacting with someone living with dementia (very comfortable (score of 4-5): 43%; moderately comfortable (score of 3): 37%), while 14% say they would not be comfortable (score of 1-2). The proportion of those who feel very comfortable has declined by 14% from one in two (50%) in 2020 to just over two in five (43%) in 2023.
Q24 – How comfortable would you feel interacting with someone living with dementia?
| Very comfortable (4-5) | Moderately comfortable (3) | Not comfortable (1-2) | Don't know | |
|---|---|---|---|---|
| 2023 | 43% | 36% | 14% | 6% |
| 2020 | 50% | 34% | 12% | 4% |
Base: All respondents, n=5,056.
Gender
Age
Province/territories
Populations disproportionately affected by dementia
Education
Sexual orientation
Q25 – Why would you feel comfortable interacting with someone living with dementia?
| Reason for feeling comfortable interacting with people living with dementia | Total (n=2,219) |
|---|---|
| Currently know or have known people with dementia | 35% |
| They are still people/everyone deserves to be cared for | 31% |
| Generally confident in dealing with most situations/patient | 24% |
| Have information on supporting people with dementia | 9% |
| Other | 2% |
| Don't know | <1% |
Base: Respondents who say they would feel comfortable interacting with someone living with dementia, n=2,219
Q26 – Why would you feel uncomfortable interacting with someone living with dementia?
| Reason for feeling uncomfortable interacting with people living with dementia | Total (n=627) |
|---|---|
| Not sure how to talk to or support/help the person | 22% |
| Worried about or unsure of how the person will behave/react | 17% |
| Don't have enough information about dementia | 15% |
| It makes me uncomfortable/I don't have the patience | 14% |
| Too sad/too difficult emotionally | 13% |
| Feeling a lack of competence | 12% |
| I have never known anyone with dementia | 2% |
| Other | 4% |
| Don't know | 1% |
| Prefer not to answer | 1% |
Base: Respondents who say they would feel uncomfortable interacting with someone living with dementia, n=627
A majority of Canadians agree that people living with dementia are sometimes able to continue to do a variety of things after diagnosis, specifically continuing to be active in their communities (72%), continuing to live in their own home (70%) and continuing to do activities they enjoy (69%). Canadians are less likely to agree that people living with dementia are sometimes able to continue working for years after the onset of symptoms (41%), which is a decrease of 6 percentage points from the 2020 findings (47%).
Despite these positive perceptions, two in three Canadians agree (65%) that people living with dementia generally face a lower quality of life than people without dementia, although this has declined since the benchmark 2020 survey (70%). Negative perceptions towards older people can be observed to impact views related to dementia stigma. Canadians who strongly agree that people should generally retire at 65 because their ability to perform at a high-level declines were more likely to strongly agree that people living with dementia face a lower quality of life (31%) compared to those who strongly disagree that people should retire at 65.
As well, those who strongly agree people should retire at 65 are more likely to strongly disagree/disagree that people living with dementia are sometimes able to work for years (35% vs 18% of those who strongly disagree about the retirement age) and less likely to strongly agree/agree (52%) that people living with dementia can often continue activities they enjoy (78% of those who disagree about people needing to retire at 65).
As well, those who strongly agree that older people are less likely to be informed of the latest developments are more likely to strongly agree or agree that people living with dementia face lower quality of life (79%) than those who strongly disagree that older people are less informed (58%).
Q27-31 – To what extent do you agree or disagree with the following...?
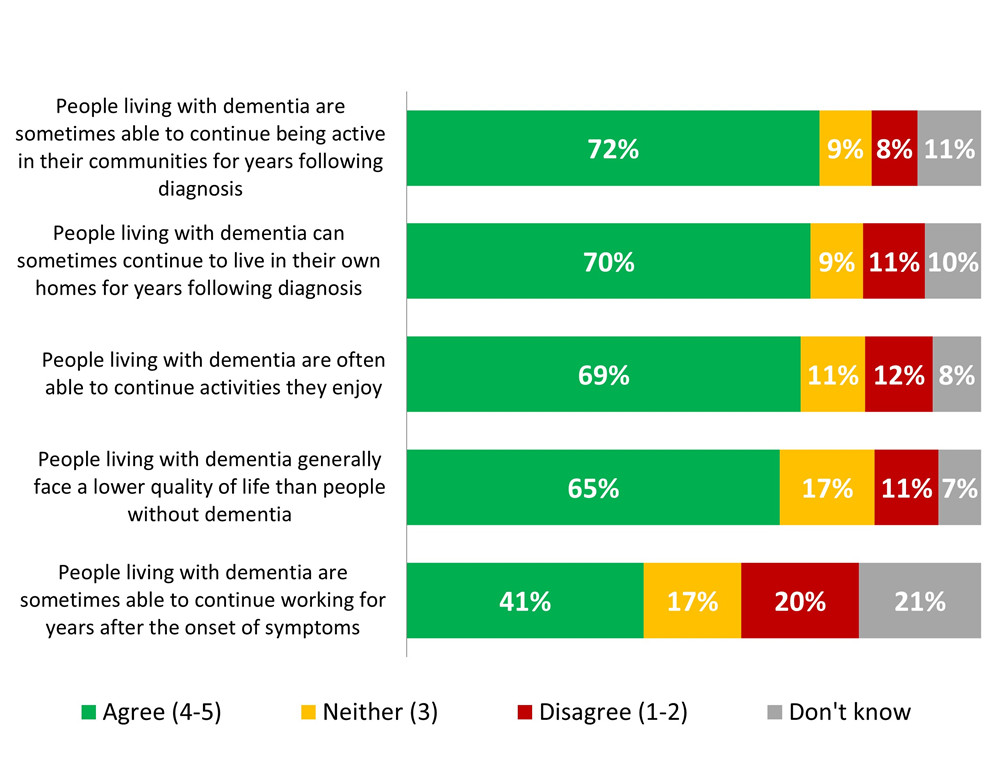
| Agree (4-5) | Neither (3) | Disagree (1-2) | Don't know | |
|---|---|---|---|---|
| People living with dementia are sometimes able to continue being active in their communities for years following diagnosis | 72% | 9% | 8% | 11% |
| People living with dementia can sometimes continue to live in their own homes for years following diagnosis | 70% | 9% | 11% | 10% |
| People living with dementia are often able to continue activities they enjoy | 69% | 11% | 12% | 8% |
| People living with dementia generally face a lower quality of life than people without dementia | 65% | 17% | 11% | 7% |
| People living with dementia are sometimes able to continue working for years after the onset of symptoms | 41% | 17% | 20% | 21% |
Base: All respondents, n=5,056.
Q28 – To what extent do you agree or disagree with the following...? People living with dementia are sometimes able to continue working for years after the onset of symptoms
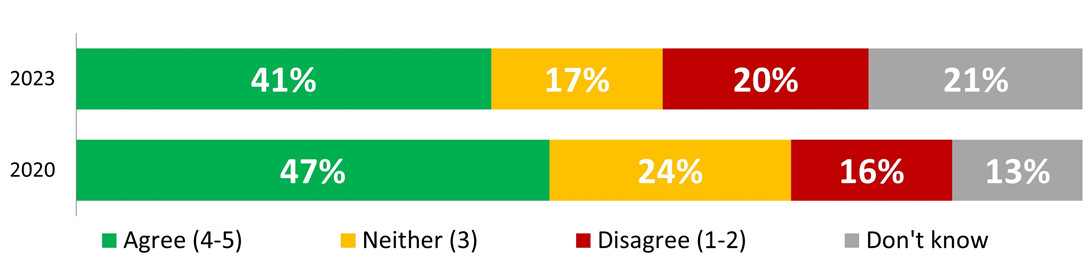
| Agree (4-5) | Neither (3) | Disagree (1-2) | Don't know | |
|---|---|---|---|---|
| 2023 | 41% | 17% | 20% | 21% |
| 2020 | 47% | 24% | 16% | 13% |
Base: All respondents, n=5,056.
Q27 – To what extent do you agree or disagree with the following...? People living with dementia generally face a lower quality of life than people without dementia
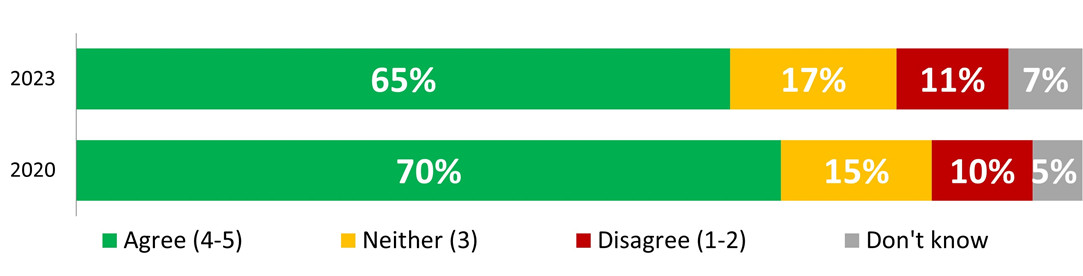
| Agree (4-5) | Neither (3) | Disagree (1-2) | Don't know | |
|---|---|---|---|---|
| 2023 | 65% | 17% | 11% | 7% |
| 2020 | 70% | 15% | 10% | 5% |
Base: All respondents, n=5,056
Gender
Age
Province/territories
Populations disproportionately affected by dementia
Education
Sexual orientation
Almost 7 in 10 Canadians say they would be comfortable asking a health care provider for information about dementia symptoms leading to an assessment and diagnosis (68%).
Among Canadians who say they would not be comfortable doing this (7%), they most often say it is because they are afraid of facing what lies ahead (75%), a fear of others treating them differently (56%), a lack of trust that the health care system will provide proper care (47%; 3% in 2020*) and a fear of alarming those close to them (46%; 51% in 2020). Close to one in three say they are uncomfortable because of a fear of their employer finding out and having to stop working (31%; a decrease from 45% in 2020) or that there is no point in knowing if nothing can be done to change the progression (21%; decreased from 34% in 2020).
When it comes to sharing a dementia diagnosis, Canadians are more likely to say they would be comfortable telling a close family member (57%; 64% in 2020) or friends (40%; 49% in 2020) about the diagnosis than neighbours or others in the community (24%; 31% in 2020) or an employer (20%; 31% in 2020). Comfort has declined across the board compared to the 2020 benchmark survey, with the biggest decrease being in comfort telling an employer about a diagnosis which declined by 11 percentage points (from 31% in 2020 to 20% in 2023)
*Of note, having a lack of trust in the health care system was not prompted on in the 2020 benchmark survey, but was mentioned verbatim by respondents. It was included as a prompted response option in this survey.
Q32-36 – How comfortable would you be with each of the following...?
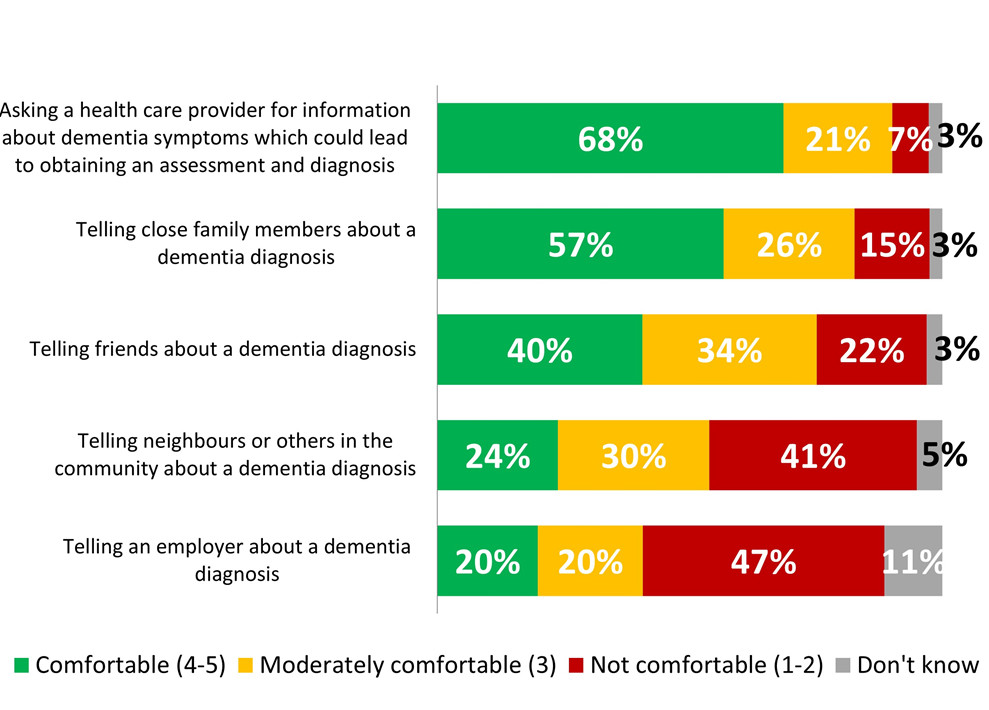
| Comfortable (4-5) | Moderately comfortable (3) | Not comfortable (1-2) | Don't know | |
|---|---|---|---|---|
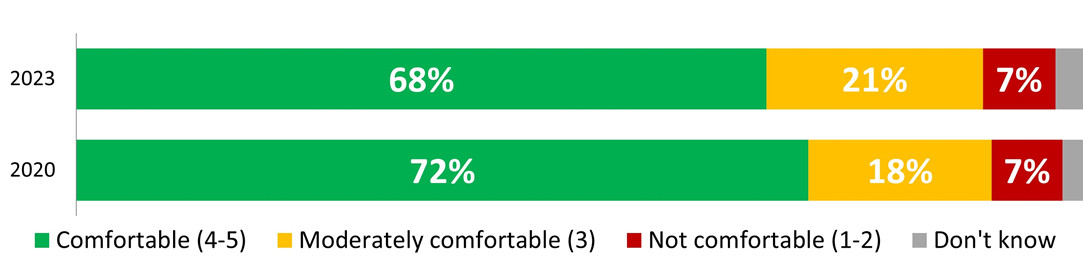
| Asking a health care provider for information about dementia symptoms which could lead to obtaining an assessment and diagnosis | 68% | 21% | 7% | 3% |
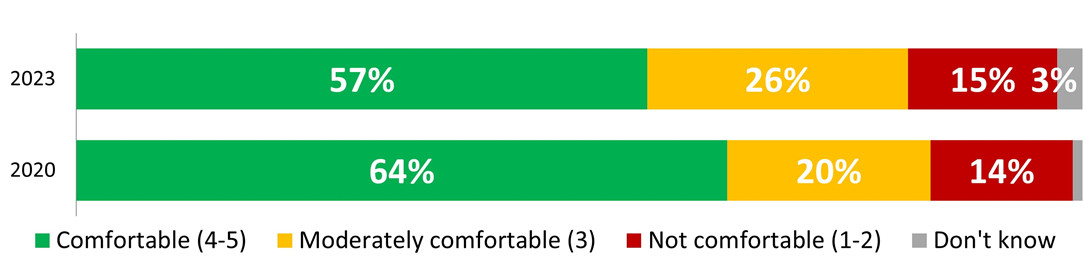
| Telling close family members about a dementia diagnosis | 57% | 26% | 15% | 3% |
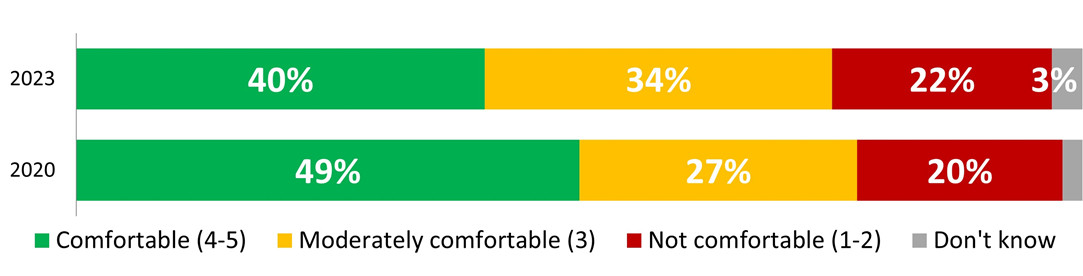
| Telling friends about a dementia diagnosis | 40% | 34% | 22% | 3% |
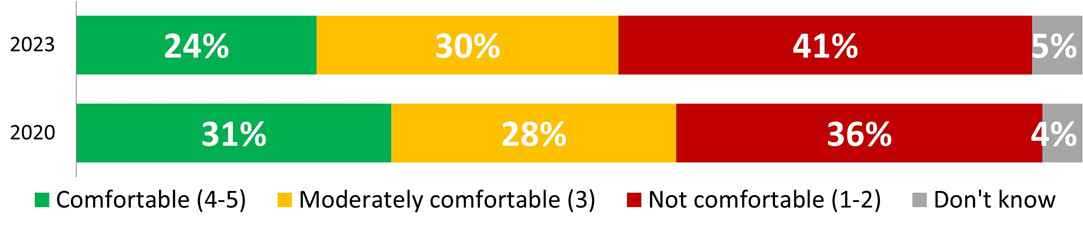
| Telling neighbours or others in the community about a dementia diagnosis | 24% | 30% | 41% | 5% |
| Telling an employer about a dementia diagnosis | 20% | 20% | 47% | 11% |
Base: All respondents, n=5,056
Q32 – How comfortable would you be with each of the following...? Asking a health care provider for information about dementia symptoms which could lead to obtaining an assessment and diagnosis
| Comfortable (4-5) | Moderately comfortable (3) | Not comfortable (1-2) | Don't know | |
|---|---|---|---|---|
| 2023 | 68% | 21% | 7% | 3% |
| 2020 | 72% | 18% | 7% | 2% |
Base: All respondents, n=5,056
Q34 – How comfortable would you be with each of the following...? Telling close family members about a dementia diagnosis
| Comfortable (4-5) | Moderately comfortable (3) | Not comfortable (1-2) | Don't know | |
|---|---|---|---|---|
| 2023 | 57% | 26% | 15% | 3% |
| 2020 | 64% | 20% | 14% | 1% |
Base: All respondents, n=5,056.
Q35 – How comfortable would you be with each of the following...? Telling friends about a dementia diagnosis
| Comfortable (4-5) | Moderately comfortable (3) | Not comfortable (1-2) | Don't know | |
|---|---|---|---|---|
| 2023 | 40% | 34% | 22% | 3% |
| 2020 | 49% | 27% | 20% | 2% |
Base: All respondents, n=5,056.
Q36 – How comfortable would you be with each of the following...? Telling neighbours or others in the community about a dementia diagnosis
Comfortable (4-5) |
Moderately comfortable (3) |
Not comfortable (1-2) |
Don't know |
|
2023 |
24% |
30% |
41% |
5% |
2020 |
31% |
28% |
36% |
4% |
Base: All respondents, n=5,056.
Q33 – How comfortable would you be with each of the following...? Telling an employer about a dementia diagnosis
| Comfortable (4-5) | Moderately comfortable (3) | Not comfortable (1-2) | Don't know | |
|---|---|---|---|---|
| 2023 | 20% | 20% | 47% | 11% |
| 2020 | 31% | 23% | 35% | 9% |
Base: All respondents, n=5,056.
Gender
Age
Province/territories
Populations disproportionately affected by dementia
Education
Sexual orientation
Q37 – Why would you be uncomfortable speaking to a health care provider about an assessment that could lead to a diagnosis of dementia?
2023 |
2020 |
|
|---|---|---|
Fear of facing what lies ahead |
75% |
76% |
Fear of others treating you differently |
56% |
59% |
Lack of trust that health care system will provide proper care (lack of qualified/adequate health care providers)* |
47% |
3% |
Fear of alarming people close to you |
46% |
51% |
Fear of your employer finding out / having to stop working |
31% |
45% |
There is no point in knowing if nothing can be done to change the progression of the condition |
21% |
34% |
Other |
1% |
2% |
Don't know |
1% |
3% |
Prefer not to answer |
1% |
Base: Respondents who are not comfortable speaking to a health care provider about dementia symptoms, n=363.
*Of note, having a lack of trust in the health care system was not prompted on in the 2020 benchmark survey, but was mentioned verbatim by respondents. It was included as a prompted response option in this survey.
Gender
Age
Province/territories
Populations disproportionately affected by dementia
Education
Sexual orientation
Canadians are nearly twice as likely to strongly disagree/disagree (33%) rather than strongly agree/agree (18%) that dementia is portrayed accurately in popular culture, such as in newspapers, film, television, and social media. More than one in four (28%) neither agree nor disagree with this and 21% are unsure.
Among those who disagree that dementia is portrayed accurately, close to three in five say it is portrayed more negatively than it really is (60%), while 17% think it is portrayed more positively, 8% think it is portrayed in some other way, such as in a way that is not accurate or realistic (2%) or not portrayed at all or rarely shown (2%). Fifteen per cent say they are unsure.
Q38 – Do you agree or disagree that dementia is portrayed accurately in popular culture (e.g., newspapers, film & television, social media, etc.)?
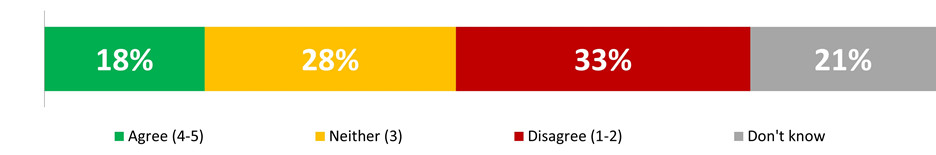
| Agree (4-5) | Neither (3) | Disagree (1-2) | Don't know |
|---|---|---|---|
| 18% | 28% | 33% | 21% |
Base: All respondents, n=5,056
Gender
Age
Province/territories
Populations disproportionately affected by dementia
Education
Sexual orientation
Q39 – Do you think that dementia is portrayed…
| Type of inaccurate dementia portrayal | Total (n=1693) |
|---|---|
| More negatively than it really is | 60% |
| More positively than it really is | 17% |
| Just not accurate/unrealistic/simplistic | 2% |
| Not portrayed at all/rarely shown | 2% |
| Exaggerated/over the top | 1% |
| Both positive and negative | 1% |
| Depends on the stage/varies | 1% |
| Dementia has so many different symptoms/impacts everyone differently | 1% |
| Portrayed as a joke | <1% |
| Other | 1% |
| Don't know | 15% |
Base: Respondents who strongly disagree/disagree that dementia is portrayed accurately in popular culture, n=1,639.
Gender
Age
Province/territories
Populations disproportionately affected by dementia
Education
Sexual orientation
Most Canadians agree that people have negative assumptions about the abilities of people living with dementia (83%; an increase of 22% from the 2020 benchmark survey), that people living with dementia are usually perceived as needing others to make most of their decisions (80%) and that people living with dementia are usually viewed as needing supervision in case of dangerous behaviour (80%).
Approximately six in ten agree (59%) that people living with dementia usually are viewed as needing around the clock assistance with daily living. Agreement is much lower in terms of perceptions of people living with dementia as being able to communicate their ideas and wishes to others (24%) and of people in their community being knowledgeable, respectful, and supportive of people living with dementia (27%).
Q40-45 – To what extent do you agree with the following statements about people living with dementia?
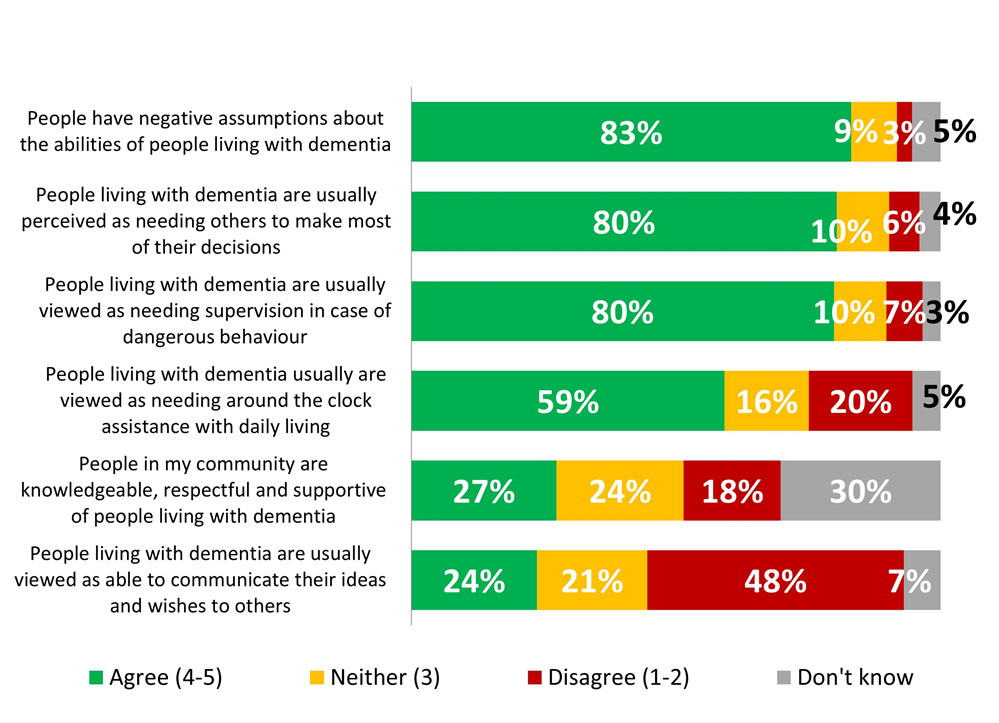
| Agree (4-5) | Neither (3) | Disagree (1-2) | Don't know | |
|---|---|---|---|---|
| People have negative assumptions about the abilities of people living with dementia | 83% | 9% | 3% | 5% |
| People living with dementia are usually perceived as needing others to make most of their decisions | 80% | 10% | 6% | 4% |
| People living with dementia are usually viewed as needing supervision in case of dangerous behaviour | 80% | 10% | 7% | 3% |
| People living with dementia usually are viewed as needing around the clock assistance with daily living | 59% | 16% | 20% | 5% |
| People in my community are knowledgeable, respectful and supportive of people living with dementia | 27% | 24% | 18% | 30% |
| People living with dementia are usually viewed as able to communicate their ideas and wishes to others | 24% | 21% | 48% | 7% |
Base: All respondents, n=5,056
Gender
Age
Province/territories
Populations disproportionately affected by dementia
Education
Sexual orientation
Q41 – To what extent do you agree with the following statements about people living with dementia?
People have negative assumptions about the abilities of people living with dementia
| Agree (4-5) | Neither (3) | Disagree (1-2) | Don't know | |
|---|---|---|---|---|
| 2023 | 83% | 9% | 3% | 5% |
| 2020 | 68% | 18% | 7% | 7% |
Base: All respondents, n=5,056.
Canadians are 10 times more likely to describe the quality of life of people living with dementia as poor (43%) rather than excellent (4%), while 41% describe it as moderate and 12% are unsure.
Q46 – Generally speaking, on a scale of 1 to 5, where one is excellent and five is very poor, how would you describe the quality of life of people living with dementia?
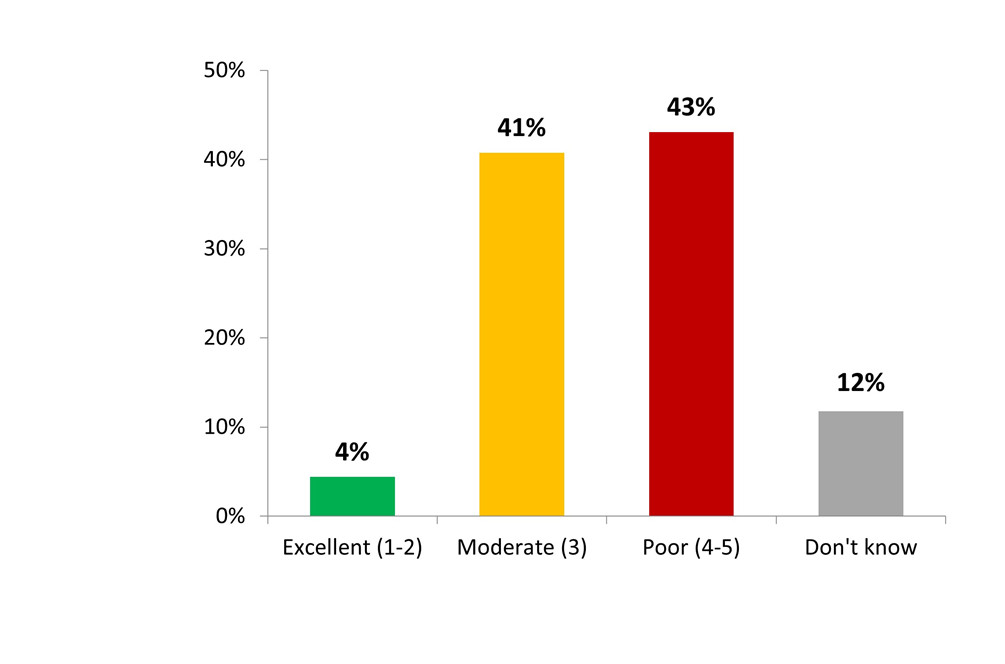
| Excellent (1-2) | 4% |
|---|---|
| Moderate (3) | 41% |
| Poor (4-5) | 43% |
| Don't know | 12% |
Base: All respondents, n=5,056.
Gender
Age
Province/territories
Populations disproportionately affected by dementia
Education
Sexual orientation
Three in five Canadians say their views towards dementia have not changed in the past five years (59%) while more than one in three say their views have changed and are either more negative now (10%) or more positive now (26%) and six per cent are unsure.
Q47 - Which of the following statements best describes how your views towards dementia have changed in the past five years?
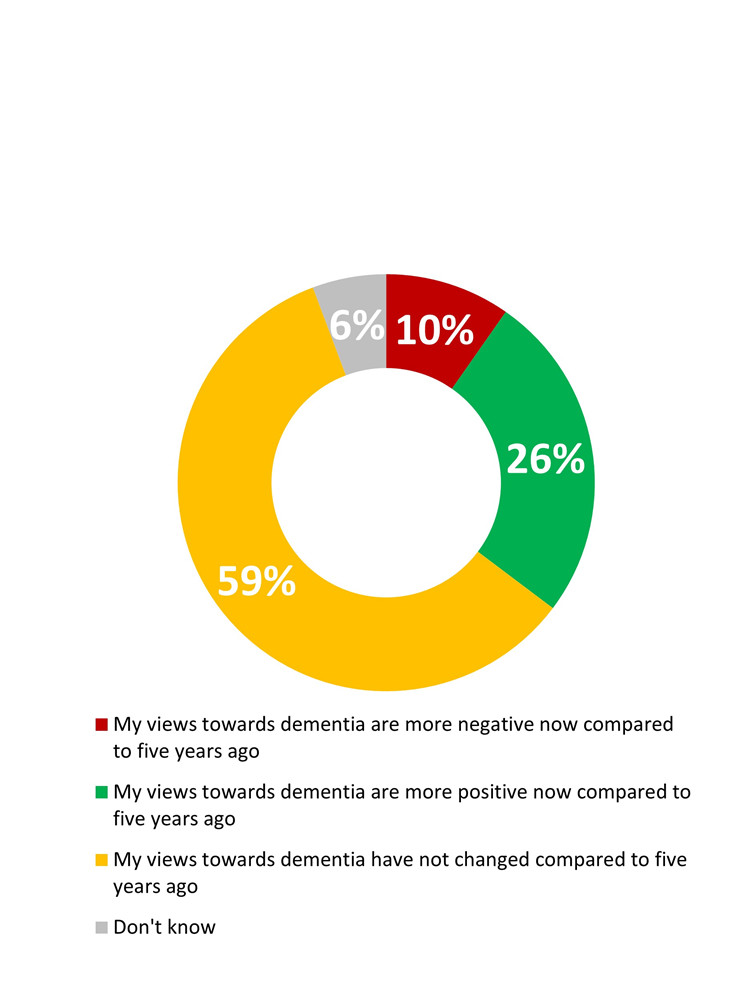
| My views towards dementia are more negative now compared to five years ago | 10% |
|---|---|
| My views towards dementia are more positive now compared to five years ago | 26% |
| My views towards dementia have not changed compared to five years ago | 59% |
| Don't know | 6% |
Base: All respondents, n=5,056.
Q48 – [IF VIEWS HAVE CHANGED] What caused the change in your views?
| Reason for change in views on dementia – Top Mentions | Total (n=1,833) |
|---|---|
| Knowing or caring for someone living with dementia | 46% |
| General information from sources other than the media and care providers/more is known about it | 25% |
| I am now worried about getting dementia/I am aging | 9% |
| Information through the media (television, radio, newspapers, articles) | 6% |
| Information from health care professionals and other care providers/educated or working in this field | 6% |
| The issues with the health care system (lack of support) | 3% |
| Advancements in medicine and research | 2% |
Base: Respondents who say their views towards dementia have changed compared to five years ago, n=1,833
Gender
Age
Province/territories
Populations disproportionately affected by dementia
Education
Sexual orientation
The sample was drawn from two sources:
Nanos conducted a mixed-sample Random Digit Dialled dual frame (land- and cell-lines) hybrid random telephone and online survey of 5,056 Canadians, 18 years of age or older, between March 11th and 29th, 2023 and additional supplementary fieldwork was conducted between June 7th and 25th, 2023 in an effort to target more individuals in these key ethnic communities who are disproportionately impacted by dementia. There were 4,689 interviews conducted during the original fieldwork period, and an additional 367 interviews were completed during the supplementary June fieldwork. Participants were randomly recruited by telephone using live agents and administered a survey online, with 2,406 interviews of the 5,056 total interviews recruited from the Nanos Online Probability Panel and the other 2,650 interviews recruited directly by a dual frame Random Digit Dialled sample of land- and cell-line numbers and administered the survey online.
With over 50,000 panellists, the Nanos Online Probability Panel consists of individuals randomly recruited by land-and cell-lines using live agents. As panellists are randomly recruited, this ensures the panel is representative of Canadians.
The sampling method was designed to complete interviews with at 4,200 Canadians 18 years of age and older. Soft quotas were set by age, gender, region, and key ethnic communities. In the end, 5,056 interviews were completed to meet the soft targets where possible, especially those set for the key ethnic communities.
The survey obtained the following distribution:
| Variable | % of Population | Target (Quota) |
% of Sample | Actual Unweighted |
Actual Weighted* |
Margin of Error |
|---|---|---|---|---|---|---|
| Region | ||||||
| Newfoundland and Labrador | 1% | 250 | 6% | 238 | 72 | ±6.4 |
| Nova Scotia | 2% | 350 | 8% | 348 | 138 | ±5.3 |
| Prince Edward Island | <1% | 175 | 4% | 168 | 22 | ±7.7 |
| New Brunswick | 2% | 300 | 7% | 297 | 112 | ±5.8 |
| Quebec | 19% | 570 | 14% | 631 | 1162 | ±3.9 |
| Ontario | 31% | 820 | 20% | 1,155 | 1,948 | ±2.9 |
| Manitoba | 3% | 285 | 7% | 326 | 177 | ±5.5 |
| Saskatchewan | 2% | 285 | 7% | 310 | 146 | ±5.6 |
| Alberta | 9% | 365 | 9% | 496 | 560 | ±4.4 |
| British Columbia | 11% | 450 | 11% | 693 | 703 | ±3.7 |
| Northwest Territories | <1% | 125 | 3% | 138 | 7 | ±8.5 |
| Yukon | <1% | 125 | 3% | 133 | 6 | ±8.6 |
| Nunavut | <1% | 100 | 2% | 123 | 3 | ±9.0 |
| Canada | 100% | 4,200 | 100% | 5,056 | 5,056 | ±1.4 |
| Age | ||||||
| 18-34 | 23% | 975 | 23% | 947 | 1,350 | ±3.2 |
| 35-44 | 28% | 1050 | 25% | 844 | 836 | ±3.4 |
| 45-54 | 14% | 510 | 12% | 882 | 793 | ±3.3 |
| 55-64 | 15% | 675 | 16% | 1,113 | 888 | ±2.9 |
| 65+ | 20% | 990 | 24% | 1,270 | 1189 | ±2.8 |
| Sex | ||||||
| Male | 49% | 2,100 | 50% | 2,665 | 2,456 | ±1.9 |
| Female | 51% | 2,100 | 50% | 2,372 | 2,581 | ±2.0 |
*Results are weighted by region, gender and age to 2021 Census data.
The following table presents the weighted distribution of survey participants by several key variables.
| Key Demographic - Visible minority groups* | Target (Soft quota) | Actual Unweighted | % of Sample |
|---|---|---|---|
| Southeast Asian | 250 | 254 | 5% |
| Black | 175 | 181 | 4% |
| Hispanic | 70 | 68 | 1% |
| South Asian | 250 | 253 | 5% |
*Based on multiple mentions
Once invited, participants were administered a set of screening questions to filter out anyone who was not eligible to participate in the study. For the purposes of this study the following screening criteria were applied:
As noted, respondents who fell into any of the above categories were immediately terminated from the research/prevented from proceeding any further and they were no longer eligible to participate in the study.
Readers should note that panel members have already been pre-screened for the industry specific criteria; however, as part of industry best practices, respondents are always screened on this question in case either their or an immediate family members' employment situation has changed, and they are now employed in an ineligible field. In that case the email is scrubbed from the panel and placed on a 'never contact' database.
As a best practice, a screening question was added to ensure respondents had not participated in Government of Canada surveys in the last 30 days before being contacted.
Panel maintenance
Individuals cannot self-select to join the panel or to complete surveys once they are panelists. For each project the sample is randomly selected from the randomly recruited panel.
Individuals are randomly recruited for the panel by land- and cell-lines across Canada. They provide their consent on the call and voluntarily provide their email address to Nanos to be contacted for future online research. We recruit for the panel every week as we do a weekly national survey which is representative of Canada and includes recruitment for the panel. Panelists usually drop out of the panel after a few months.
Weighting procedures
Our sampling methodology stratified the population along three key variables which allowed triangulation of the weighting approach and yielded robust, geographic, and demographic representation across the country.
The sample was stratified along three axes – by region/province, by sex and by age. Fixed completion quotas were assigned to each province, regionally in the Territories due to their relative size, which were anchored by their population distribution relative to the national total.
To ensure balanced representation within each province/region, the sample was further stratified by sub-regions. This prevented over/under-sampling of geographies (e.g., City of Toronto), within the provincial total.
Within each province soft gender/sex quotas were then set which approximate that area's sex distribution. The data collection allowed for a variance of +/- 5% for sex within each region, again preventing over representation by either men or women. The third stratification axis was by age category. The age categories were used to group respondents and for weighting purposes.
Each of the age categories were weighted, within their sex and their province/region, the outcome of which yielded a dataset which accurately reflects the demographic composition of the population at large.
Methodology
The survey methodology included a randomly selected probability sample. The sample was drawn from two sources: 1) the Nanos Online Probability Panel and 2) random digit dialled land- and cell-lines and administered online.
Due to the large, proposed target sample size and to compensate for the parameters of the Nanos Online Probability Panel, Nanos conducted a dual mode recruitment, which consisted of approximately half the interviews using our Nanos Online Probability Panel and the remaining interviews randomly recruited through a telephone interview (random digit dialled land- and cell-lines) and administered the questionnaire online.
Accessibility provisions
Accessibility is paramount during the questionnaire design process, where we ensured questions were not overly wordy or complex and that they will be easily understood.
Our online survey platform is designed to meet accessibility standards, including proper HTML format and tags, alternative text, proper contrast, and other best practices to allow for ease of use of screen readers and other assistive technologies.
During fieldwork we ensured we accommodated the needs of all eligible respondents as required, including informing respondents of available accommodations or alternatives available, such as completing the survey by telephone instead of online and vice versa.
Fieldwork dates
Fieldwork was conducted between March 11th to 29th, 2023 and June 7th to 25th, 2023.
Interview duration
The average interview length was 17.9 minutes and ranged from 11 to 31 minutes.
Incentives/methods to encourage participation
An incentive of $5 (either via e-transfer or to a donation to a registered charity) was offered to all panelists who participated in the research. A minimum of two reminder emails were sent to invitees to encourage their participation.
Quality controls
Prior to launching the survey, a pre-test was conducted online with 20 individuals (10 English, 10 French) from March 6th to 9th, 2023. The purpose of the pre-test was to ensure that the content of the questionnaire was understandable, that the duration of the interview fit the target, to ensure comparability between the French and the English, and to ensure that the logic of the survey flowed smoothly.
Upon completion of the pre-test, Nanos and the Public Health Agency of Canada reviewed the findings and determined no modifications were needed and the survey was deployed to the full sample.
For our online surveys from our panel, we have a minimum field period of one week to give people a chance to complete the survey and for Nanos to send reminders to those who did not complete the survey (this limits the bias of only taking people who respond to the first invitation because they are free and/or have immediate access to a computer for online surveys).
The data file was checked on several elements to ensure accuracy and validity, both during and after the data collection as follows:
Nanos Research monitors 10% of all fieldwork for quality control and assurance in accordance with the standards of the Canadian Research Insights Council, the European Society for Opinion and Marketing Research and the American Association for Public Opinion Research
Call dispositions
The following table outlines the contact disposition for the fieldwork.
| Online Survey Contact Disposition | |
|---|---|
| Total Invitations (a) | 27462 |
| Total Completes (b) | 5056 |
| Qualified Break-offs (c) | 338 |
| Disqualified (d) | 76 |
| No response (e) | 27841 |
| Contact Rate (b+c+d)/a | 19.9% |
| Participation Rate (b+d)/a | 18.7% |
| Total | |
|---|---|
| Total Numbers Attempted | 454294 |
| Out of scope - invalid | 298356 |
| NIS, Business, etc | 298356 |
| Unresolved (U) | 76055 |
| No answer/machine/etc | 75378 |
| Busy | 677 |
| In-score Non-responding (IS) | 73574 |
| Language barrier | 130 |
| Callback | 3042 |
| Refusal | 70395 |
| Termination | 7 |
| In scope responding (R) | 6309 |
| Complete | 6309 |
| Partials | 0 |
| Response Rate | 4.0% |
Response rate
The response rate for this survey was 4.0%. This was calculated using the Canadian Research Insights Council formula, which has been approved by the Government of Canada (Response Rate/Participation Rate = R/(U + IS + R)
Non-response bias
First, there is potential non-response bias based on the profile of the responding sample. Based on our experience, using the Random Digit Dialed dual frame land- and cell-line sample represents the optimal and most reliable form of research that requires the least amount of post fieldwork statistical weighting (both for the telephone sample and the online, as participants were recruited by land- and cell-lines). From a research perspective, the less weighting the better since the data remains random and in its raw form as shared with Nanos.
Non-response bias is managed primarily through the application of statistical weights. Another possible non-response bias would be individuals of a lower socio-economic status. These individuals may not have access to a land or cell-line to be included in the sample so there is the potential coverage issue from a sampling perspective. Nanos managed this non-response bias by statistically checking the demographics of the participating sample group with the Canadian population. Where a valid variance occurs, the dataset is weighted to be consistent with the profile of all Canadians including those, for example, of a lower socio-economic status. The estimated proportion of Canadians without access to internet to complete the survey is 6%.[ii]
Second, there is the potential non-response bias based on the answers themselves. Although the demographic profile of the sample reflects the Canadian population, hypothetically, the non-responding participants may have different opinions. Although this is a hypothetical possibility, the Nanos track record with respect to both economic and political sentiment which very accurately captures opinion and closely correlates to a number of external measures intended to be examined, suggests that there is little non-response bias in the Nanos methodology.
Good _____, how are you? My name is _____ and I'm calling from Nanos Research, a national public opinion research company. We are conducting a 15-minute online survey on behalf of the Public Health Agency of Canada, and you have been randomly selected to participate. The purpose of this survey is to examine Canadians' understanding of and attitudes towards dementia.
Your participation is strictly confidential, and your responses will remain anonymous. This project has been registered with the Canada Research and Insights Council.
The survey will be conducted online but I'd like to ask you a few questions first to confirm if you are qualified to participate for this research study. If you are, I will ask for your email address where we will send the survey invitation.
May I ask you a few questions to confirm if you qualify for this survey?
[IF CONSENTS, CONTINUE]
[IF DECLINES, THANK AND TERMINATE]
Thank you for your time, you will receive your survey invitation within the next 12 to 24 hours. If you have any questions or to request to complete the survey over the phone, please feel free to contact the senior researcher for this project, Jennifer Henwood, at jhenwood@nanosresearch.com at any time. Have a nice day.
ONLINE SURVEY INTRODUCTION
Thank you for your interest in participating in this 15-minute research survey for the Public Health Agency of Canada. All the views and information you share with Nanos Research will be confidential and protected in accordance with Canada's privacy laws. Thank you, in advance, for sharing your time.
This research project is registered with the CRIC Research Verification Service that allows you to verify its legitimacy and share your feedback. If you have feedback on this research, you can share it by going to https://canadianresearchinsightscouncil.ca/rvs and using the RVS code: XYZ.
Invitation to Participate: You are invited to participate in the above-mentioned research study conducted by Nanos Research on behalf of the Public Health Agency of Canada.
Si vous préférez répondre au sondage en français, veuillez cliquer sur français.
Purpose of the Study: From this research we wish to examine Canadians' understanding of and attitudes towards dementia.
Participation: If you wish to participate in this study, please click the invitation link. Your decision to complete and return this survey will be interpreted as an indication of your consent to participate. The survey should take you approximately 15 minutes to complete.
Confidentiality and Anonymity: The information that you will share will remain strictly confidential and will be used solely for the purposes of this research. The only people who will have access to the research data are Nanos Research and the Public Health Agency of Canada. Results will be published and grouped together. Anonymity is guaranteed. The Public Health Agency of Canada will only have access to de-identified data with no means of identifying participants.
Conservation of data: The surveys will be kept in a secure server in the Nanos Office in Toronto only accessible by the Nanos Chief Privacy Officer for a period of five years at which time they will be destroyed.
Voluntary Participation: You are under no obligation to participate and if you choose to participate, you may refuse to answer questions that you do not want to answer. You may choose to withdraw from the process at any time during or after the data collection process and any collected data will be destroyed upon request.
Contact: If you have any questions or require more information about the study itself, or for technical support with the survey, accessibility requirements, or to request to complete the survey over the phone you can contact jhenwood@nanosresearch.com. If you have any questions regarding the administration of this study, you may contact the Senior Researcher, Nik Nanos at nik@nanos.co or 613-234-4666 extension 237.
Thank you for your time and consideration.
Our next few questions are about dementia.
DEMENTIA KNOWLEDGE
To the best of your knowledge, please indicate if each of the following are true or false: [RANDOMIZE]
PROXIMITY TO DEMENTIA
PERCEPTIONS OF OLDER PEOPLE
To what extent do you agree or disagree with the following statements? [NEW][RANDOMIZE] [to allow for correlation with views on aging]
TAKING STEPS TO REDUCE THE RISK OF DEVELOPING DEMENTIA
CONCERN ABOUT DEVELOPING DEMENTIA:
To what extent do you agree or disagree with the following...? [RANDOMIZE]
COMFORT LEVEL WITH INTERACTION
INDIVIDUAL PERCEPTIONS OF PEOPLE LIVING WITH DEMENTIA:
To what extent do you agree or disagree with the following...? [RANDOMIZE]
SEEKING A DEMENTIA DIAGNOSIS:
How comfortable would you be with each of the following...? [RANDOMIZE]
POPULAR CULTURE PORTRAYAL
PERCEPTIONS OF STIGMA IN SOCIETY
To what extent do you agree with the following statements about people living with dementia? [RANDOMIZE]
DEMOGRAPHIC QUESTIONS
Our last few questions will help us group your responses.
Thank you for taking part in this survey. Your answers will remain anonymous and will only be reported in the aggregate. We very much appreciate your time and honesty.