Understanding Canadians' attitudes and knowledge to promote safe and supportive dementia-inclusive communities
Final Report
Prepared for The Public Health Agency of Canada
Supplier name: Earnscliffe Strategy Group
Contract number: CW2273819
Contract value: $216,770.95
Award date: February 17, 2023
Delivery date: August 28, 2023
Registration number: POR # 133-22
For more information on this report, please contact Health Canada at:
hc.cpab.por-rop.dgcap.sc@canada.ca
Ce rapport est aussi disponible en français.
Understanding Canadians' attitudes and knowledge to promote safe and supportive dementia-inclusive communities
Prepared for The Public Health Agency of Canada
Supplier name: Earnscliffe Strategy Group
August 2023
This public opinion research report presents the results of focus groups and an online survey, conducted by Earnscliffe Strategy Group on behalf of The Public Health Agency of Canada. The qualitative research was conducted in April 2023 and the quantitative research was conducted from March to May 2023.
Cette publication est aussi disponible en français sous le titre : Comprendre les attitudes et les connaissances des Canadiens pour promouvoir des collectivités inclusives à l'égard des personnes atteintes de démence qui sont sécuritaires et solidaires
This publication may be reproduced for non-commercial purposes only. Prior written permission must be obtained from Health Canada. For more information on this report, please contact Health Canada at: hc.cpab.por-rop.dgcap.sc@canada.ca or at:
Health Canada, CPAB
200 Eglantine Driveway, Tunney's Pasture
Jeanne Mance Building, AL 1915C
Ottawa Ontario K1A 0K9
Catalogue Number: H14-458/2023E-PDF
International Standard Book Number (ISBN): 978-0-660-68022-4
Related publications (registration number: POR 133-22)
Comprendre les attitudes et les connaissances des Canadiens pour promouvoir des collectivités inclusives à l'égard des personnes atteintes de démence qui sont sécuritaires et solidaires (Final Report, French) ISBN 978-0-660-68023-1
Ó His Majesty the King in Right of Canada, as represented by the Minister of Health, 2023
Earnscliffe Strategy Group (Earnscliffe) is pleased to present this report to the Public Health Agency of Canada (PHAC) summarizing the results of a two-phased qualitative and quantitative research project exploring Canadians' attitudes and knowledge in promoting safe and supportive dementia-inclusive communities.
Released in 2019 and required under the National Strategy for Alzheimer's Disease and Other Dementias Act, Canada's national dementia strategy, A Dementia Strategy for Canada: Together We Aspire, supports the vision of a Canada in which all people living with dementia and caregivers are valued and supported, quality of life is optimized, and dementia is prevented, well understood, and effectively treated. The strategy identifies three national objectives: prevent dementia; advance therapies and find a cure; and improve the quality of life of people living with dementia and caregivers.
The national dementia strategy recognizes the importance of creating dementia-inclusive communities across Canada that maximize quality of life while being supportive, safe, and inclusive for people living with dementia and their caregivers. In dementia-inclusive communities the participation and contribution of people living with dementia is encouraged, supported, and valued. As well, the care and support provided within the community is culturally safe, culturally appropriate, and mindful of diversity. These communities also help to reduce and eliminate barriers, including those resulting from stigma that can lead to social isolation.
This research will assist in supporting the development and implementation of Canada's first national dementia strategy, A Dementia Strategy for Canada: Together we Aspire. Understanding attitudes, knowledge, and experiences related to dementia-inclusive communities in Canada is critical for government and departmental priorities on dementia by informing efforts and prioritizing options for investments intended to support healthy aging and quality of life through such communities. This research will also deepen understanding of the infrastructure, physical and social environments, and programs and policies available to support dementia-inclusive communities.
The primary objective of this research is to provide the Government of Canada with insights into Canadians' attitudes, knowledge and experiences related to dementia-inclusive communities. The contract value for this project was $216,770.95 including HST.
To meet the objectives of the research, Earnscliffe conducted a two-phased qualitative and quantitative research approach.
The first phase of the research was qualitative and involved sixteen (16) online focus groups between April 3-5, 2023 (using the Discussion Guide found in Appendix C). Four focus groups (segmented by region, across Canada, including one group in each region in communities with older populations) took place with each of the four target employment industries (i.e., retail and food services; transportation and public safety; recreation, fitness, community and religious organizations; and financial services – each of which have been identified as professions likely to have encountered people living with dementia now or in the future). Information about the interview design, methodology, and sampling approach has been provided in the Qualitative Methodology Report in Appendix A.
The second phase of research was quantitative and involved a survey, conducted online or by telephone according to the respondent's preference in English or in French, of 6,049 Canadian adults between April 21st and May 24th, 2023. The survey took an average of 10 minutes to complete online and 20 minutes to complete on the telephone. The robust sample size was used to obtain sufficient completed surveys across multiple target audiences (i.e., specific industry sectors, ethnic and cultural minorities, unpaid caregivers and those who identify as 2SLGBTQI+). A full description of the sample frame, data cleaning process, and weighting are outlined in the Quantitative Methodology Report (Appendix E) and the questionnaire has been provided in Appendix E. Since a sample drawn from an Internet panel is non-probabilistic in nature, the margin of error cannot be calculated for this survey.
It is important to note that qualitative research is a valid form of scientific, social, policy, and public opinion research. However, focus group research is not designed to help a group reach a consensus or to make decisions, but rather to elicit the full range of ideas, attitudes, experiences and opinions of a selected sample of participants on a defined topic, as was done in this research. Because of the small numbers involved the participants cannot be expected to be thoroughly representative in a statistical sense of the larger population from which they are drawn and findings cannot reliably be generalized beyond their number.
The key findings of this research are presented below. Please note a glossary of terms can be found in the Qualitative Methodology Report in Appendix A that explains the generalizations and interpretations of qualitative terms used throughout the report.
Personal experience, general understanding, and perceptions of dementia
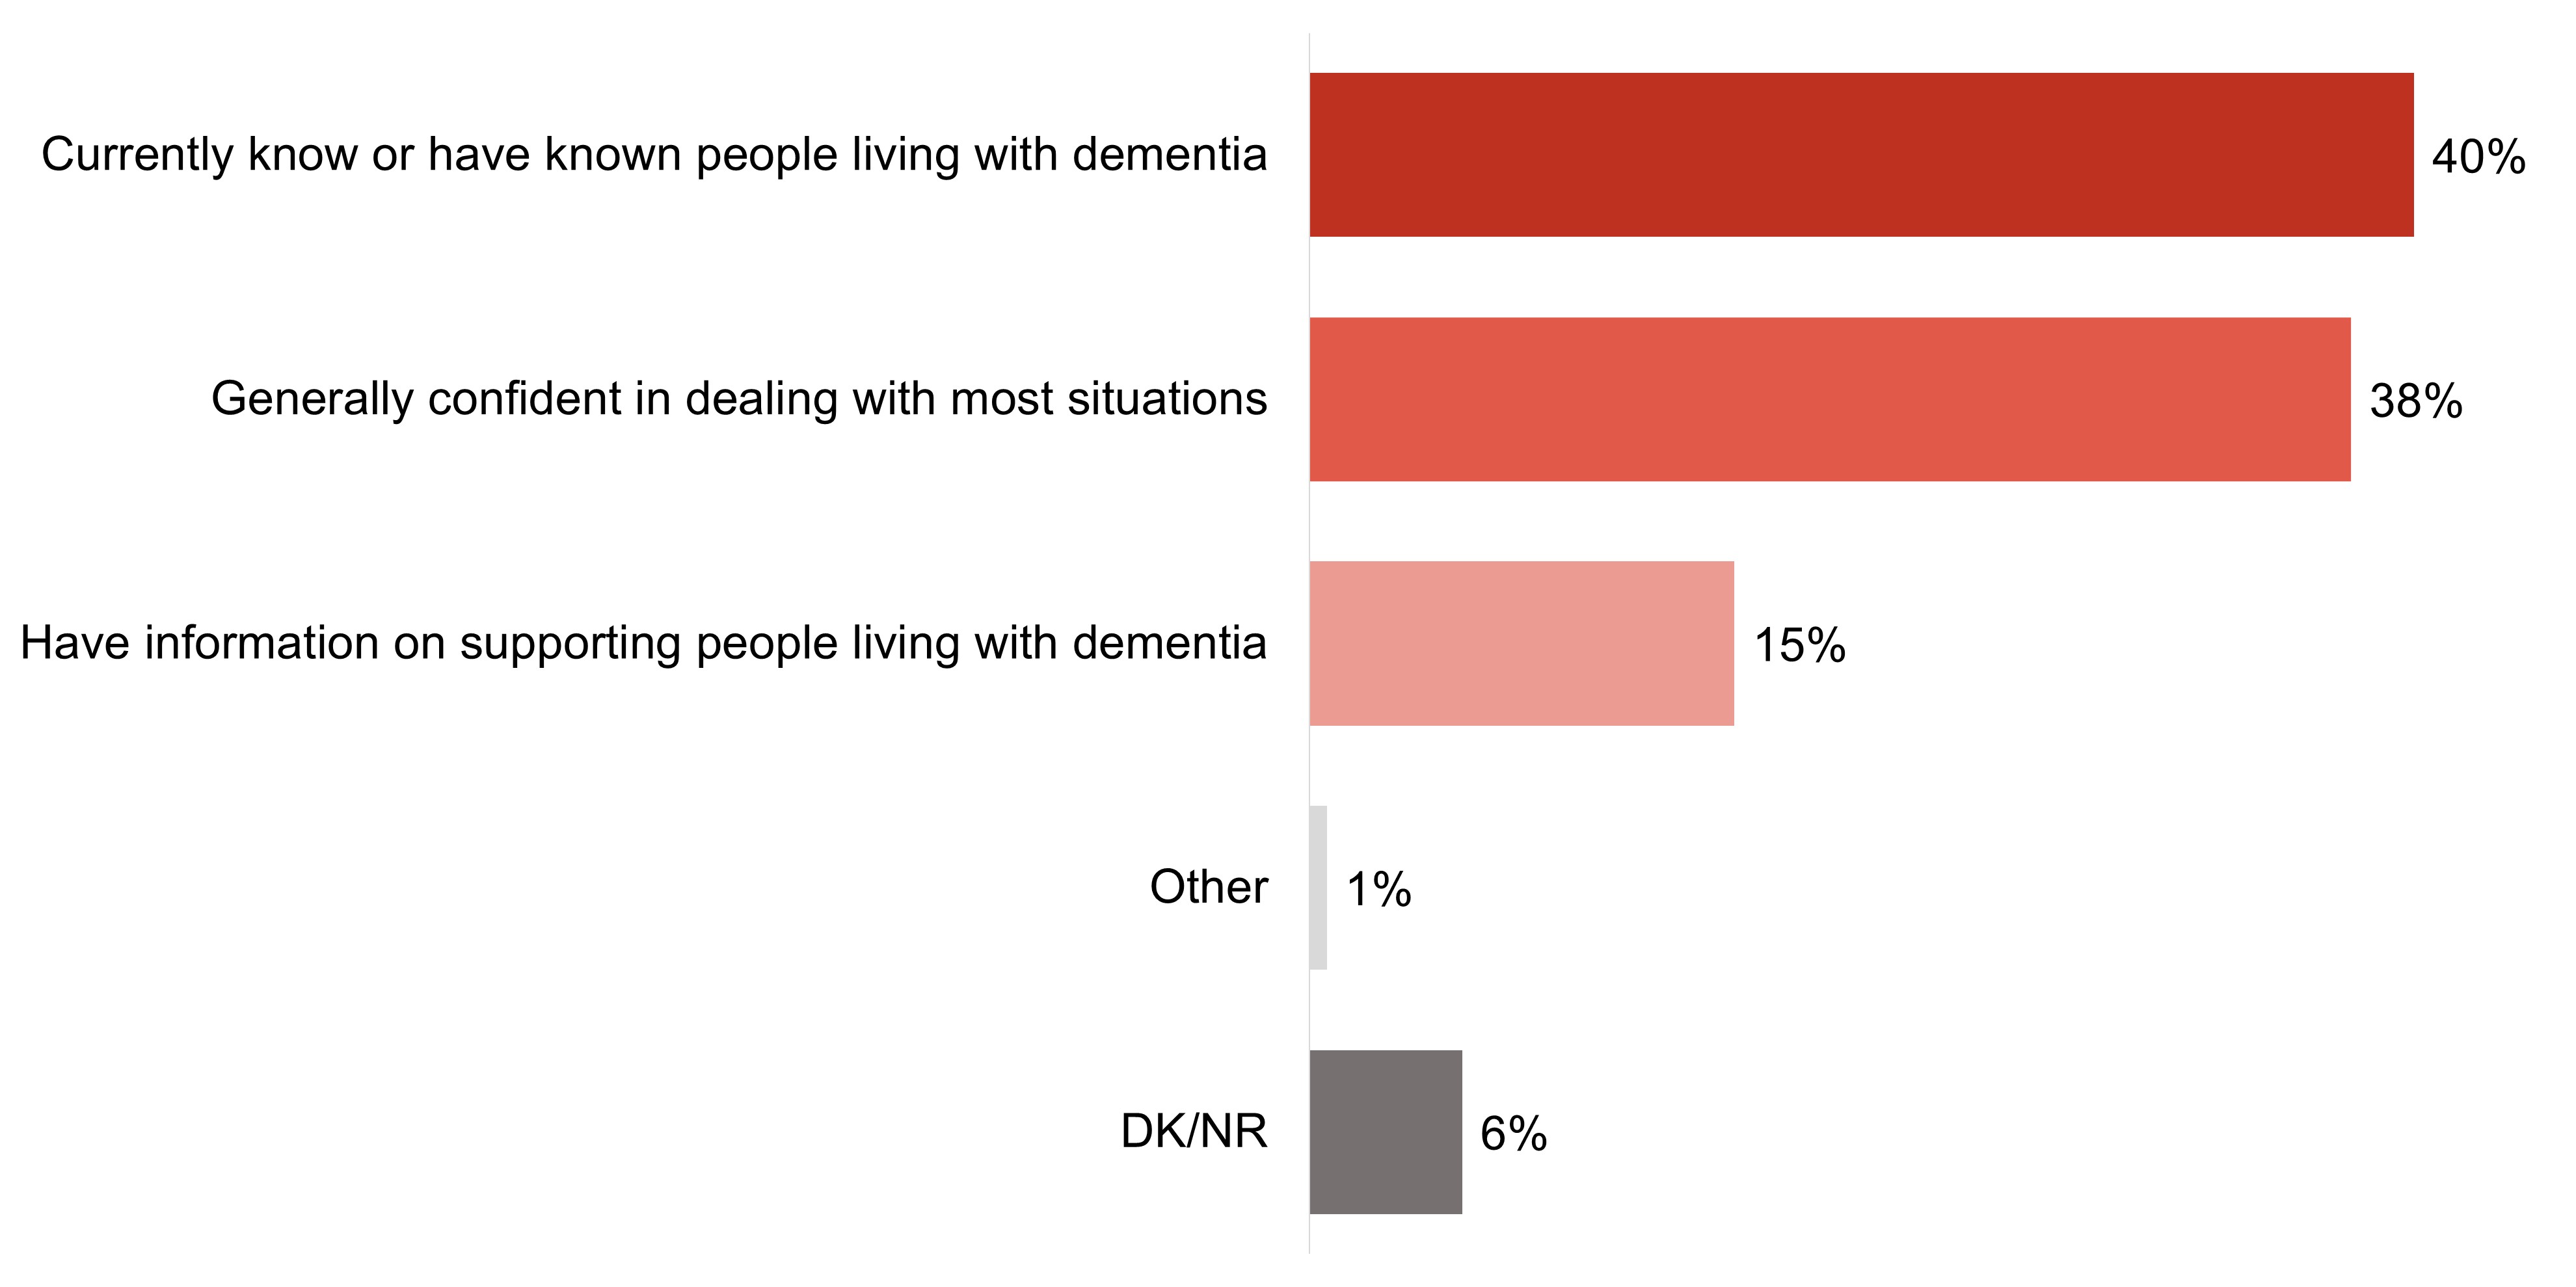
A strong majority of survey respondents (63%) say they know a person that is living/lived with dementia; most commonly an extended family member (32%) or a parent (19%).
Nearly one-third (32%) of survey respondents have been an unpaid caregiver of a person living with dementia in the past 5 years, and assisting with errands is the most common task done by unpaid caregivers.
The majority of participants in the focus groups knew someone who is currently or has lived with dementia and few have acted as unpaid caregiver.
The most common experiences related to dementia-inclusive communities faced by survey respondents who have provided unpaid care while they were with the person with dementia is having people talk to them instead of the person living with dementia (42%) and encountering people who focus on what the person with dementia cannot do rather than what they can (40%).
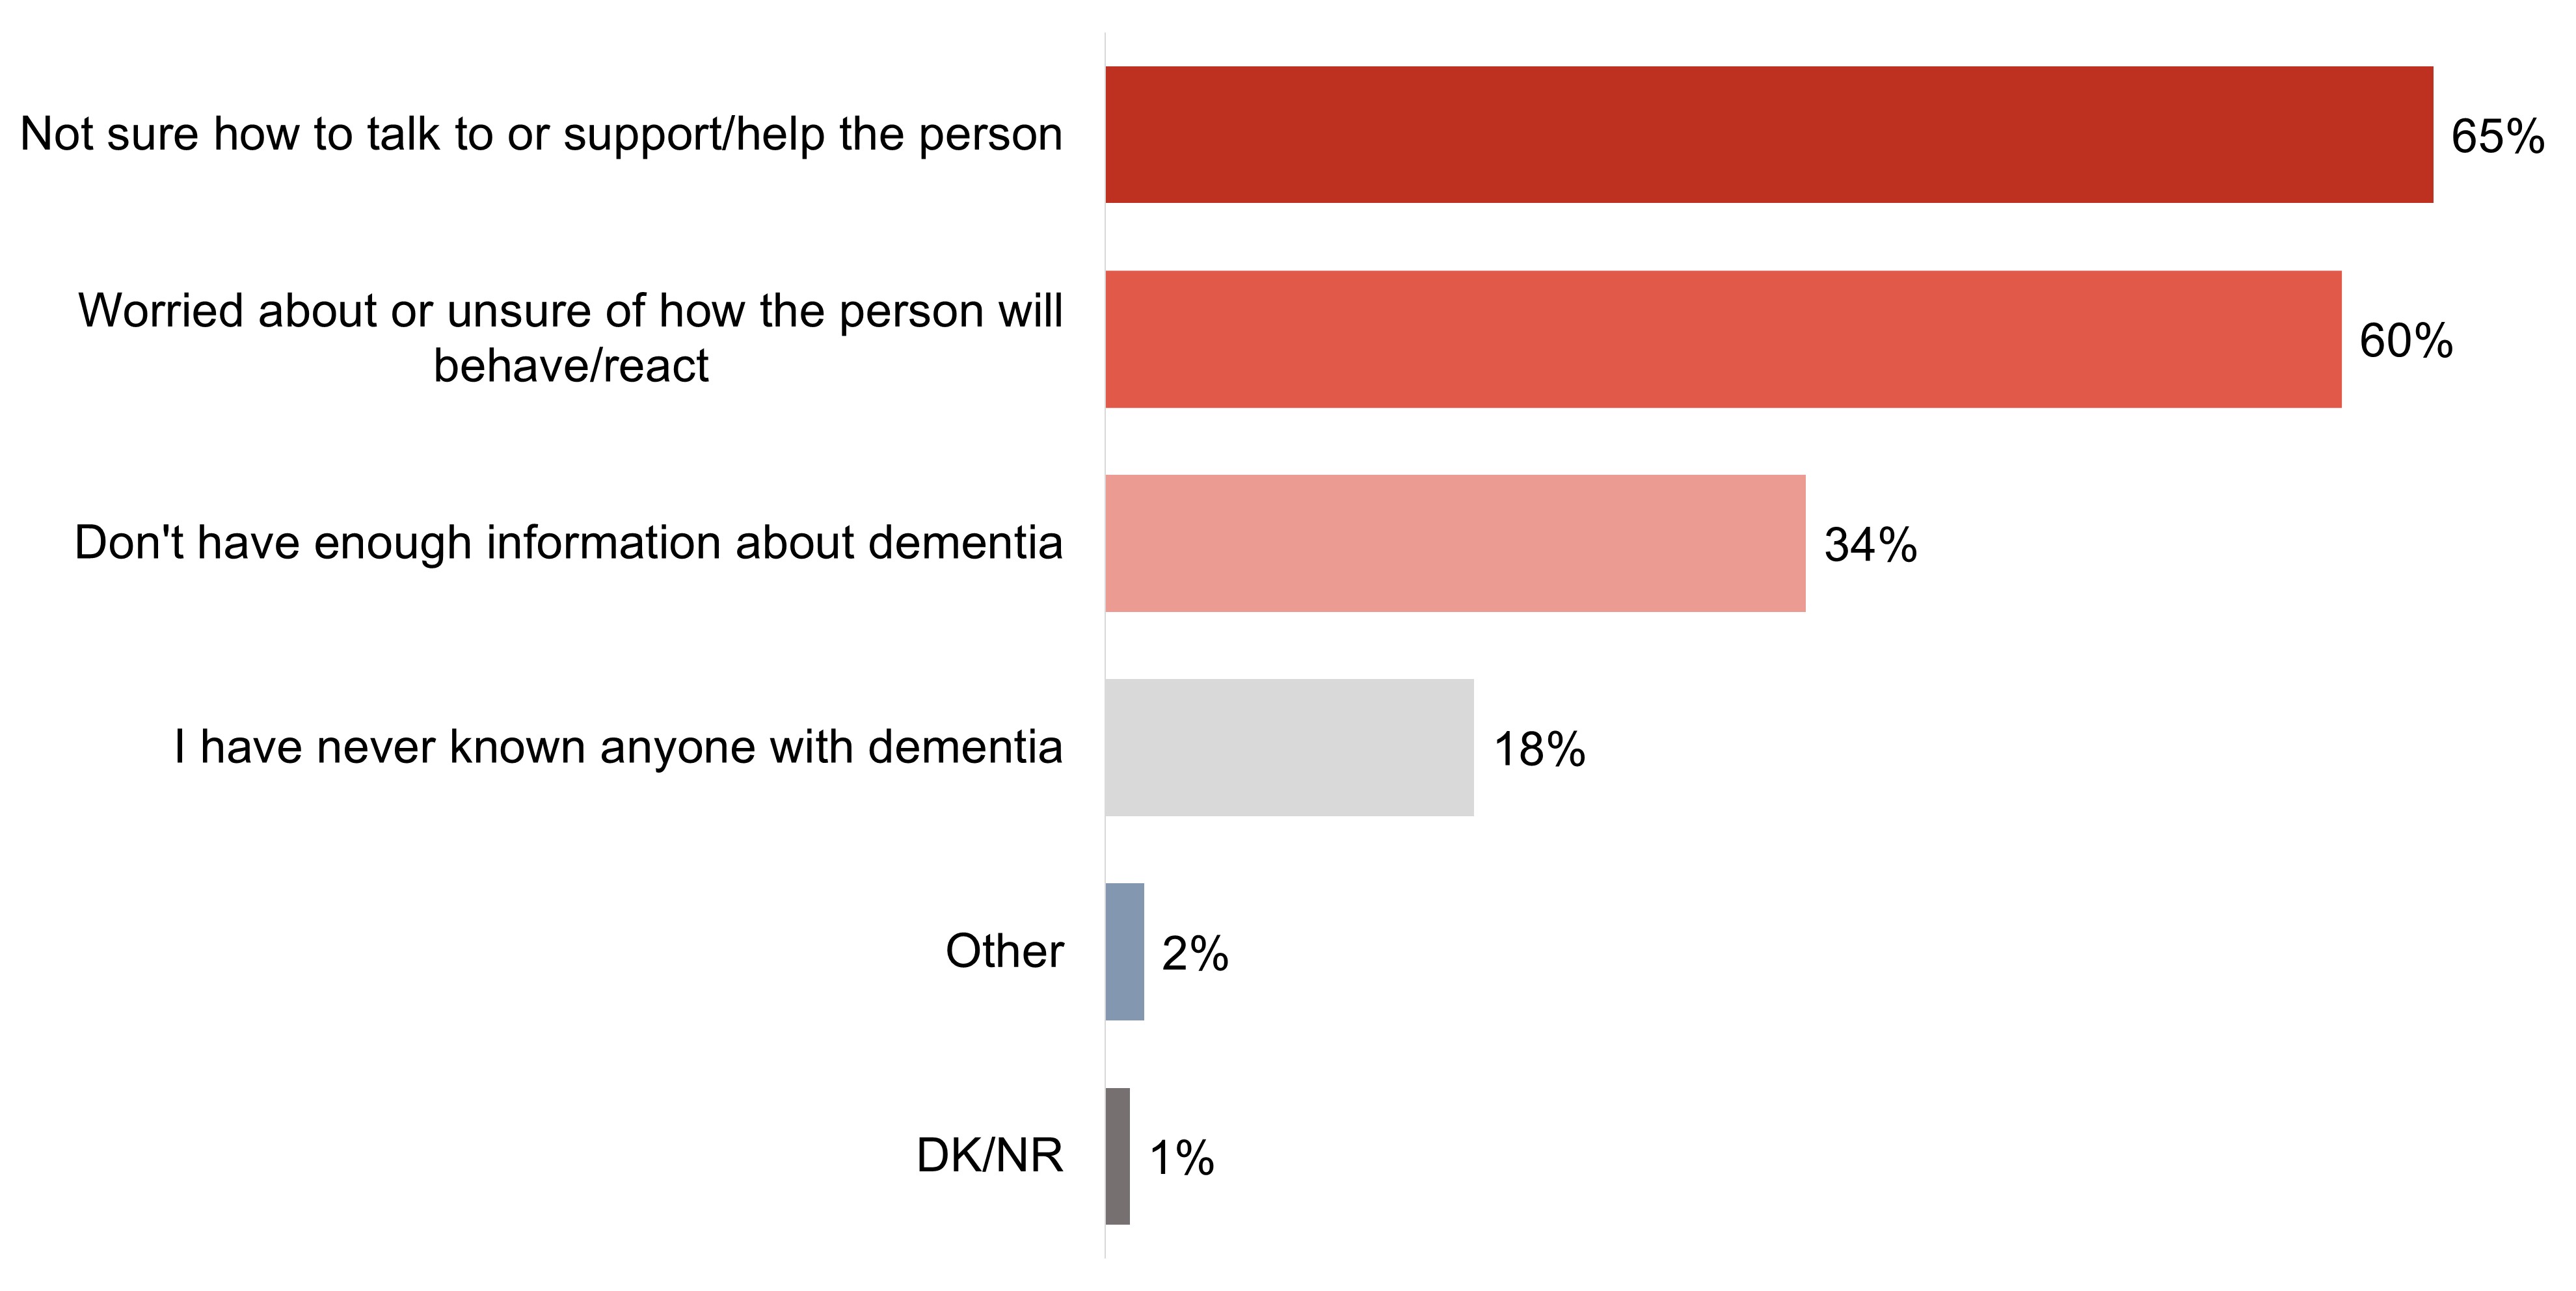
Over one-third (37%) of survey respondents who are or have been an unpaid caregiver say they have not experienced any challenges when accessing/using dementia recommendations or advice compared to 54% who have experienced challenges. In terms of those challenges, one in five say that the advice was too complicated (20%), too expensive (19%) or did not reflect important cultural context (19%).
More survey respondents rate their knowledge of dementia as one or two (27%) (on a five-point knowledge scale, where one is 'not at all knowledgeable' and five is 'very knowledgeable'; than a four or five (22%). The remaining respondents (49%) say their knowledge of dementia is 'moderate' (a rating of three).
Almost all focus group participants were aware of the term dementia. When asked to define dementia, many used medical descriptions or symptoms, but there were also many who used terms that described the tragic loss feared or felt by the person living with dementia or the impact of the illness.
Nearly half (49%) of survey respondents believe that dementia is having a large or very large impact in Canada today, while one-third (33%) say it is having a moderate impact. Fewer (8%) believe dementia is having little or no impact in Canada today.
A majority of survey respondents agree or strongly agree that people living with dementia are sometimes able to continue being active in their communities (70%), live in their own homes (68%) and continue to work (50%) for years following their diagnosis.
A strong majority of survey respondents agree or strongly agree that people living with dementia generally face a lower quality of life than people without dementia (68%).
The quality of life for persons living with dementia was rarely described in positive terms among focus group participants. Participants spoke of a life of mild frustration, confusion, or limitation, and a life where a person may need to live a very controlled life.
In addition to a perceived diminished quality of life for the person living with dementia, many focus group participants questioned the feasibility of accommodating people living with dementia in the workplace and in their communities.
When asked about interacting with someone living with dementia, a similar proportion of survey respondents say they are comfortable or very comfortable (41%) or moderately comfortable (39%), while 13% say they are not comfortable.
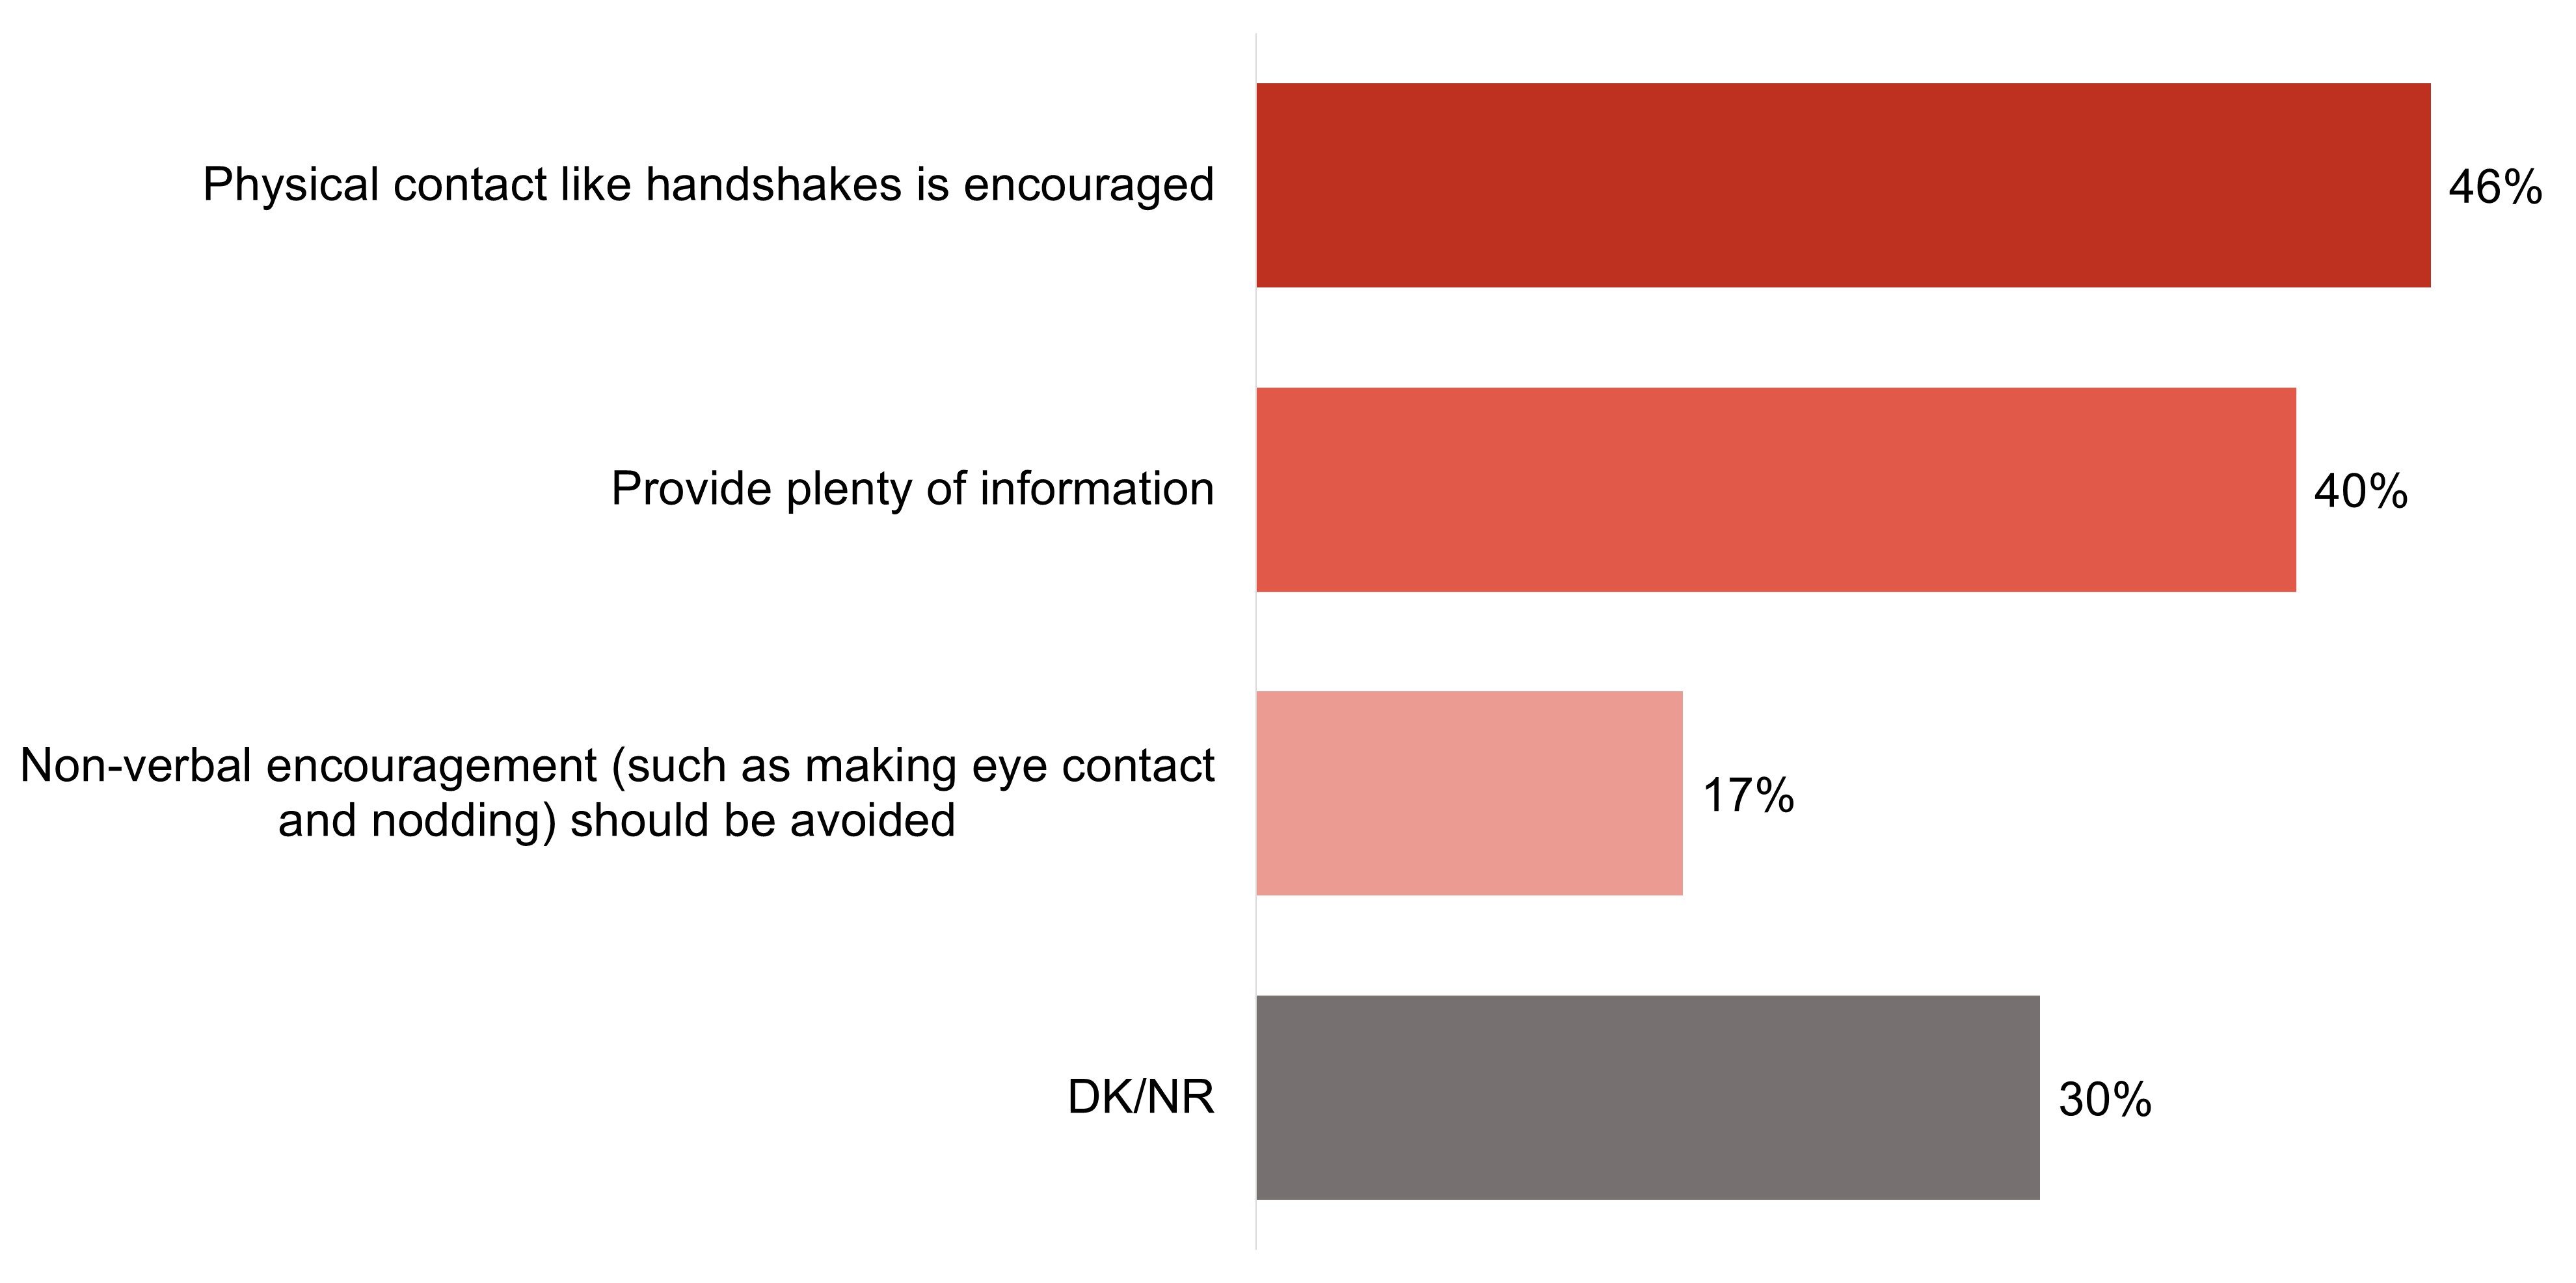
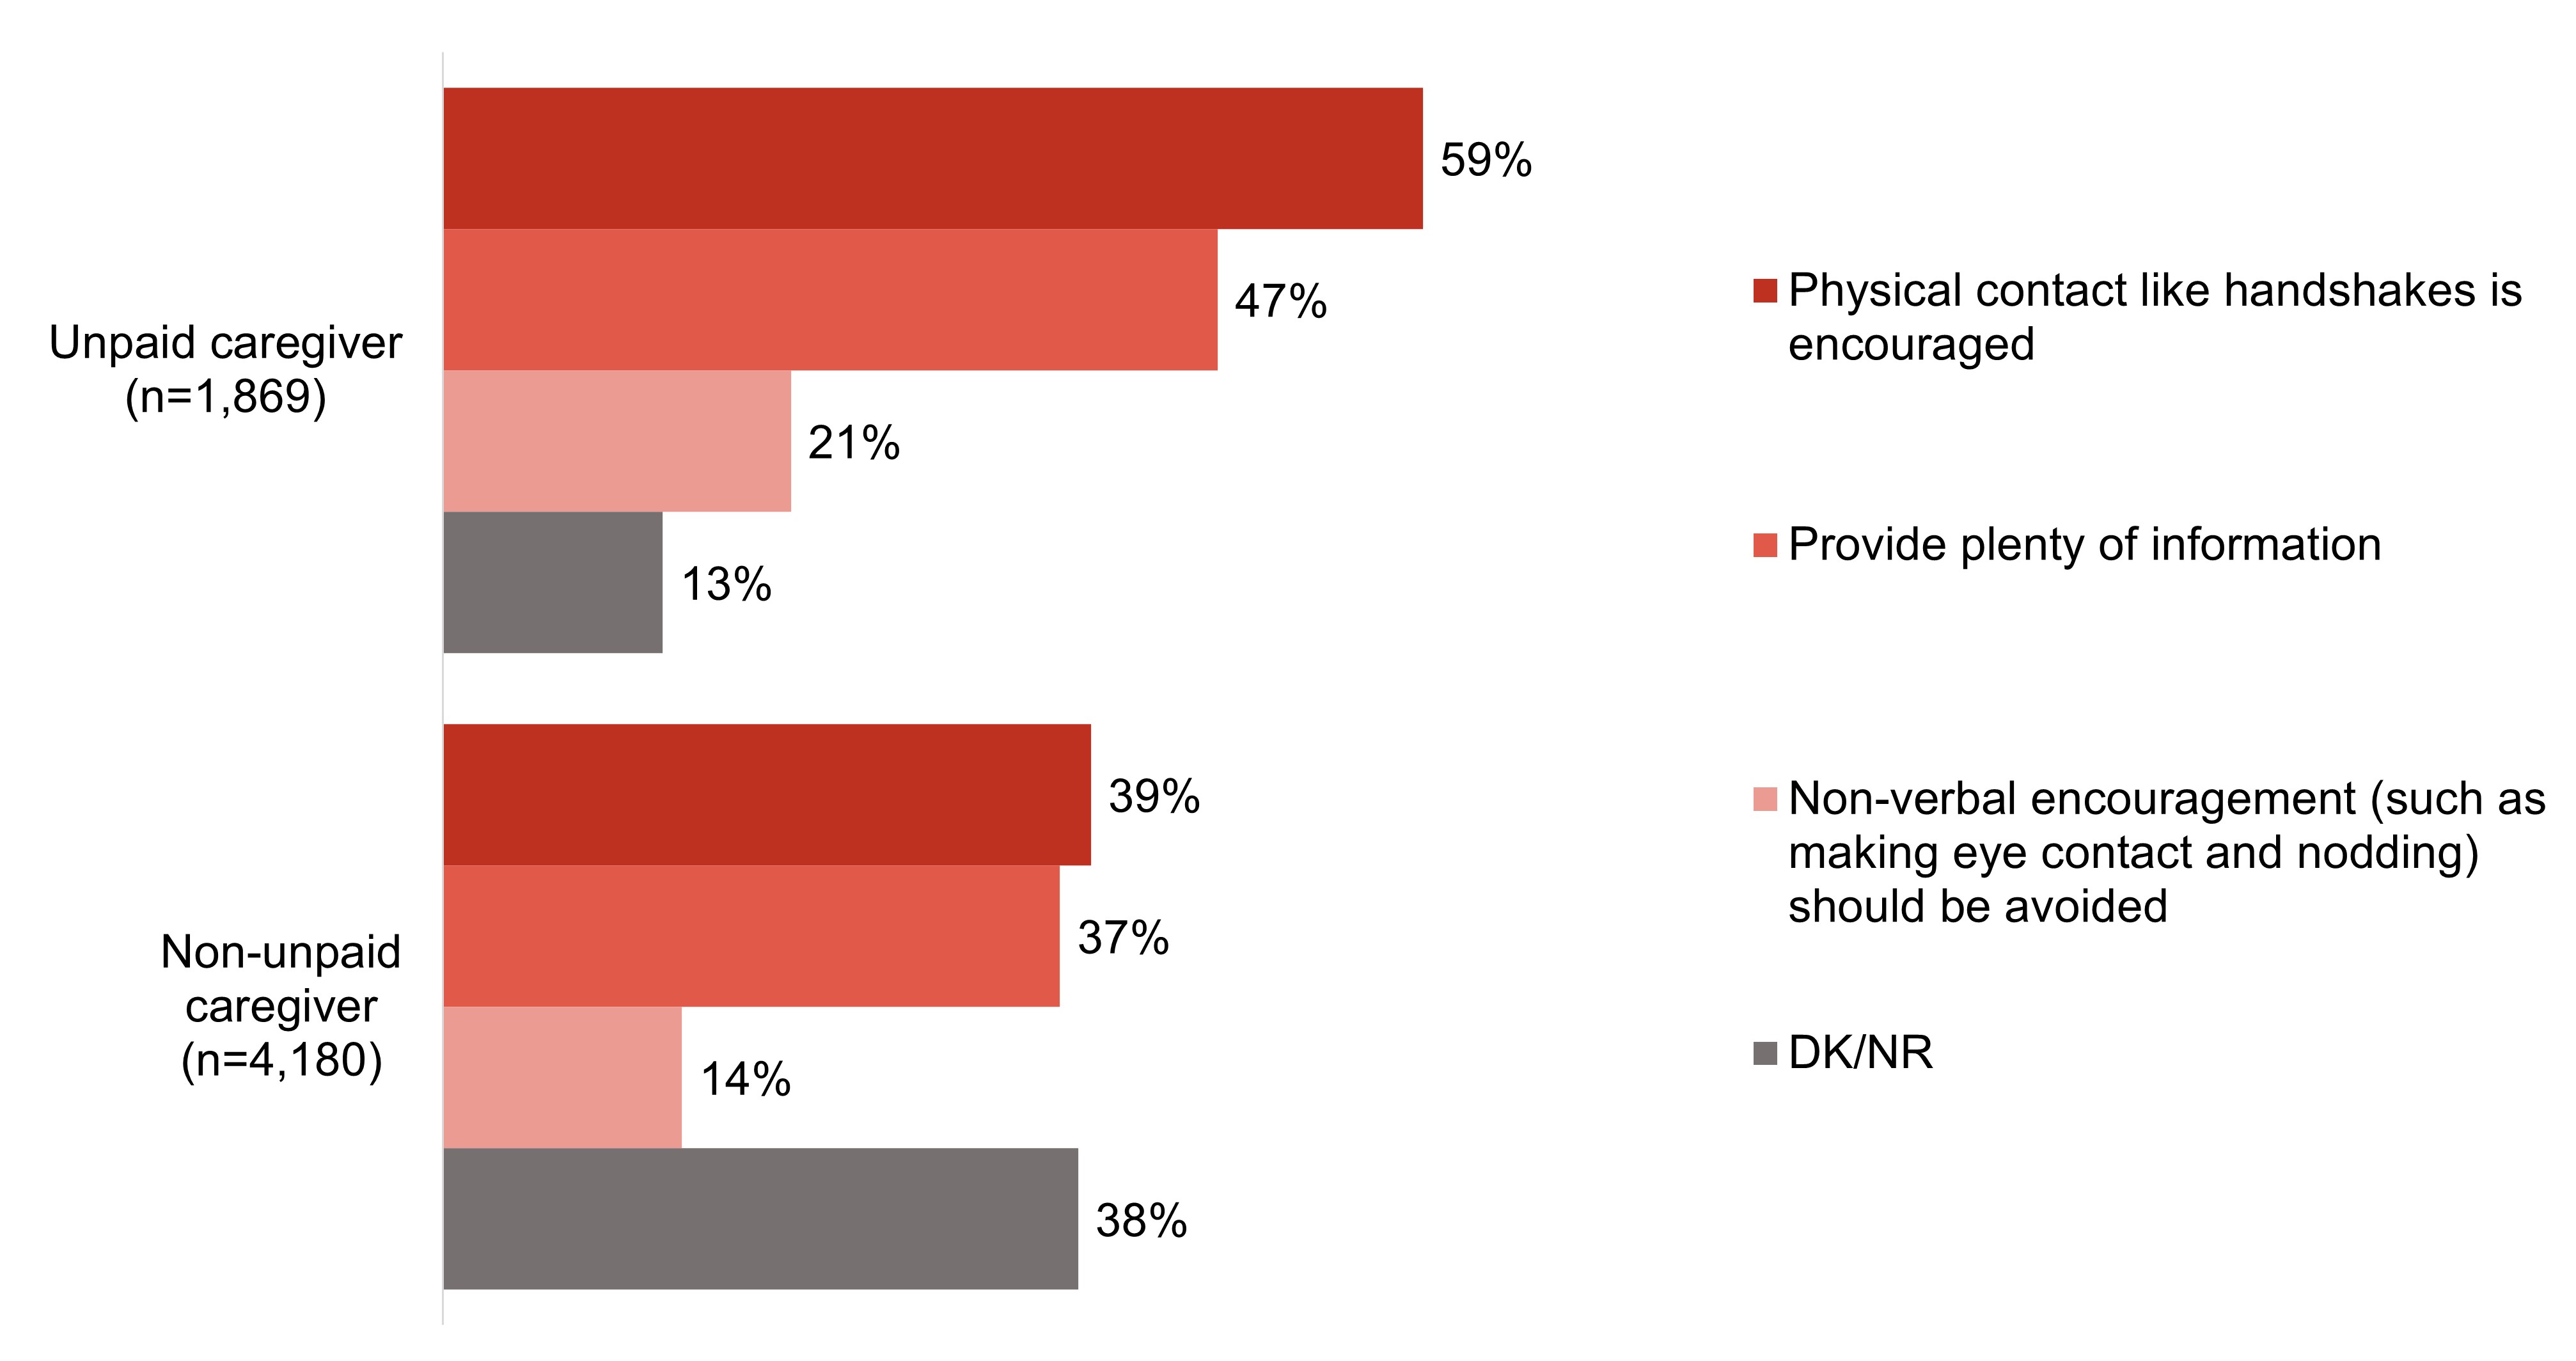
When asked to select what they believe to be recommended tips on how to communicate with people living with dementia, many select non-recommended approaches such as physical contact (e.g., hand shakes) (46%) and providing plenty of information (40%).
Few focus group participants were able to offer, on an unaided basis, any recommendations for interacting with people living with dementia. Once shown a list of recommendations provided by PHAC, most felt these tips were intuitive and helpful, and expressed gratitude for seeing them.
Interactions with people living with dementia in workplace or volunteer settings
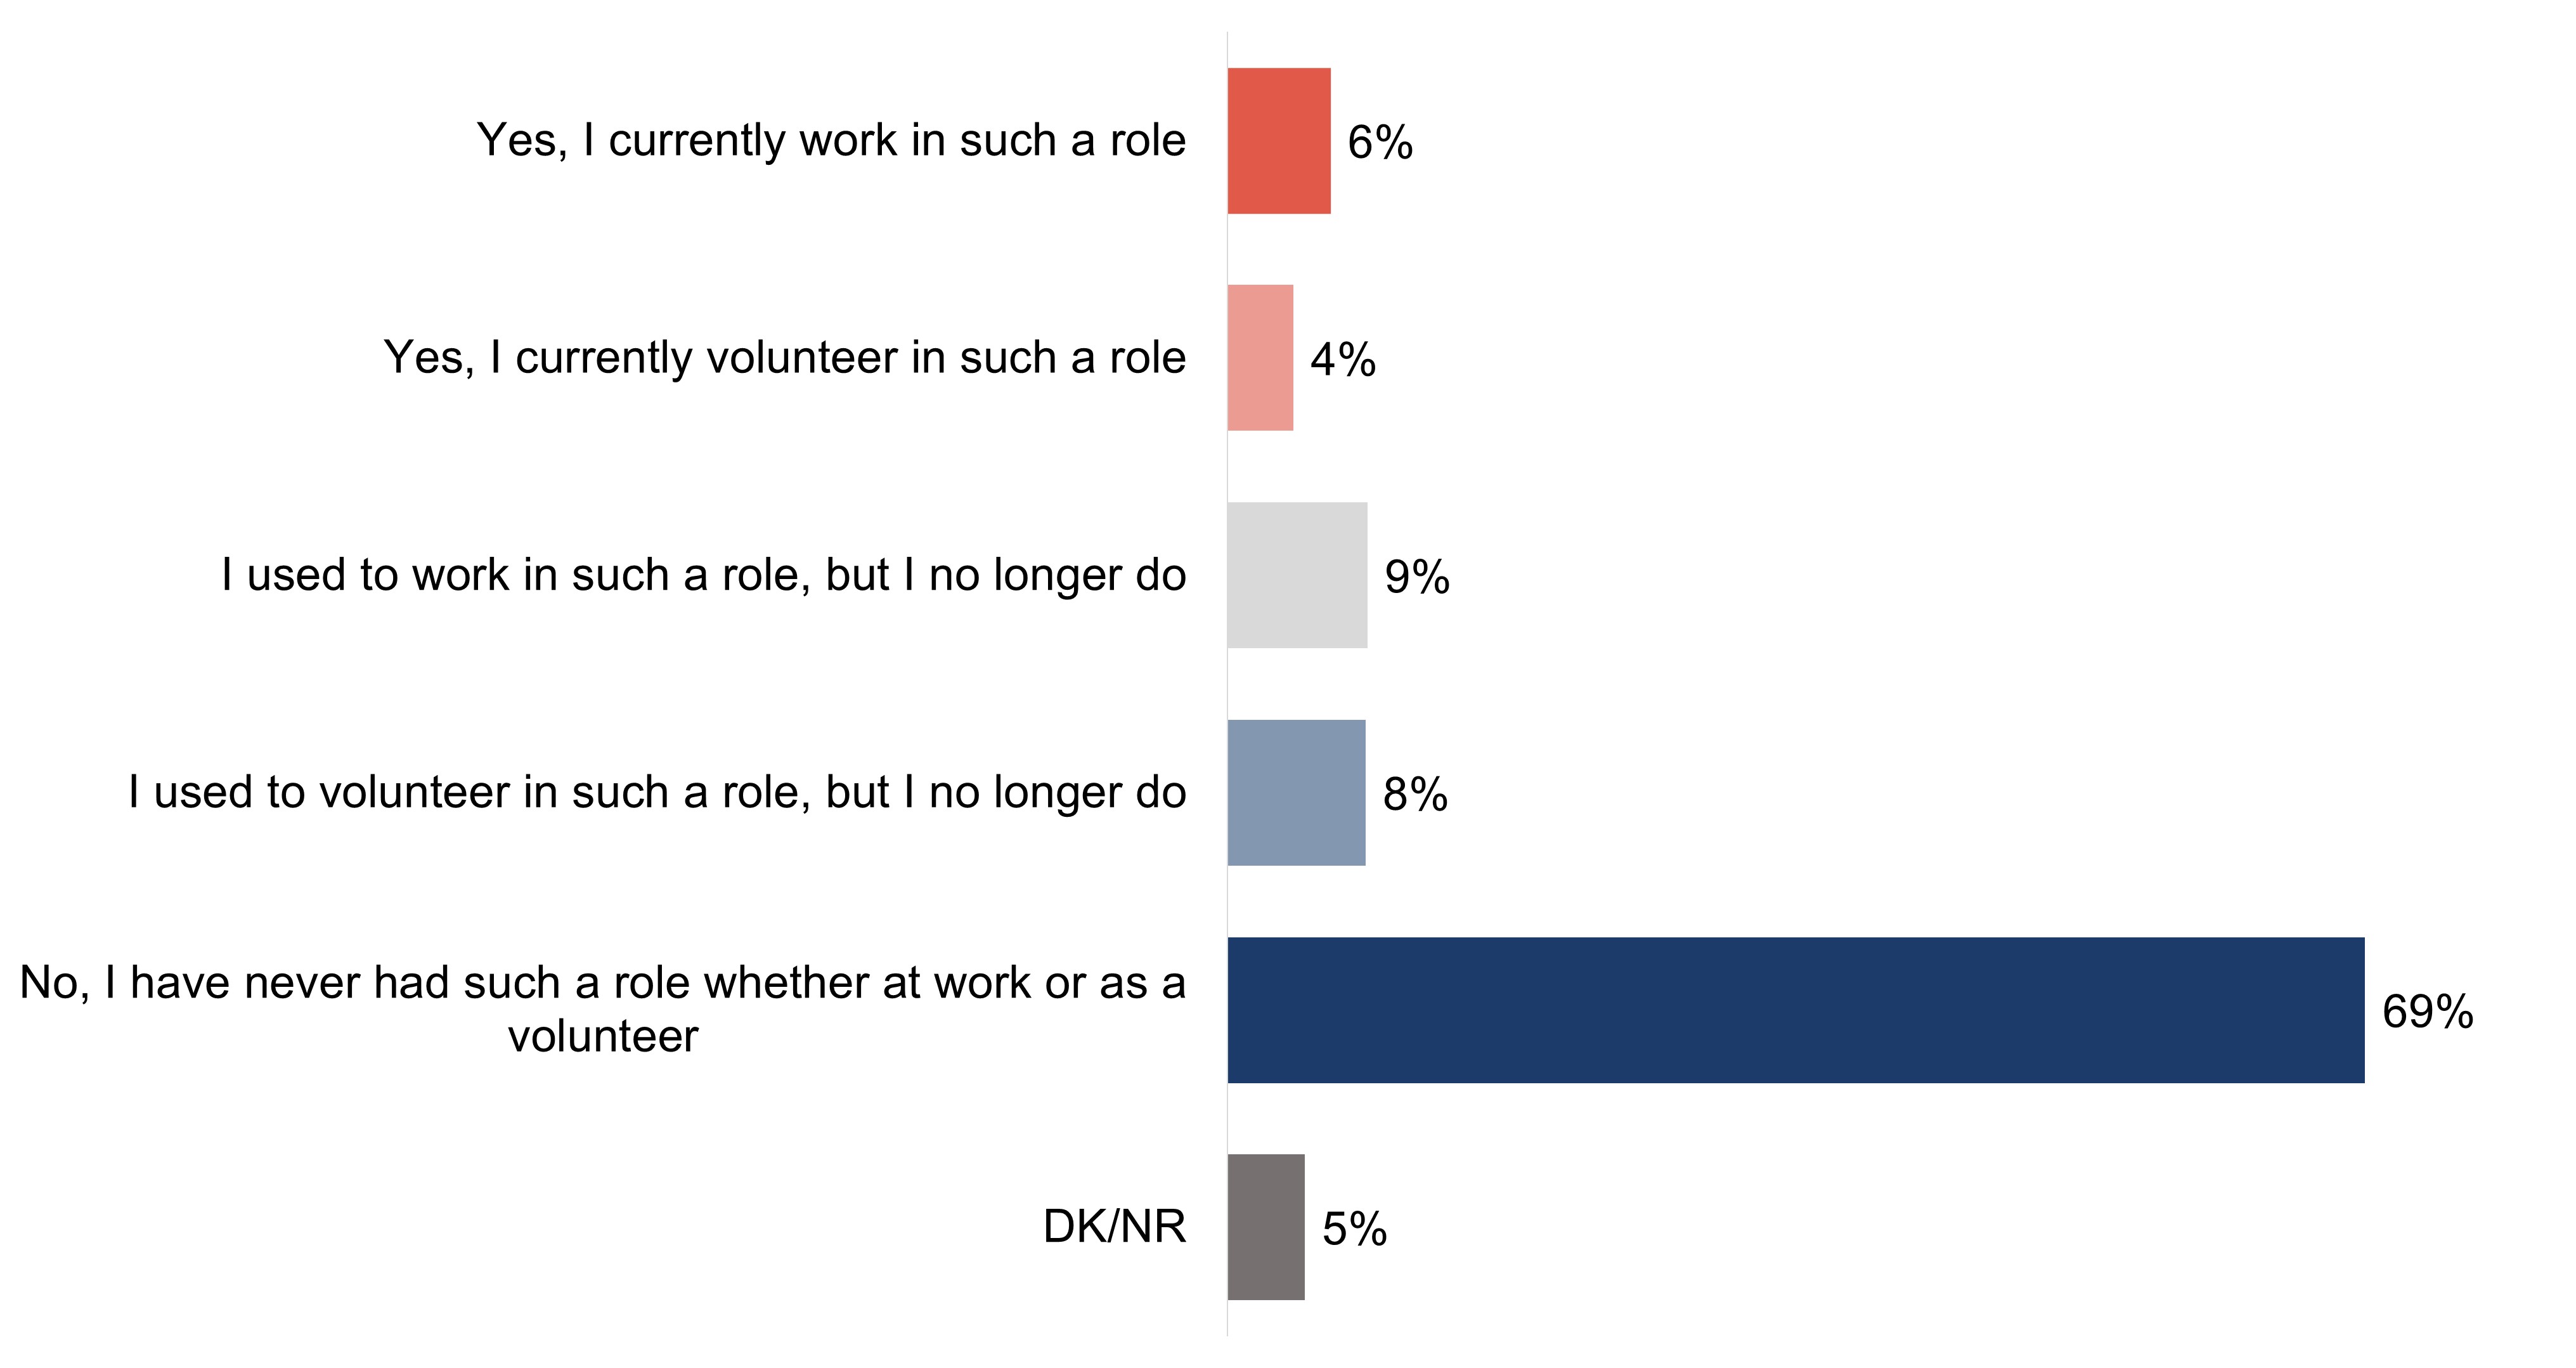
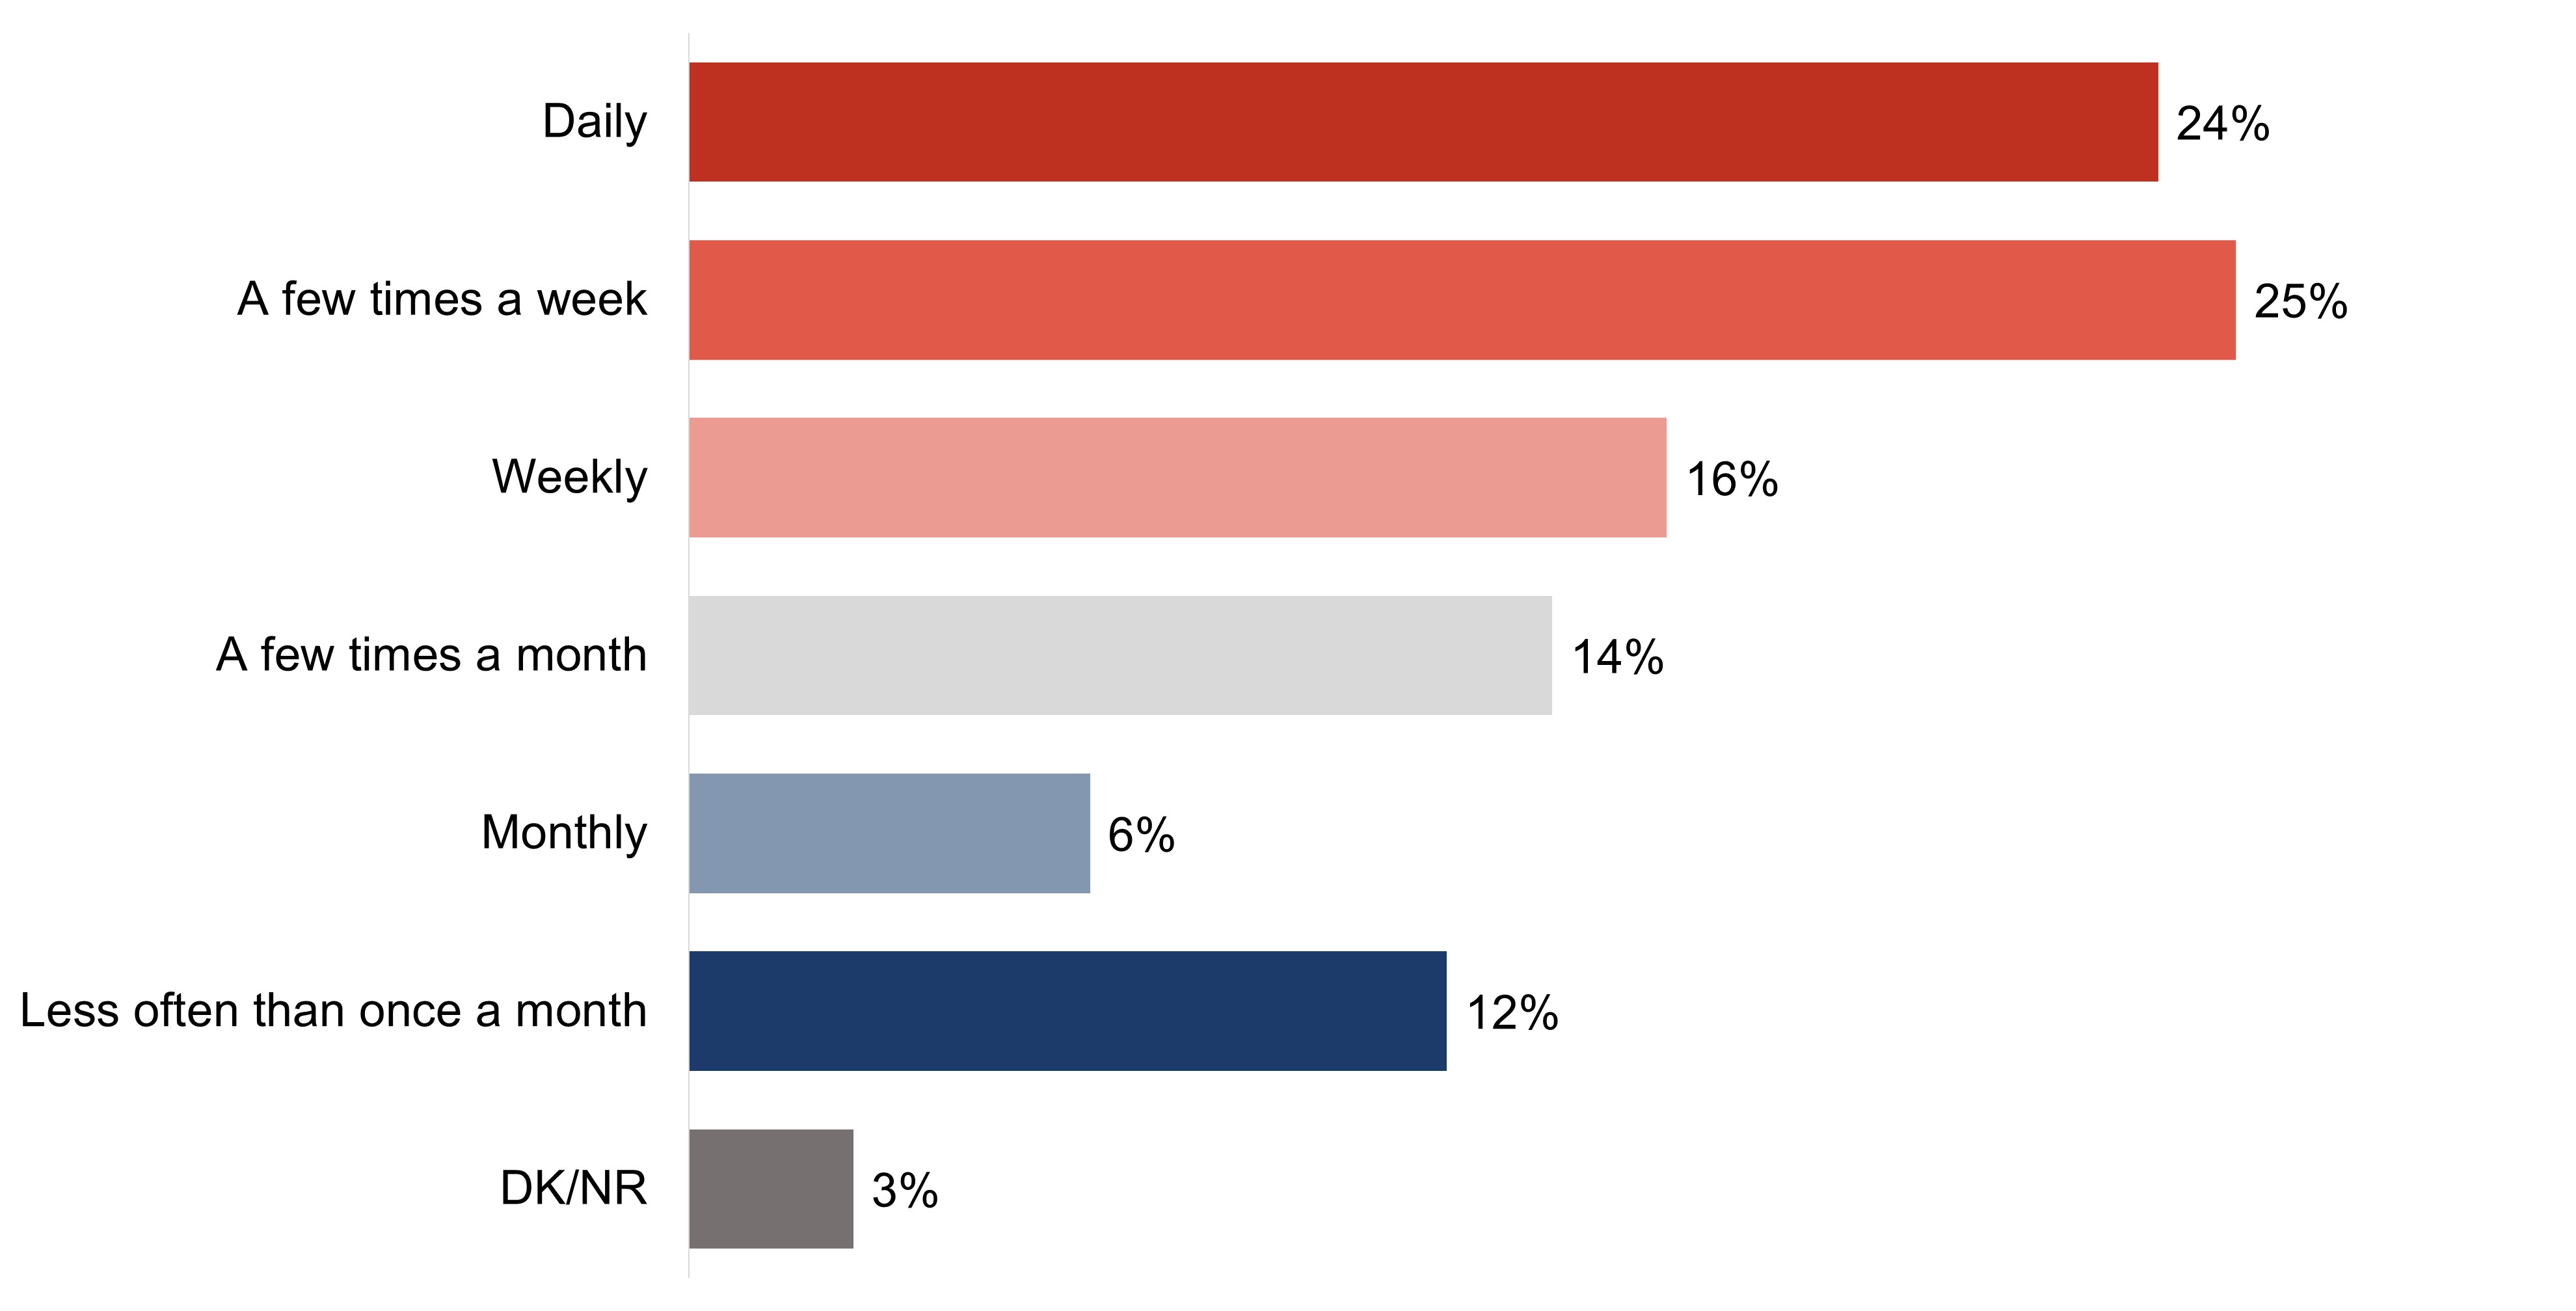
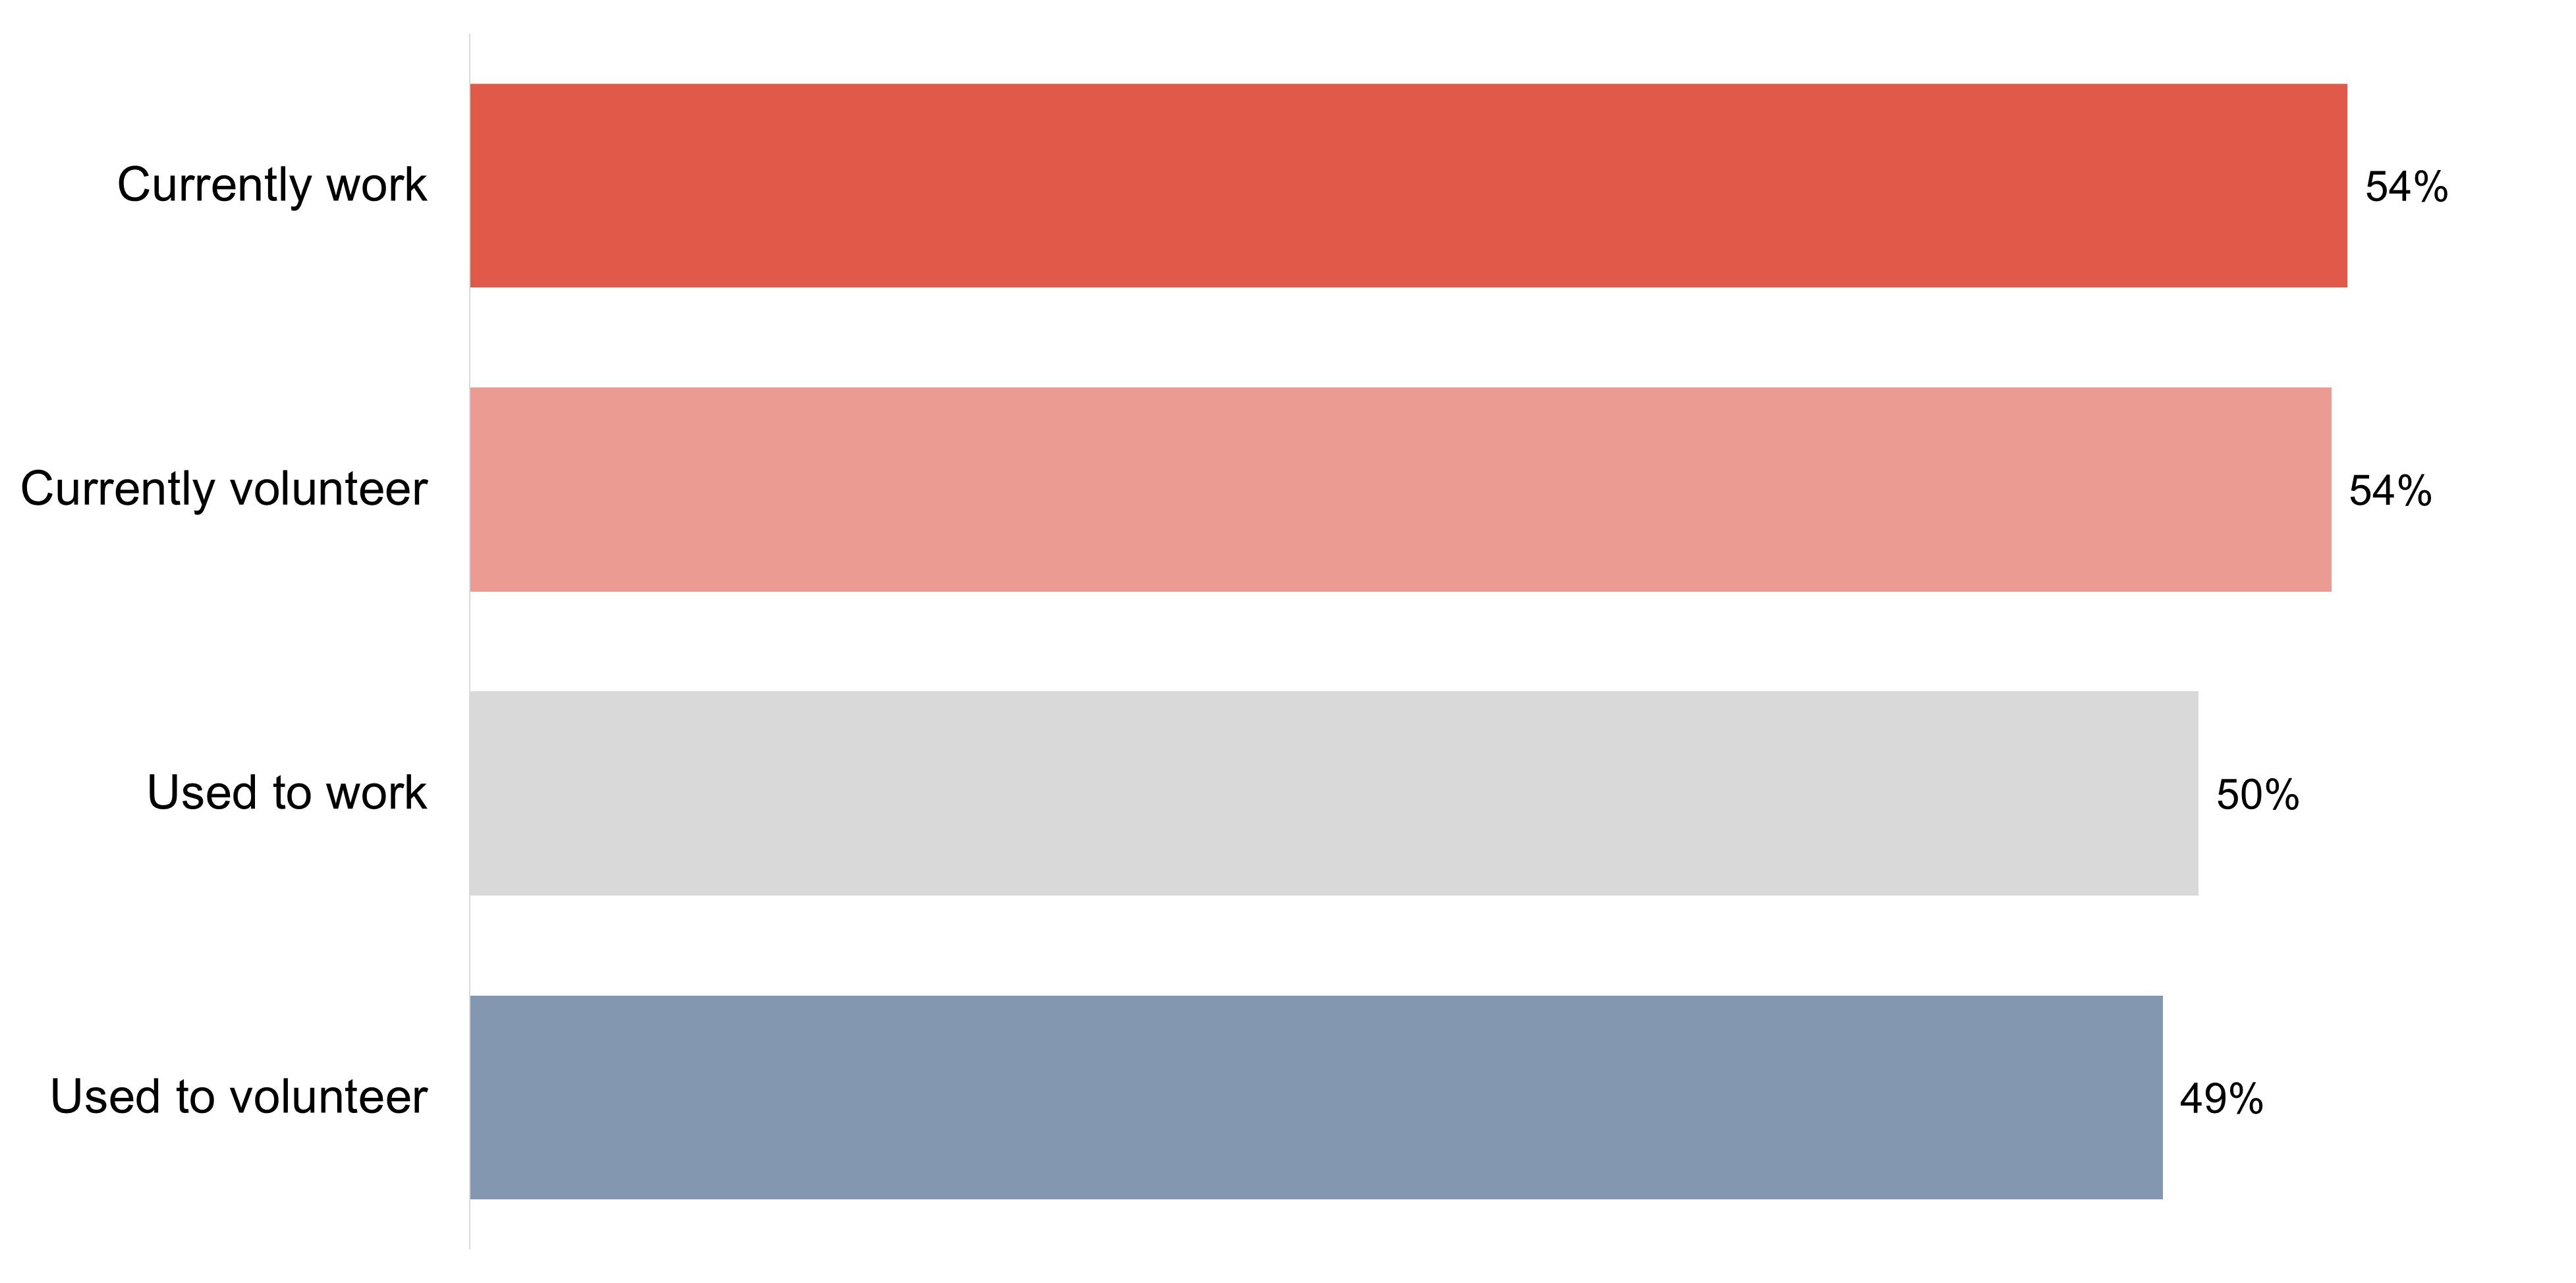
A majority of survey respondents (69%) say that they believe they have never had a role in which they have interacted or may have needed to interact with people living with dementia. However, almost one in ten say that they used to work (9%) or volunteer (8%), and fewer say that they currently work (6%) or volunteer (4%) in such a role.
Among those who do or may have had a role that may have required them to interact with people living with dementia, nearly half (49%) did/do more than weekly, 30% did/do a few time times a month to weekly, and 18% did/do so once a month or less.
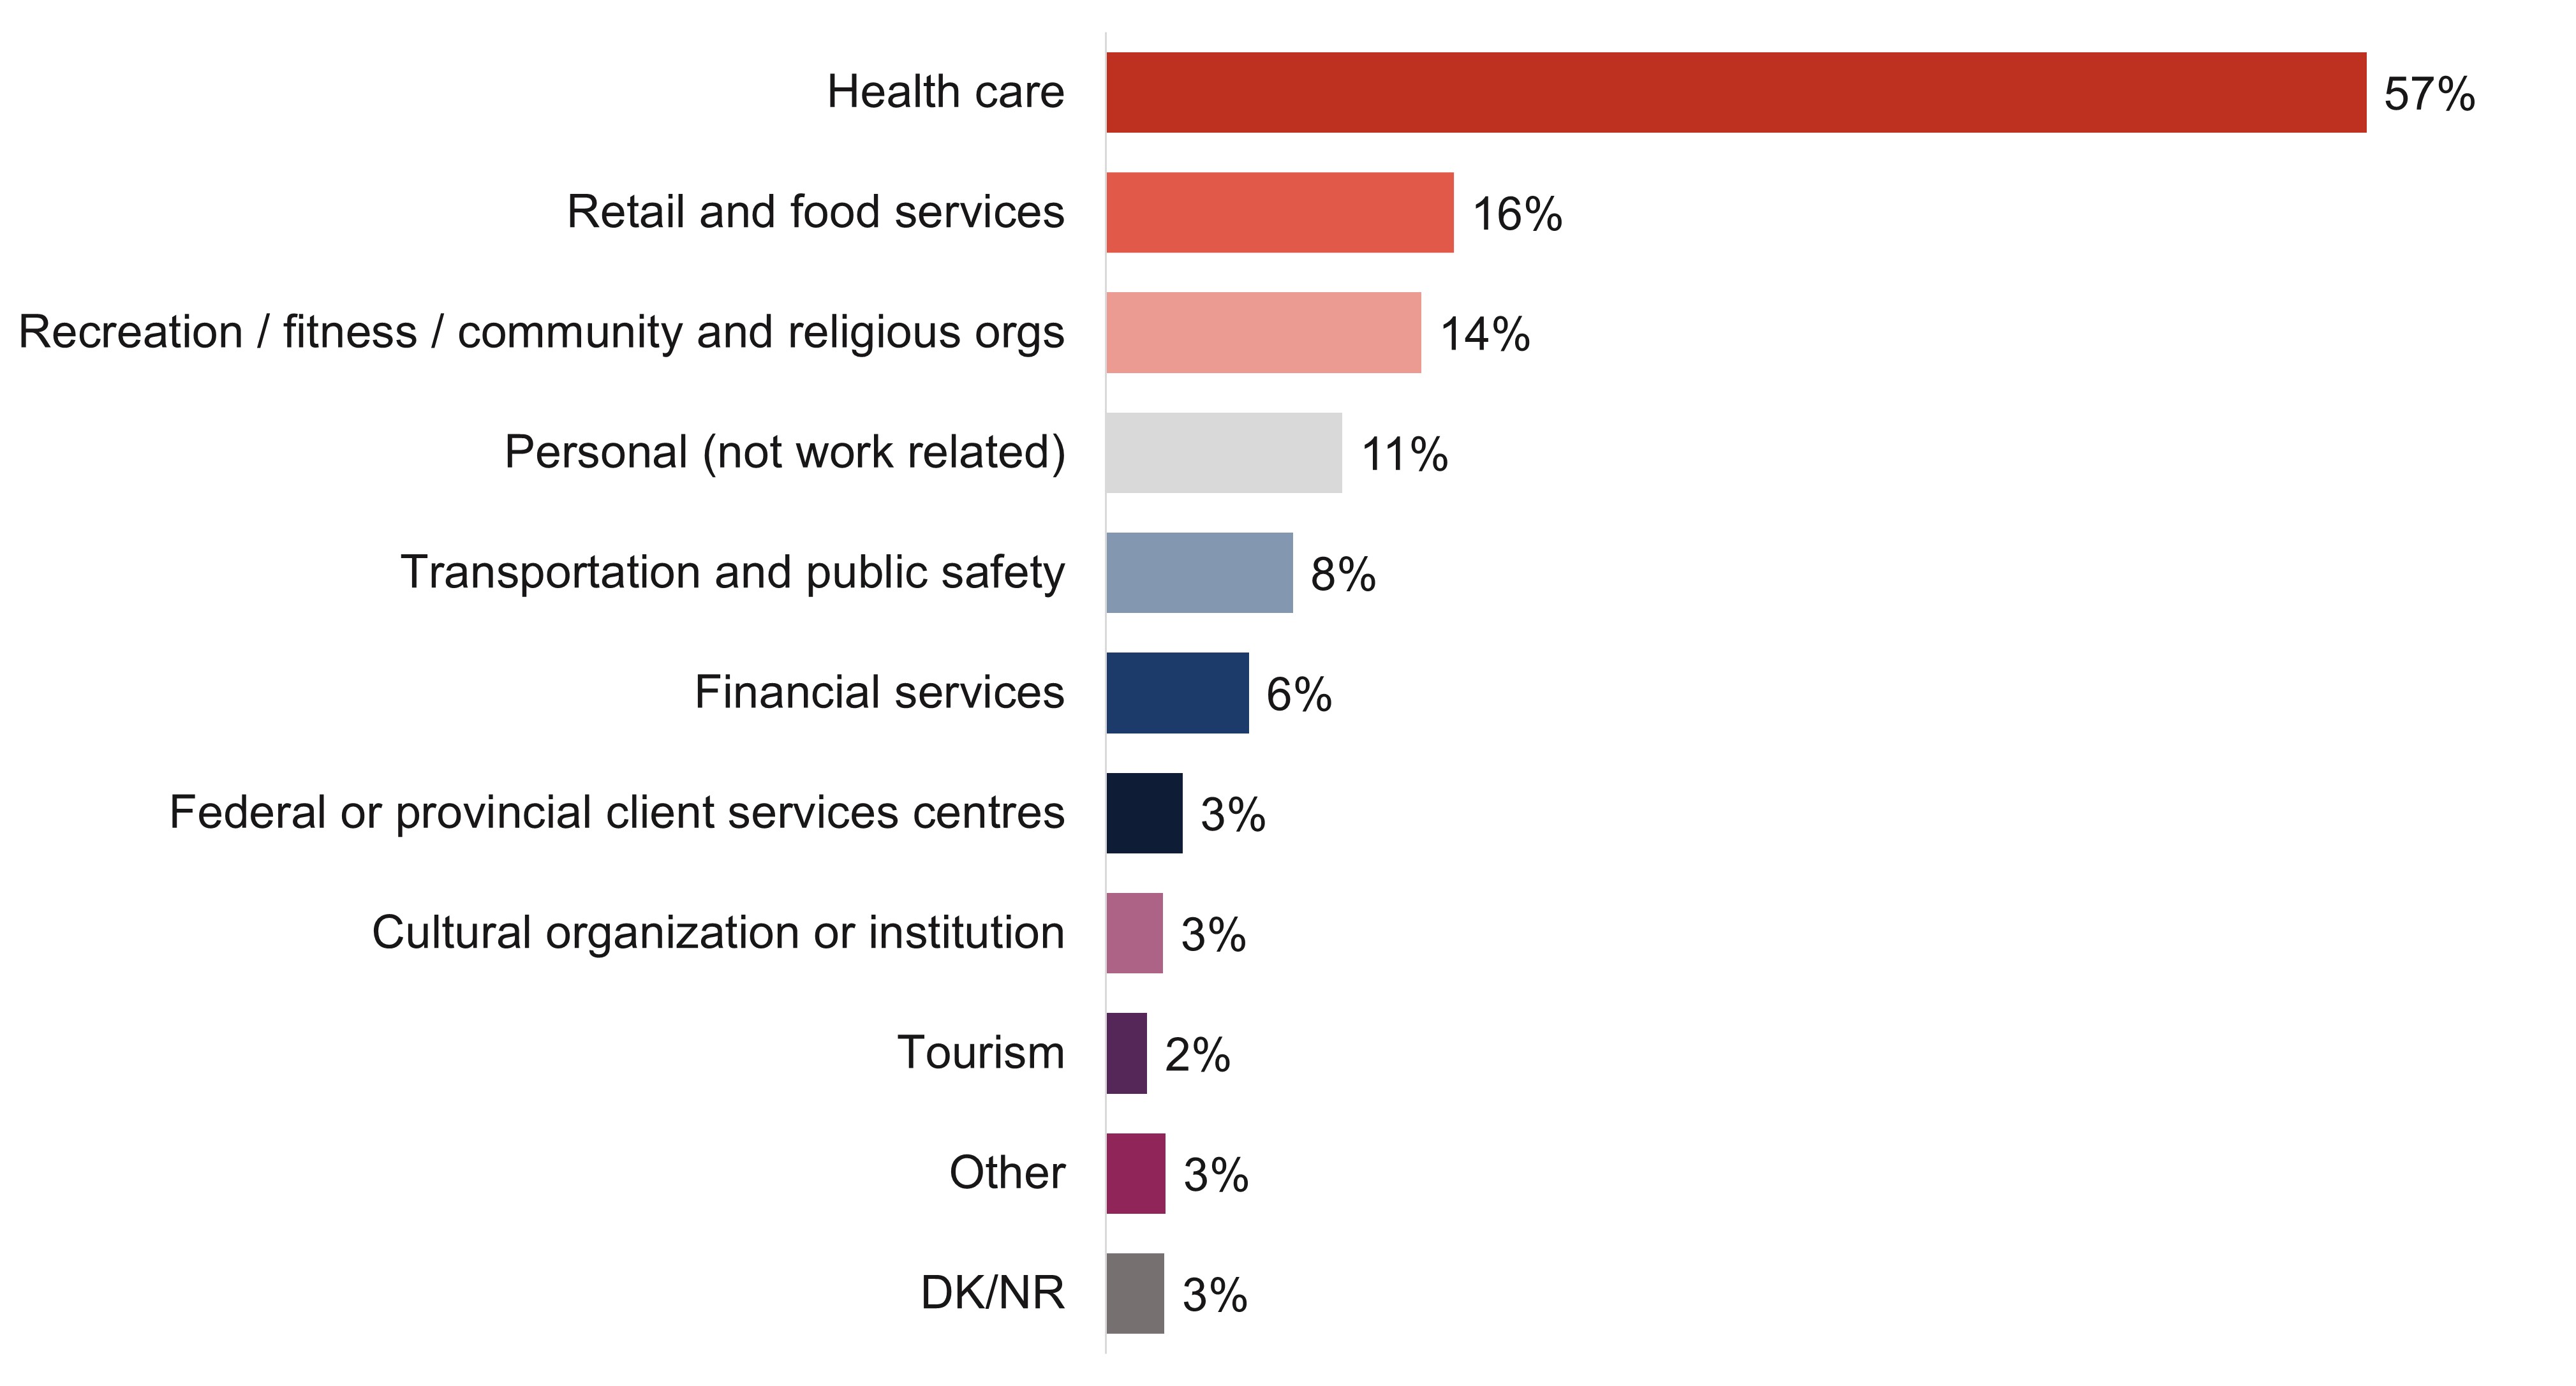
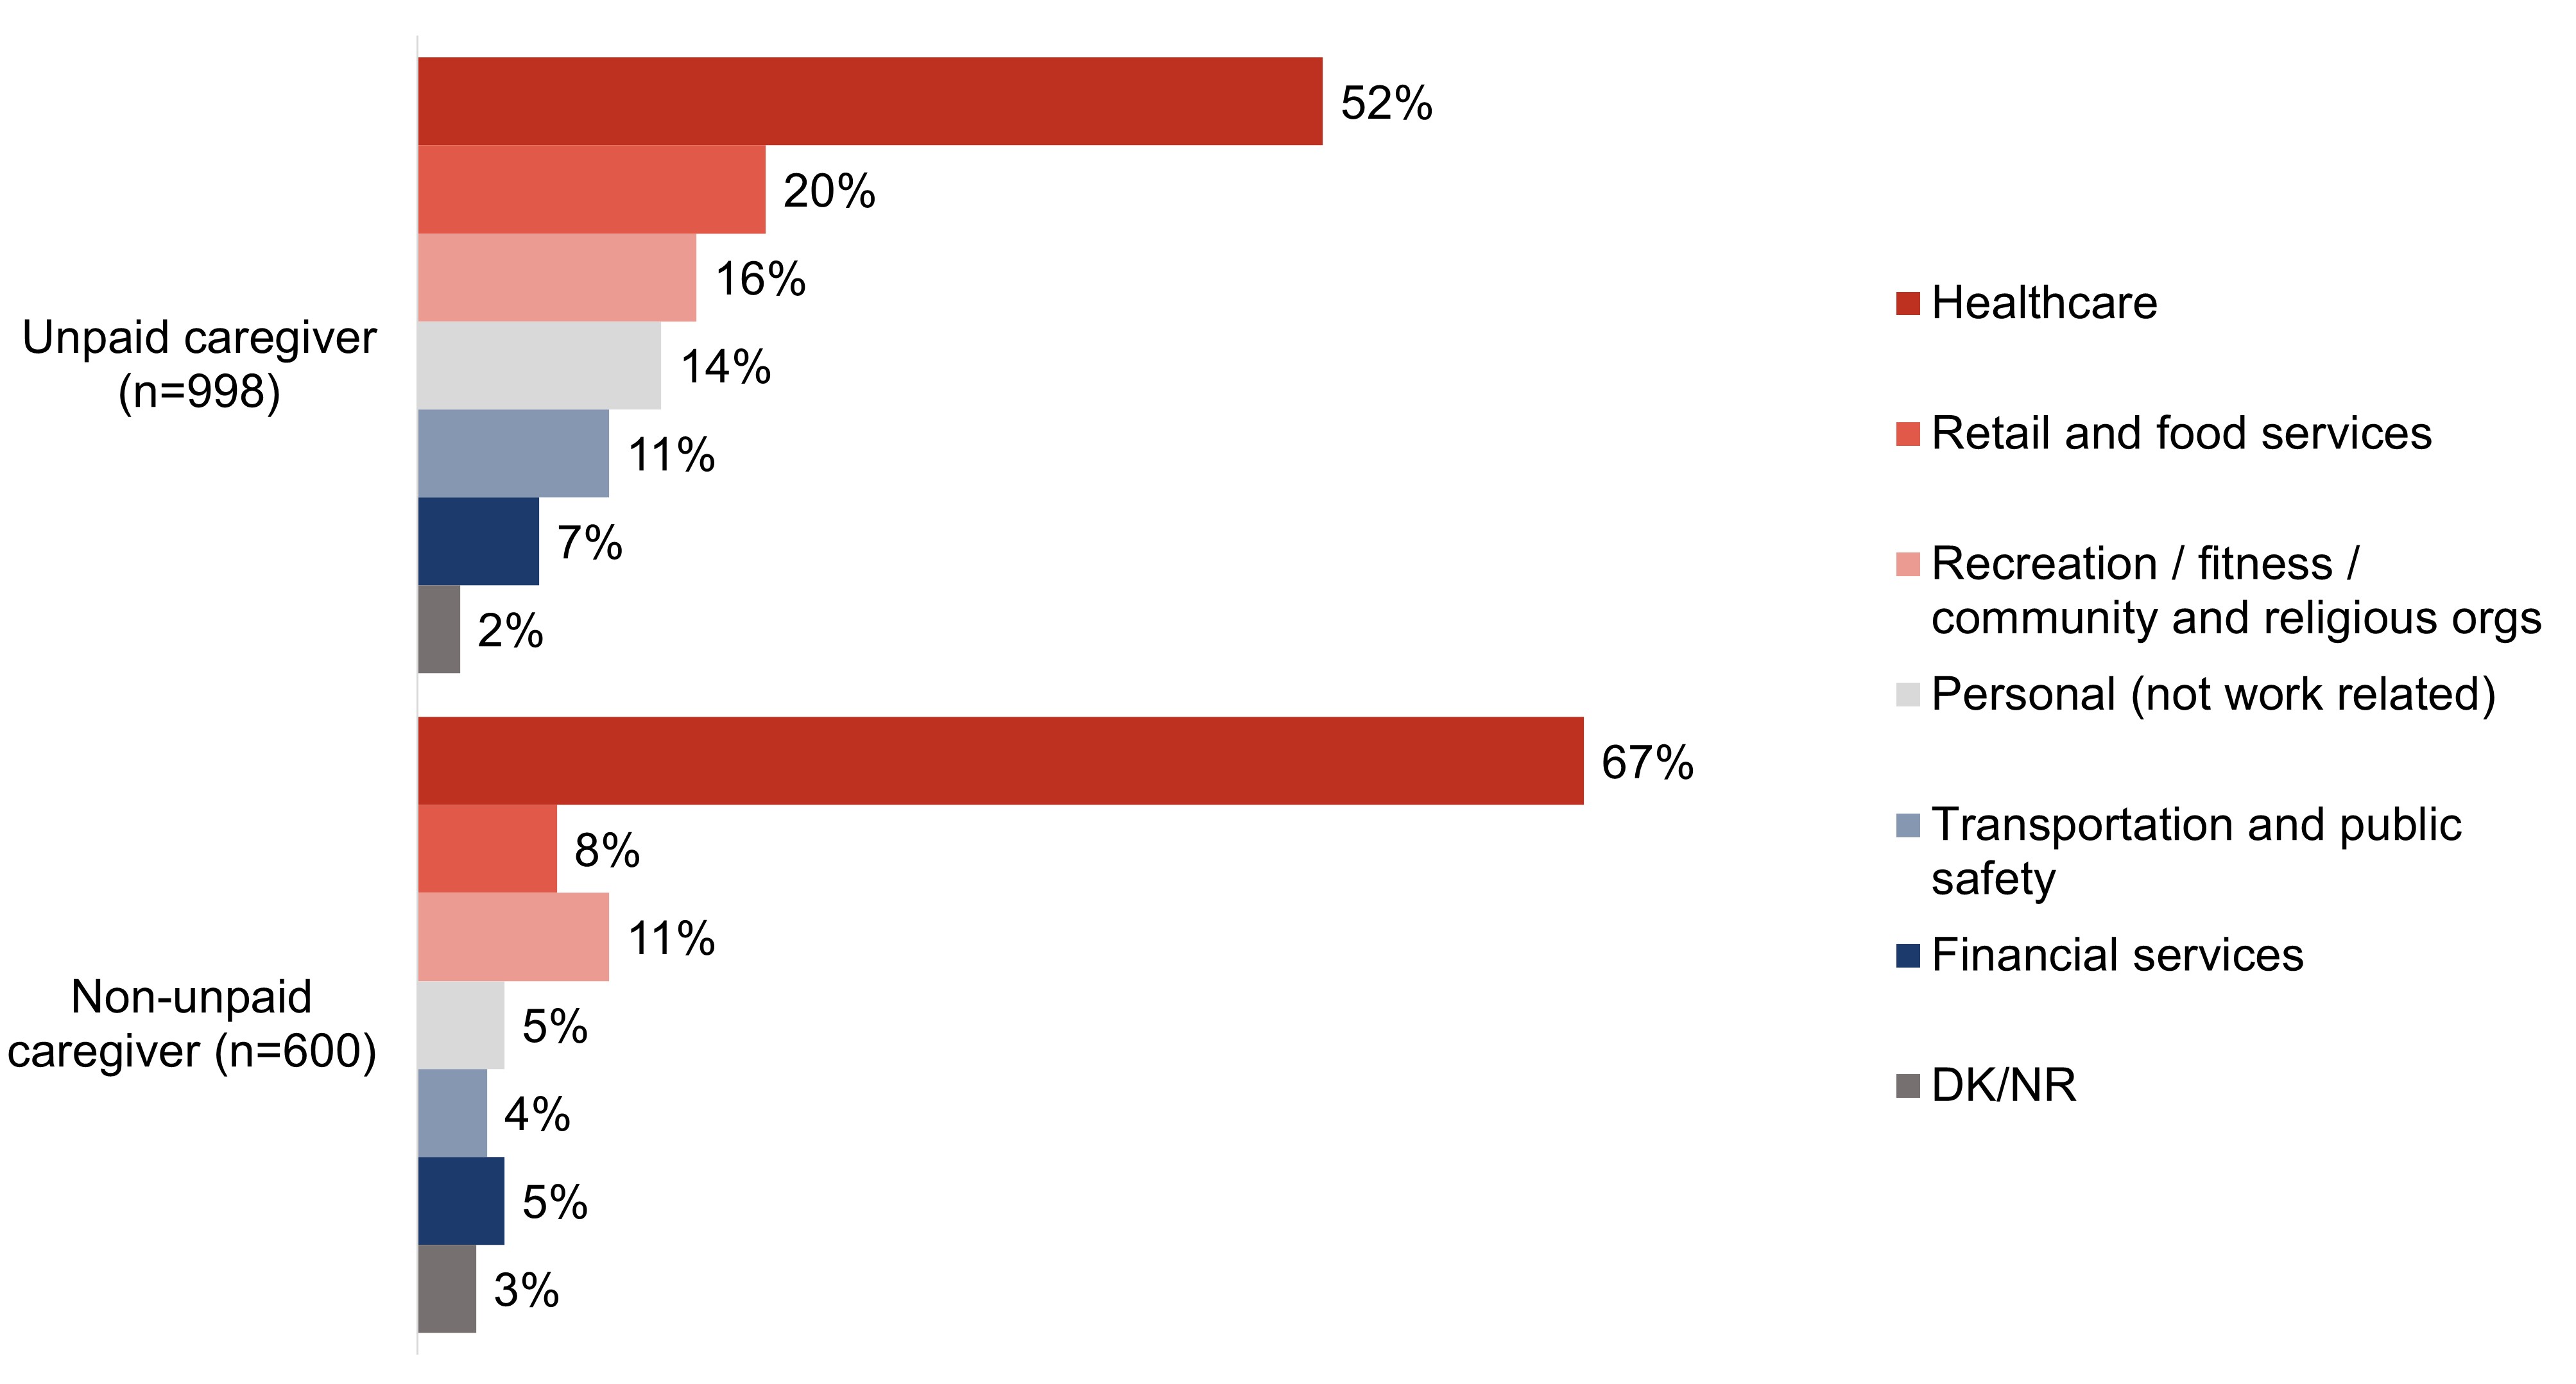
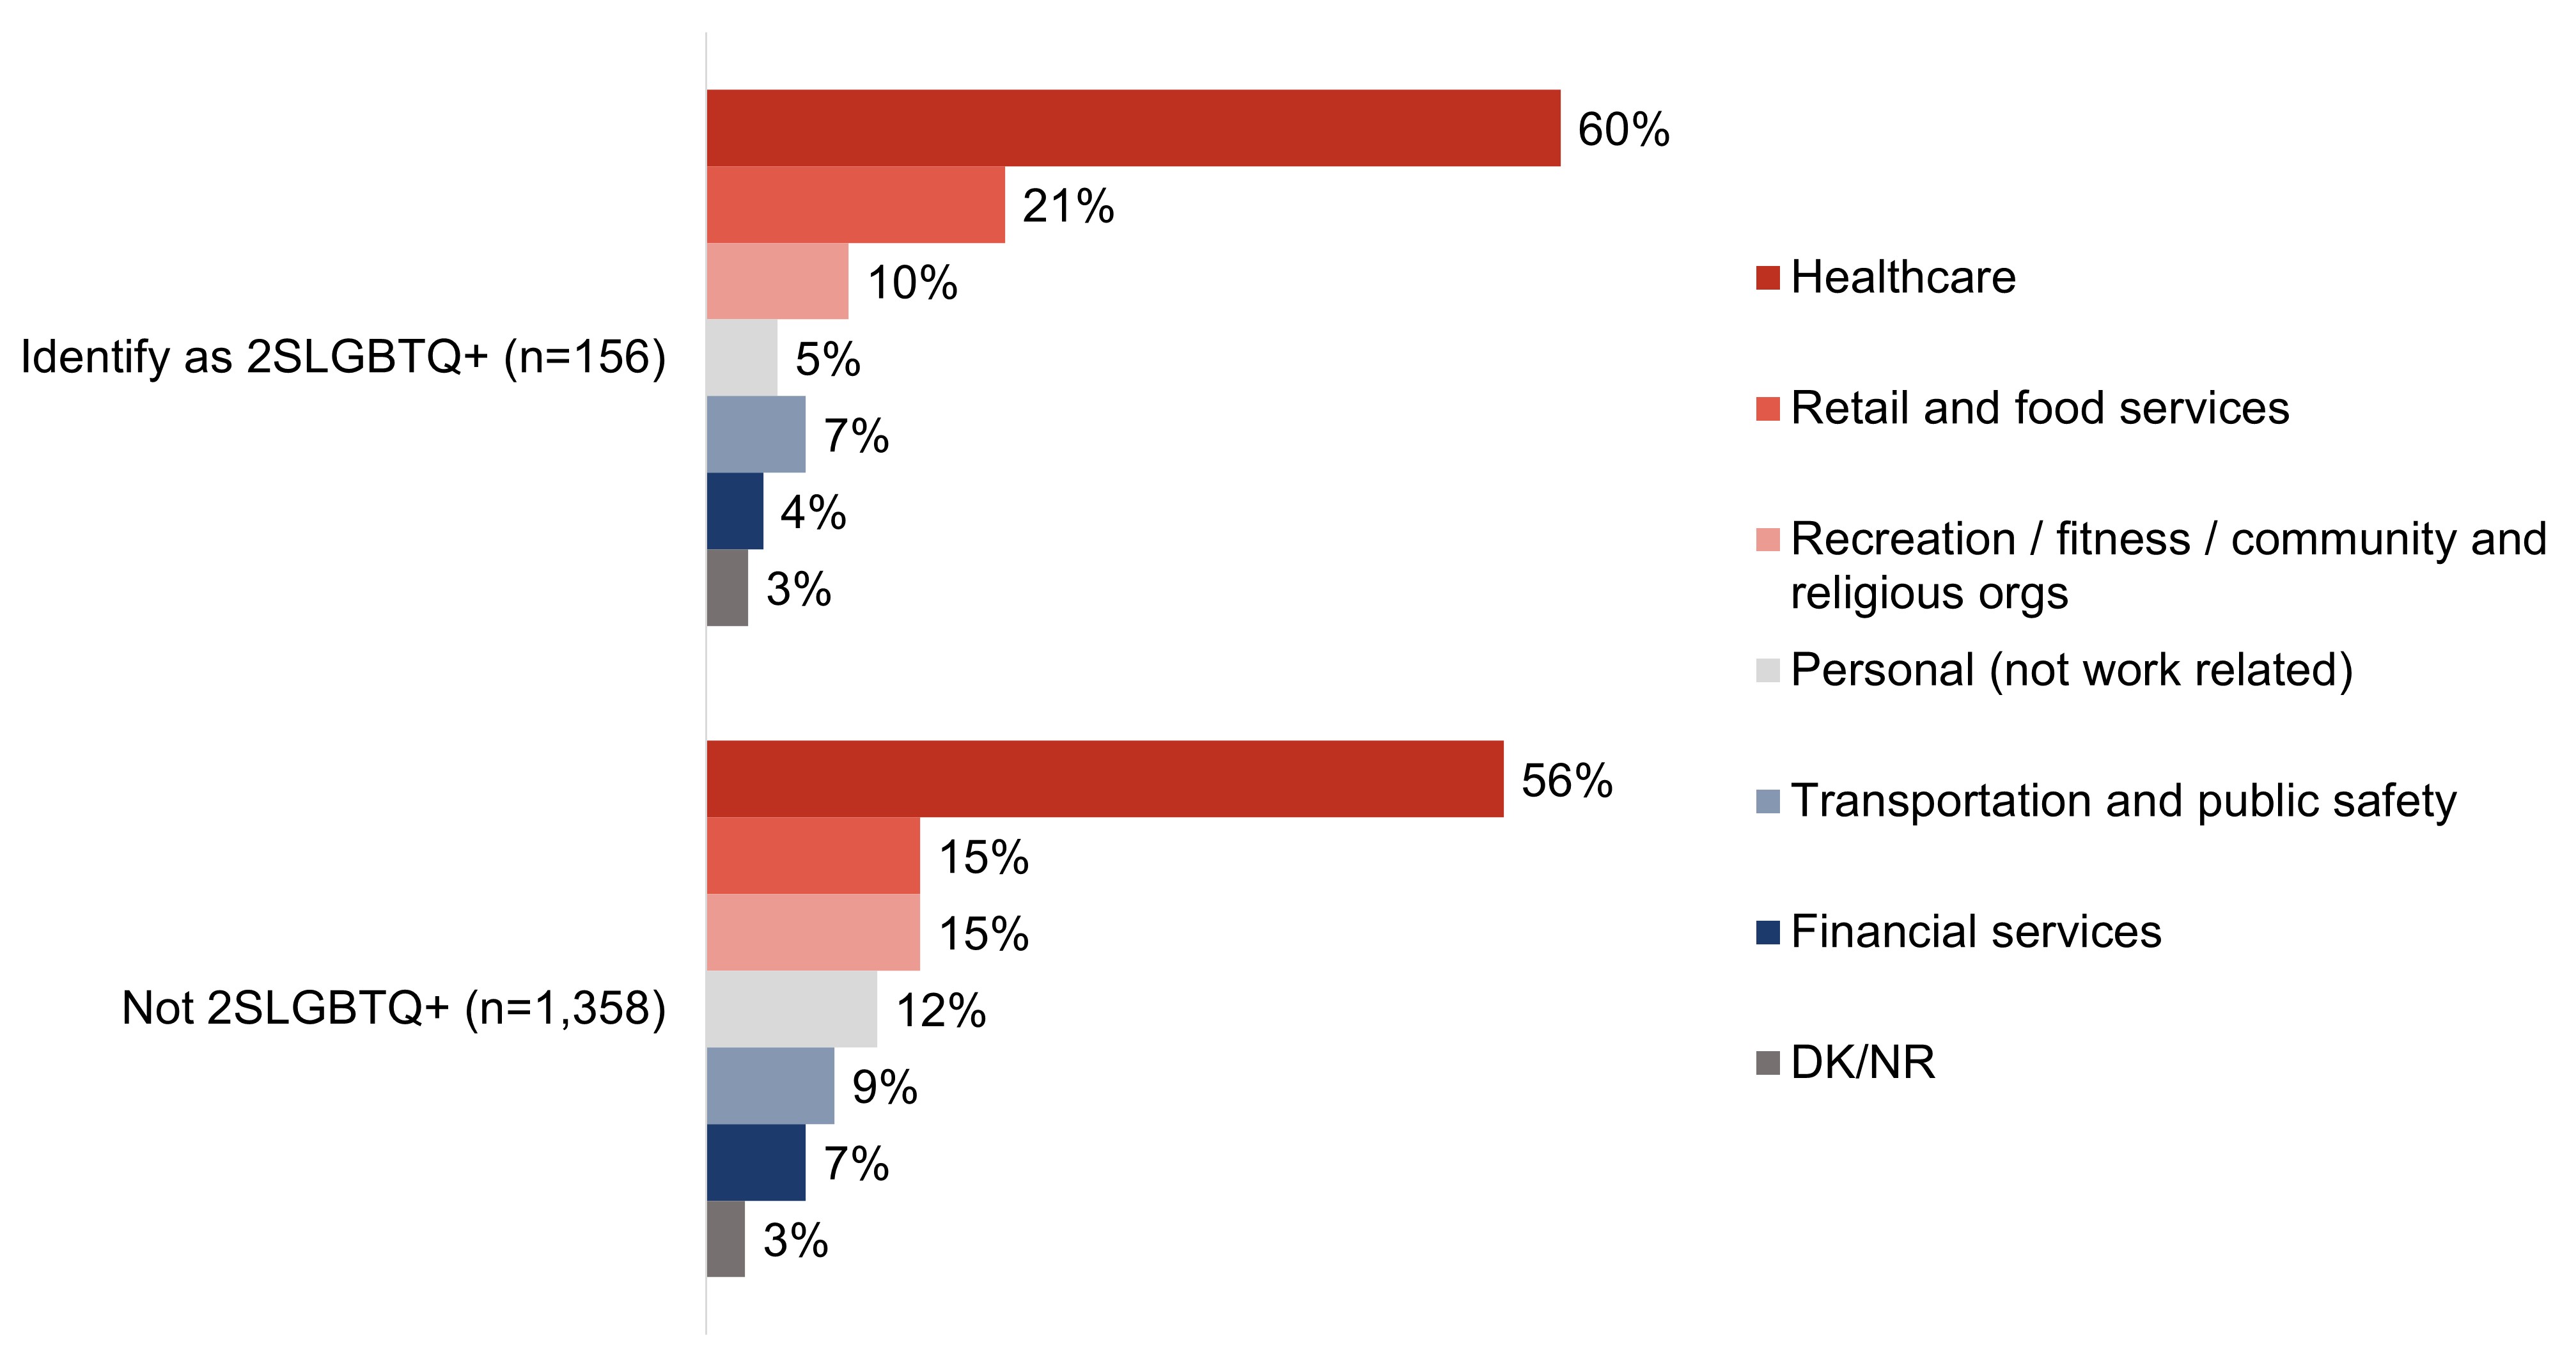
Over half (57%) of survey respondents who have experience interacting with people living with dementia did so in the healthcare field. Fewer do/did in retail and food services (16%), recreation, fitness, community and religious organizations (14%), transportation and public safety (8%), or financial services (6%).
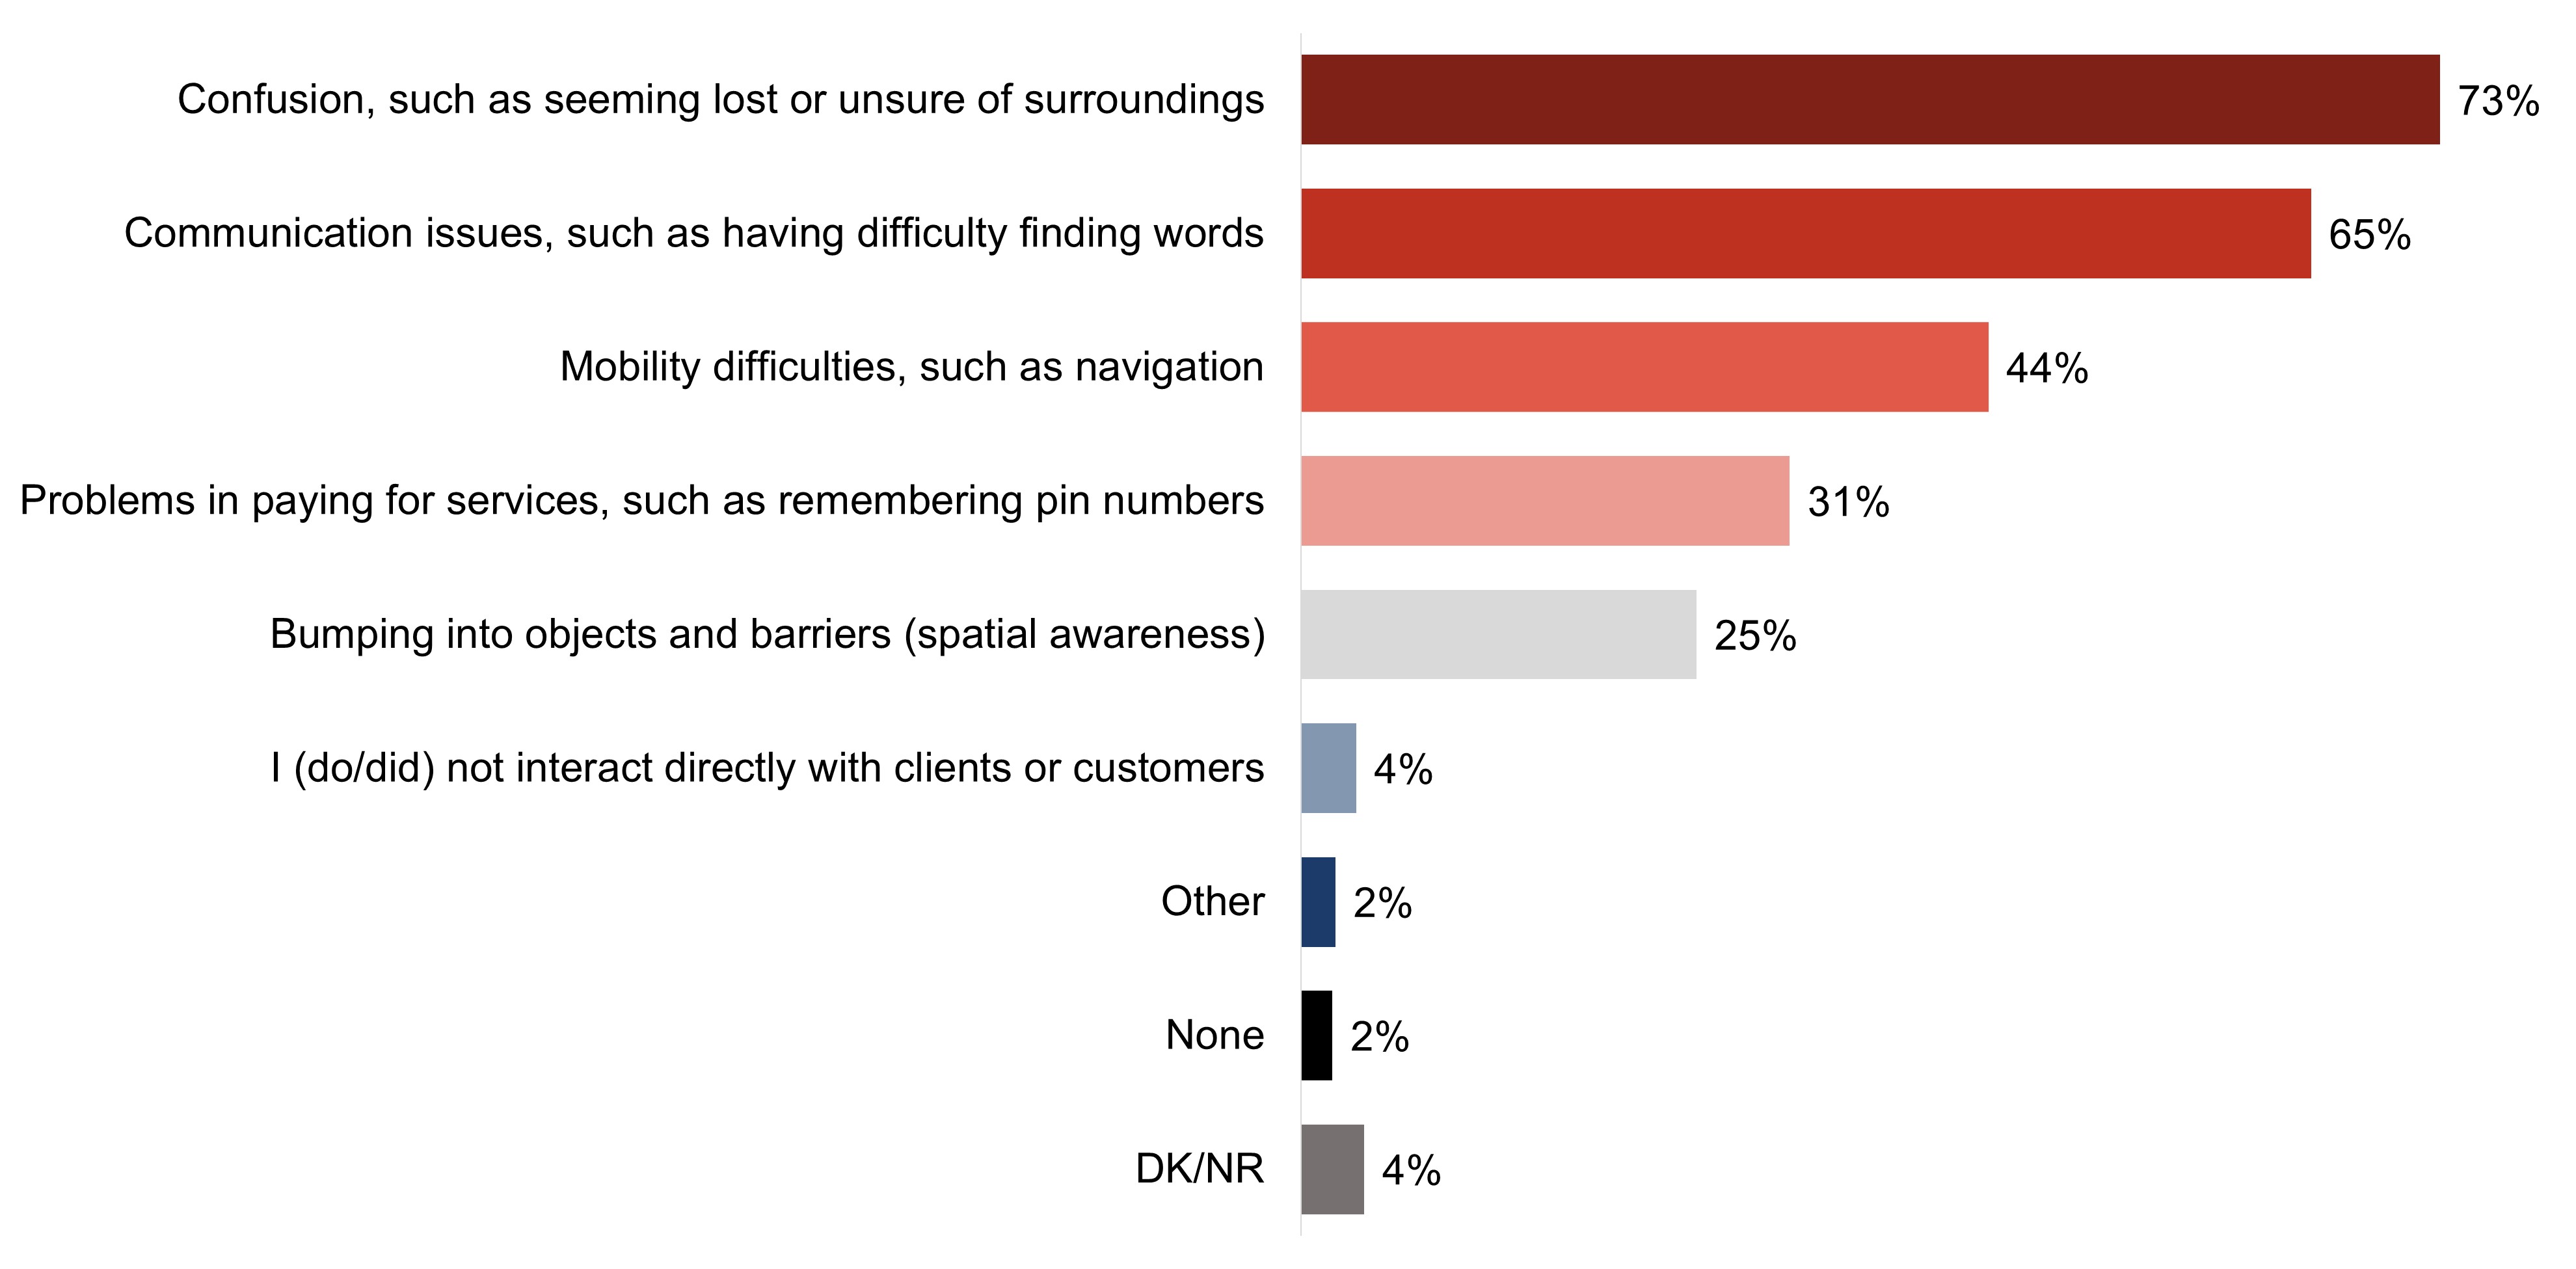
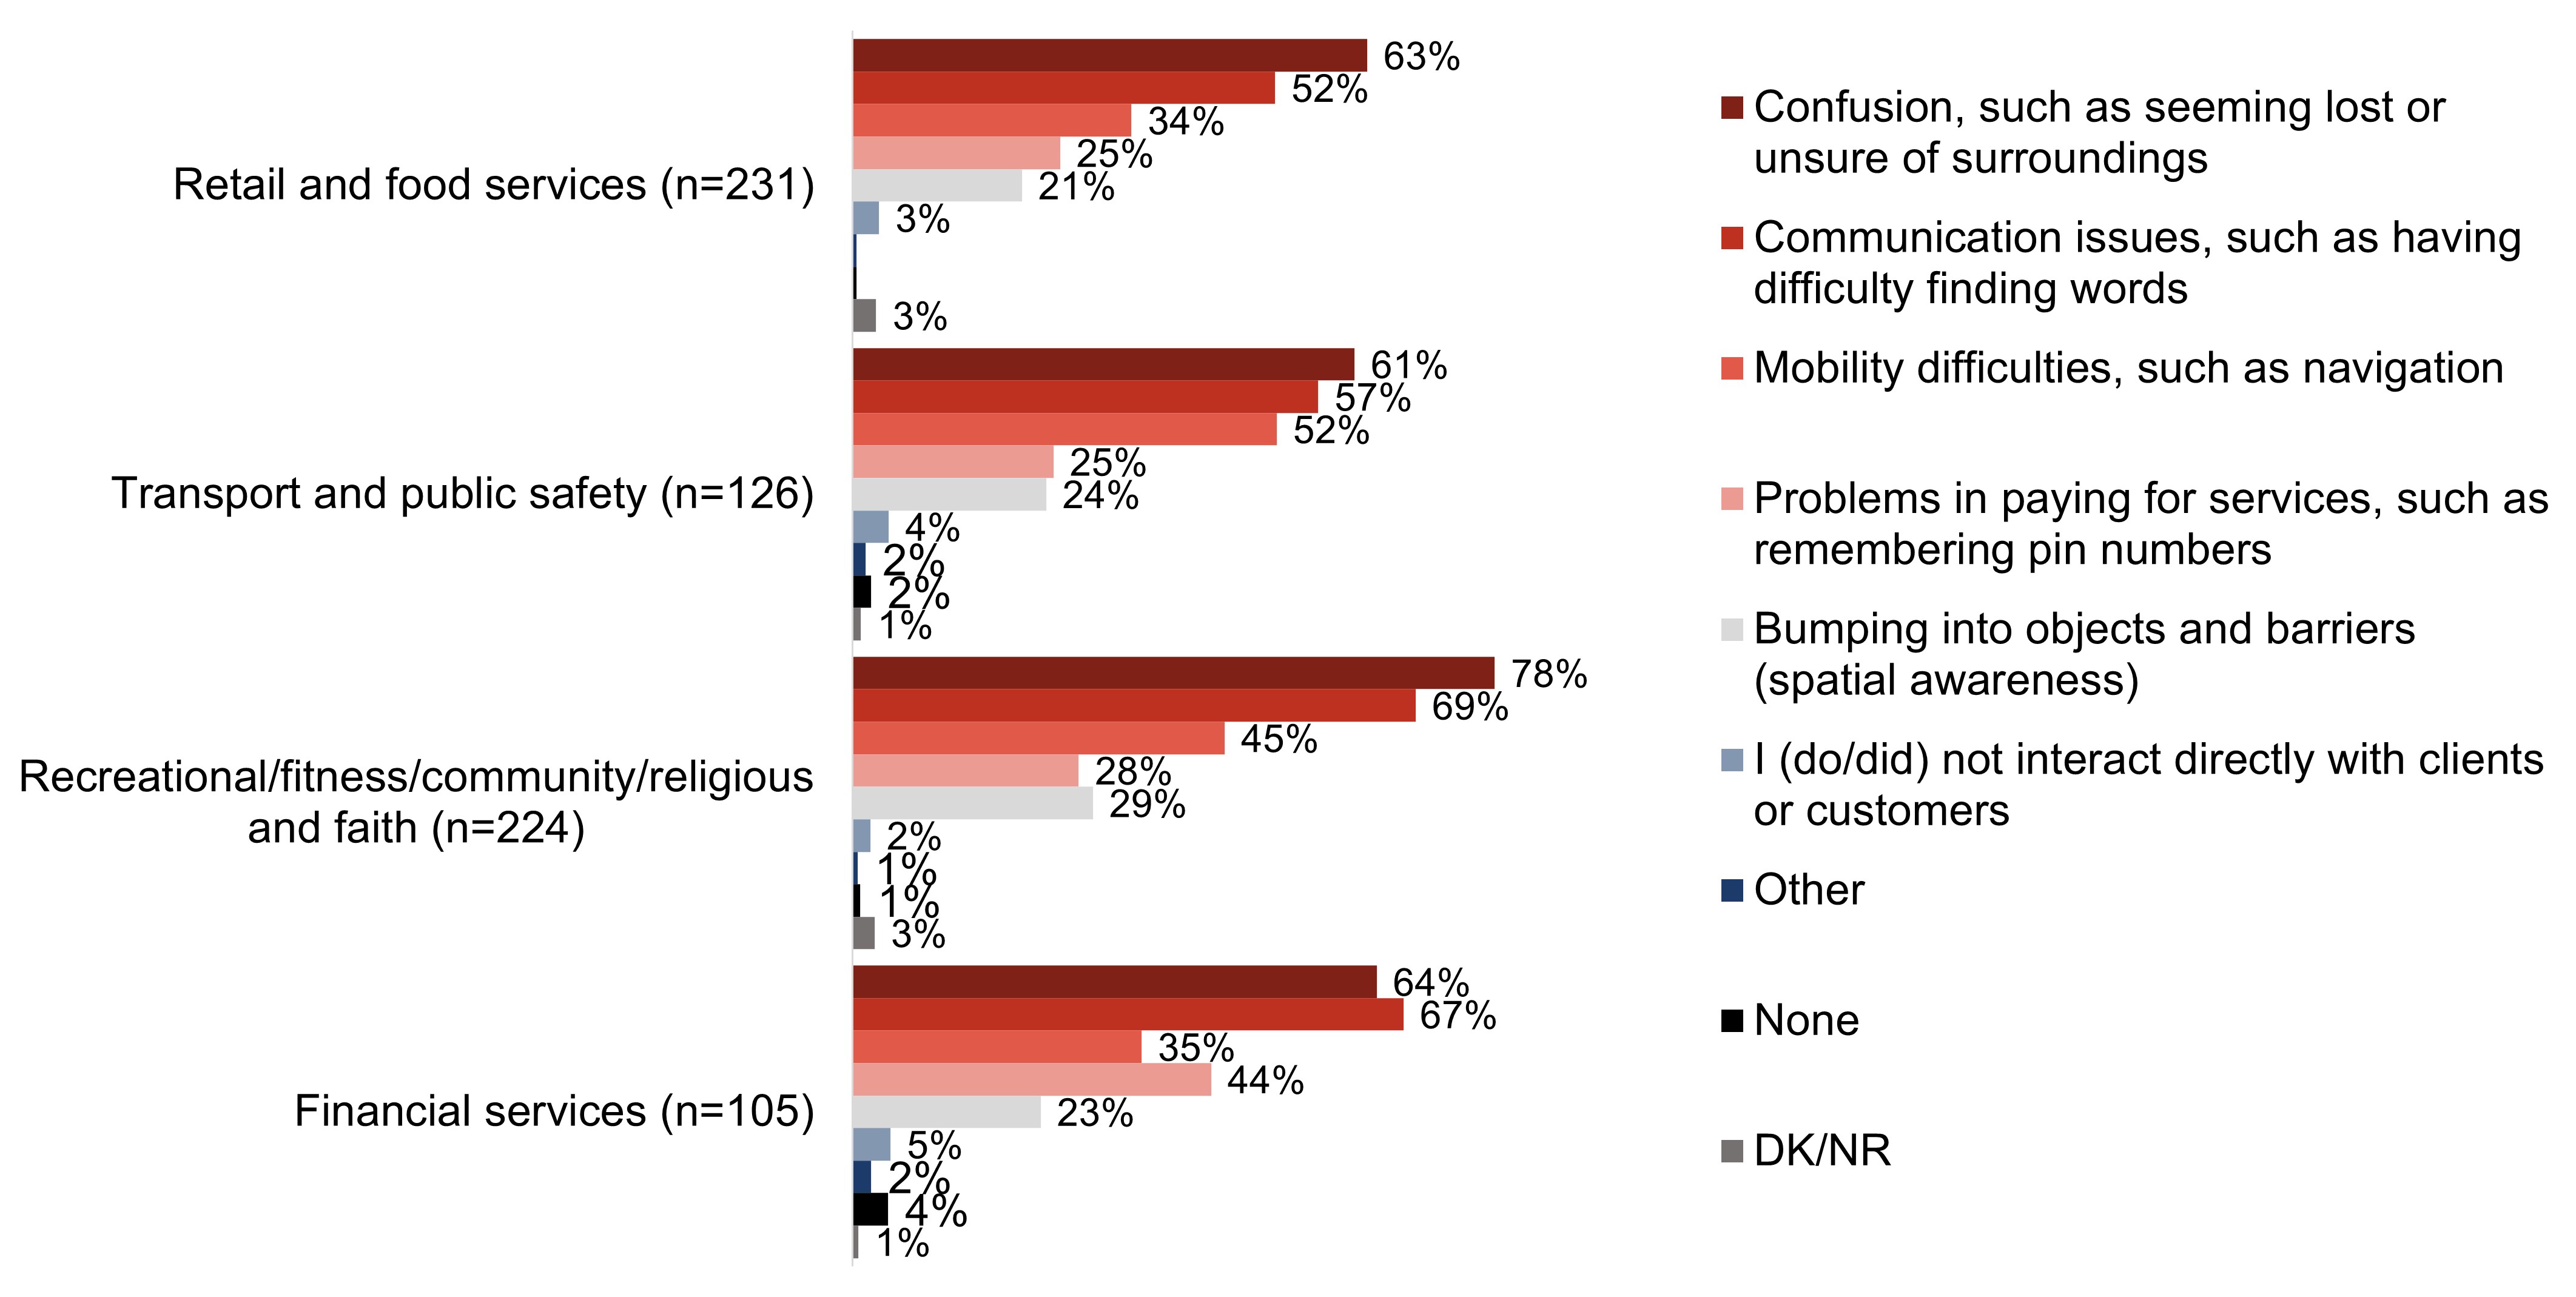
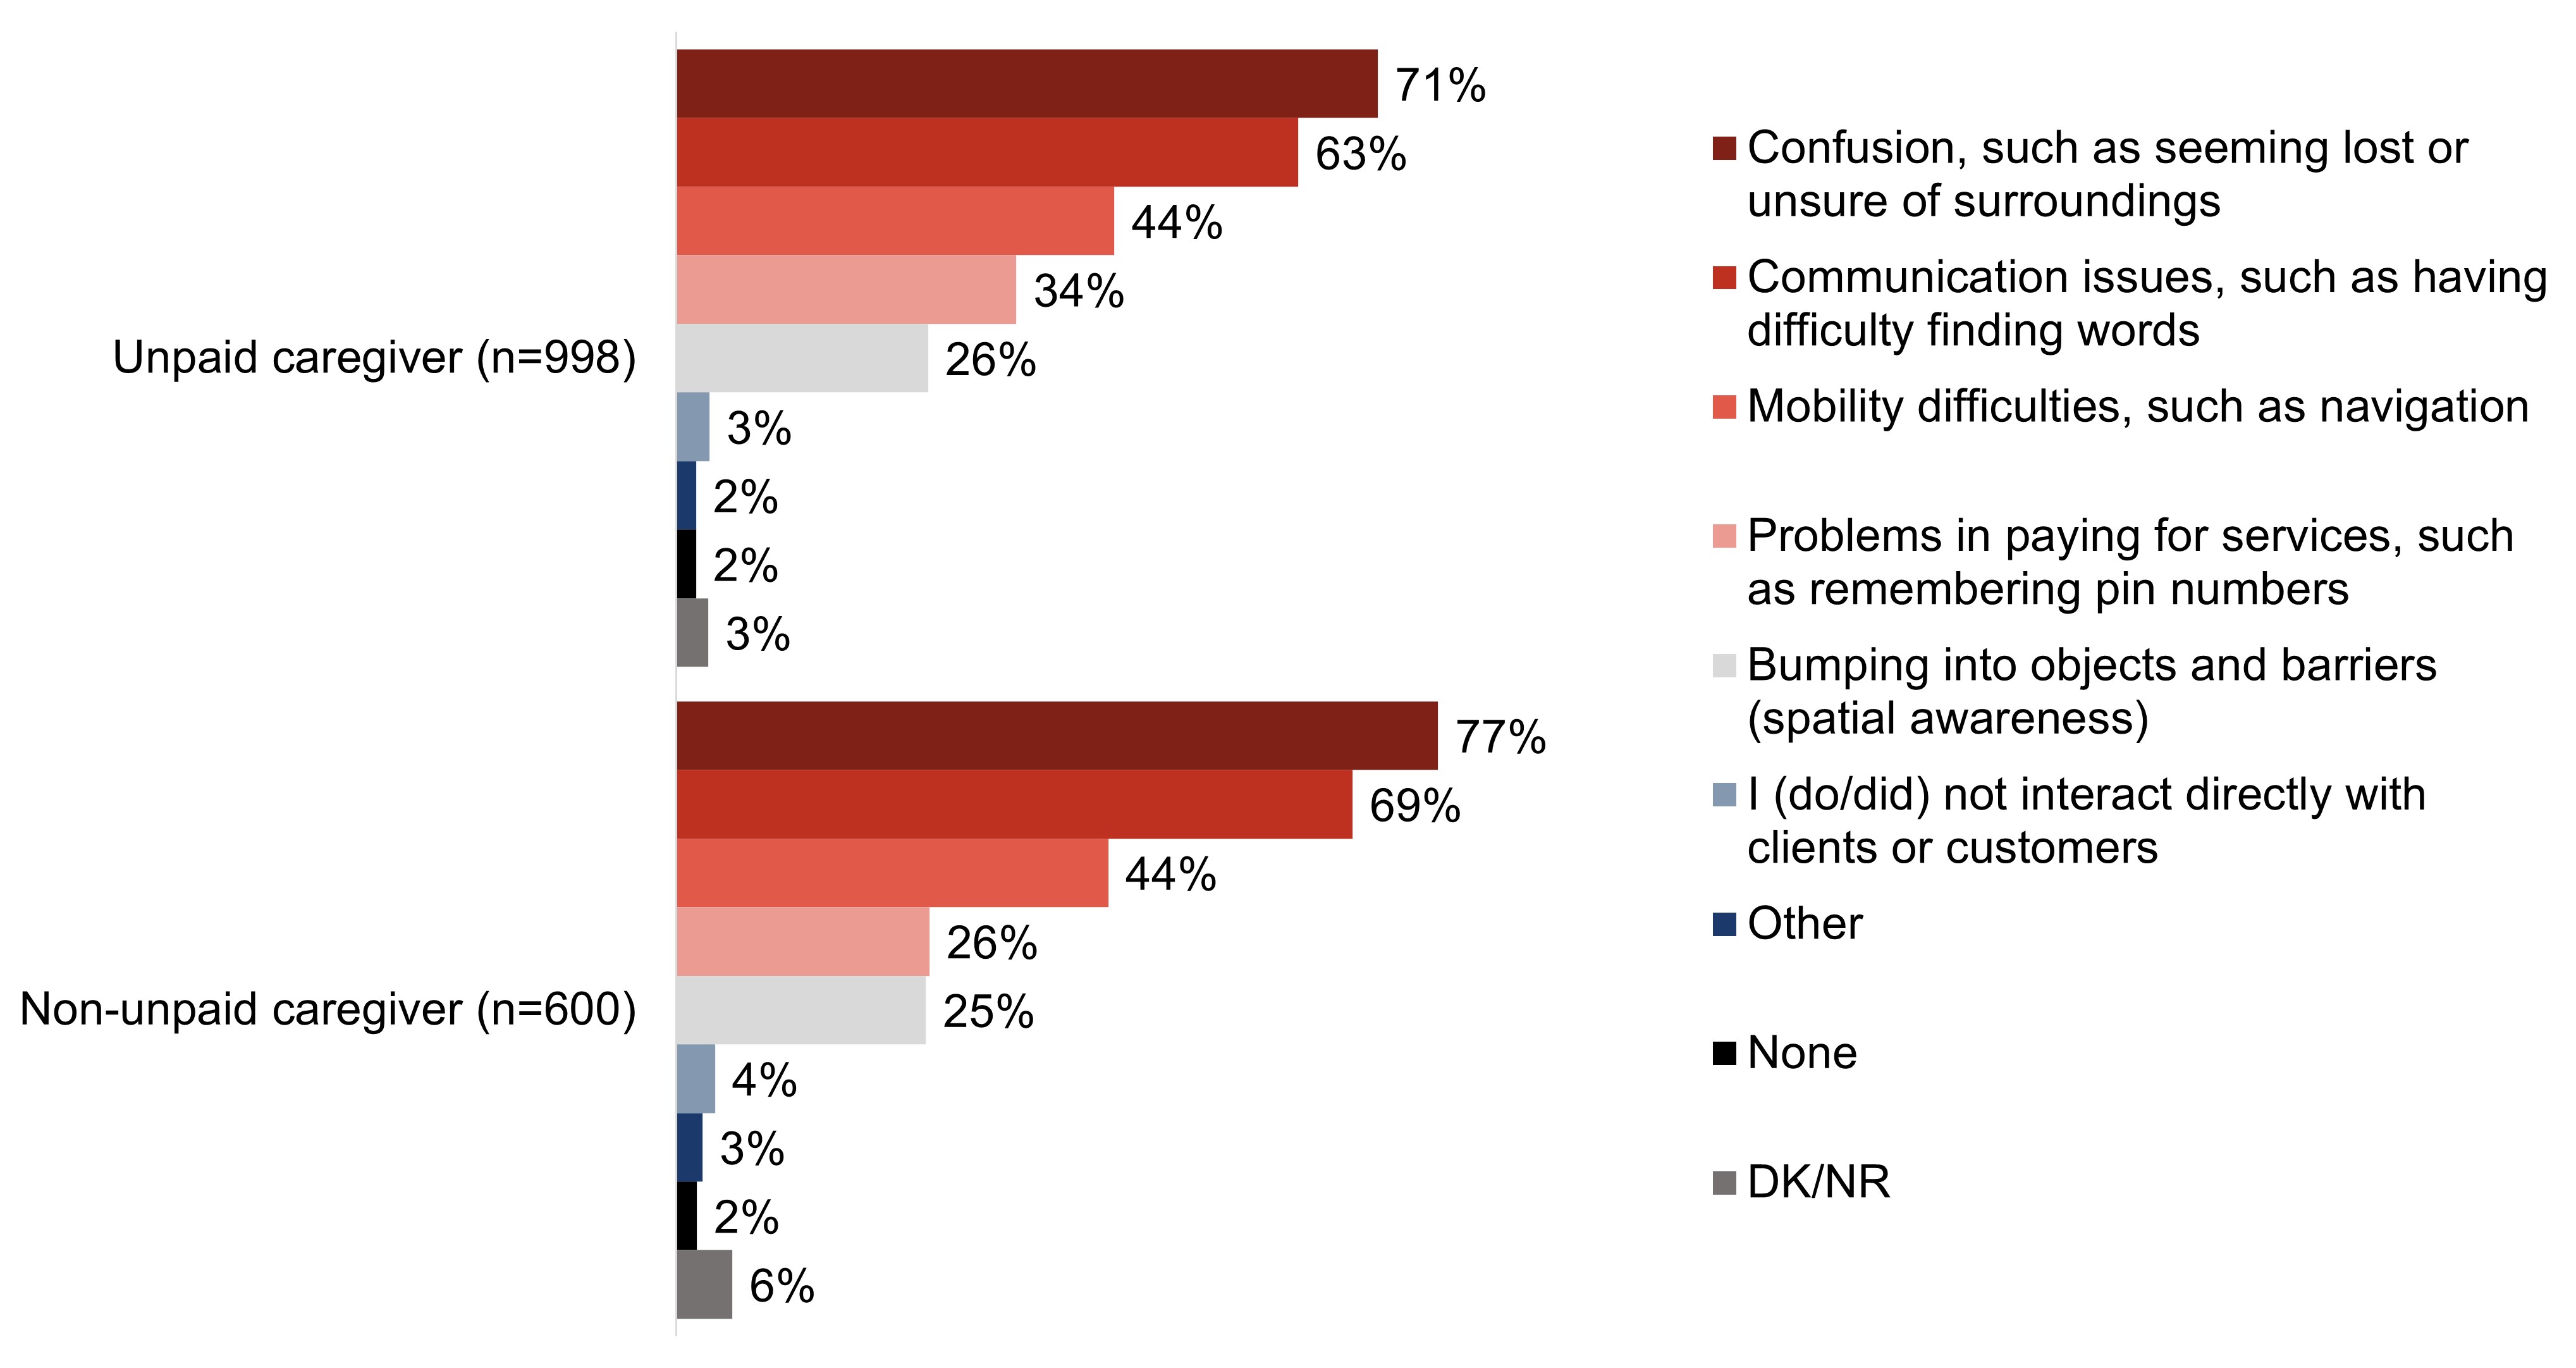
Mirroring qualitative findings, the most common issues faced by clients or customers that survey respondents felt were related to dementia are confusion (73%) and issues with communication (65%).
Some focus group participants noted that the behaviours or symptoms they would associate with dementia would depend on the stage of dementia, and others were not confident they know the barriers and challenges a person living with dementia might experience.
Workplace and volunteer setting measures and training to support clients living with dementia
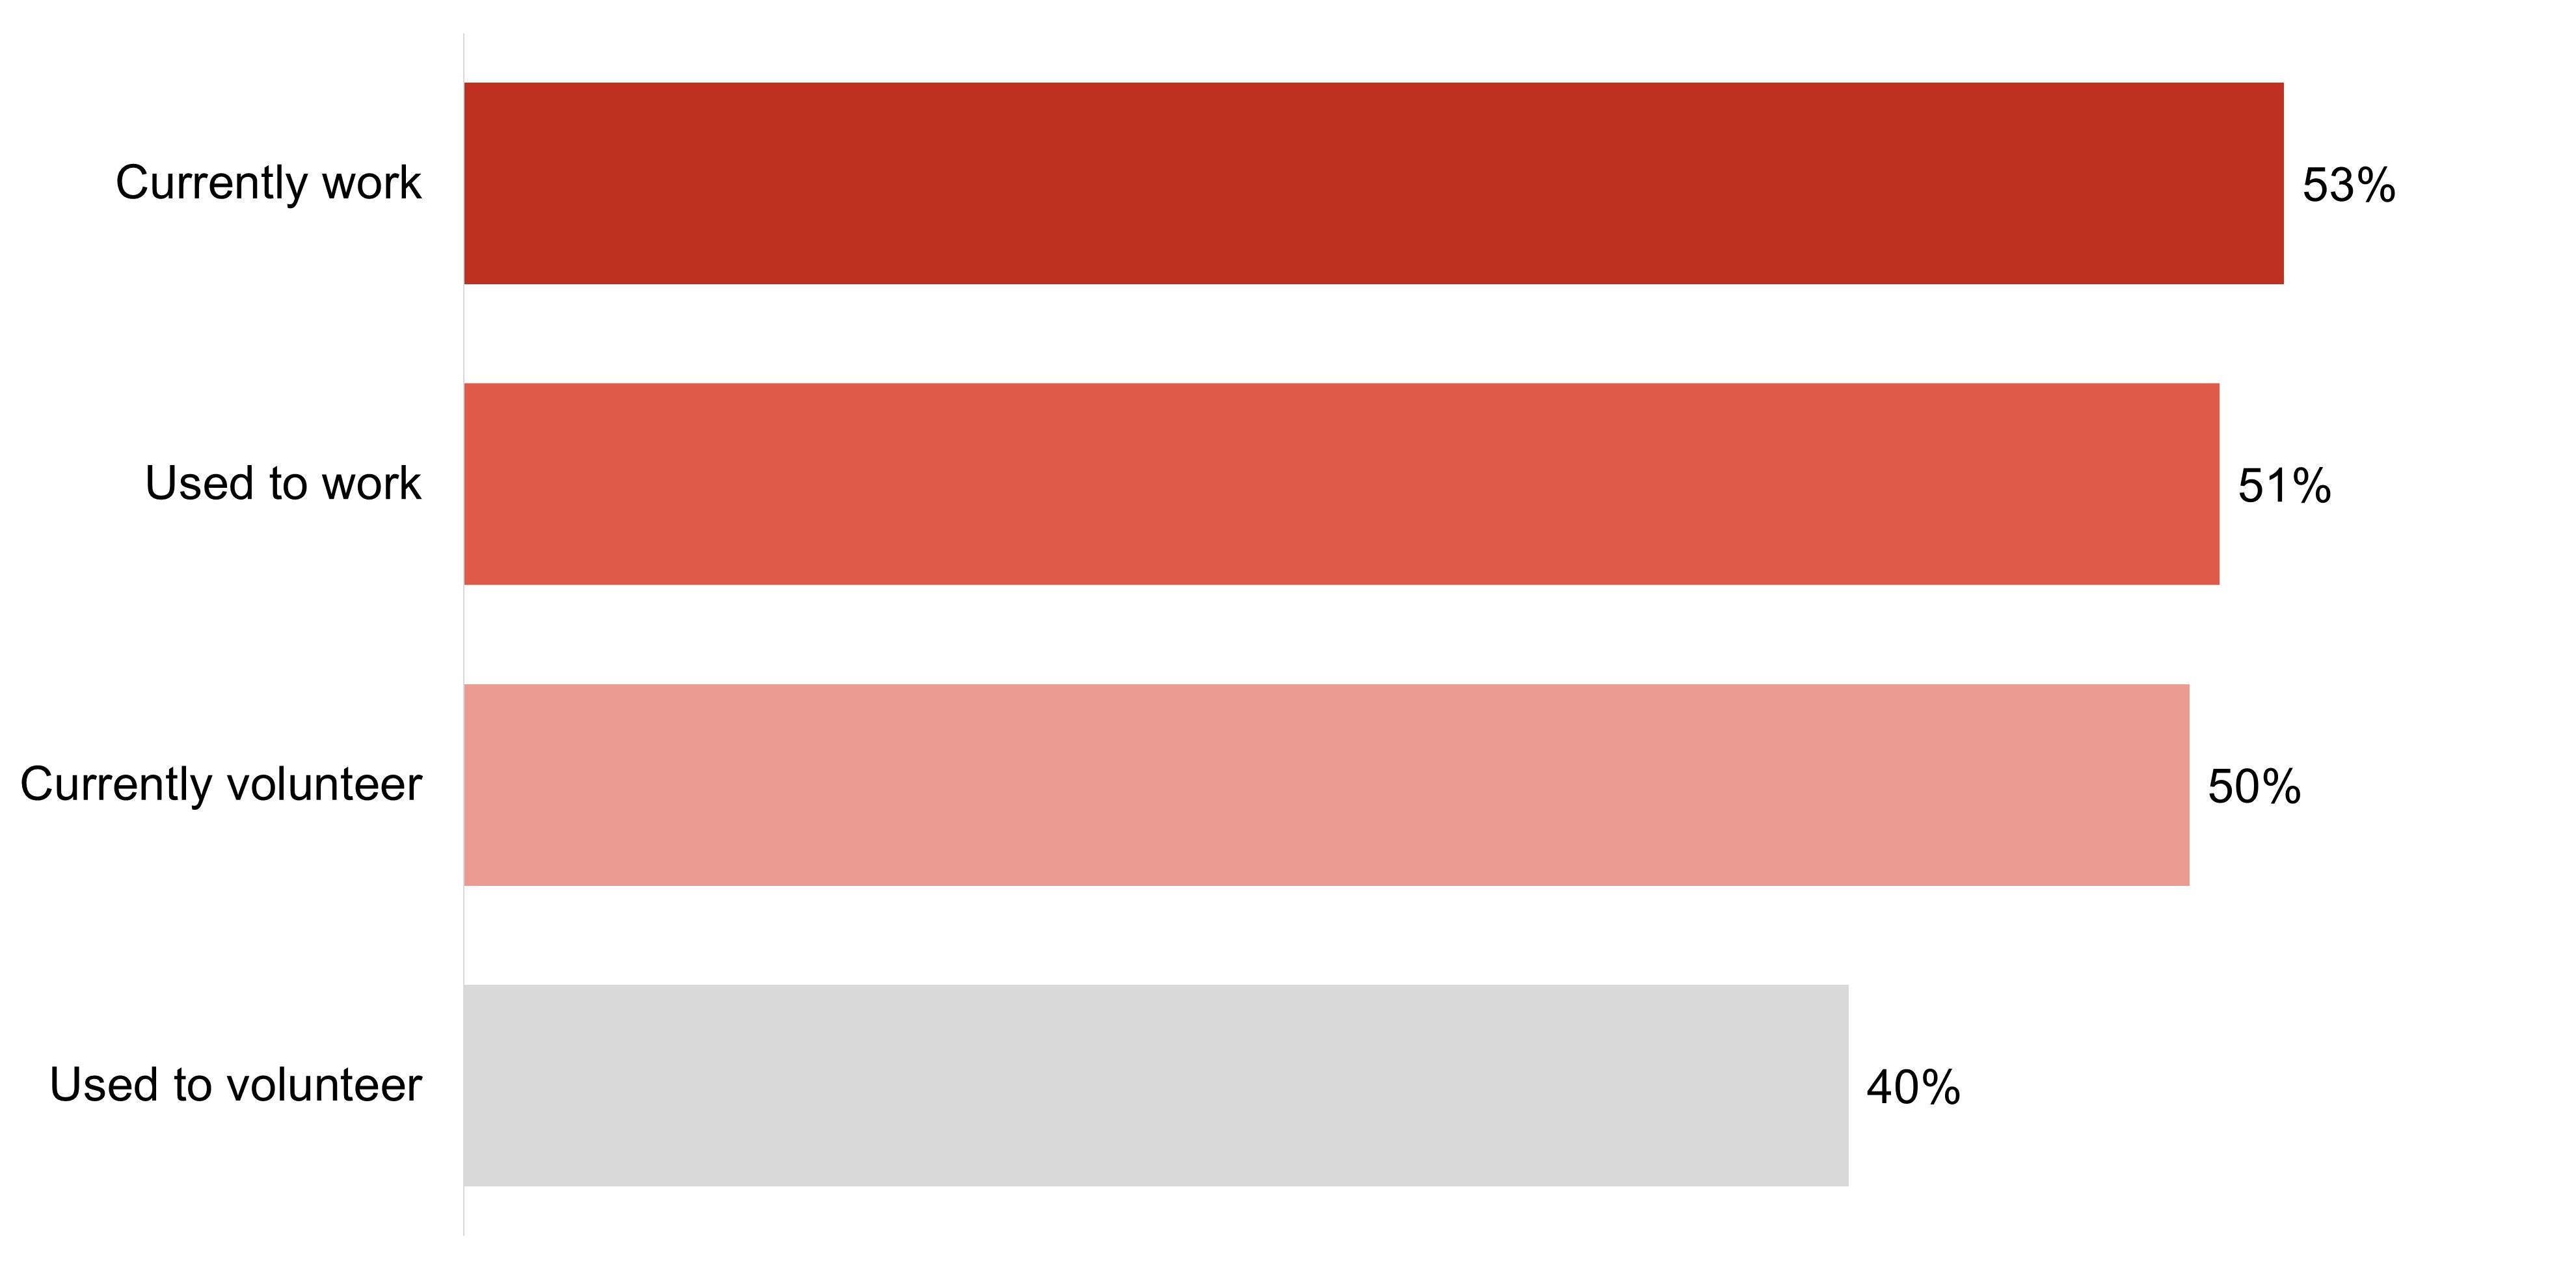
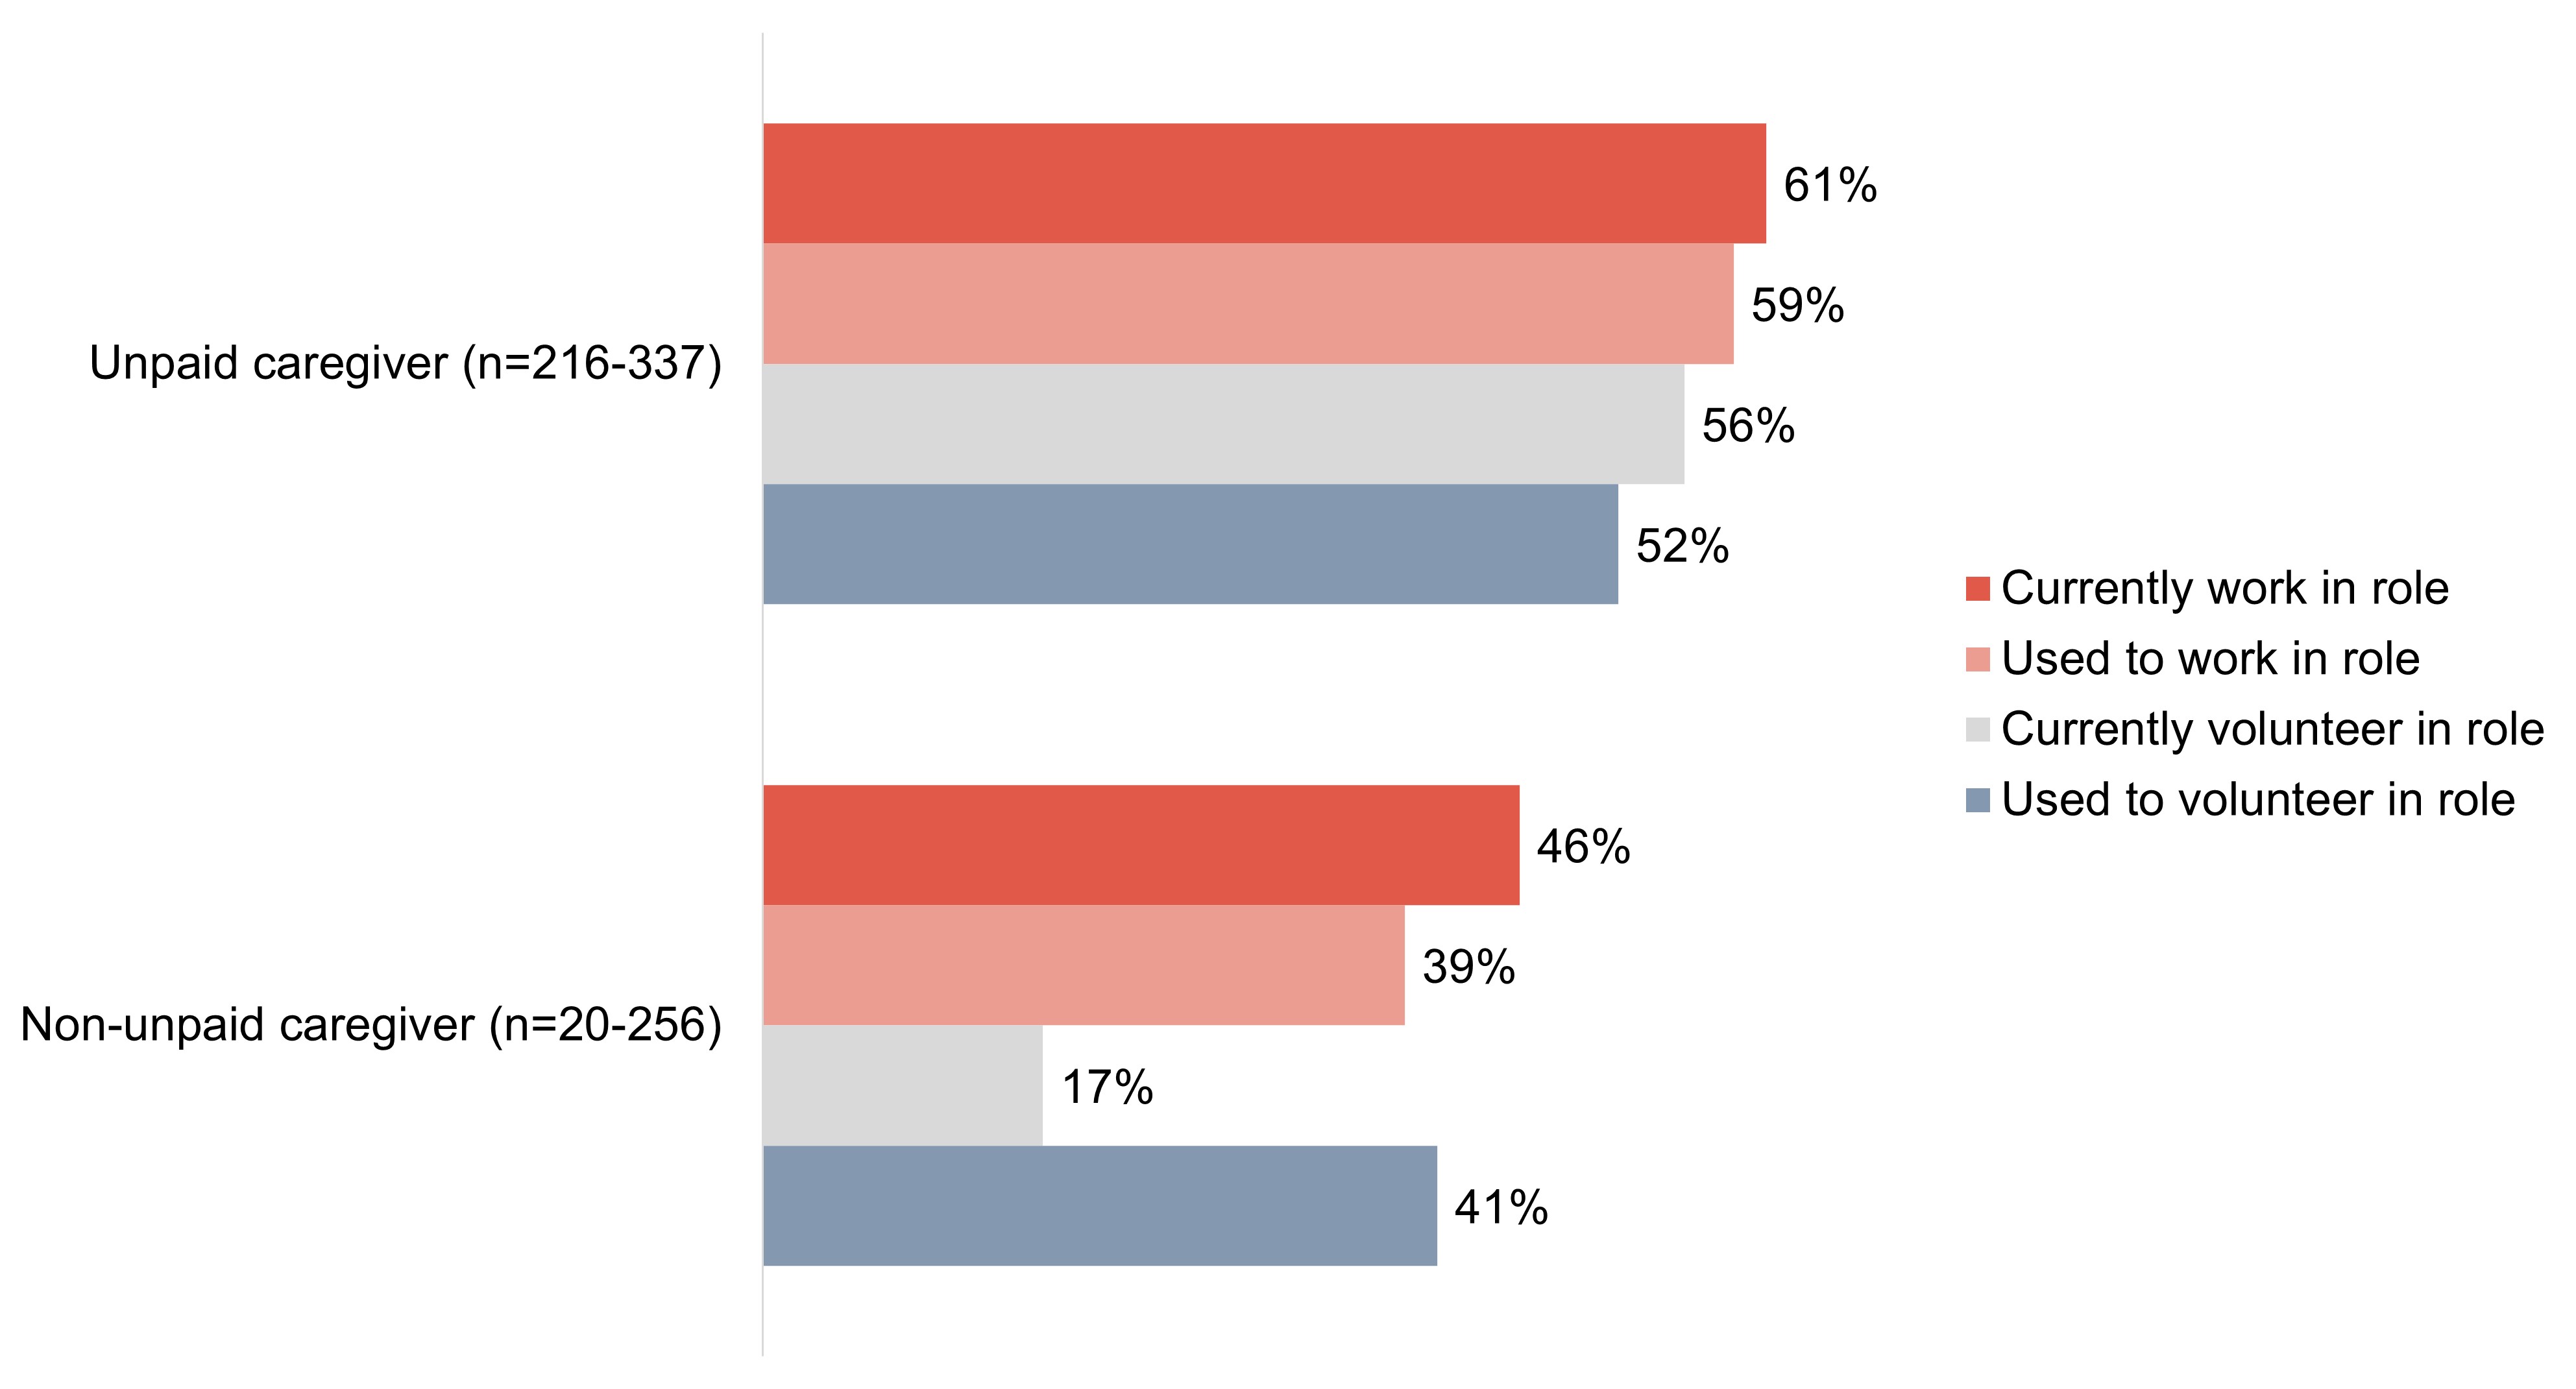
Roughly half of survey respondents who currently have a work (53%) or volunteer (50%) role or who had a work role (51%) that required them to interact with people living with dementia say their organization provided relevant training; fewer who used to have a volunteer role say the same of their organization (40%).
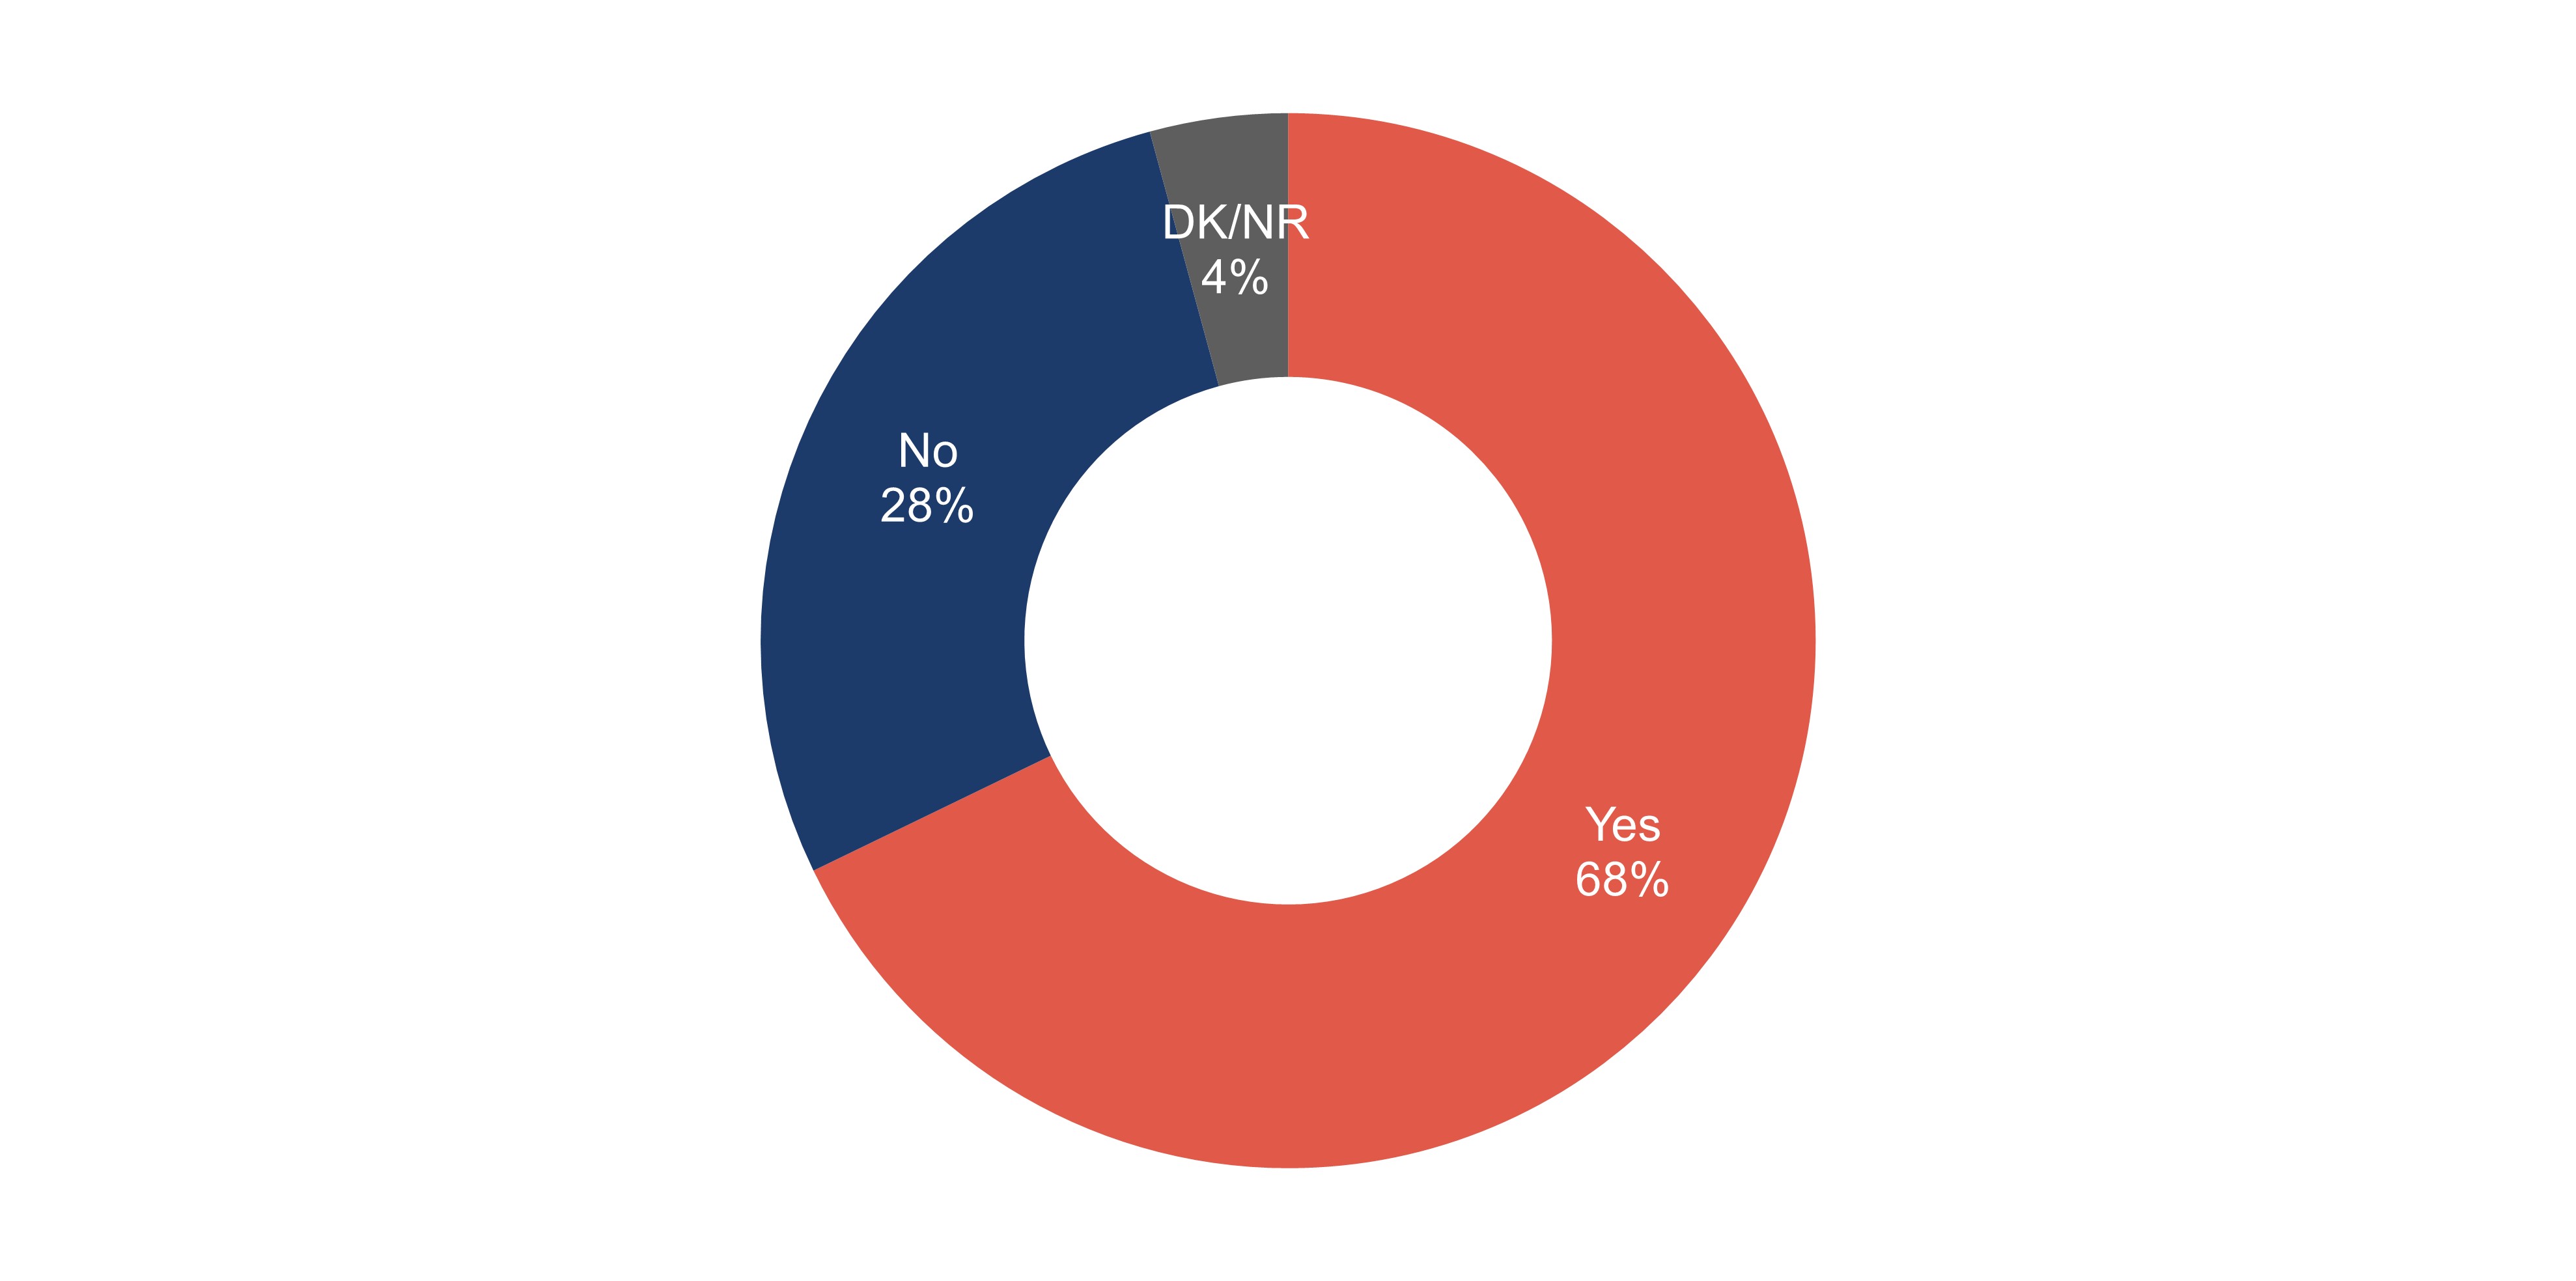
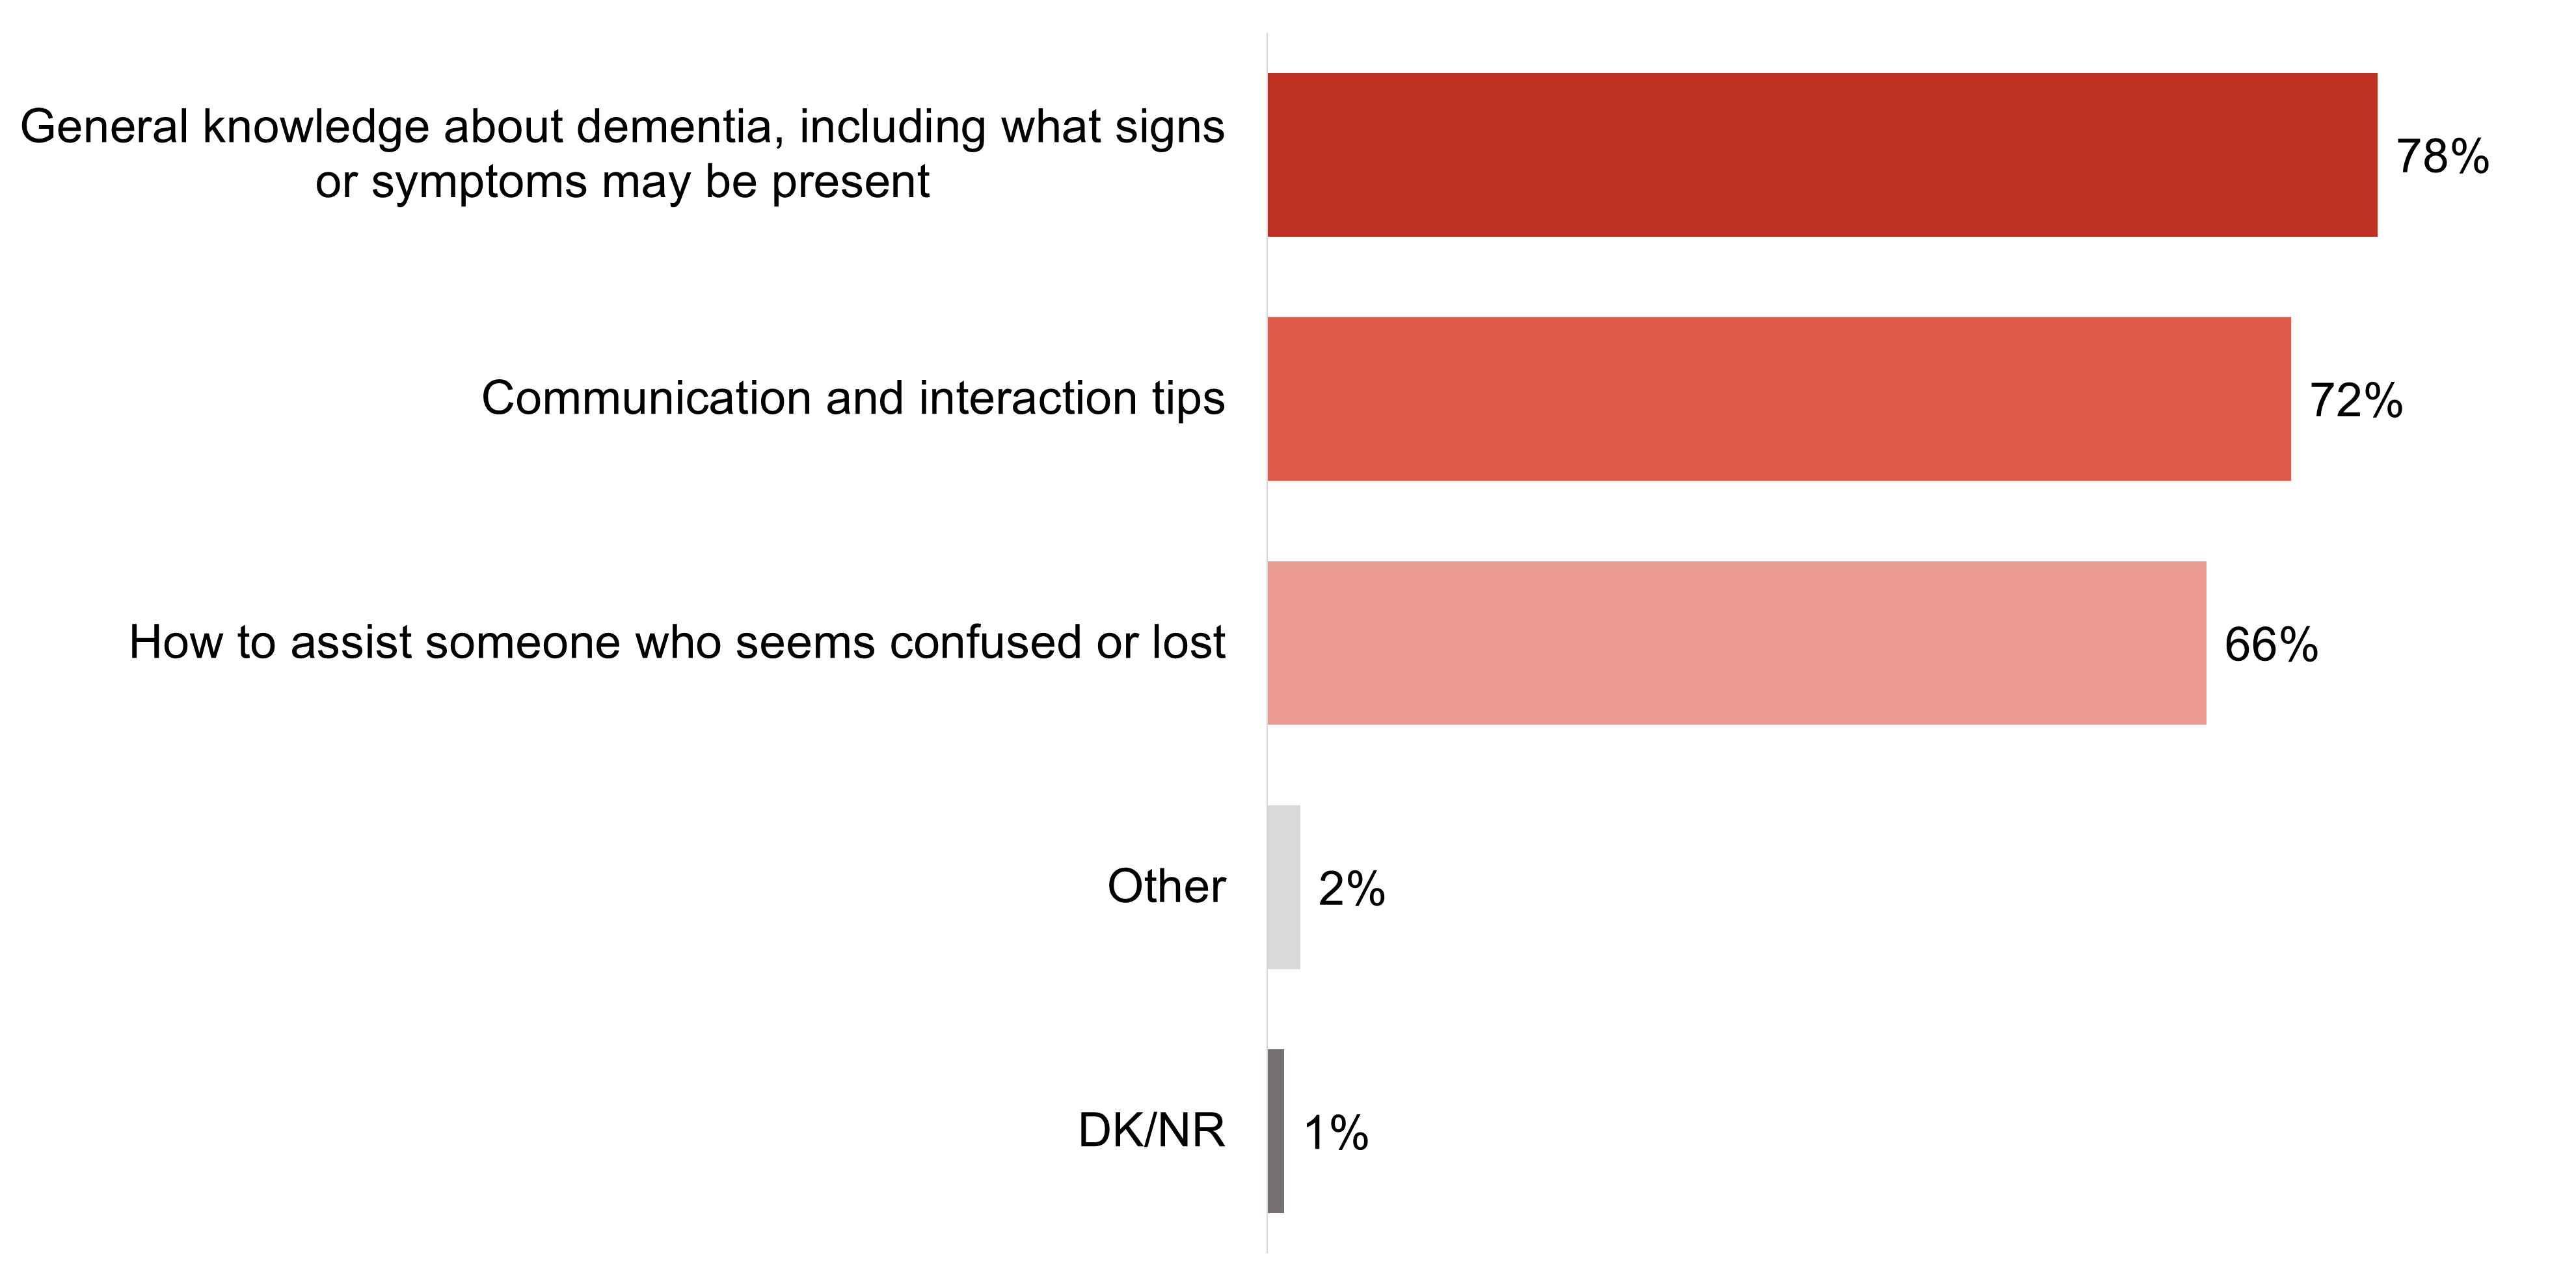
Among survey respondents who are from organizations that provide this type of training, the majority (68%) say that they have personally received training on how to interact with people living with dementia.
General knowledge (78%), communication/interaction tips (72%) and instructions on how to assist those who are confused/lost (66%) are all common topics of training received by survey respondents.
Within the focus groups, when asked about the training in place for employees at their organizations to assist in recognizing and supporting people who may be living with dementia, the majority of focus group participants said there is none.
Among those who have/had a work or volunteer role that required them to interact with people living with dementia, nearly half of survey respondents (45%) agree their organization provides/provided enough training for proper interaction with people living with dementia.
Many focus group participants felt that education or training on how to interact with people living with dementia, and disabilities more broadly, would be of value.
Approximately half of survey respondents (between 49% and 54%) who have/had a work or volunteer role that required them to interact with people living with dementia say their organization has/had measures or policies specifically to ensure positive and helpful interactions with people living with dementia.
When asked what they would do if they encountered someone visiting their workplace as a client or customer who appeared to be searching, wandering, or confused, most focus group participants indicated that they would approach the situation with care and would approach the individual to see how they could assist them.
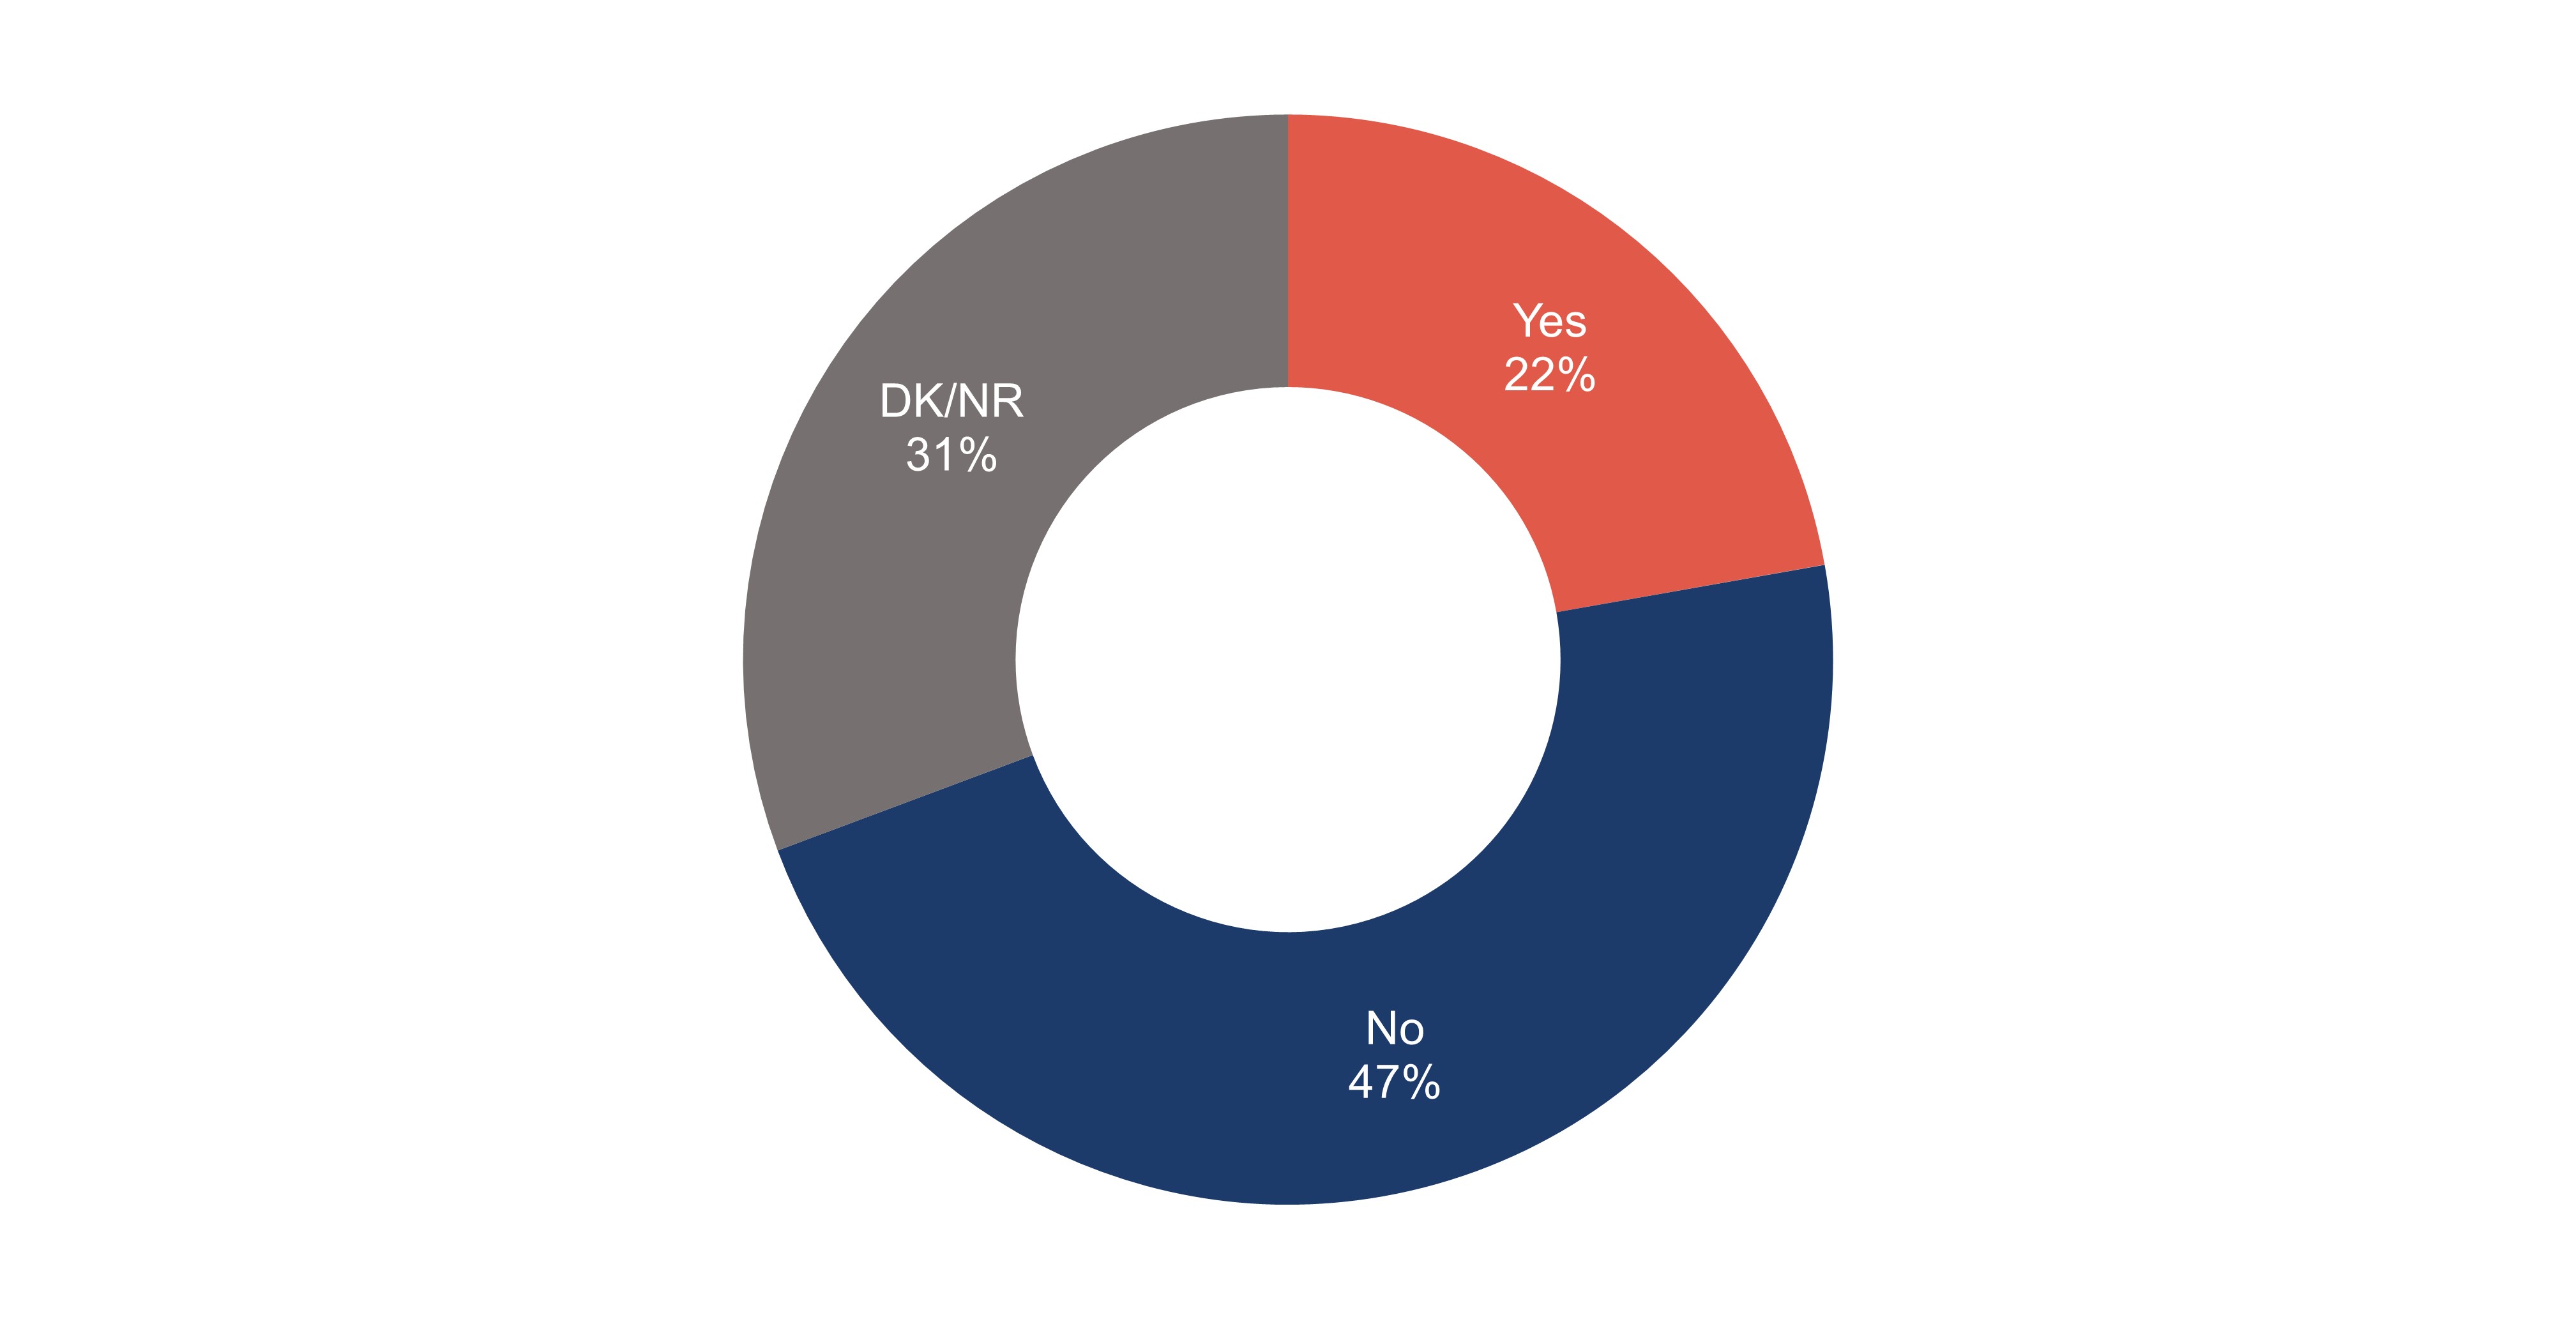
Over one-fifth of survey respondents (22%) say that their organization takes/took steps to make online interactions more accessible for those with cognitive impairment, while almost half (47%) say they do/did not.
Efforts to support healthy aging and dementia-inclusive communities
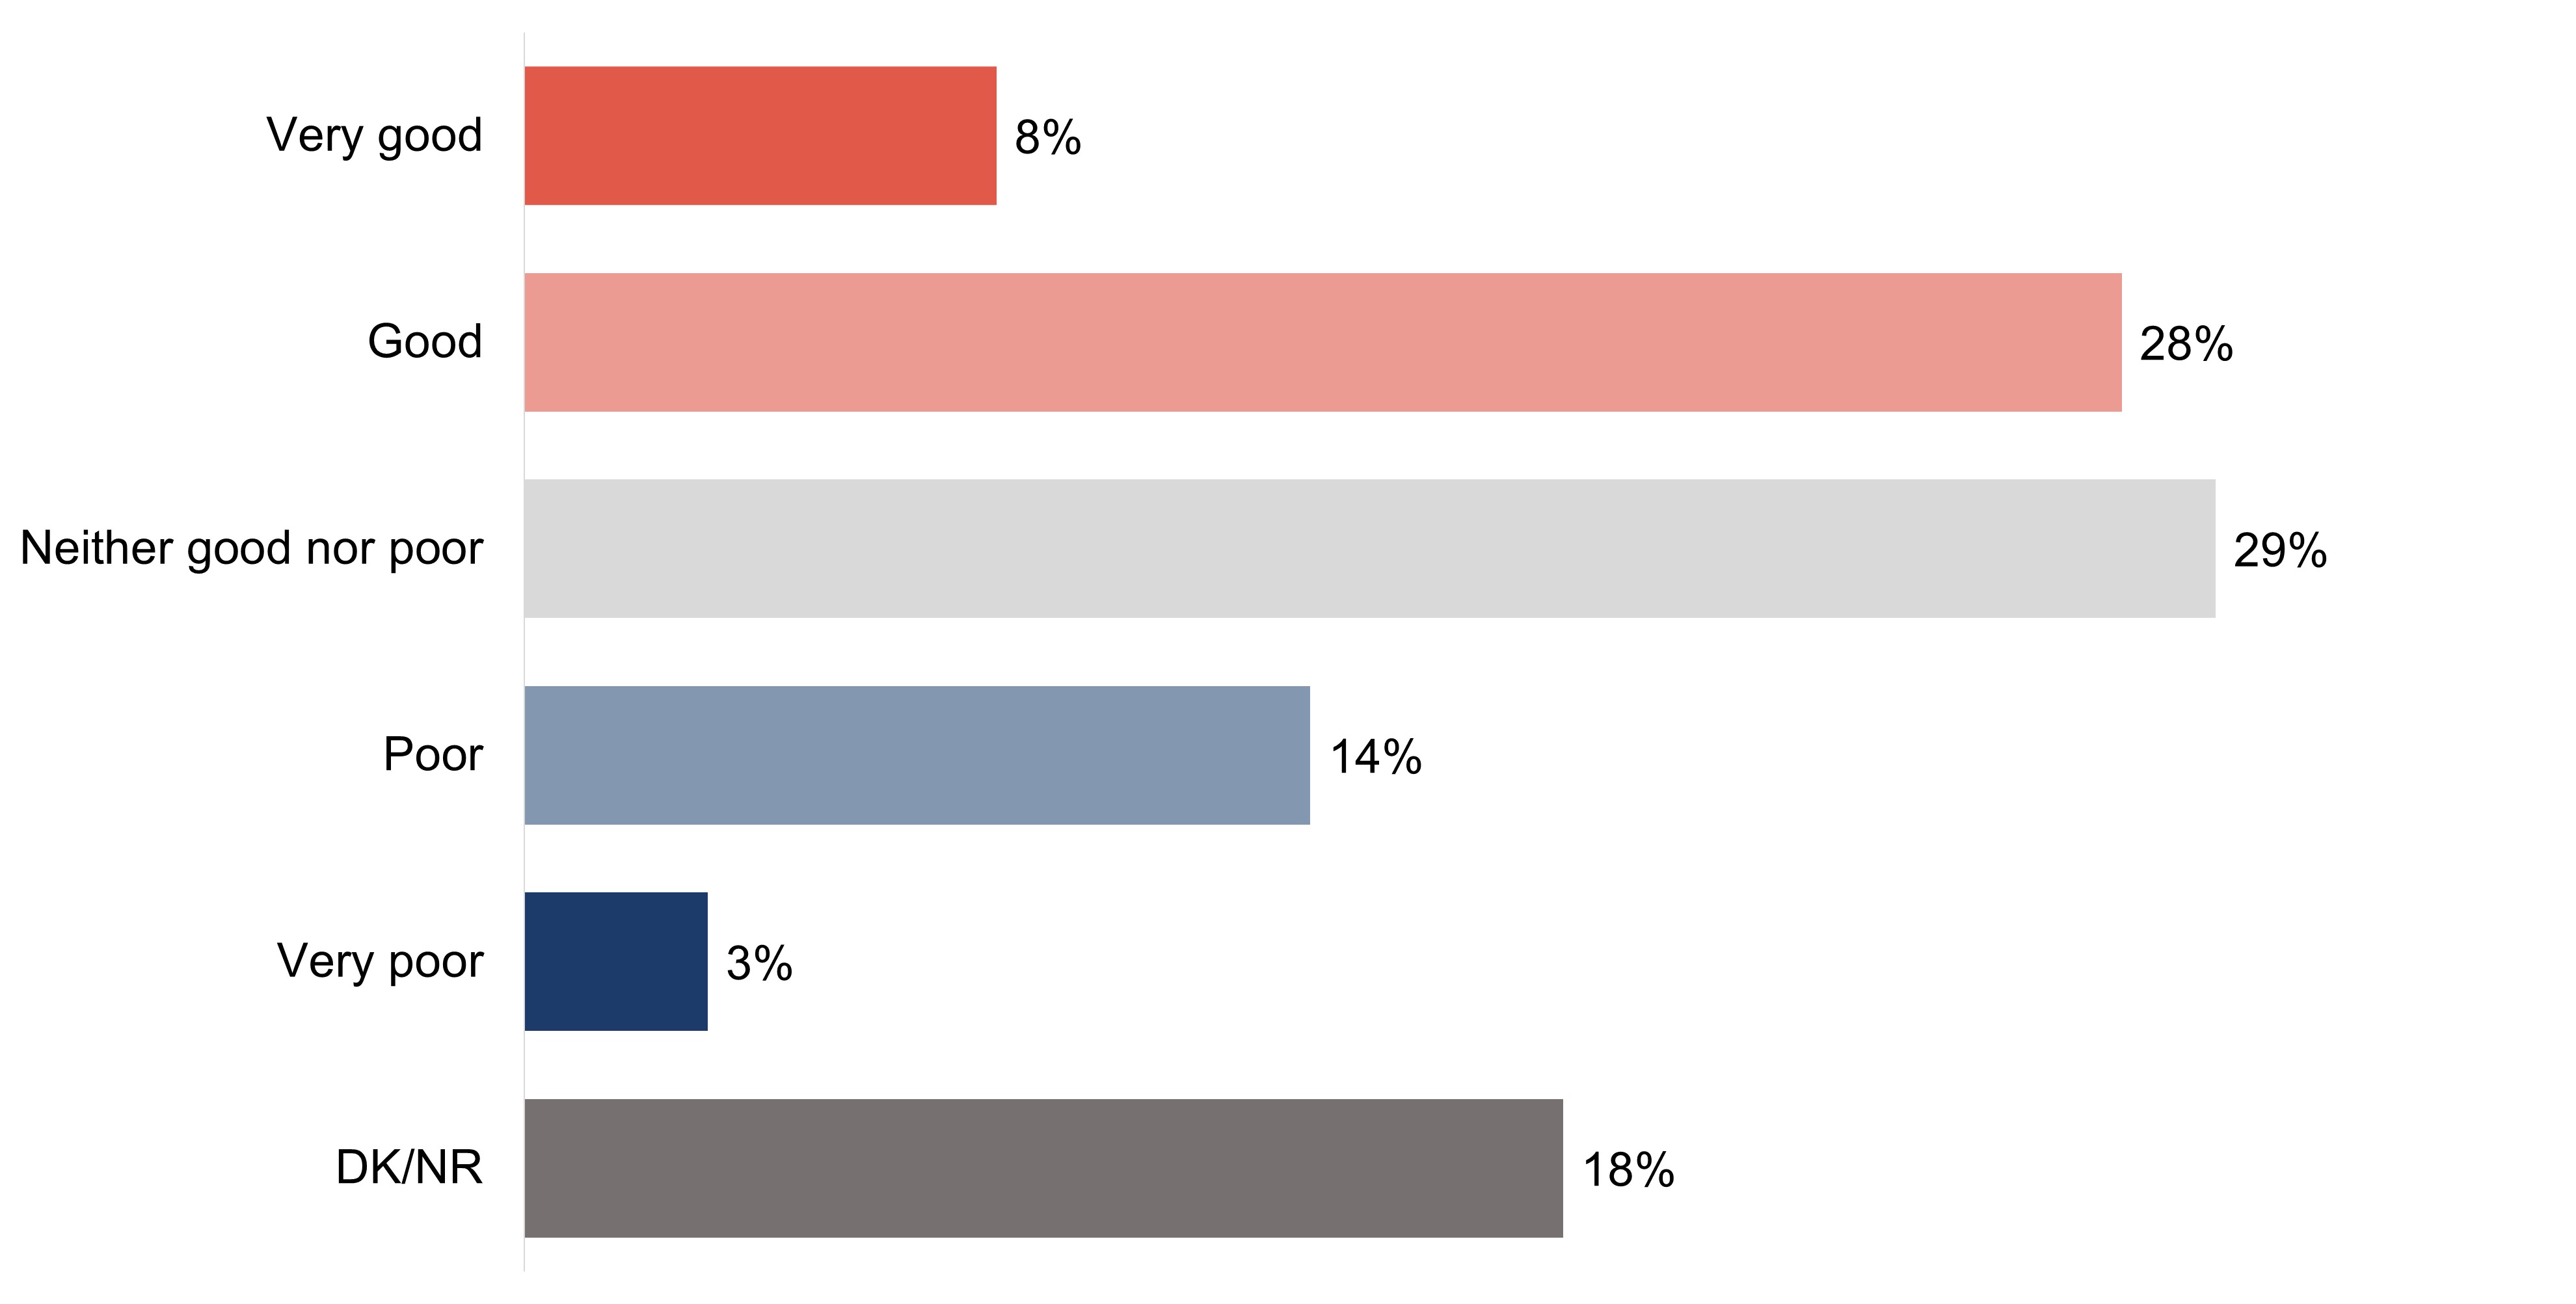
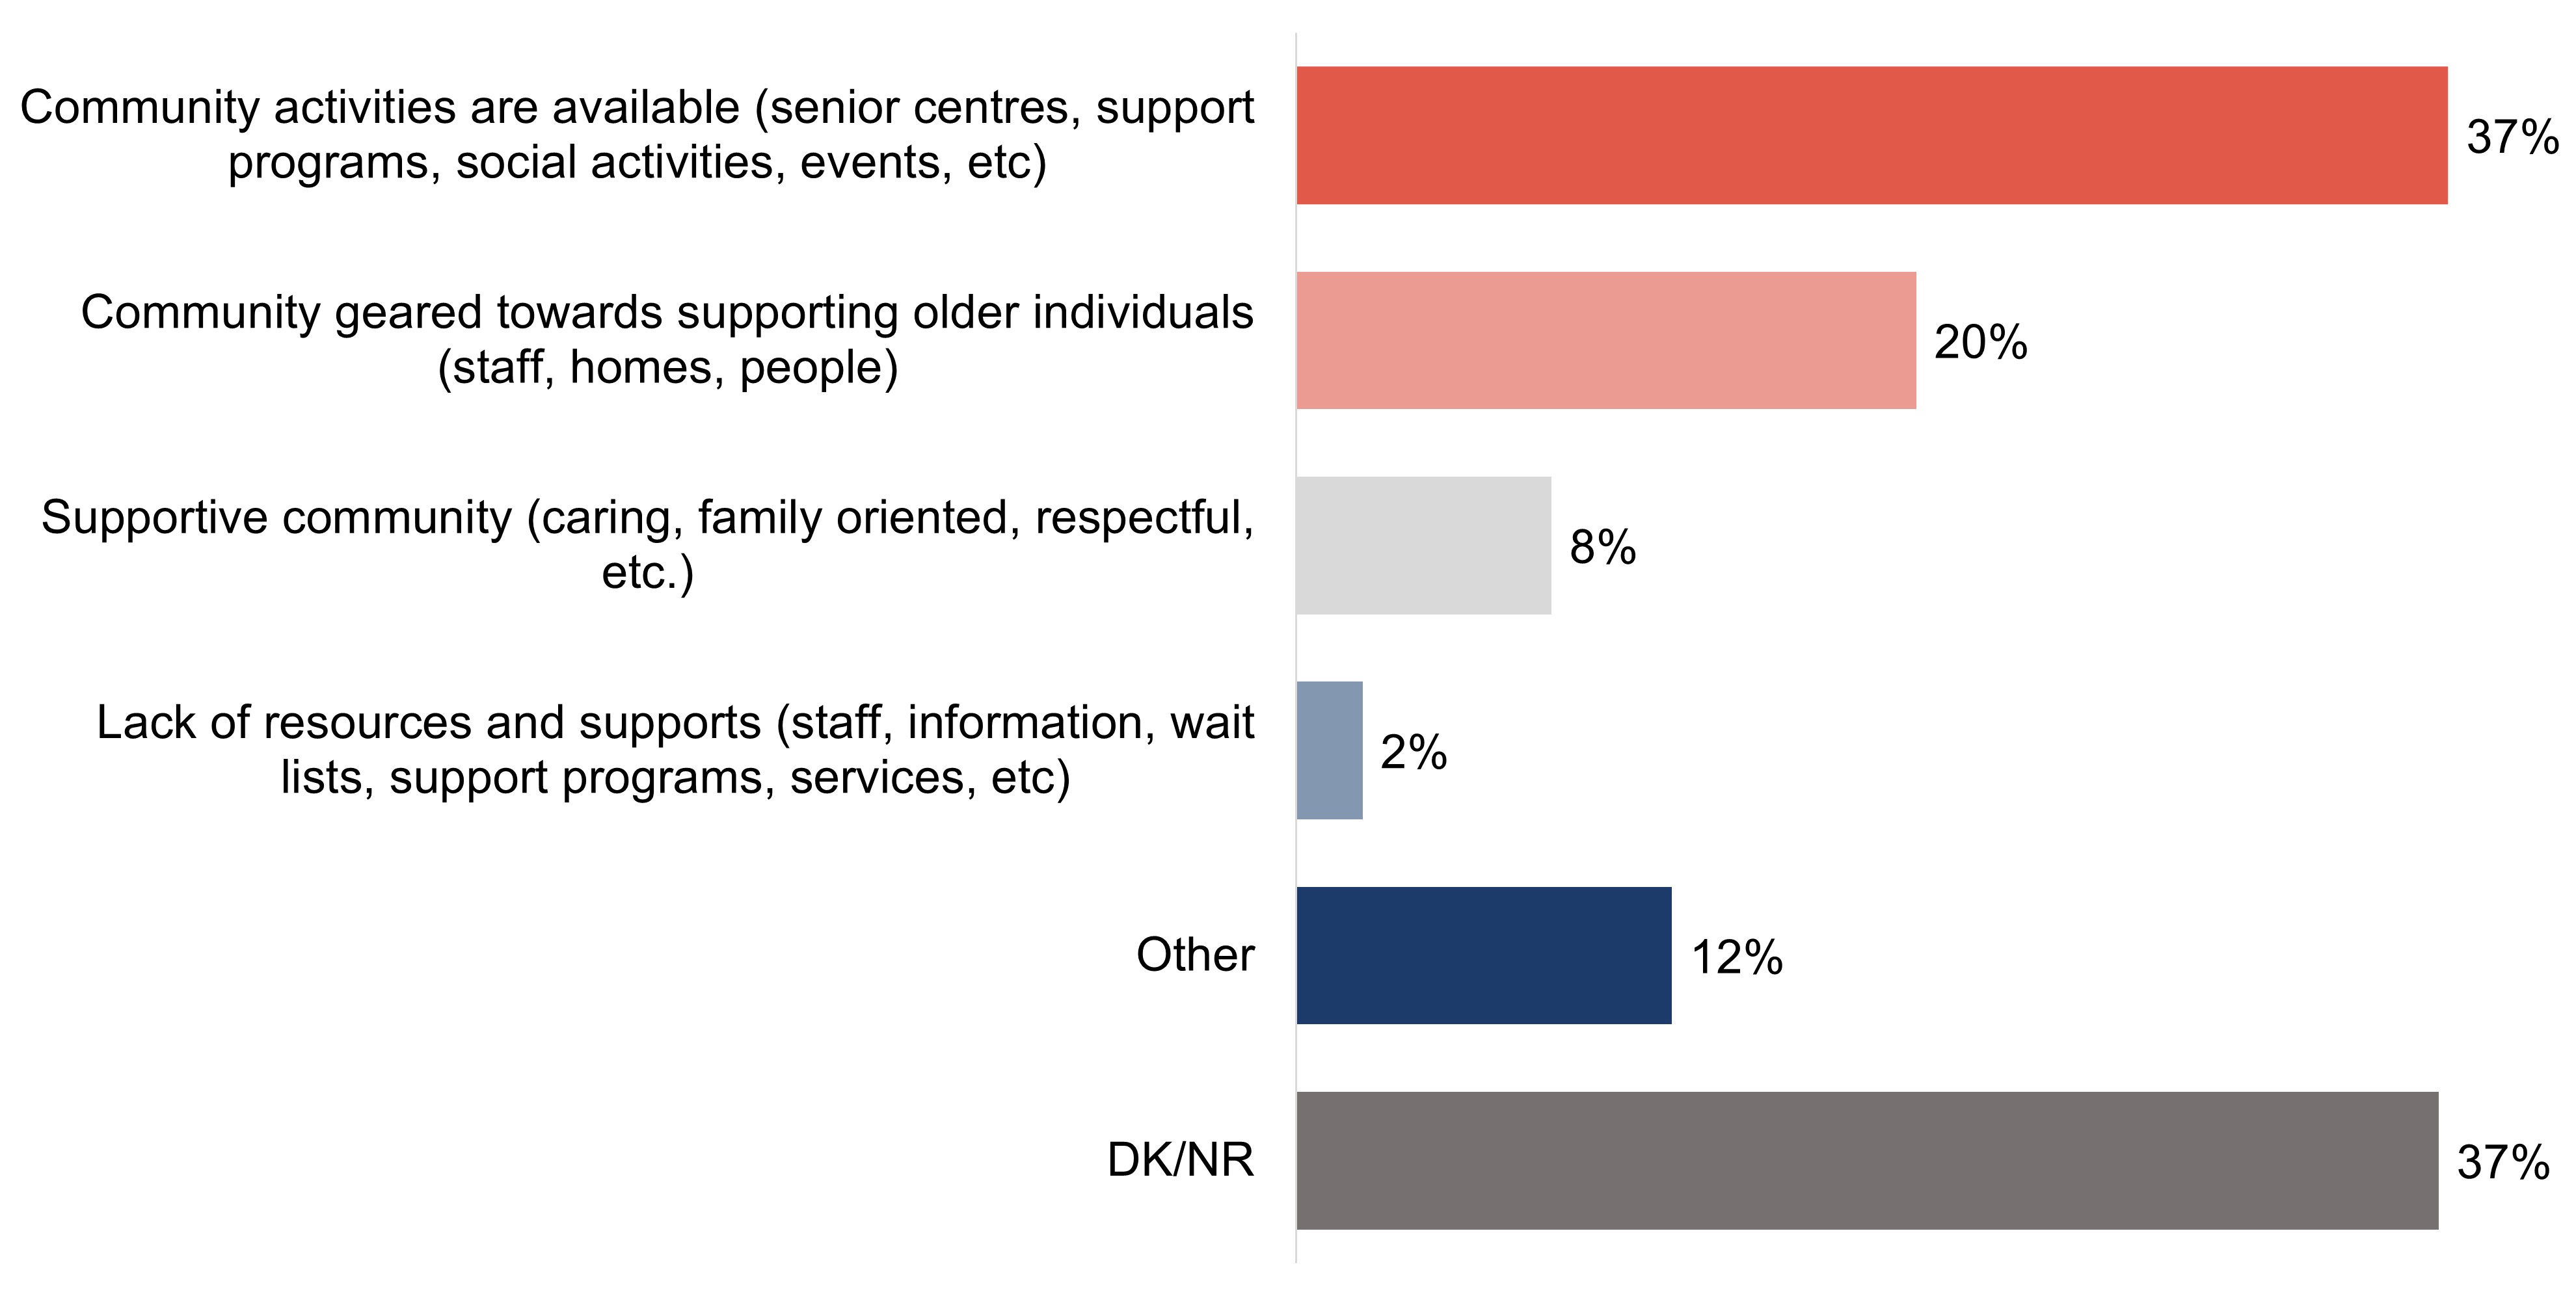
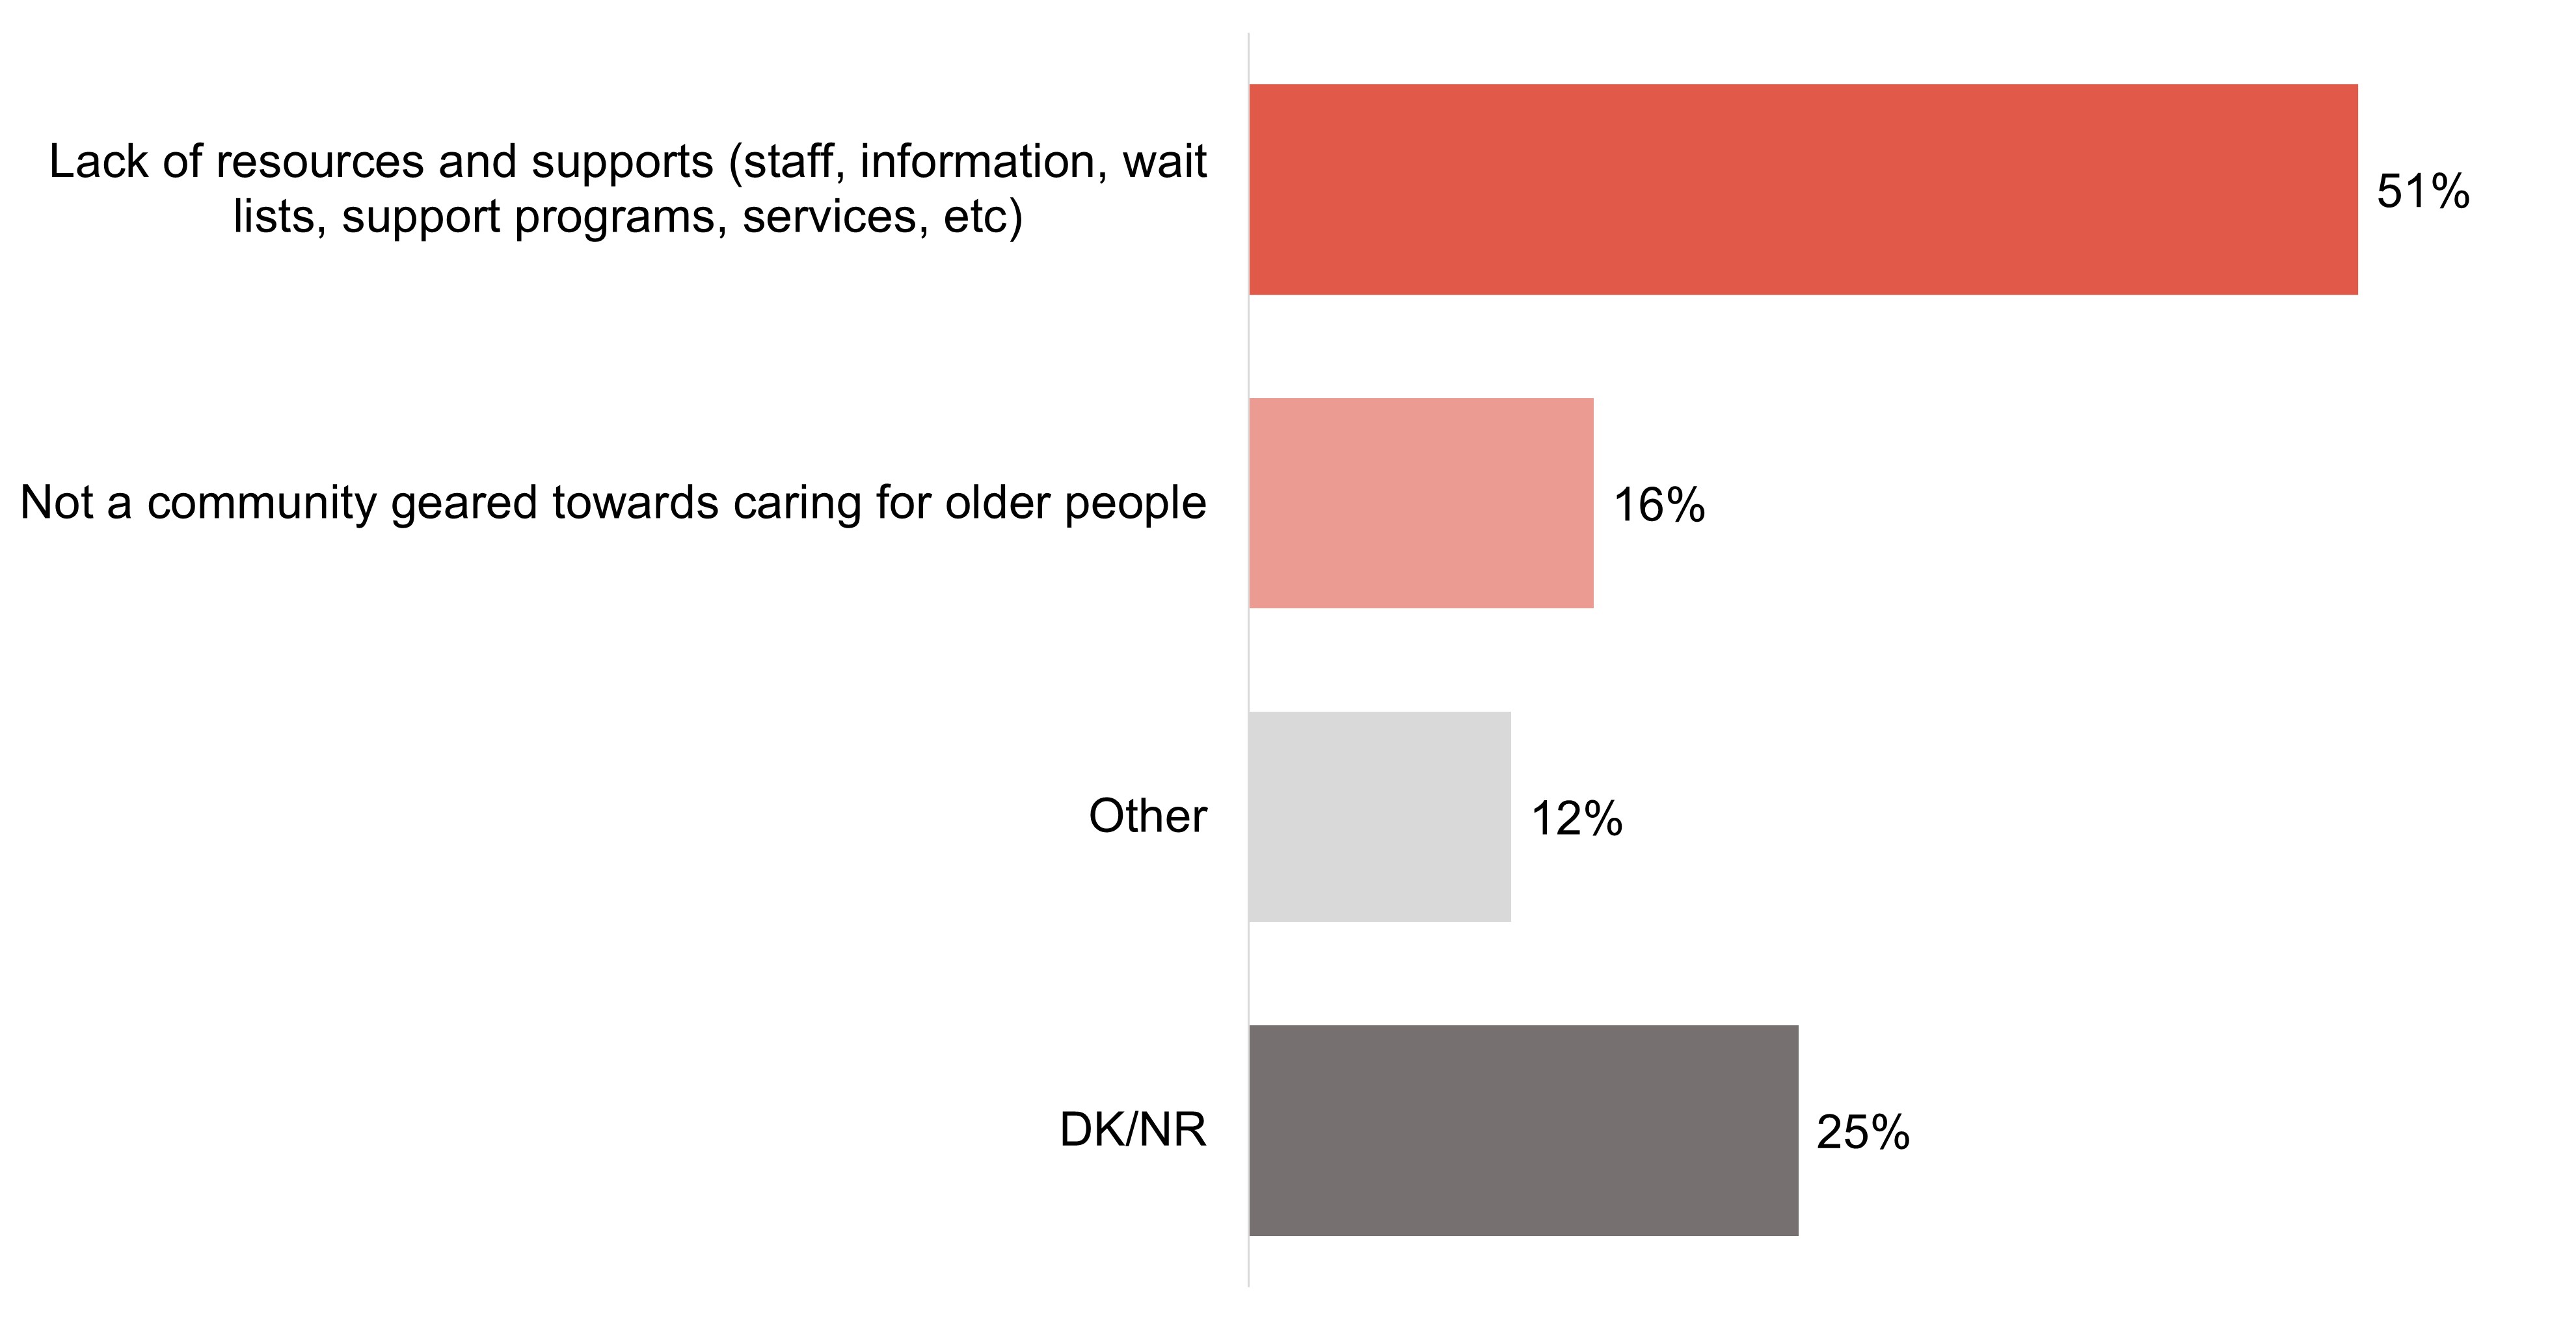
Over one-third of survey respondents (36%) would give their community a good rating as a place that supports healthy aging, while a slightly fewer (29%) would rate it as neither good nor poor.
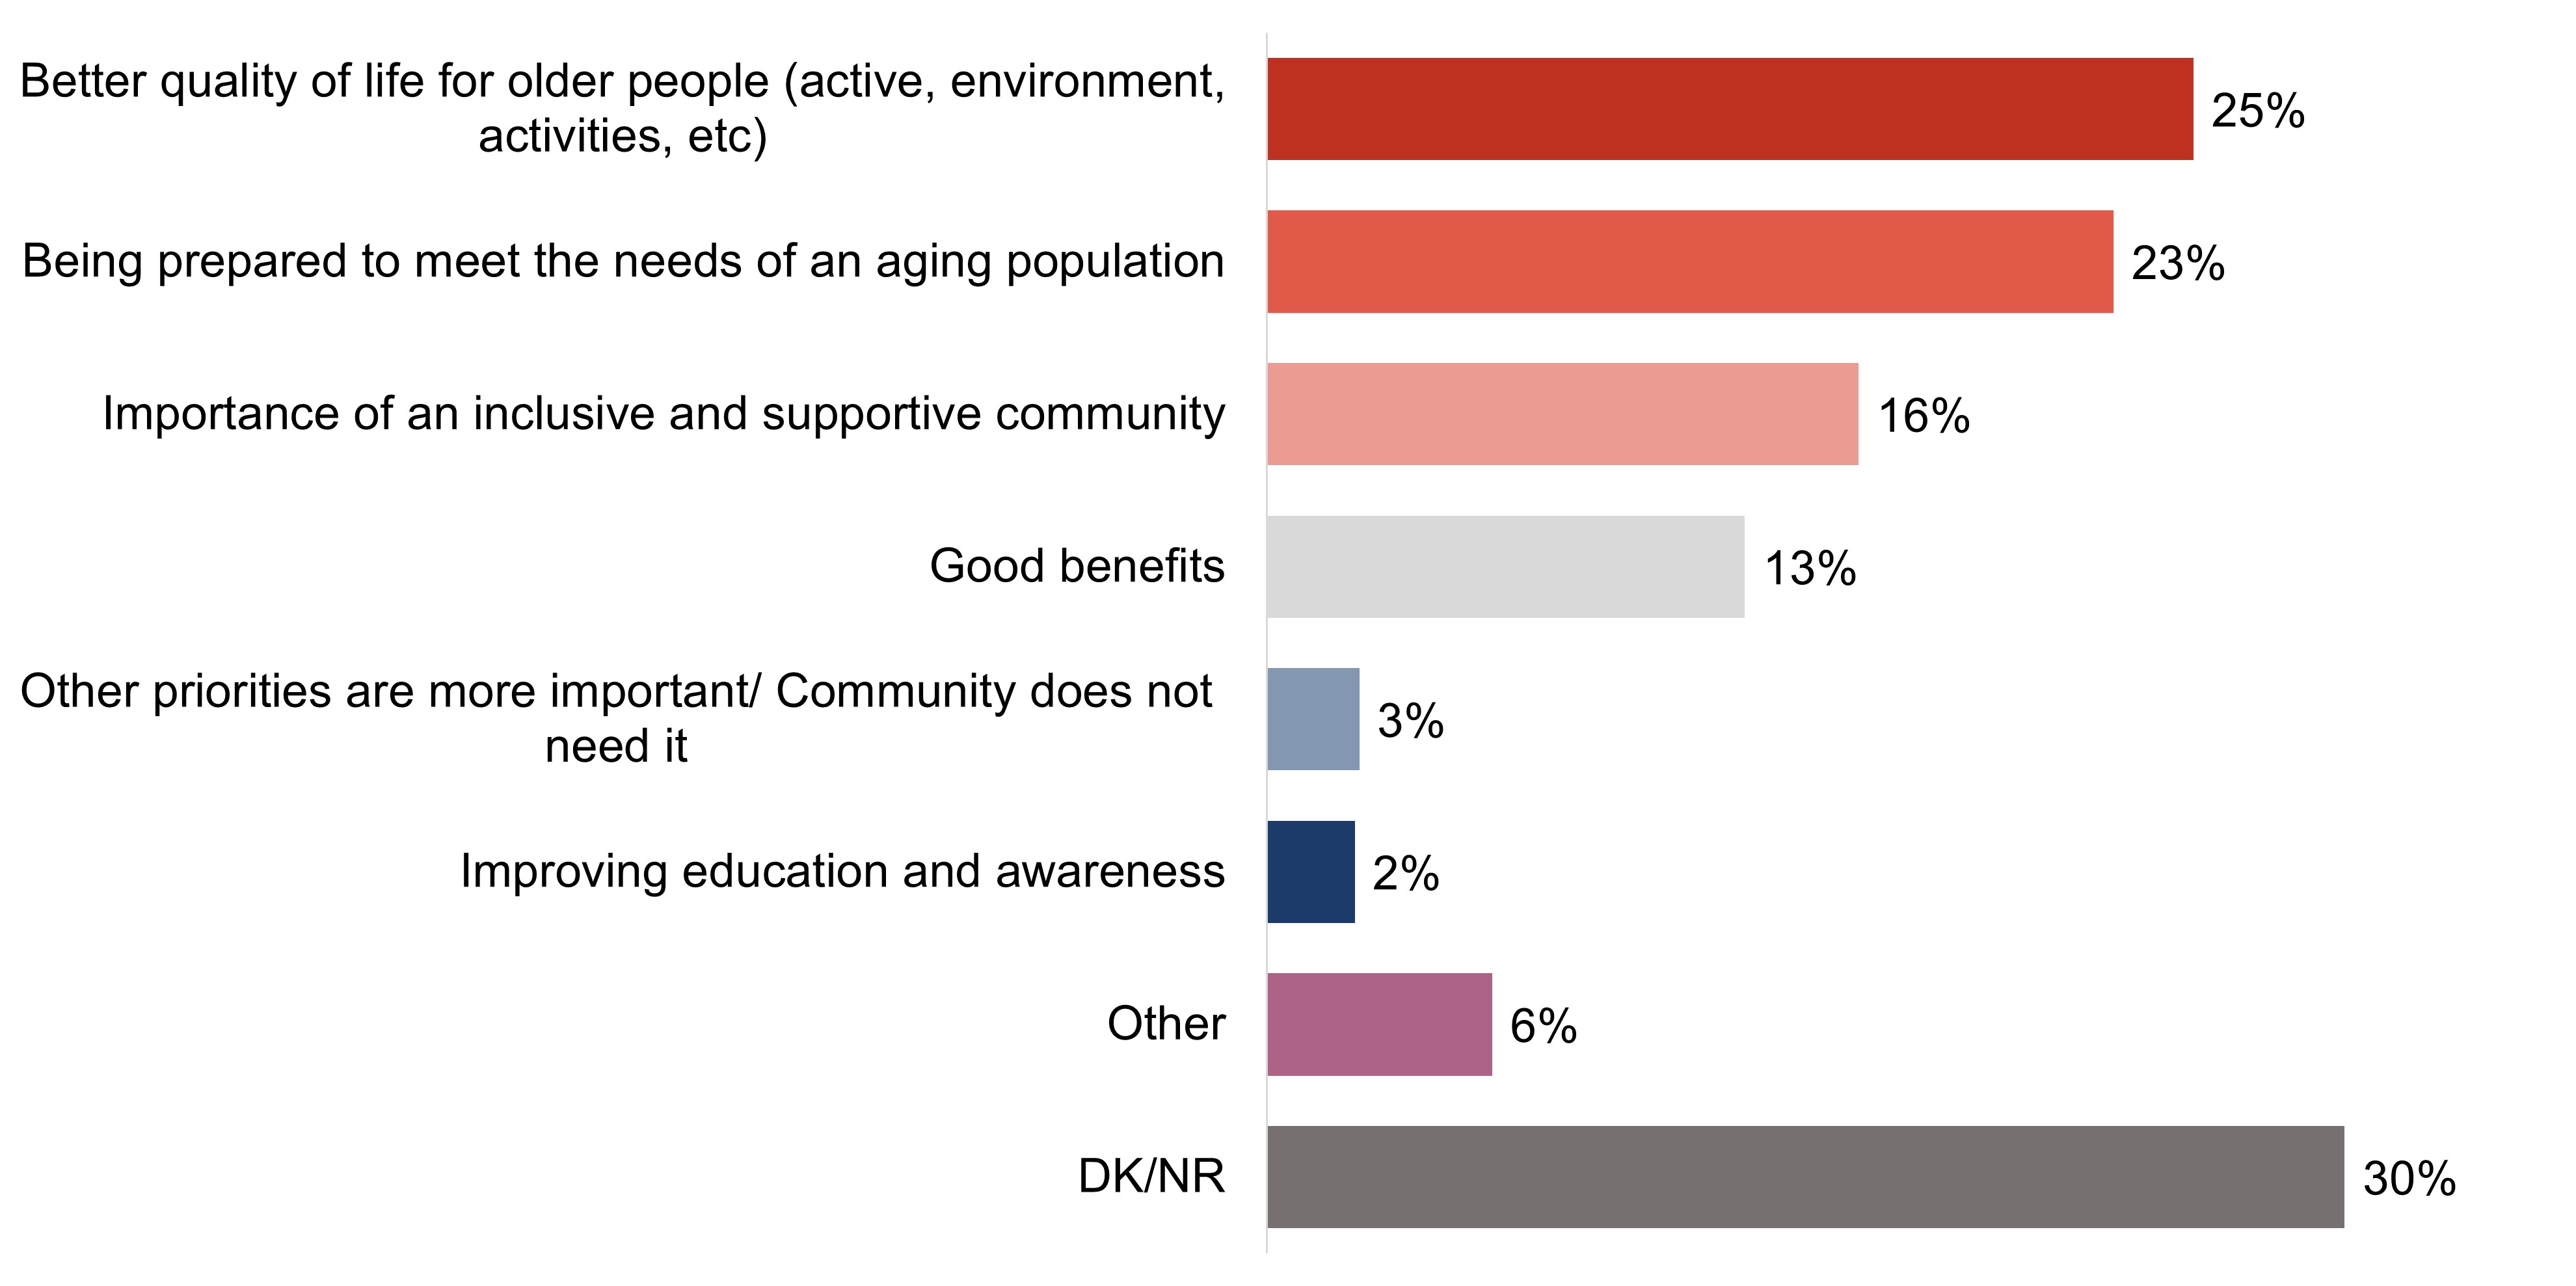
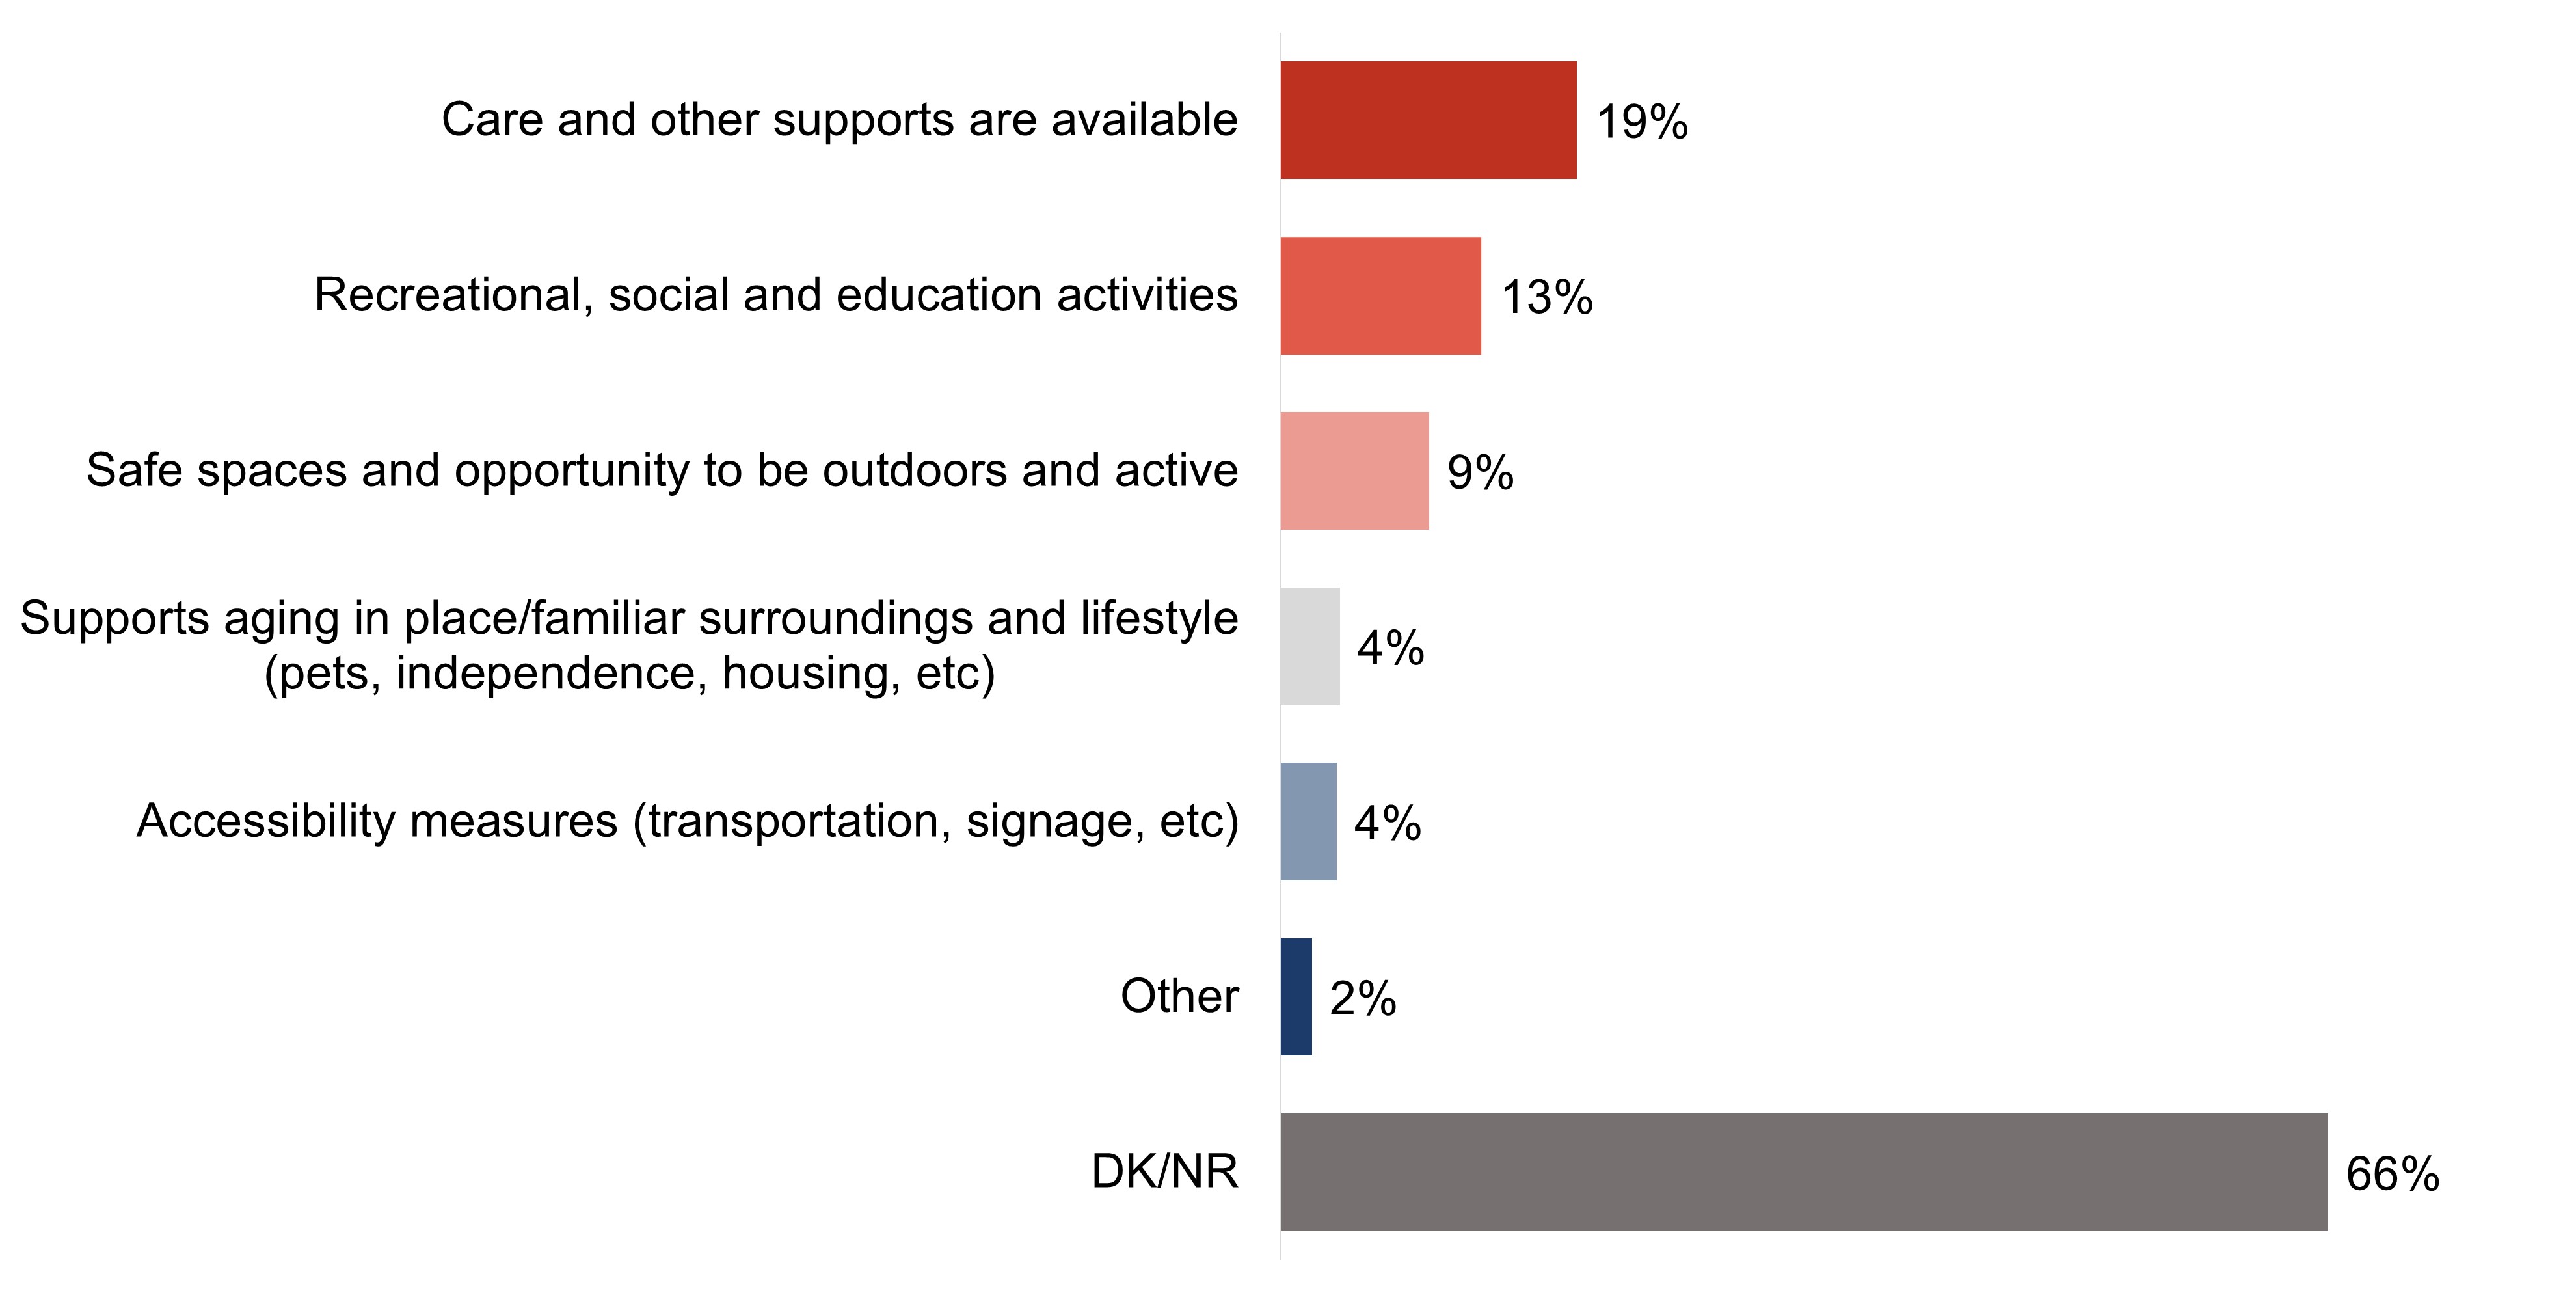
Among those who gave their community a positive rating, the most common reason is due to the activities available (37%). Fewer survey respondents (20%) would say their community is geared towards supporting older individuals. The most common reason for a negative rating is due a lack of resources and supports (51%).
Among the focus group participants, virtually none felt their community was well-suited for people living with dementia and some balked at the notion that was even plausible. The most common reasons were lack of safety due to natural neighbourhood features (busy streets), outdoor characteristic (wooded areas and waterways), and in some cases, crime.
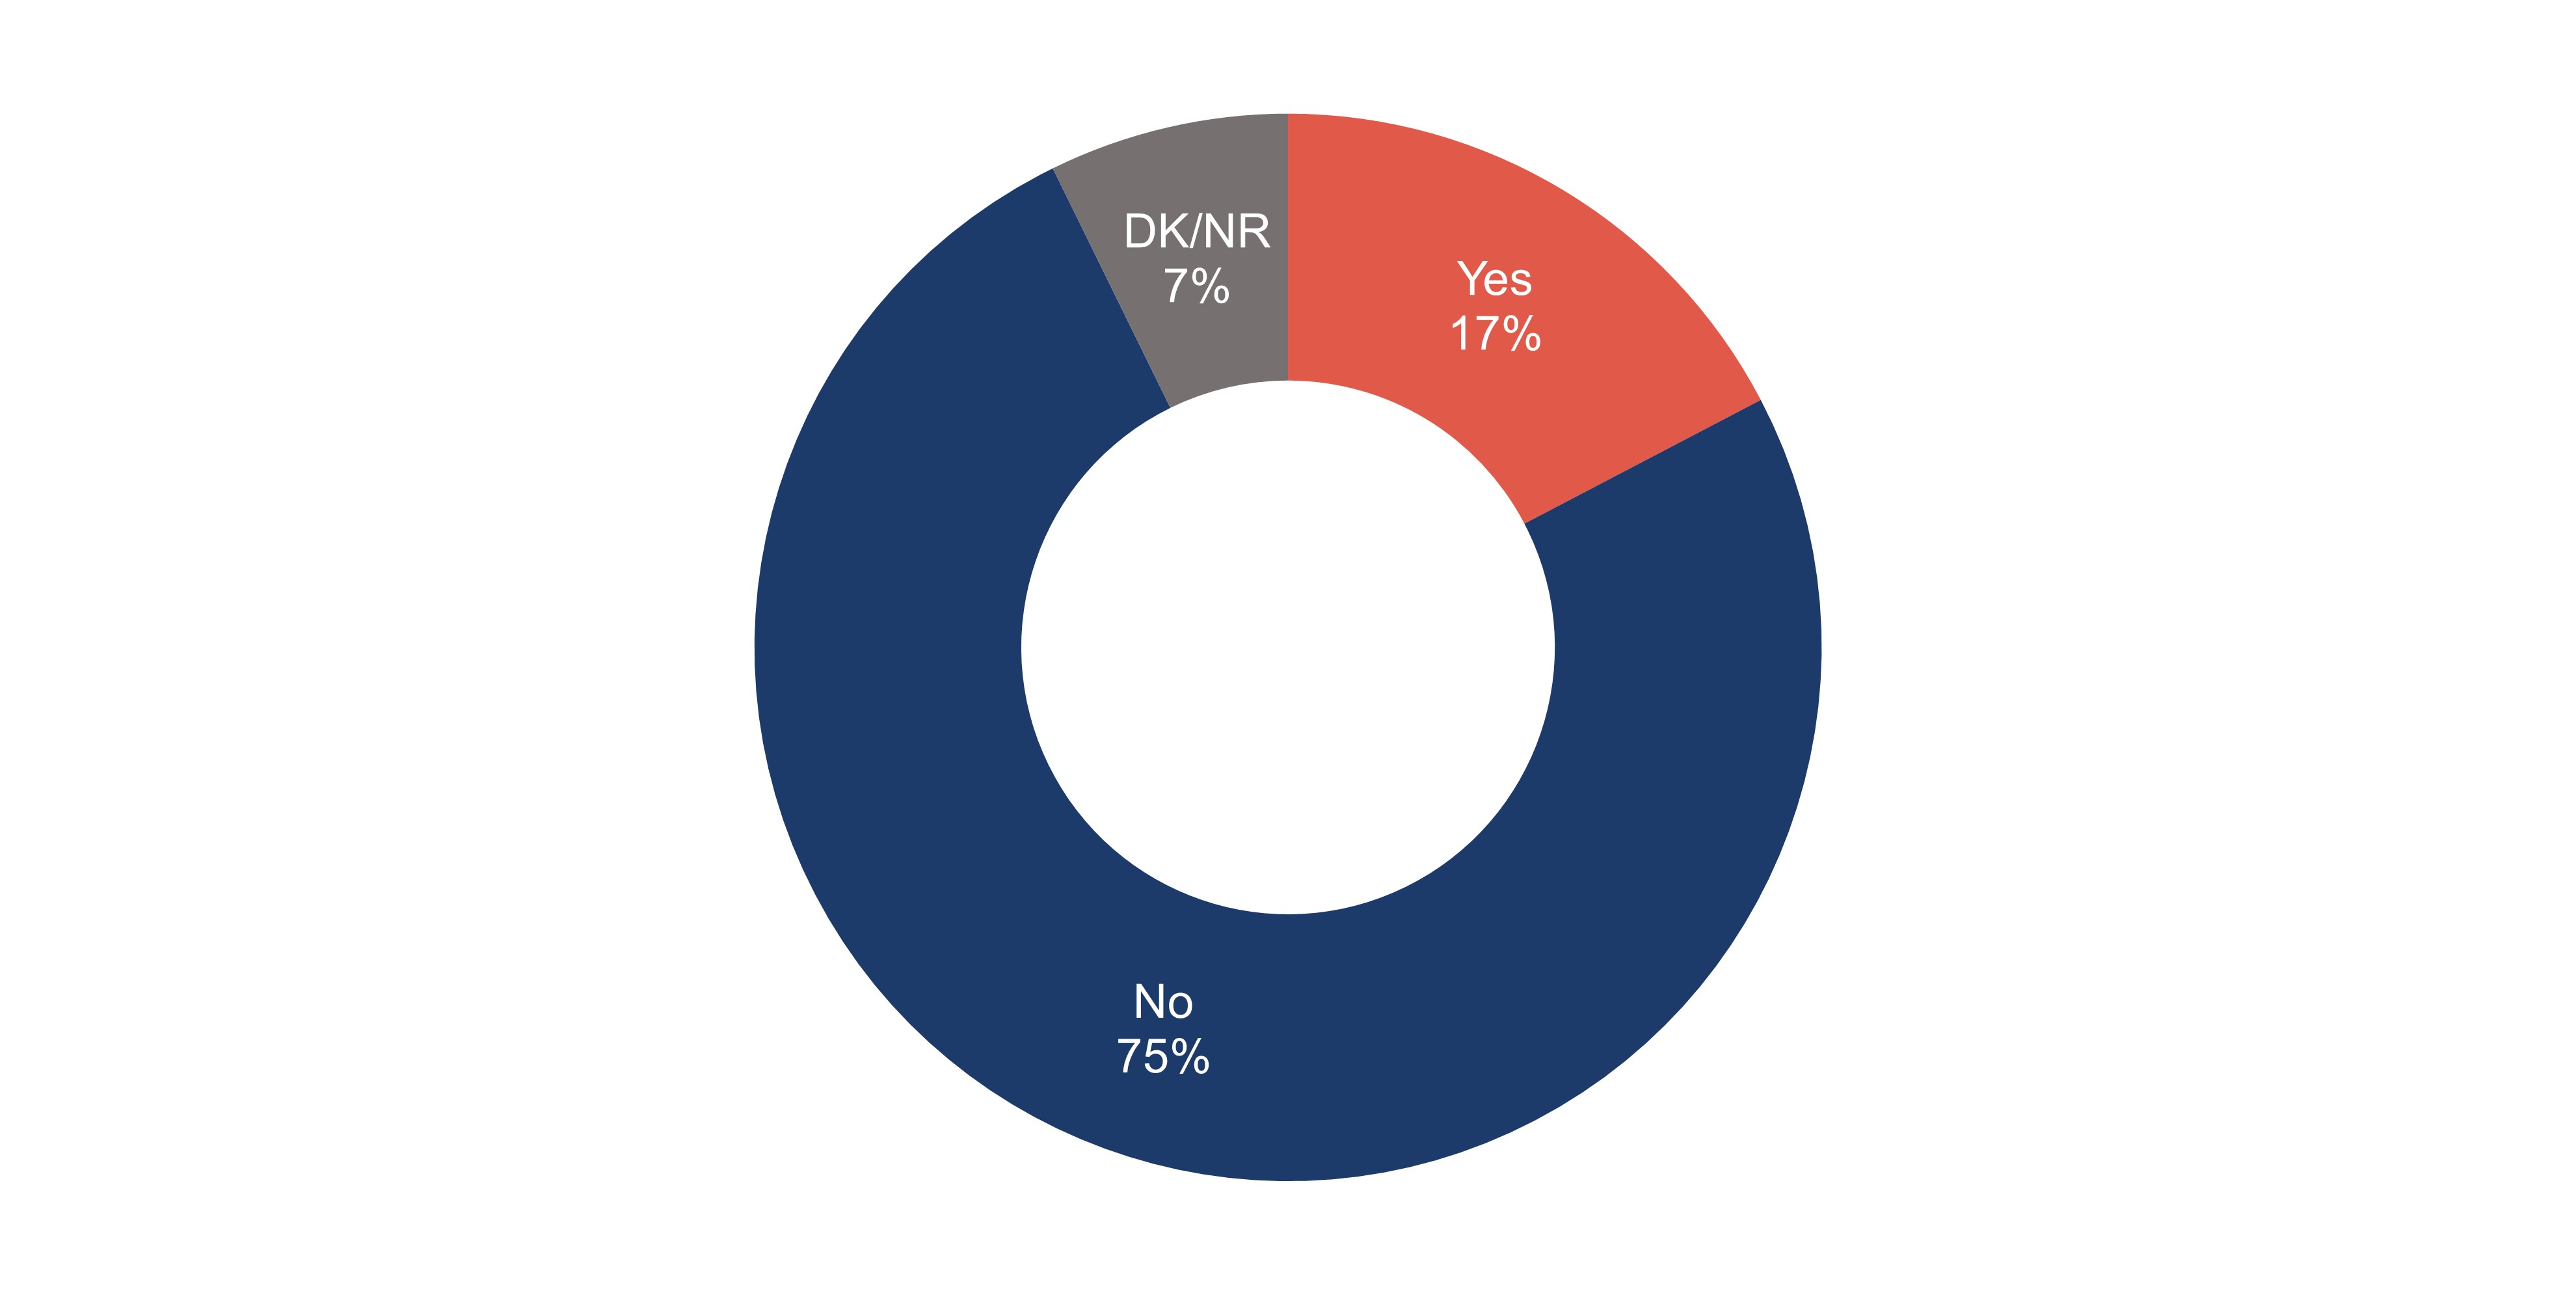
The vast majority (75%) of survey respondents say they have not heard of the concept of dementia-inclusive communities, while 17% say they have.
Very few focus groups participants claimed or demonstrated awareness of the term "dementia-inclusive community". Assumptions that were made about the term almost always meant something more akin to a long-term care community tailored to serve residents who were living with dementia.
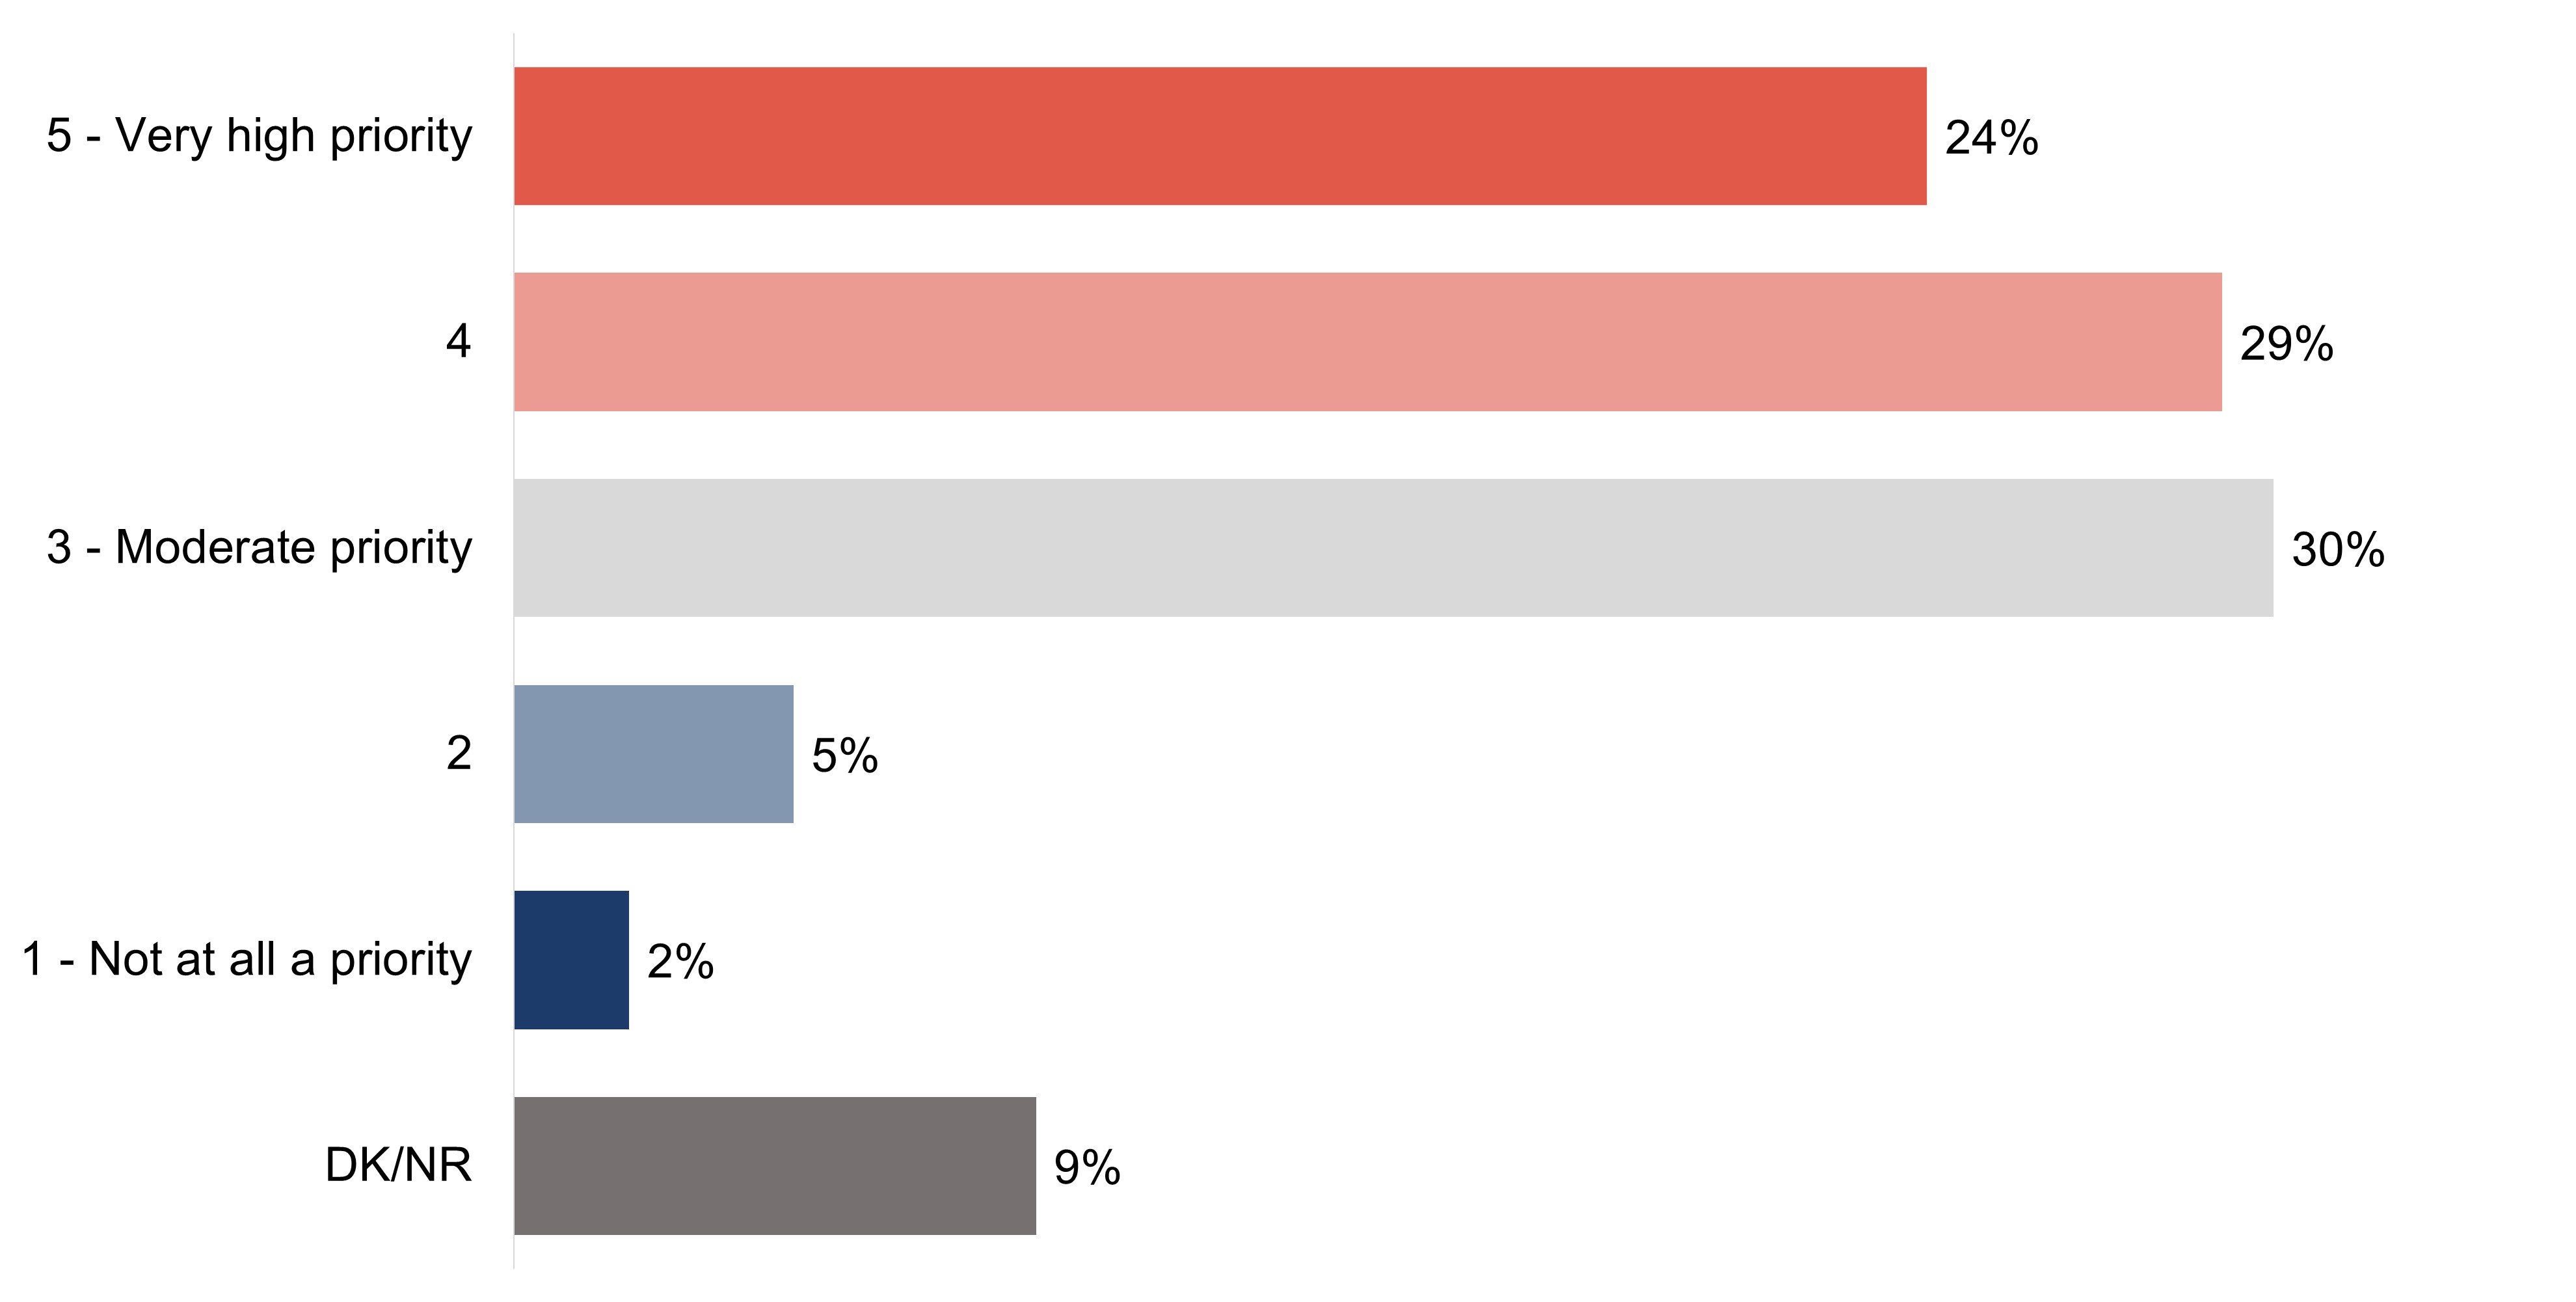
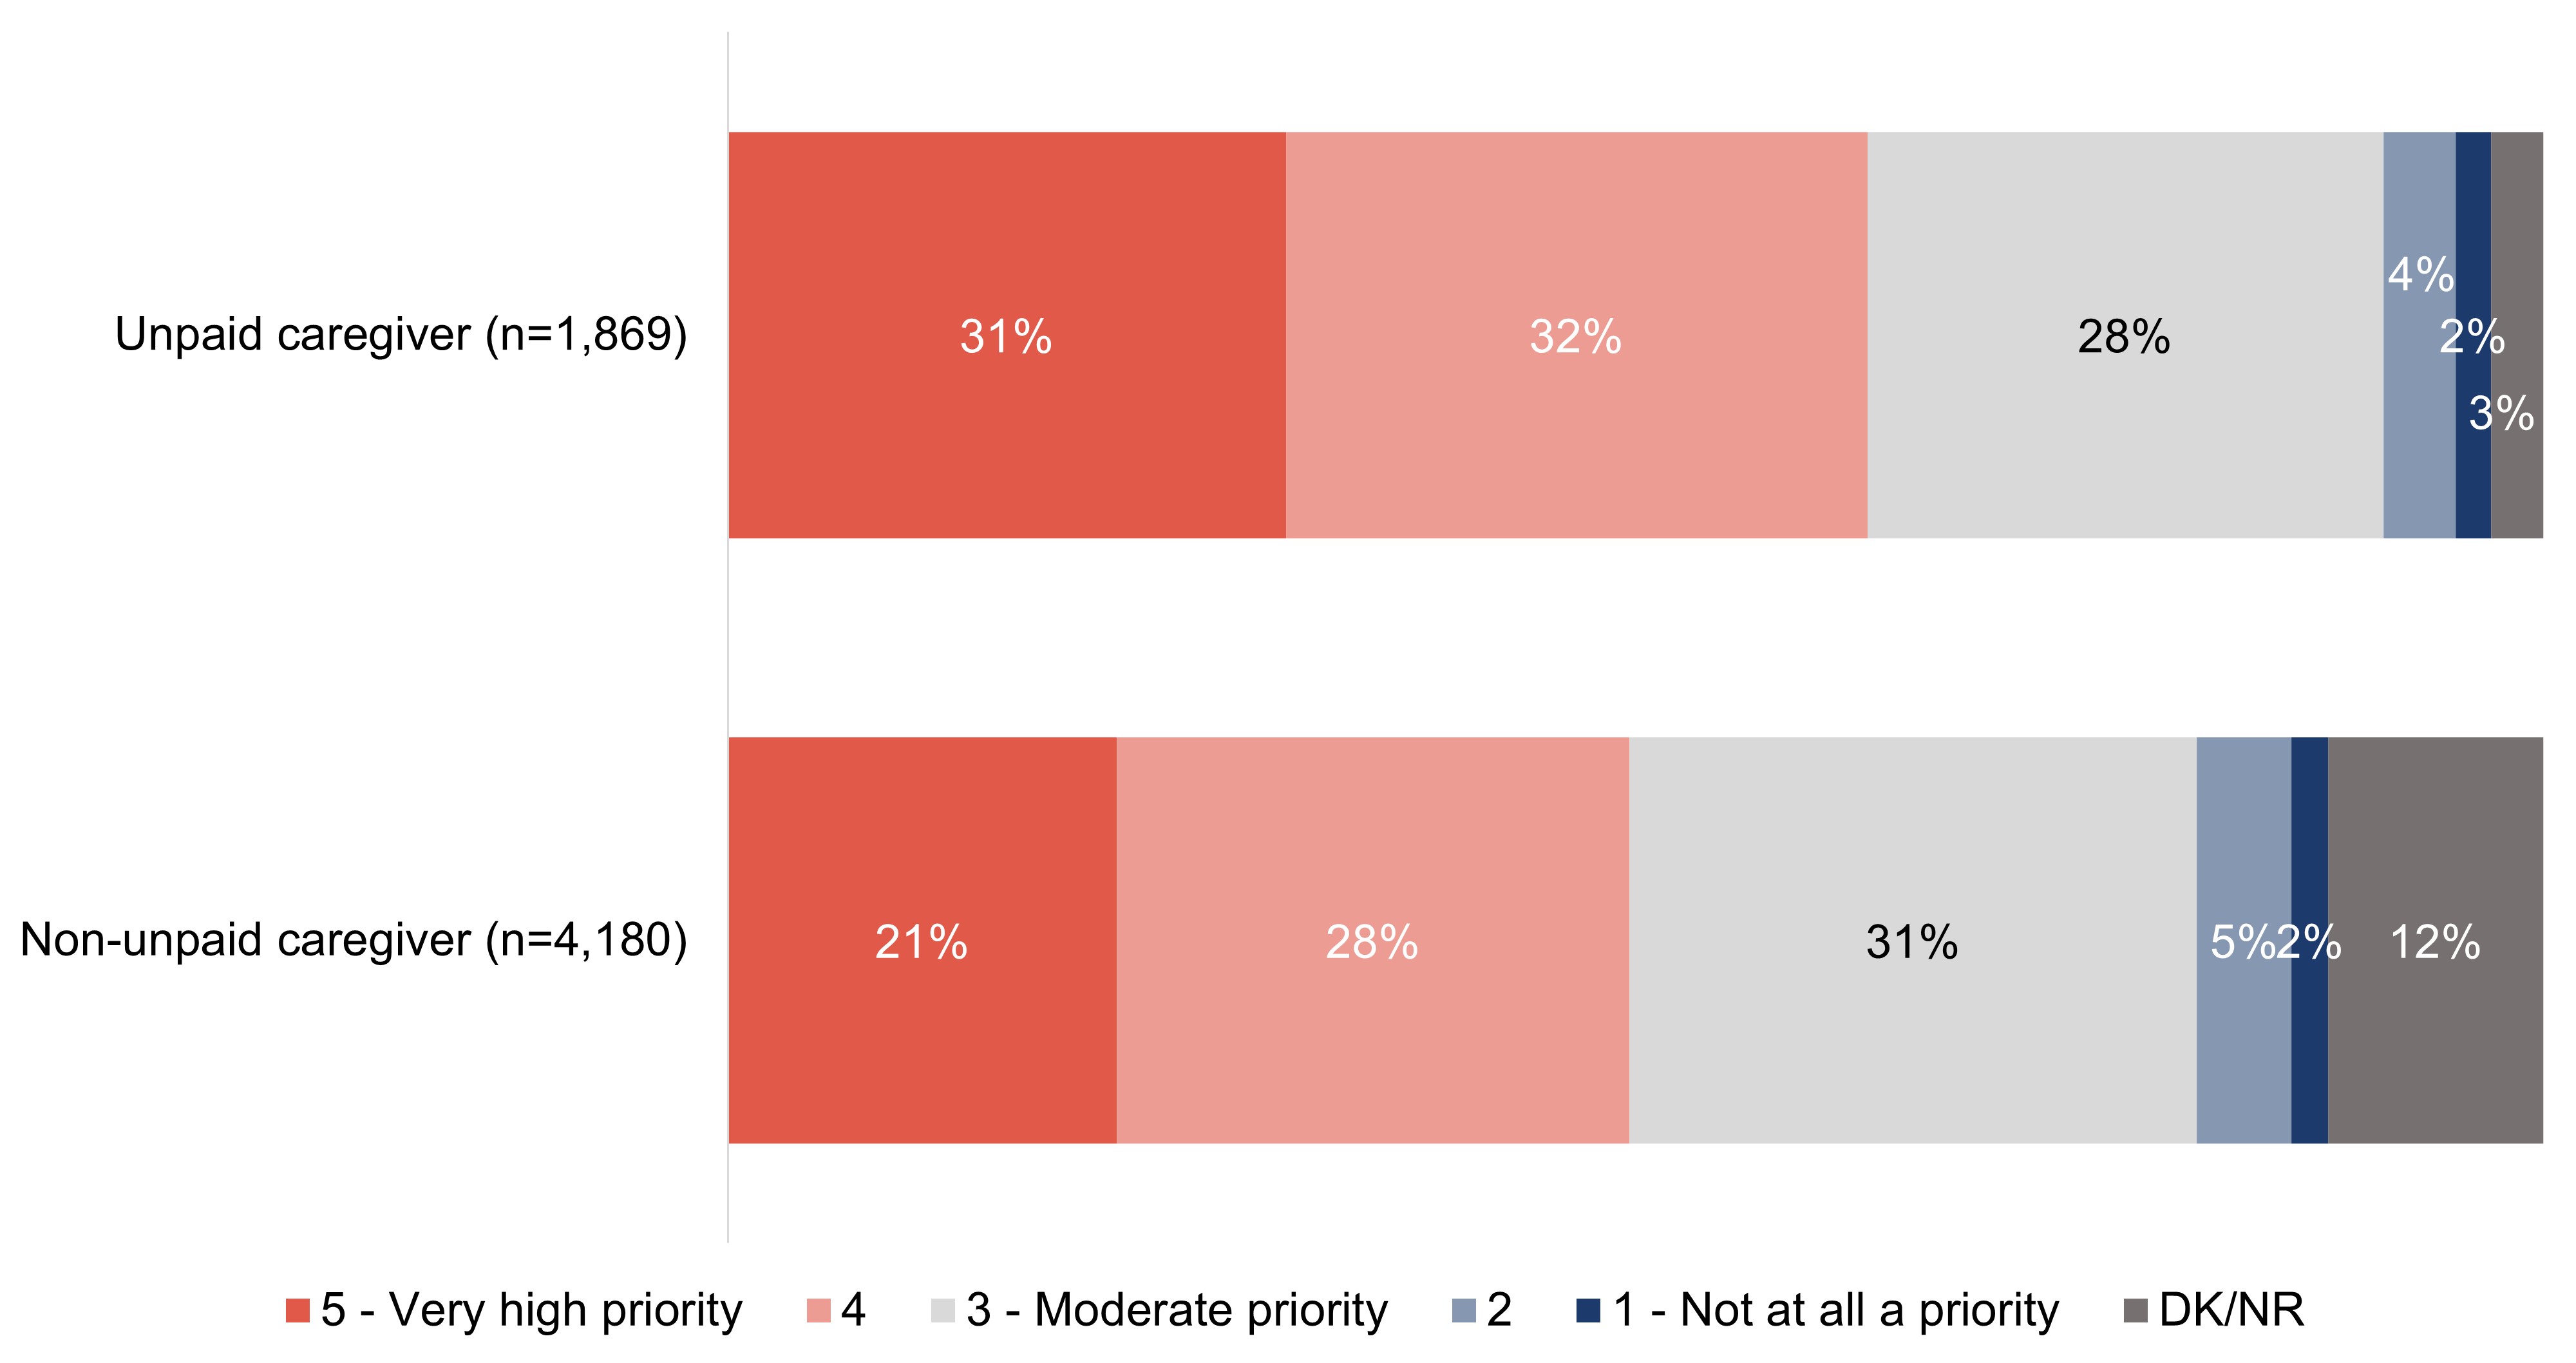
The majority of survey respondents (54%) believe it is a high priority for their community to become more dementia-inclusive, while 30% would classify the priority as "moderate." A handful (7%) do not believe it is a priority.
While several were unsure of the feasibility for their community to become more dementia-inclusive, the majority of focus group participants felt it was important.
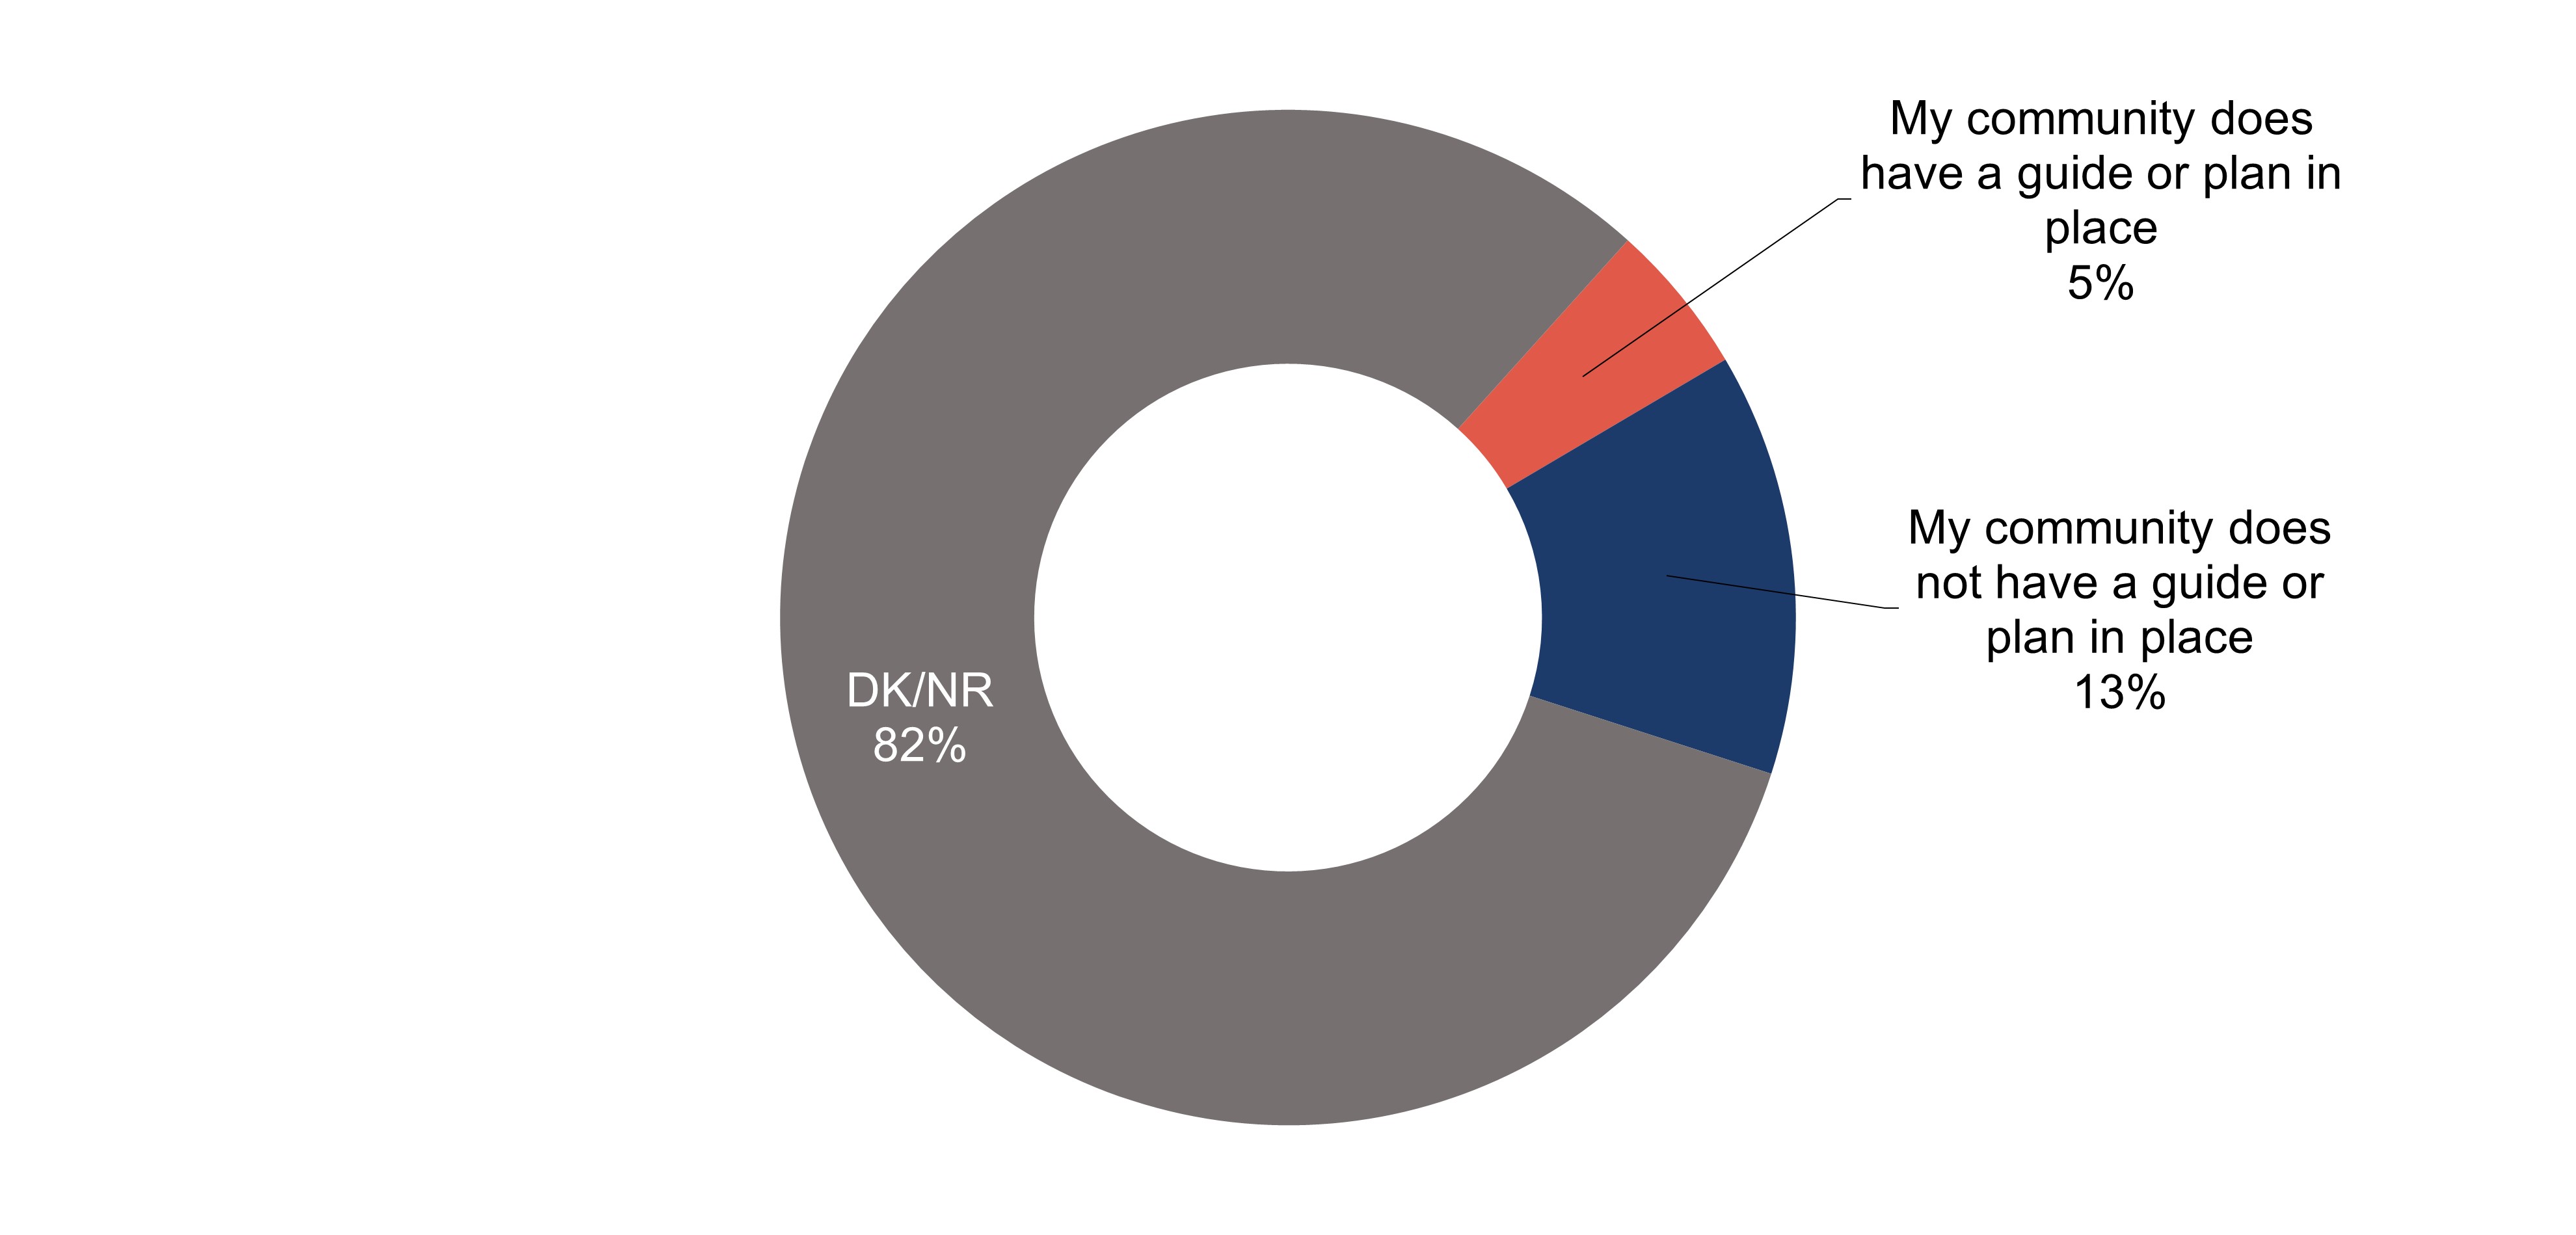
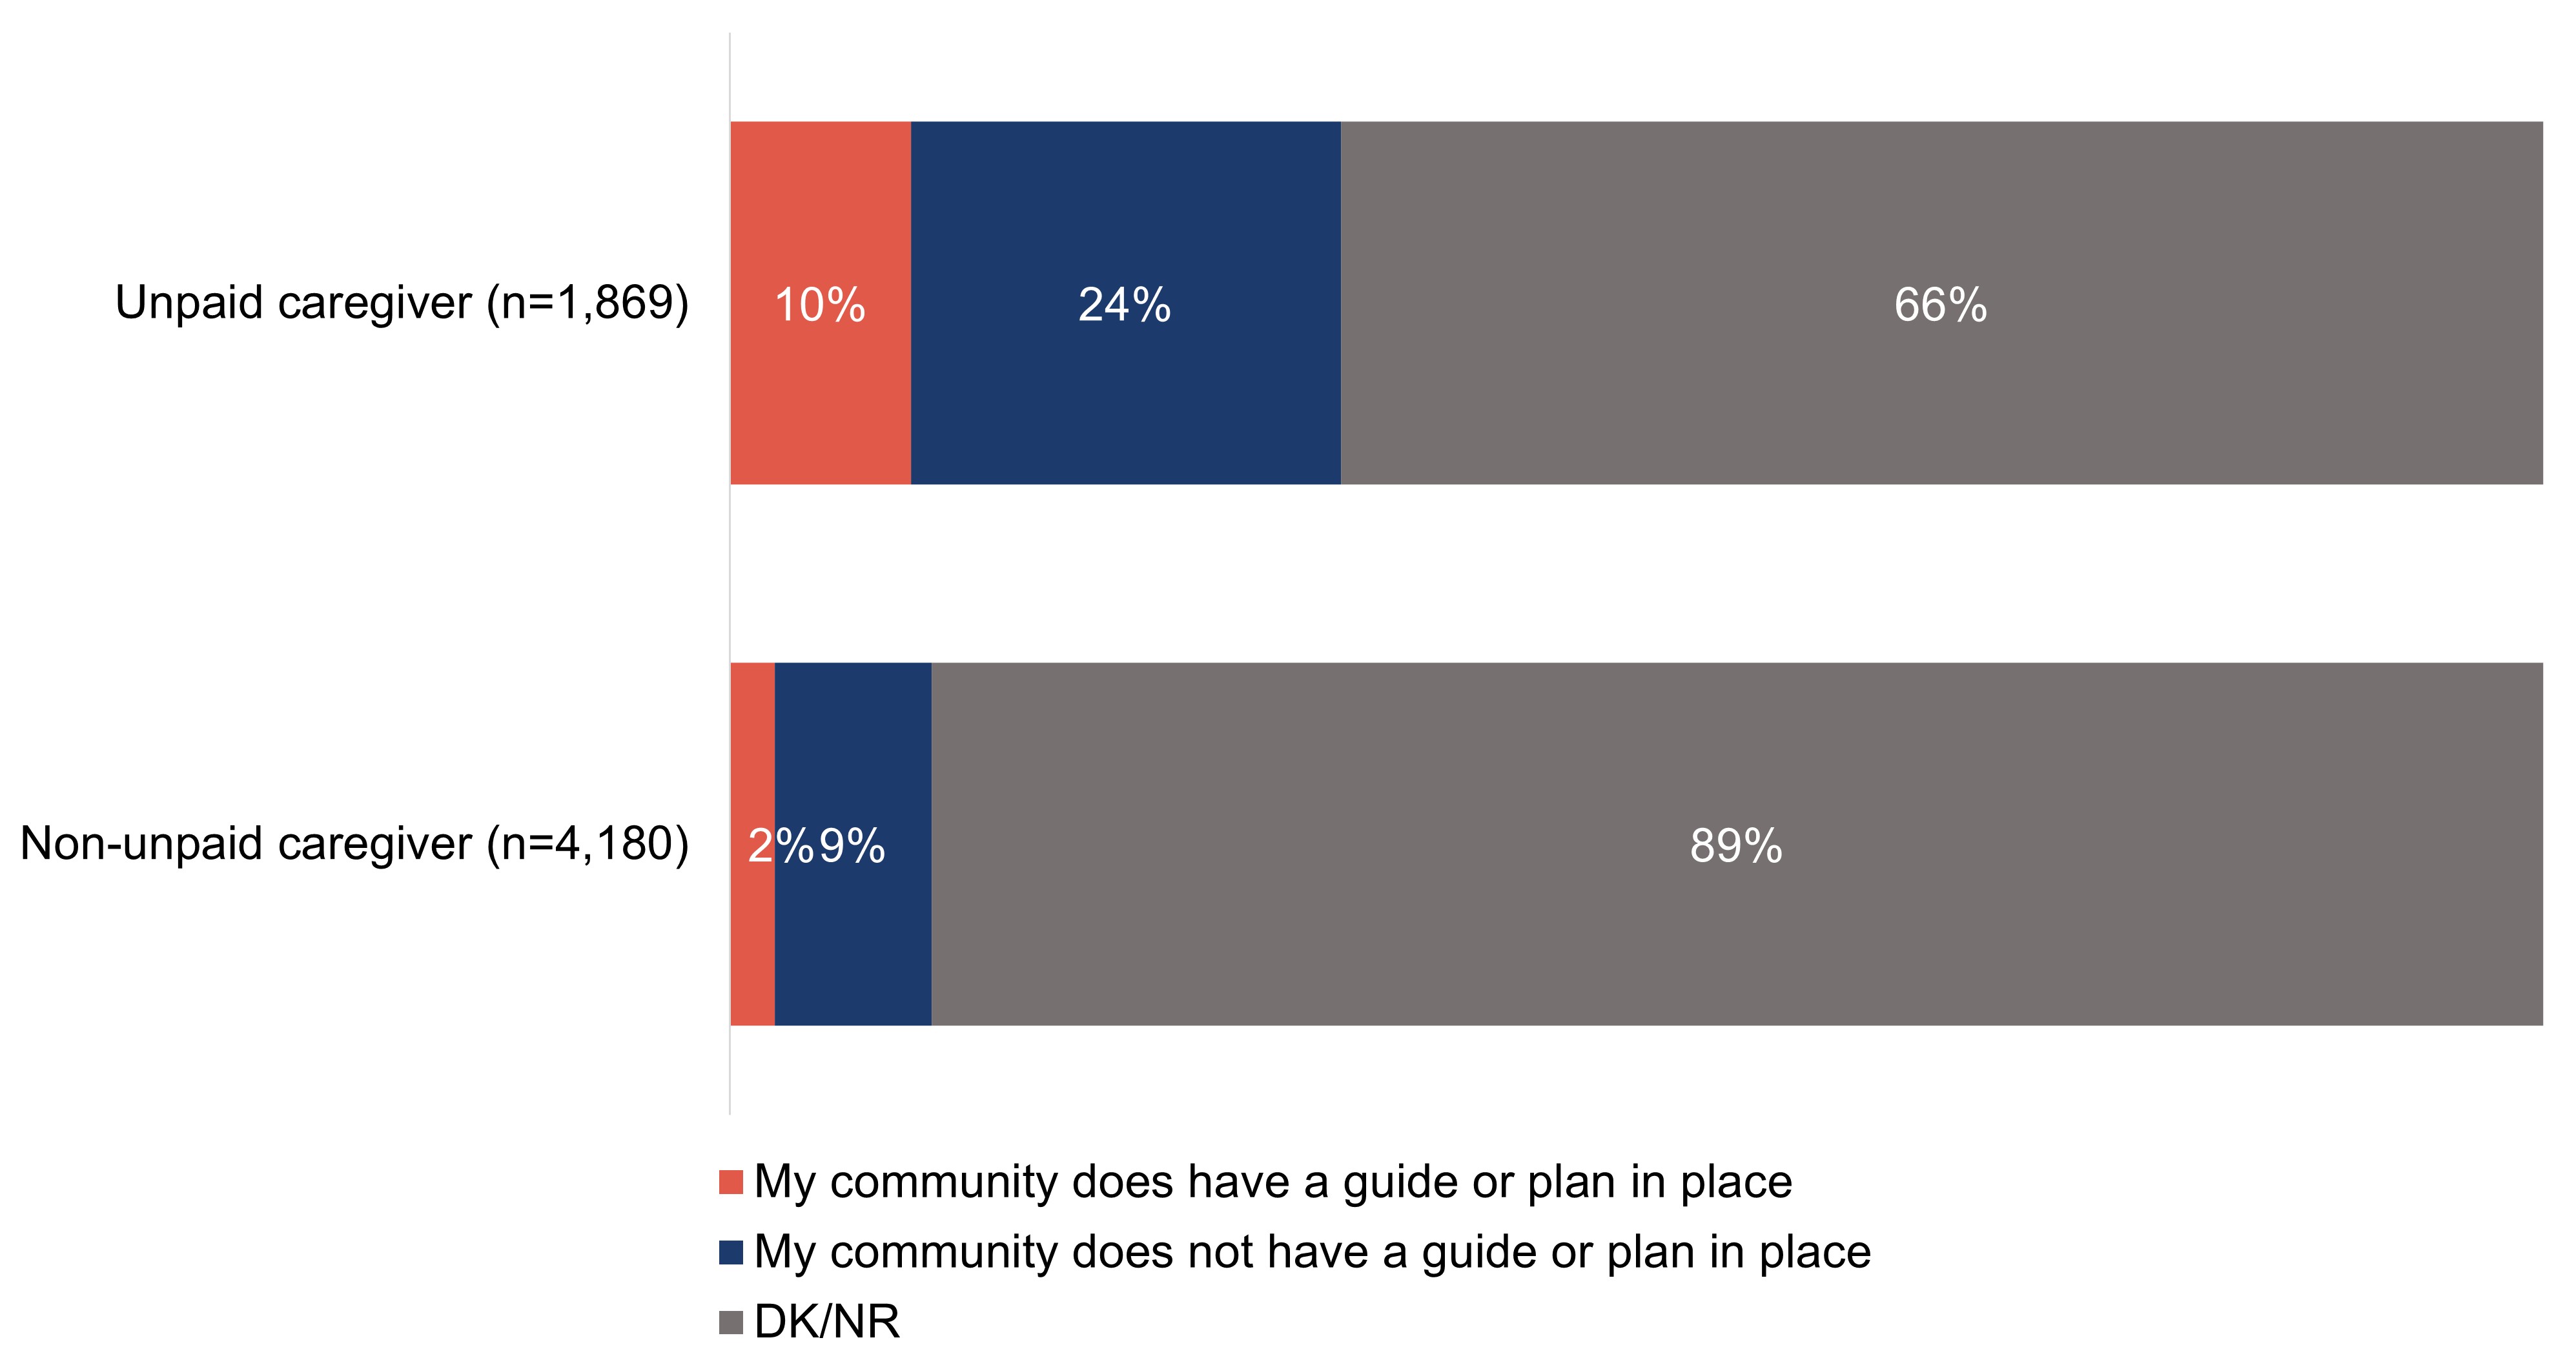
Most survey respondents (82%) are not sure if their community has a guide or plan in place to be more dementia-inclusive; 13% say it does not, while 5% say it does.
A strong majority of survey respondents (66%) are unable to/do not name any measures a dementia-inclusive community might provide on an unaided basis. The same was found for focus group participants.
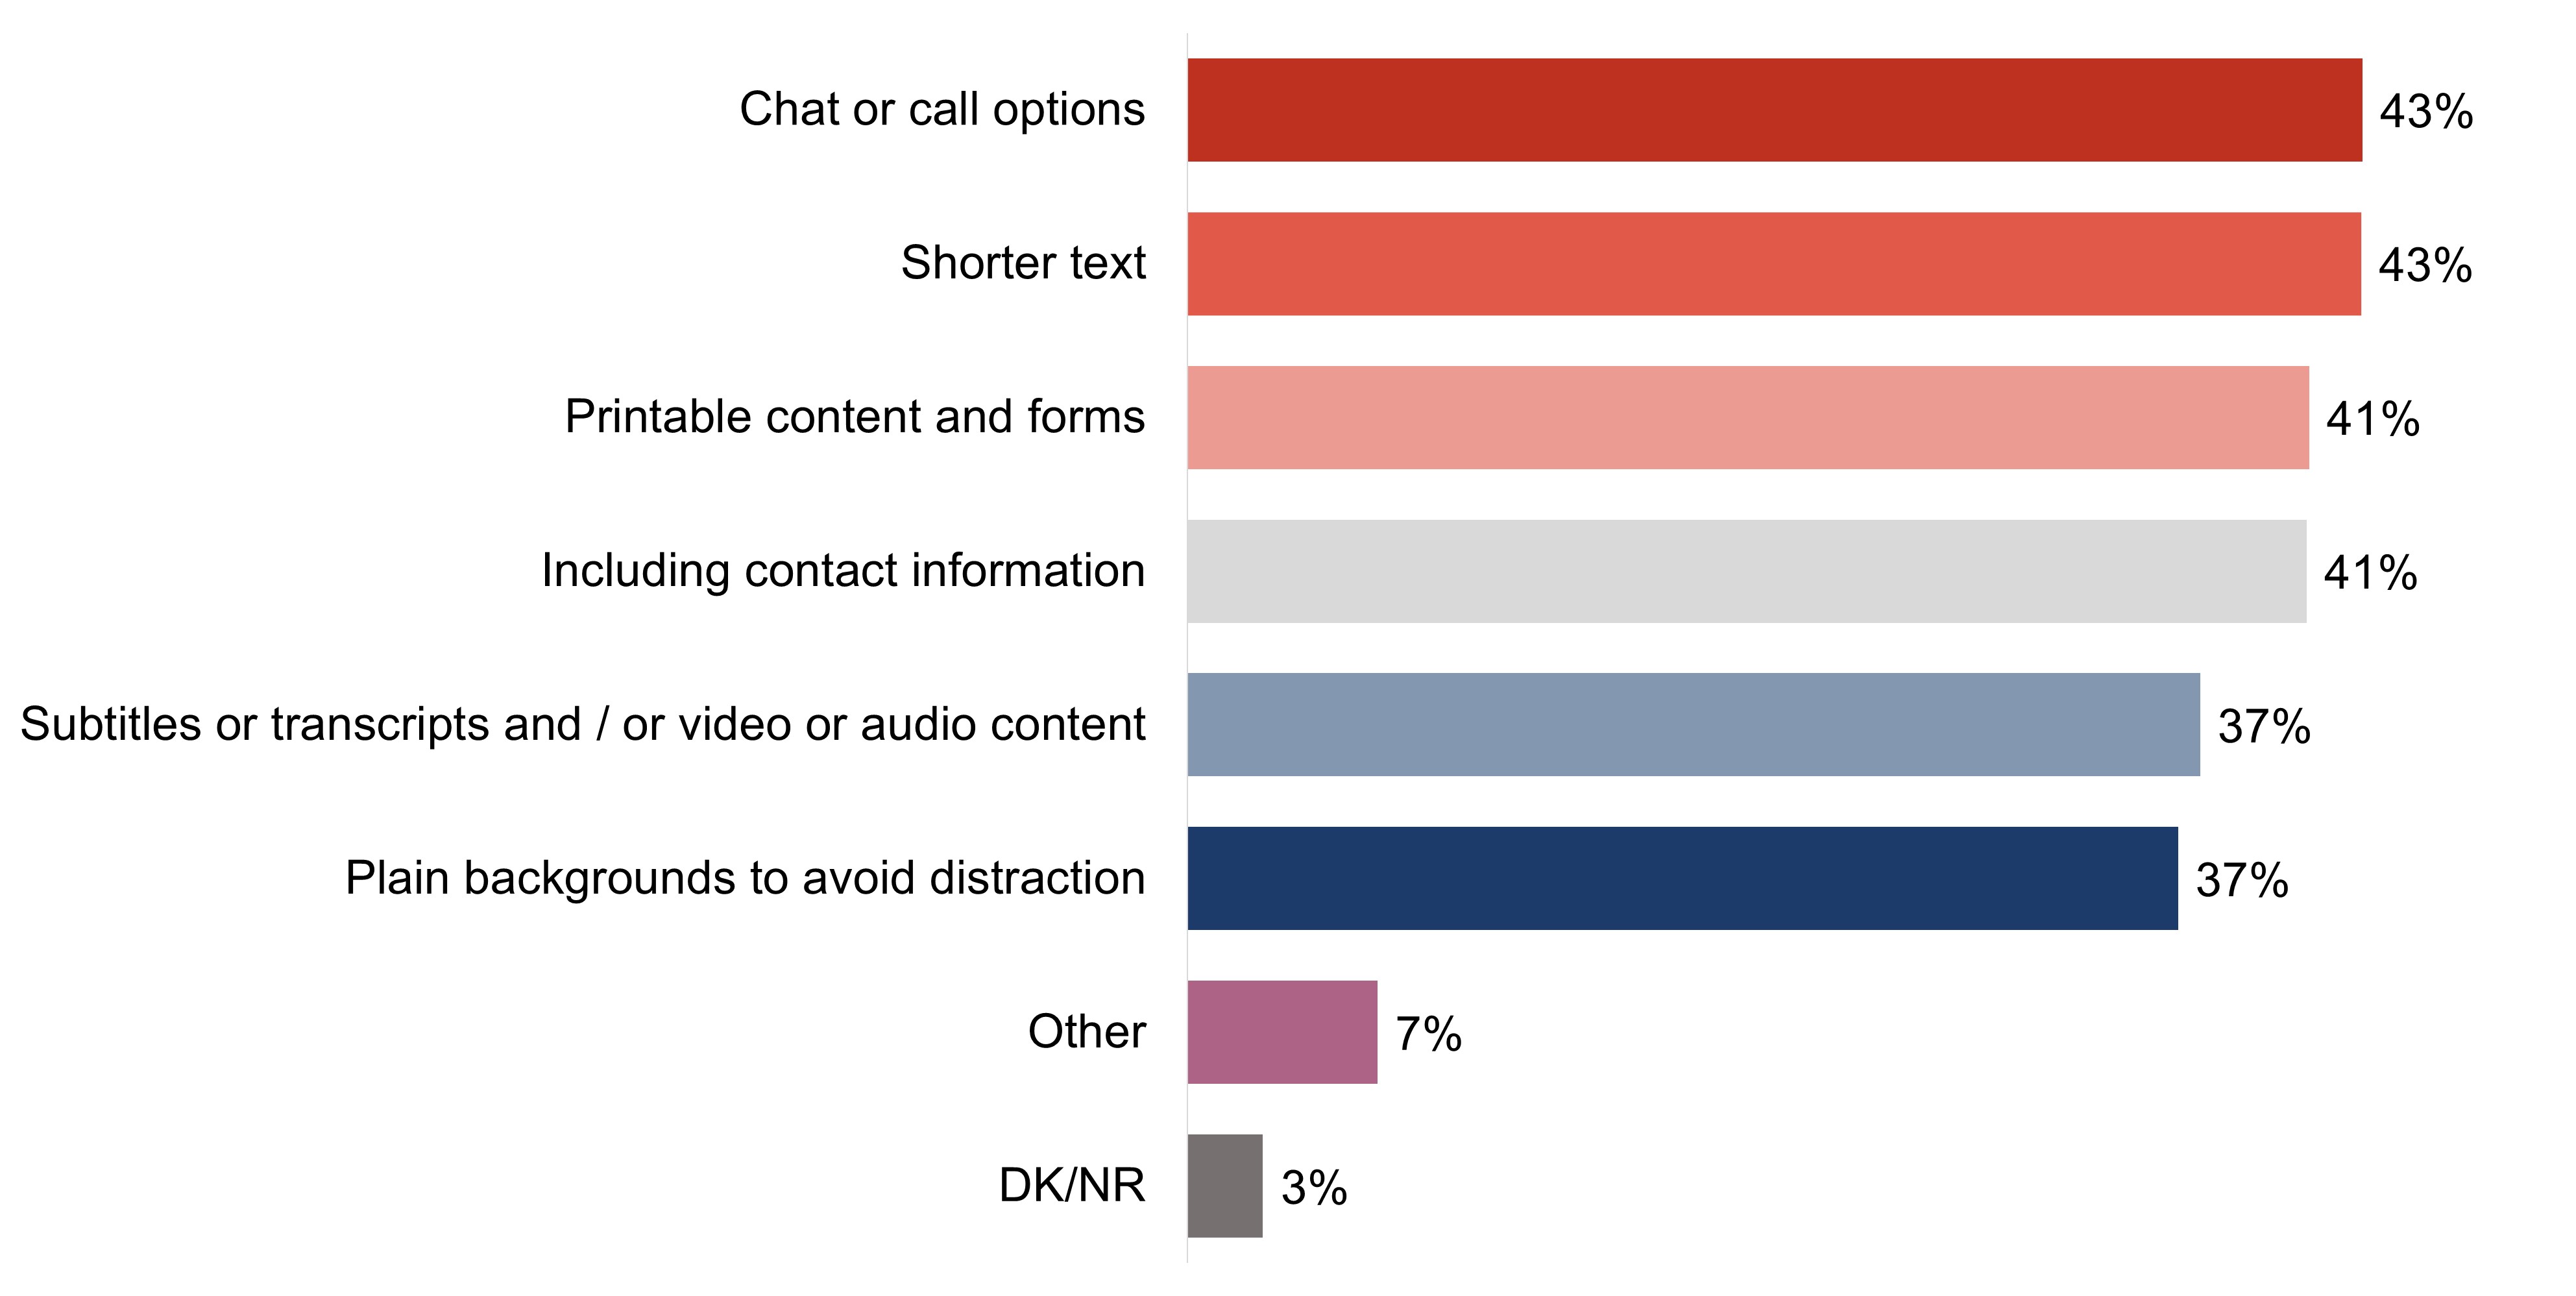
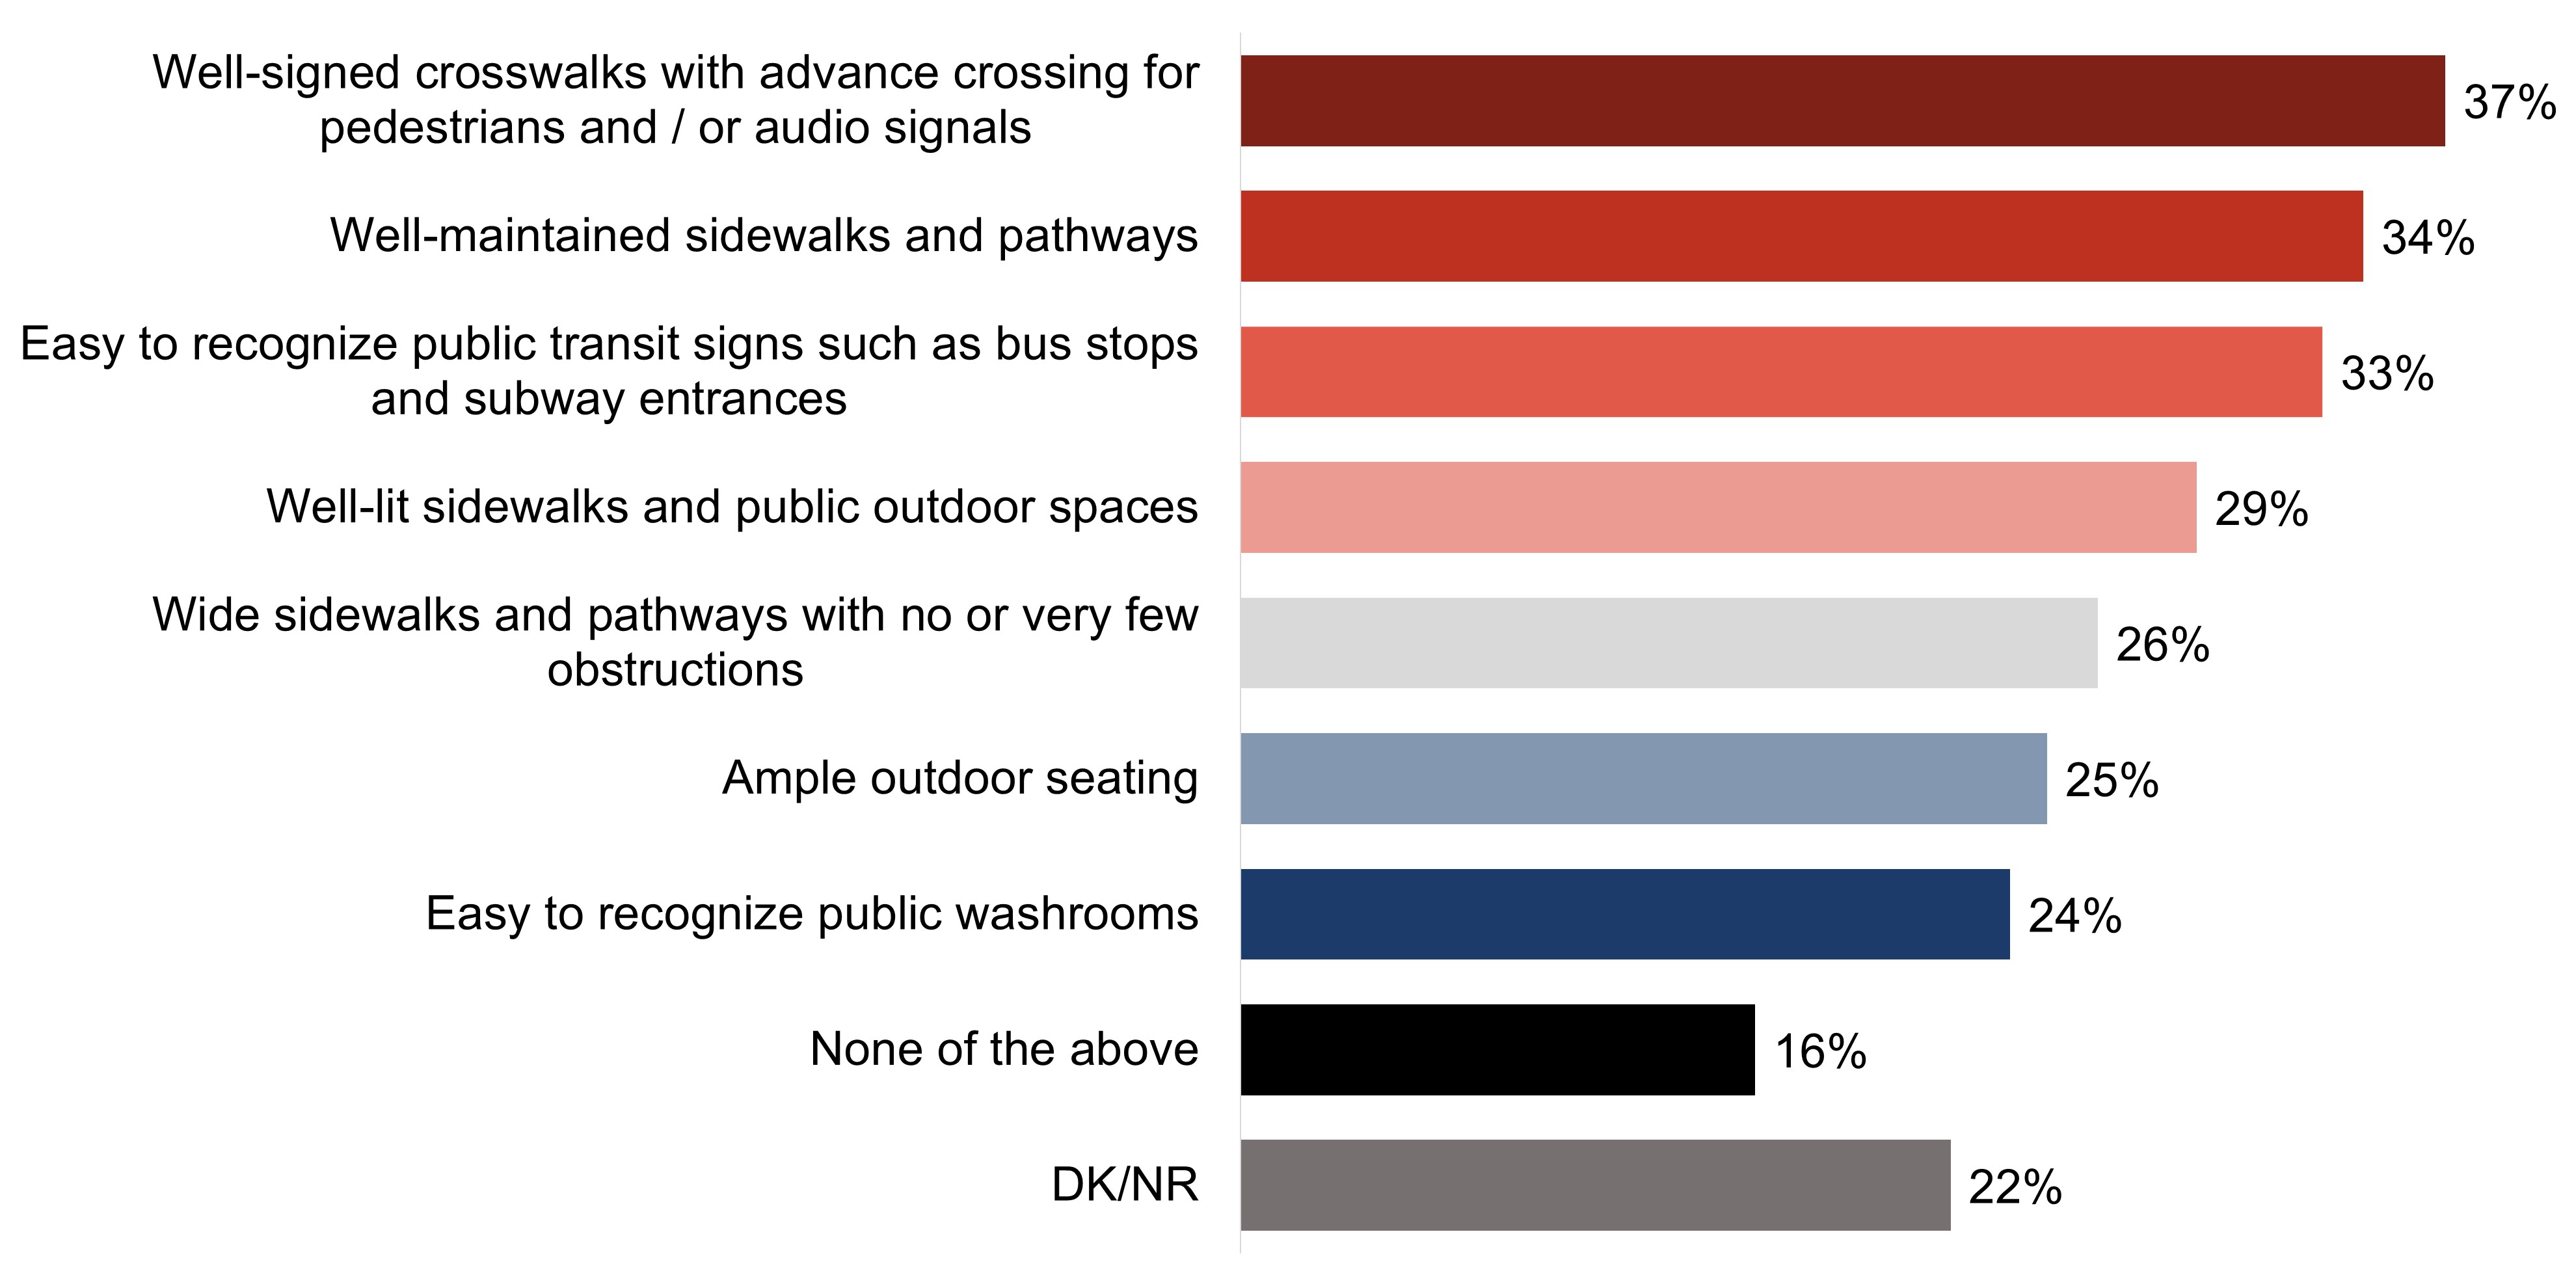
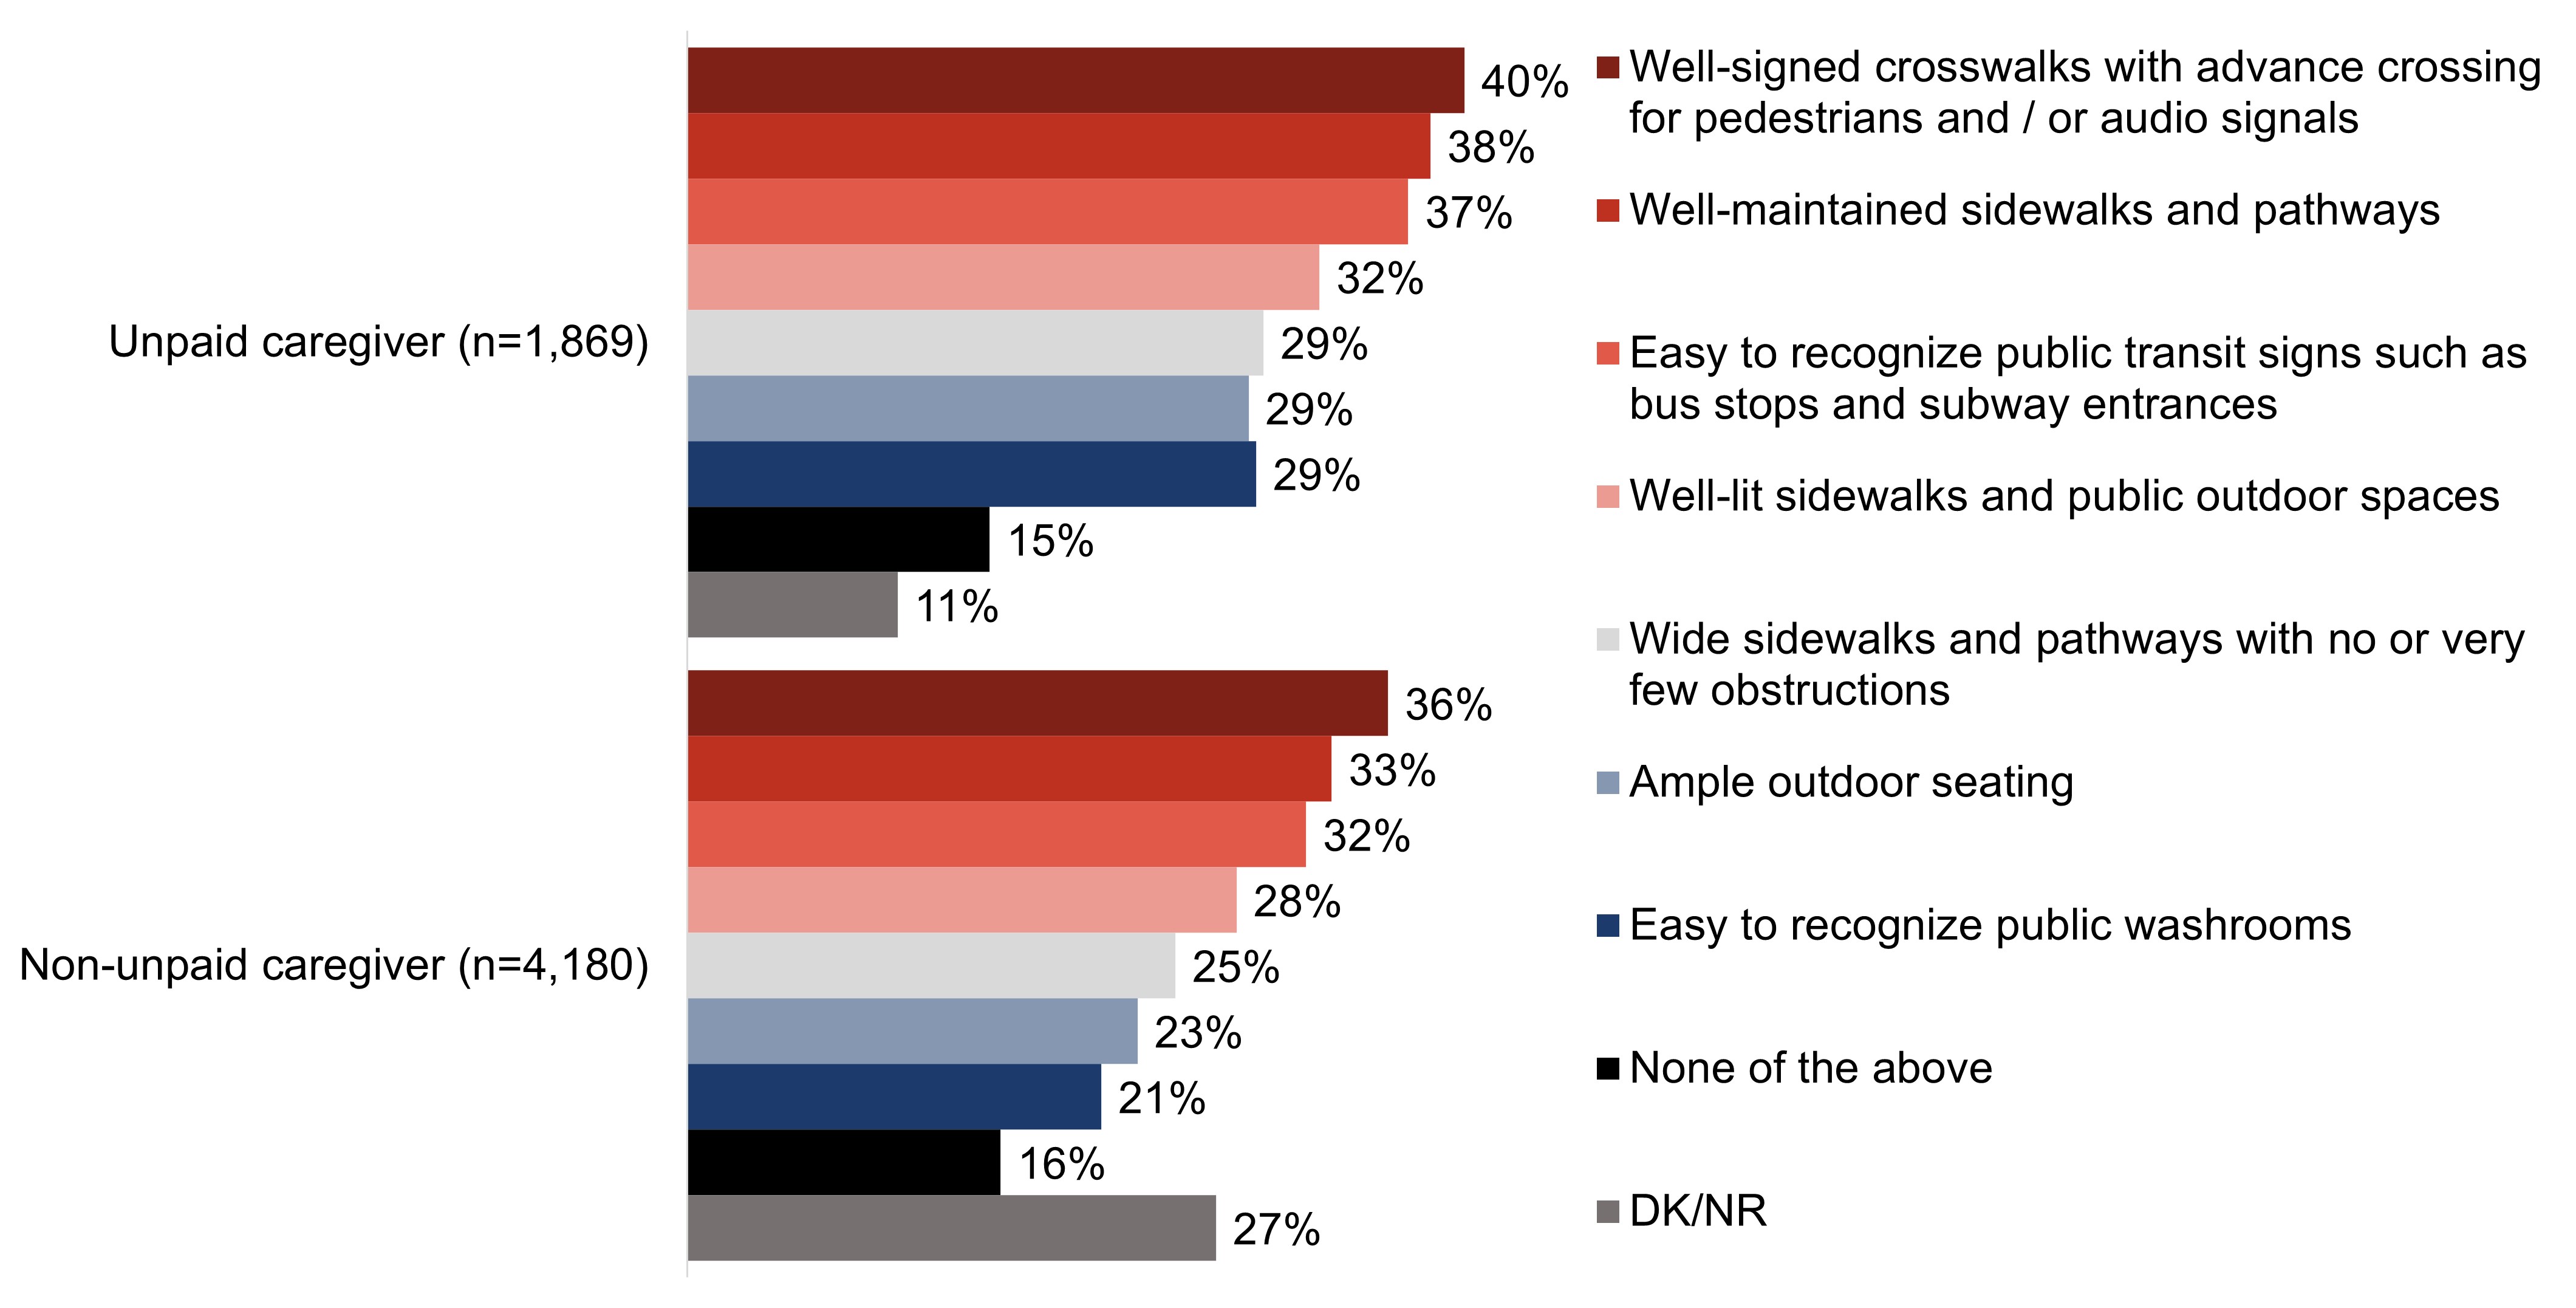
Among the dementia-inclusive measures included in the questionnaire, one-third or more say that their community has inclusive crosswalks (37%), well-maintained pathways (34%) and easily recognizable transit signs (33%).
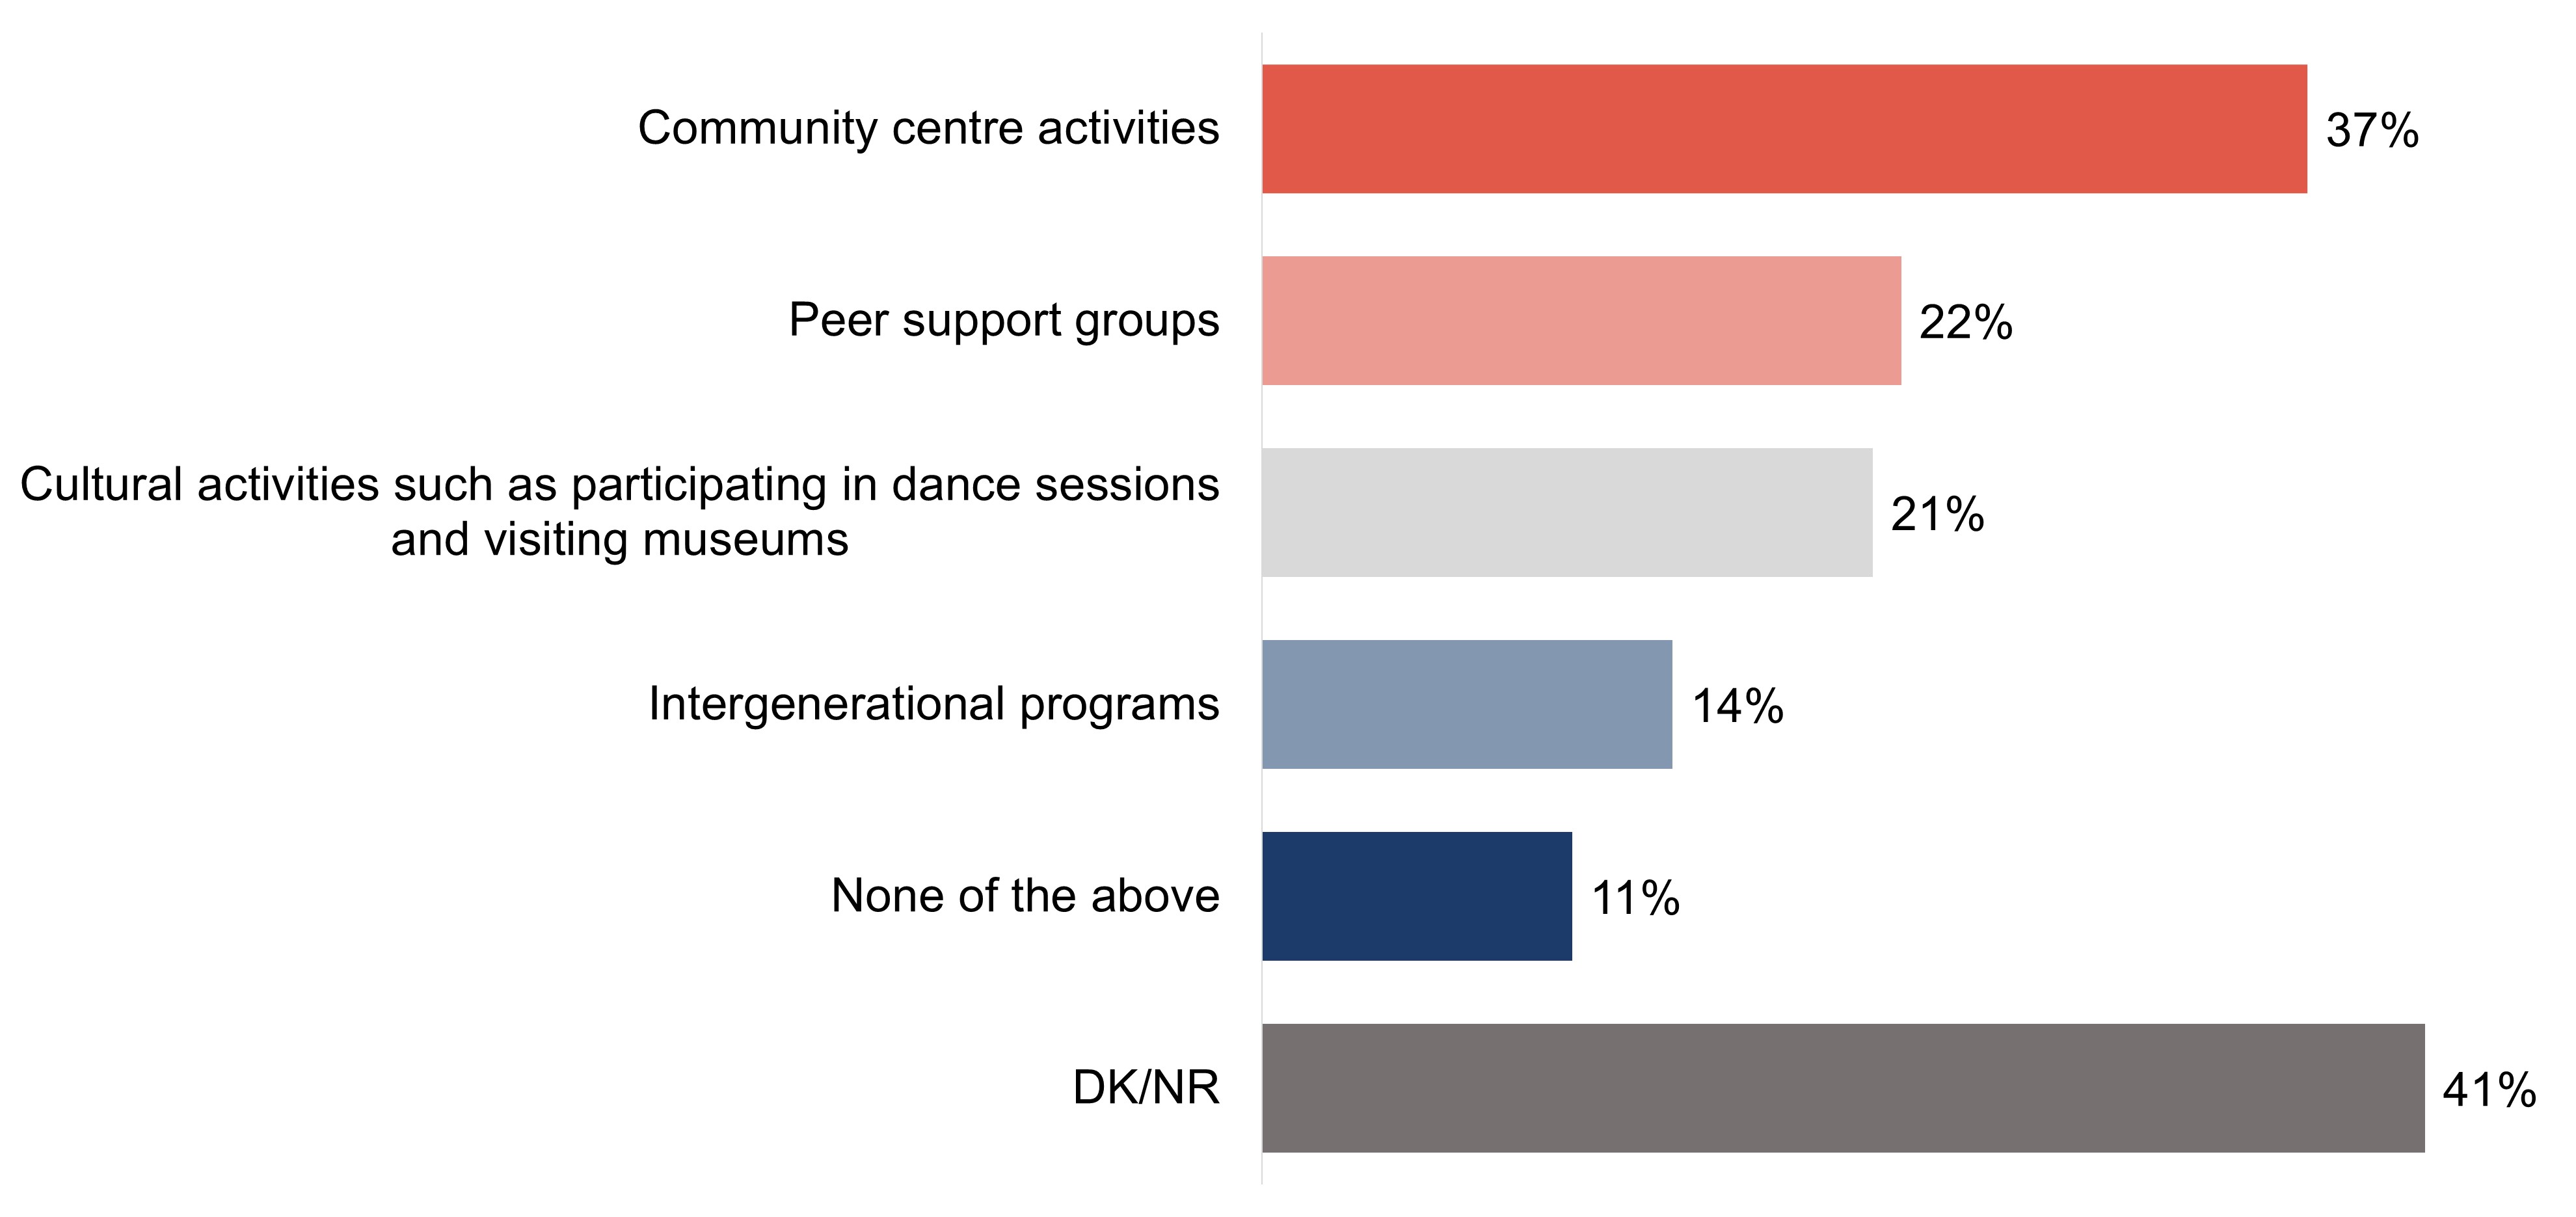
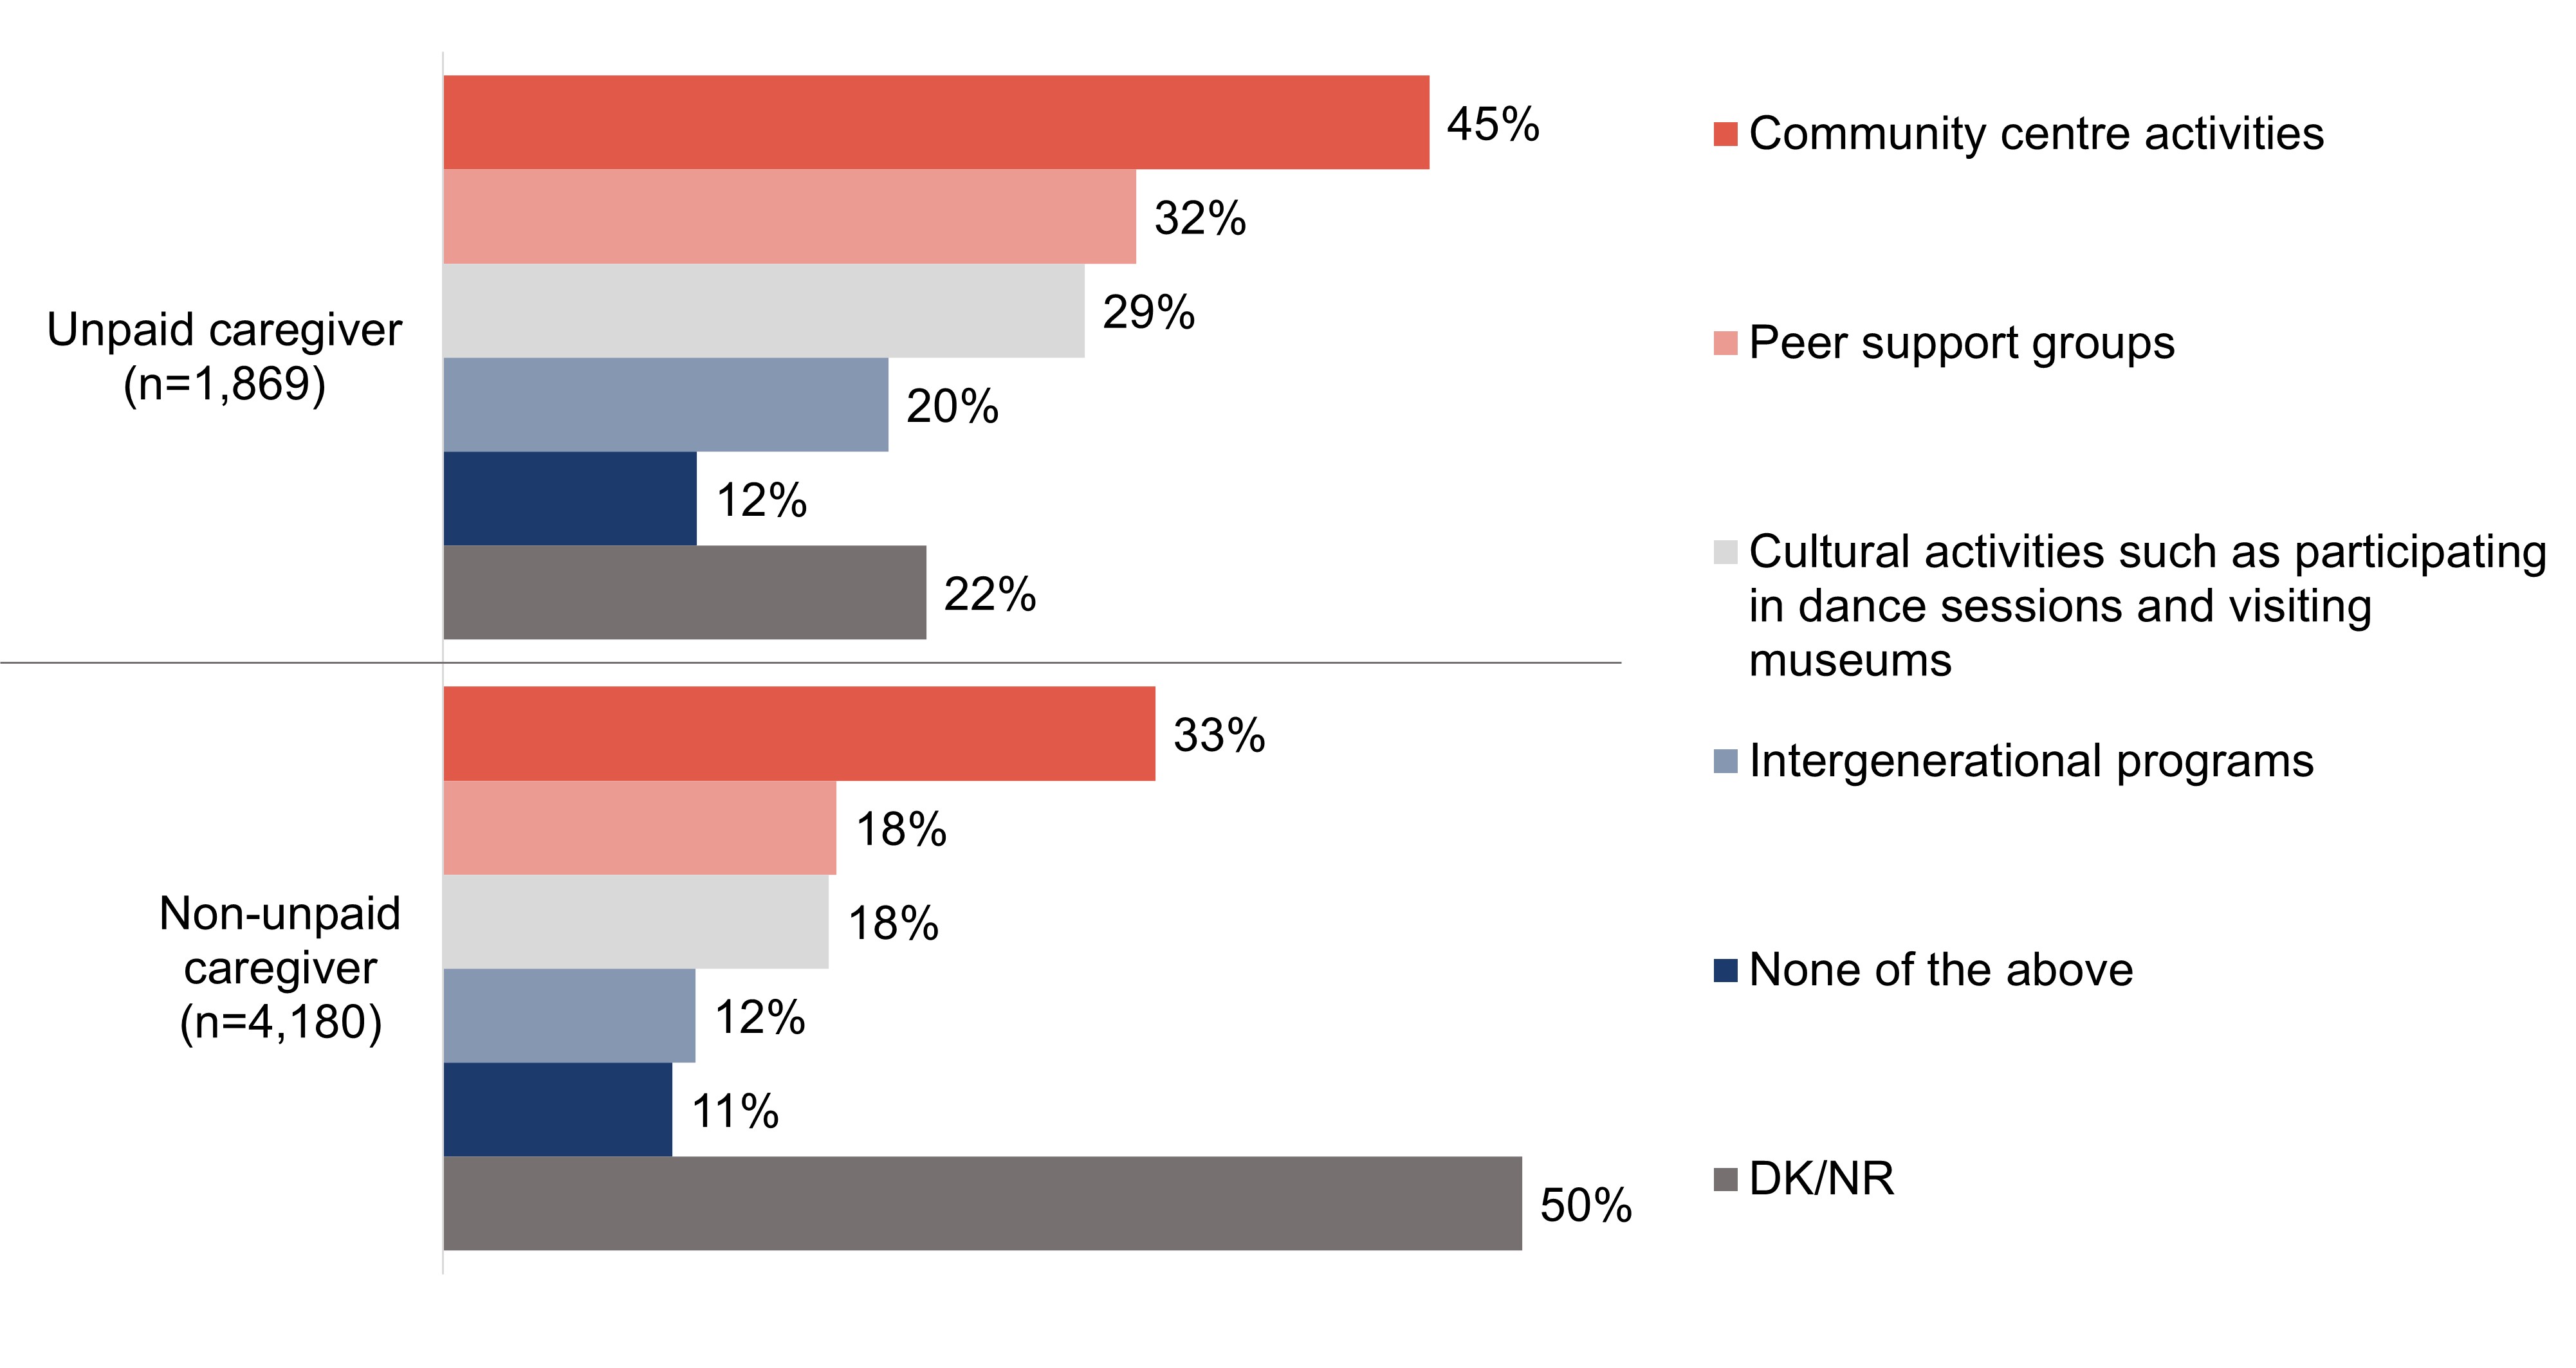
Over two in five (41%) survey respondents say they are unsure if their community offers any of the dementia-inclusive activities included in the questionnaire, though a similar proportion (37%) say their community centre provides dementia-inclusive activities.
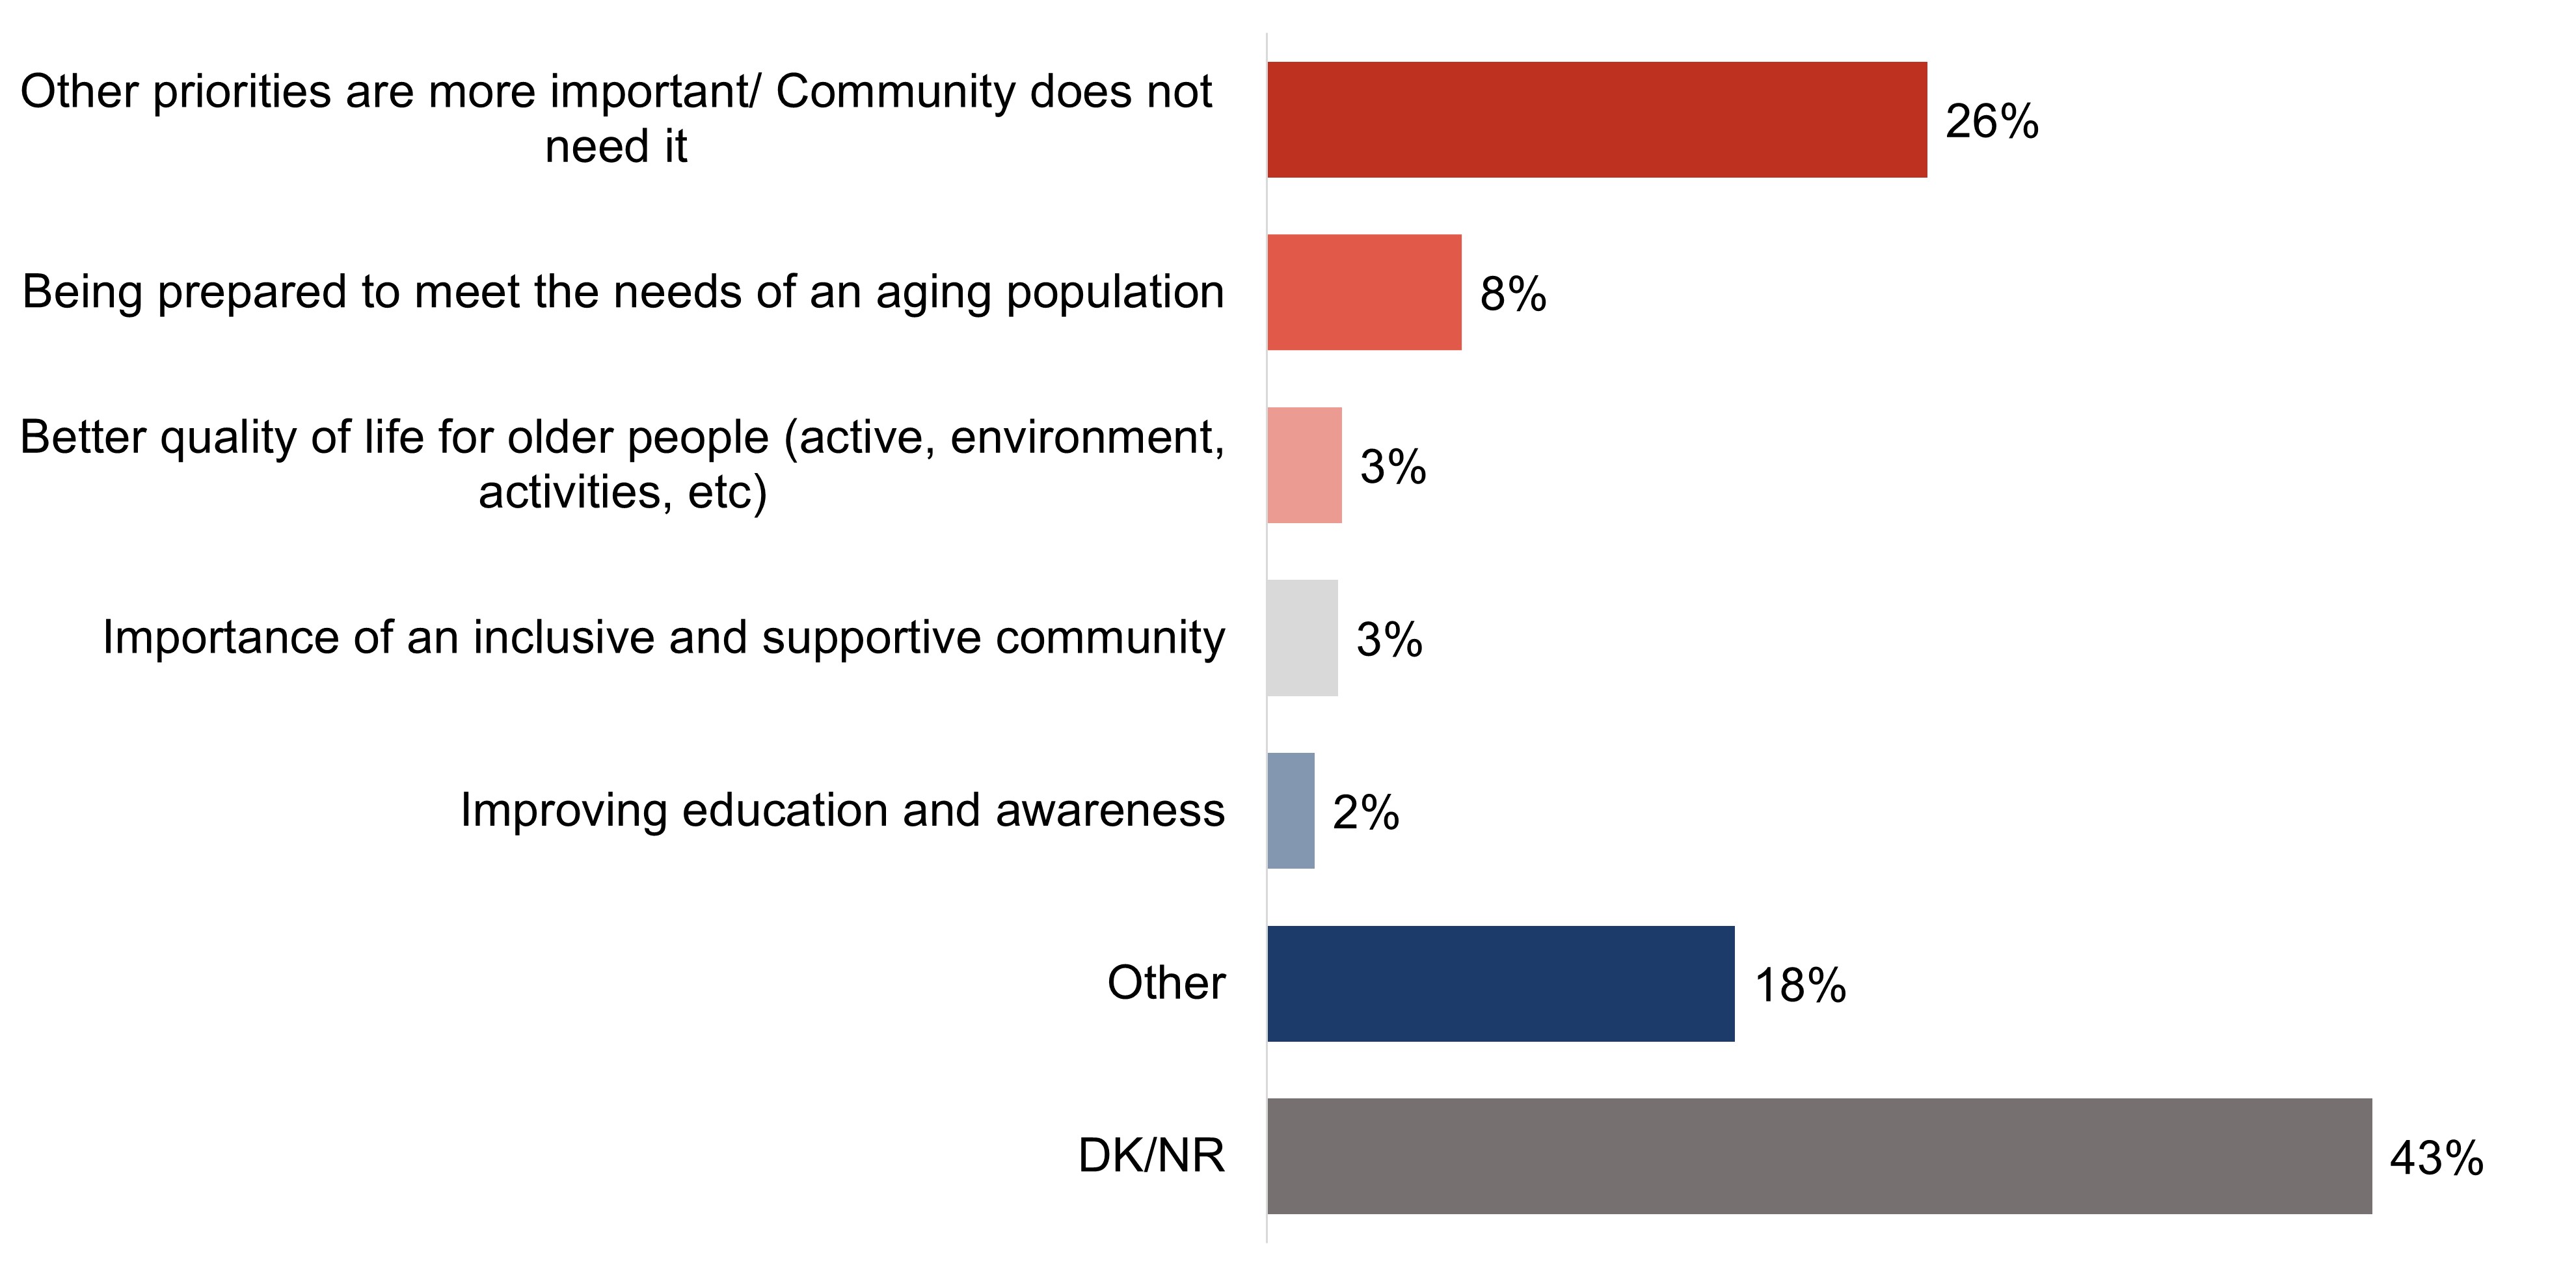
A handful of responses offered by focus group participants as activities in place within their community to support the inclusion of people living with dementia were the Alzheimer's Society, long-term care facilities, seniors' groups, community centres, and home and community support services, though awareness of these types of activities was generally low.
Research firm: Earnscliffe Strategy Group (Earnscliffe)
Contract number: CW2273819
Contract value: $216,770.95
Contract award date: February 17, 2023
I hereby certify as a representative of Earnscliffe Strategy Group that the final deliverables fully comply with the Government of Canada political neutrality requirements outlined in the Communications Policy of the Government of Canada and Procedures for Planning and Contracting Public Opinion Research. Specifically, the deliverables do not include information on electoral voting intentions, political party preferences, standings with the electorate or ratings of the performance of a political party or its leaders.
Signed: Date: August 28, 2023
Stephanie Constable
Introduction
Earnscliffe Strategy Group (Earnscliffe) is pleased to present this report to the Public Health Agency of Canada (PHAC) summarizing the results of a two-phased qualitative and quantitative research project exploring Canadians' attitudes and knowledge in promoting safe and supportive dementia-inclusive communities.
Released in 2019 and required under the National Strategy for Alzheimer's Disease and Other Dementias Act, Canada's national dementia strategy, A Dementia Strategy for Canada: Together We Aspire, supports the vision of a Canada in which all people living with dementia and caregivers are valued and supported, quality of life is optimized, and dementia is prevented, well understood, and effectively treated. The strategy identifies three national objectives: prevent dementia; advance therapies and find a cure; and improve the quality of life of people living with dementia and caregivers.
The national dementia strategy recognizes the importance of creating dementia-inclusive communities across Canada that maximize quality of life while being supportive, safe, and inclusive for people living with dementia and their caregivers. In dementia-inclusive communities the participation and contribution of people living with dementia is encouraged, supported, and valued. As well, the care and support provided within the community is culturally safe, culturally appropriate, and mindful of diversity. These communities also help to reduce and eliminate barriers, including those resulting from stigma that can lead to social isolation.
This research will assist in supporting the development and implementation of Canada's first national dementia strategy, A Dementia Strategy for Canada: Together we Aspire. Understanding attitudes, knowledge, and experiences related to dementia-inclusive communities in Canada is critical for government and departmental priorities on dementia by informing efforts and prioritizing options for investments intended to support healthy aging and quality of life through such communities. This research will also deepen understanding of the infrastructure, physical and social environments, and programs and policies available to support dementia-inclusive communities.
The primary objective of this research is to provide the Government of Canada with insights into Canadians' attitudes, knowledge and experiences related to dementia-inclusive communities. Research objectives included, but were not limited to:
Assess general knowledge of dementia symptoms and signs;
Measure Canadians' knowledge and understanding of the needs and challenges for people living with dementia related to dementia-inclusive communities;
Determine attitudes relevant to enabling dementia-inclusive communities (e.g., dementia-related stigma);
Understand steps taken or anticipated to improve accessibility and inclusion for people living with dementia and their caregivers;
Explore the types of physical accommodations currently in place (e.g., neighborhood walkability, accessible public spaces, more accessible public transportation vehicles and public transport stops);
Determine the types of social accommodations currently in place (e.g., inclusion measures for programs and activities); and,
Identify barriers and enablers to implementing dementia-inclusive spaces, activities, and policies.
To meet the objectives of the research, Earnscliffe conducted a two-phased qualitative and quantitative research approach.
The first phase of the research was qualitative and involved sixteen (16) online focus groups between April 3-5, 2023 (using the Discussion Guide found in Appendix C). Four focus groups (segmented by regions across Canada, including one group in each region in communities with older populations) took place with each of the four target employment industries (retail and food services; transportation and public safety; recreation, fitness, community and religious organizations; and financial services – each of which have been identified as professions likely to have encountered people living with dementia now or in the future). The groups were approximately 90 minutes in length, and participants were offered a $150 honorarium to thank them for their time. Information about the interview design, methodology, and sampling approach has been provided in the Qualitative Methodology Report in Appendix A.
The second phase of the research was quantitative and involved a survey, conducted online or by telephone according to the respondent's preference of English or French, of 6,049 Canadian adults between April 21st and May 24th, 2023. The survey took an average of 10 minutes to complete online and 20 minutes to complete on the telephone. The robust sample size was used to obtain sufficient completed surveys across multiple target audiences (i.e., specific industry sectors, ethnic and cultural minorities, unpaid caregivers and 2SLGBTQI+). A full description of the sample frame, data cleaning process, and weighting are outlined in the Quantitative Methodology Report (Appendix E) and the questionnaire has been provided in Appendix E.
Detailed findings
This report presents the combined results of both the qualitative and quantitative phases of research. The report is divided into four sections: 1) Personal experience, general understanding, and perceptions of dementia; 2) Interactions with people living with dementia in workplace and volunteer settings; 3) Workplace and volunteer setting measures and training to support clients living with dementia; and 4) Efforts to support healthy aging and dementia-inclusive communities. The majority of results are informed by the quantitative online and telephone survey with nuanced findings informed by the qualitative focus groups (indented sections within the body of the report).
For purposes of this report, charts have been utilized to illustrate the quantitative research findings. Charts have been included for every question from the body of the questionnaire (that is, excluding demographic questions), for both the total sample and for results that are statistically significant among the target audiences. The target audiences for this research are: key employment industries; cultural and ethnic minority communities; unpaid caregivers of people living with dementia; and those who identify as 2SLGBTQ+. They are defined as follows:
Key employment industries: retail and food services; transport and public safety; recreational, fitness, community and religious or faith organizations; and financial services.
Cultural and ethnic minority communities: self-identified as Black, Hispanic, Southeast Asian or South Asian.
Unpaid caregivers: provided unpaid assistance to a person living with dementia in the last five years. Note that "non-unpaid caregivers" are any respondent who has not provided unpaid assistance, which may or may not include those who have provided assistance to a person living with dementia for pay.
2SLGBTQ+: self-identified as lesbian, gay, bisexual, or other orientation/identity that is not heterosexual.
As applicable and appropriate, statistically significant differences based on other demographic differences, including age, gender, education, region, experience with dementia, and others, have been noted throughout. No "other quantitative demographic differences" are noted if they are not statistically significant. All research results, including demographic details, are also provided in database form under separate cover.
Unless otherwise noted, quantitative differences cited are statistically significant at the 95% confidence level. The statistical test used to determine the significance of the results was the Z-test. Due to rounding, results may not add to 100%.Also due to rounding, in some cases, the sum of the combined results described in the text may differ slightly from the one illustrated in a chart.
Five-point scales have been used throughout the quantitative exercise (as noted in the questionnaire in Appendix E) to understand level of 'knowledge of dementia', 'impact of dementia in Canada today', 'comfort interacting with people living with dementia', 'agreement' with perceptual statements, 'community rating as place that supports healthy aging' and 'priority for community to become more dementia-inclusive'. In all instances, the top two ratings or ratings of four or five are combined to determine the proportion who can be described by those labels. For example, respondents who provide a rating of four or five on the knowledge scale are described as "knowledgeable of dementia" and those who say they "agree" or "strongly agree" that 'people living with dementia can sometimes continue to live in their own homes for years following diagnosis' are described as "agreeing" with that statement. The inverse is true among respondents who provide bottom two ratings or ratings of one or two.
The qualitative findings, except where specifically identified, represent the combined results across the various target groups. Quotations (in italics) used throughout the report were selected in order to bring the analysis to life and provide typical verbatim commentary from participants across the various groups. Details about the interview design, methodology, and sampling approach may be found in the Qualitative Methodology Report in Appendix A.
It is important to note that qualitative research is a valid form of scientific, social, policy, and public opinion research. However, focus group research is not designed to help a group reach a consensus or to make decisions, but rather to elicit the full range of ideas, attitudes, experiences and opinions of a selected sample of participants on a defined topic, as was done in this research. Because of the small numbers involved the participants cannot be expected to be thoroughly representative in a statistical sense of the larger population from which they are drawn and findings cannot reliably be generalized beyond their number.
Please note a glossary of terms can be found in the Qualitative Methodology Report in Appendix A that explains the generalizations and interpretations of qualitative terms used throughout the report.
Section A: Personal experience, general understanding, and perceptions of dementia
The following section explores the experience with dementia in one's personal life, including knowing someone who is living with dementia, and what assistance, if any, is provided to that person. This section, informed by lived experience, also explores the experiences people living with dementia face alongside their unpaid caregivers, in addition to the challenges and barriers they face.
This section also explores self-assessed knowledge of dementia and perceptions of impact of dementia in Canada. Alongside this, perceived quality of life and the abilities of people living with dementia are explored in this section.
Lastly, awareness of effective communication tips is explored as well as general comfort interacting with people living with dementia.
Section A1: Personal experience with dementia
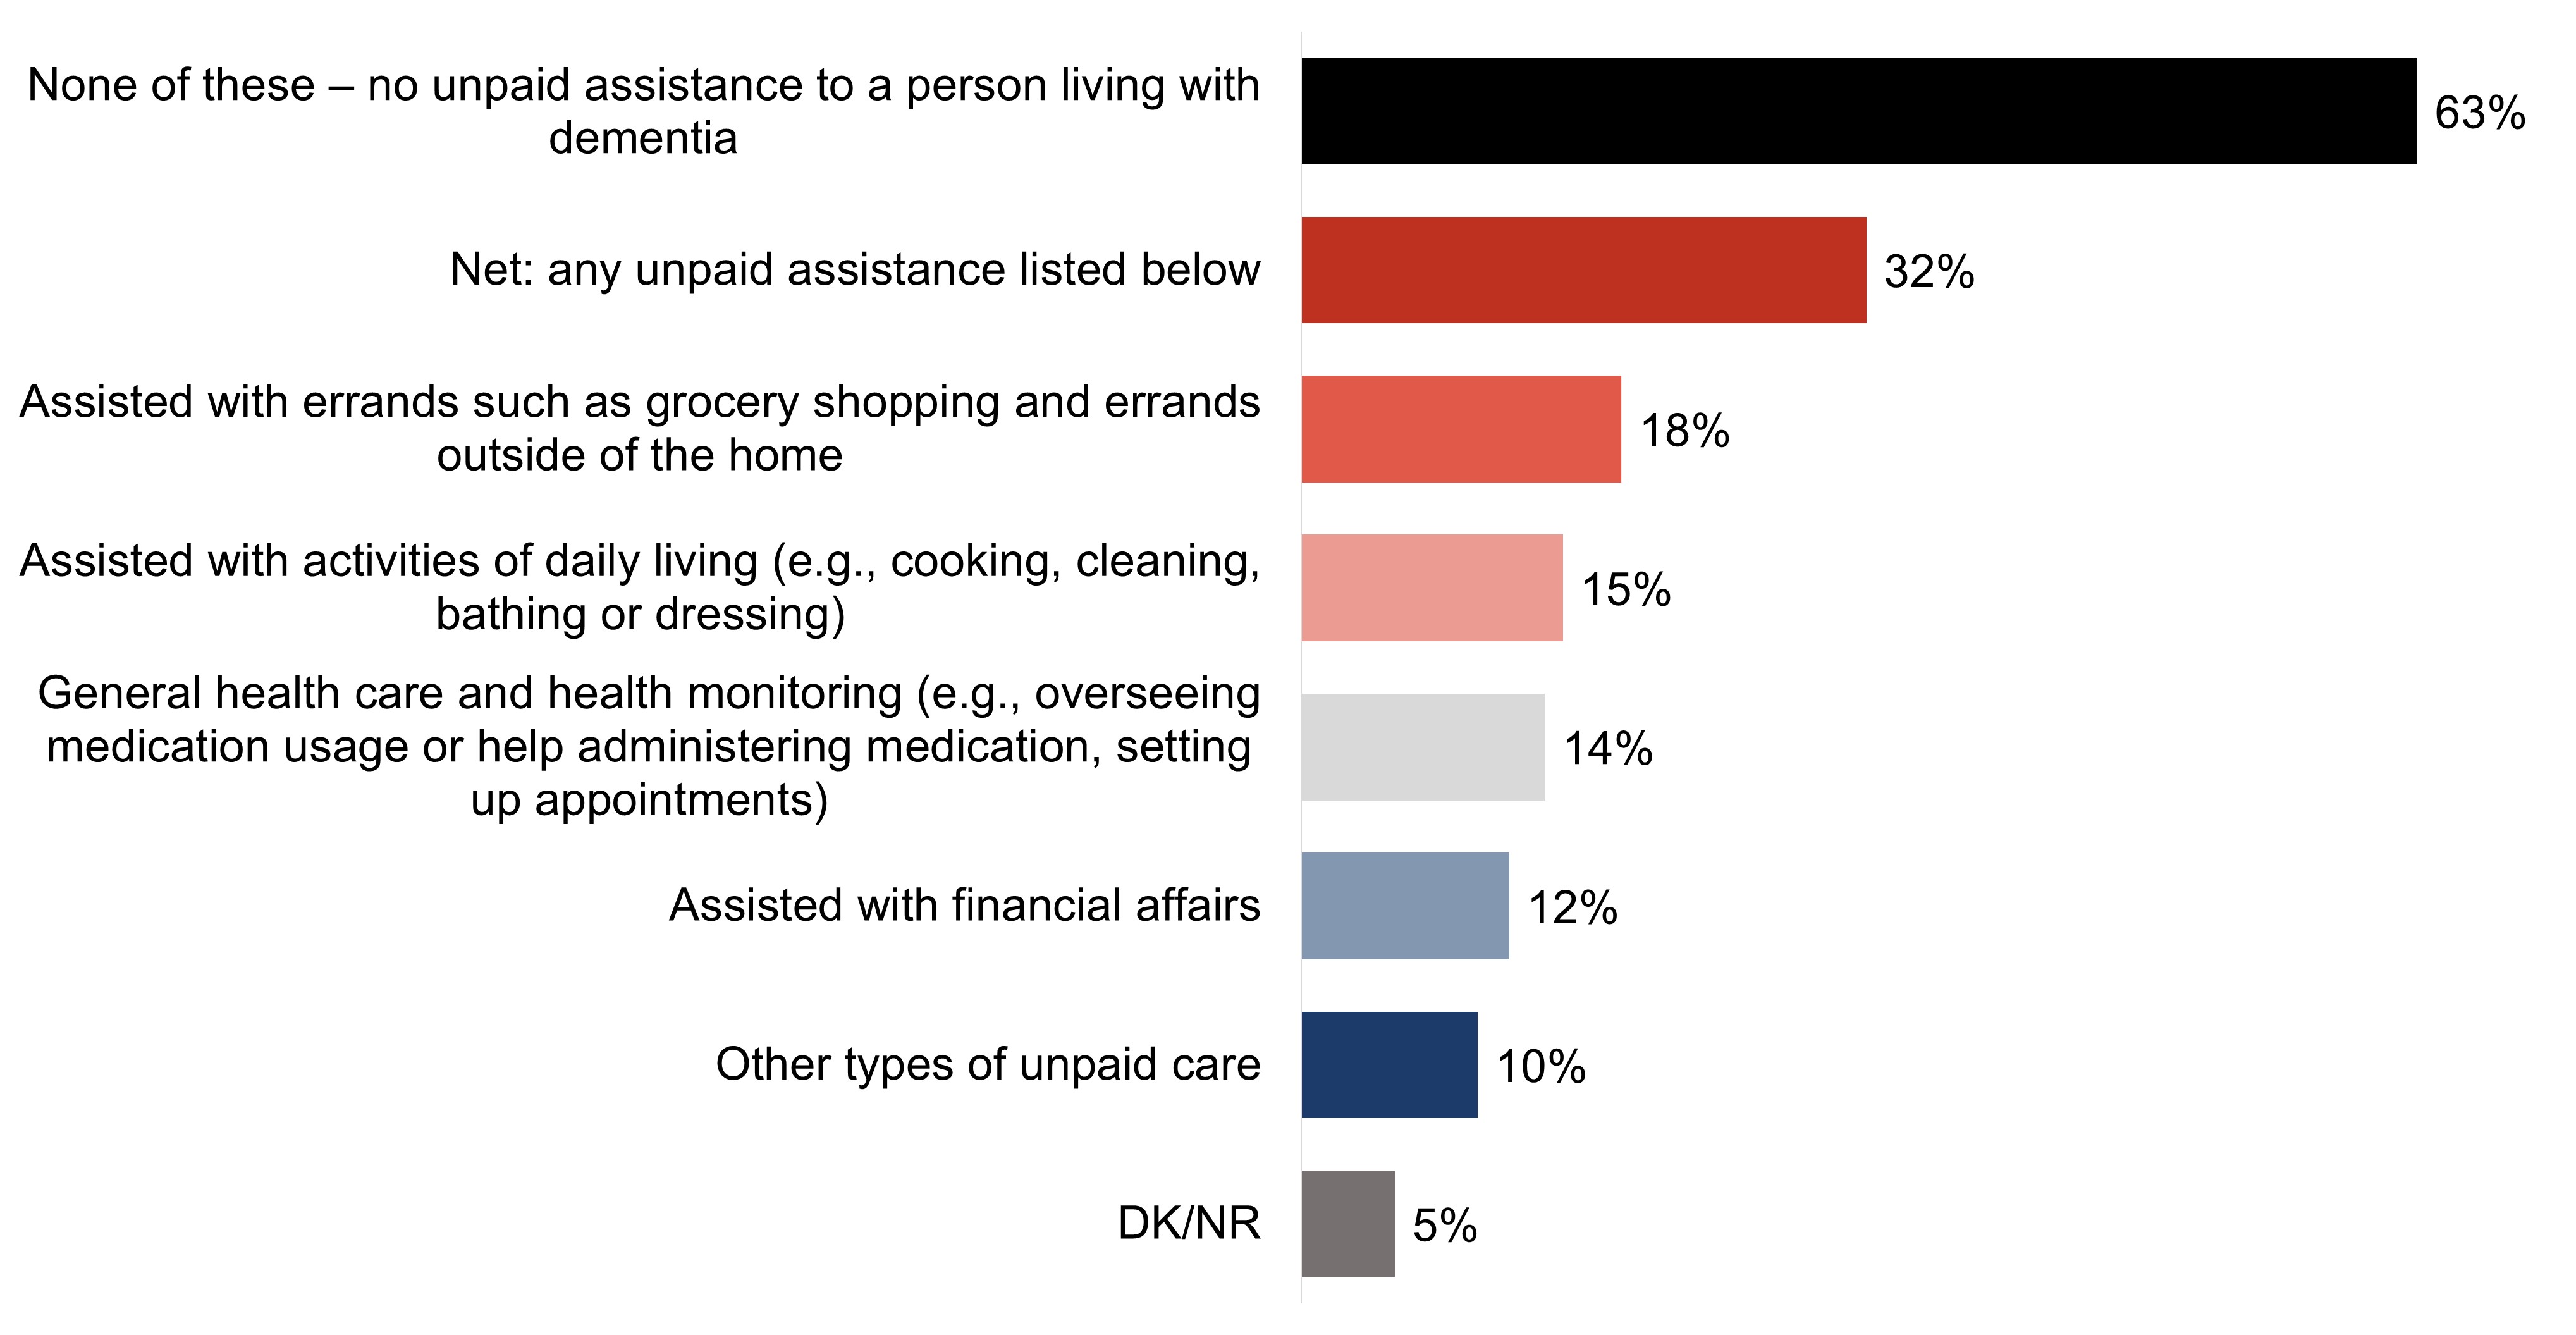
A majority (63%) of respondents say that they have not provided any unpaid assistance to a person living with dementia in the last five years. Conversely, one-third (32%) of respondents have been an unpaid caregiver of a person living with dementia. Assisting with errands is the most common task performed by unpaid caregivers (18%), followed closely by assisting with activities of daily living (15%), health care and monitoring (14%) and financial affairs (12%).
Exhibit A1: Q9: Have you done any of the following in the last 5 years for a person living with dementia, without getting paid? Select all that apply; response total may be greater than 100%.
Base: All respondents (n=6,049).
Figure 1.Figure 1 - Text description
None of these – no unpaid assistance to a person living with dementia
63%
Net: any unpaid assistance listed below
32%
Assisted with errands such as grocery shopping and errands outside of the home
18%
Assisted with activities of daily living (e.g., cooking, cleaning, bathing or dressing)
15%
General health care and health monitoring (e.g., overseeing medication usage or help administering medication, setting up appointments)
14%
Assisted with financial affairs
12%
Other types of unpaid care
10%
DK/NR
5%
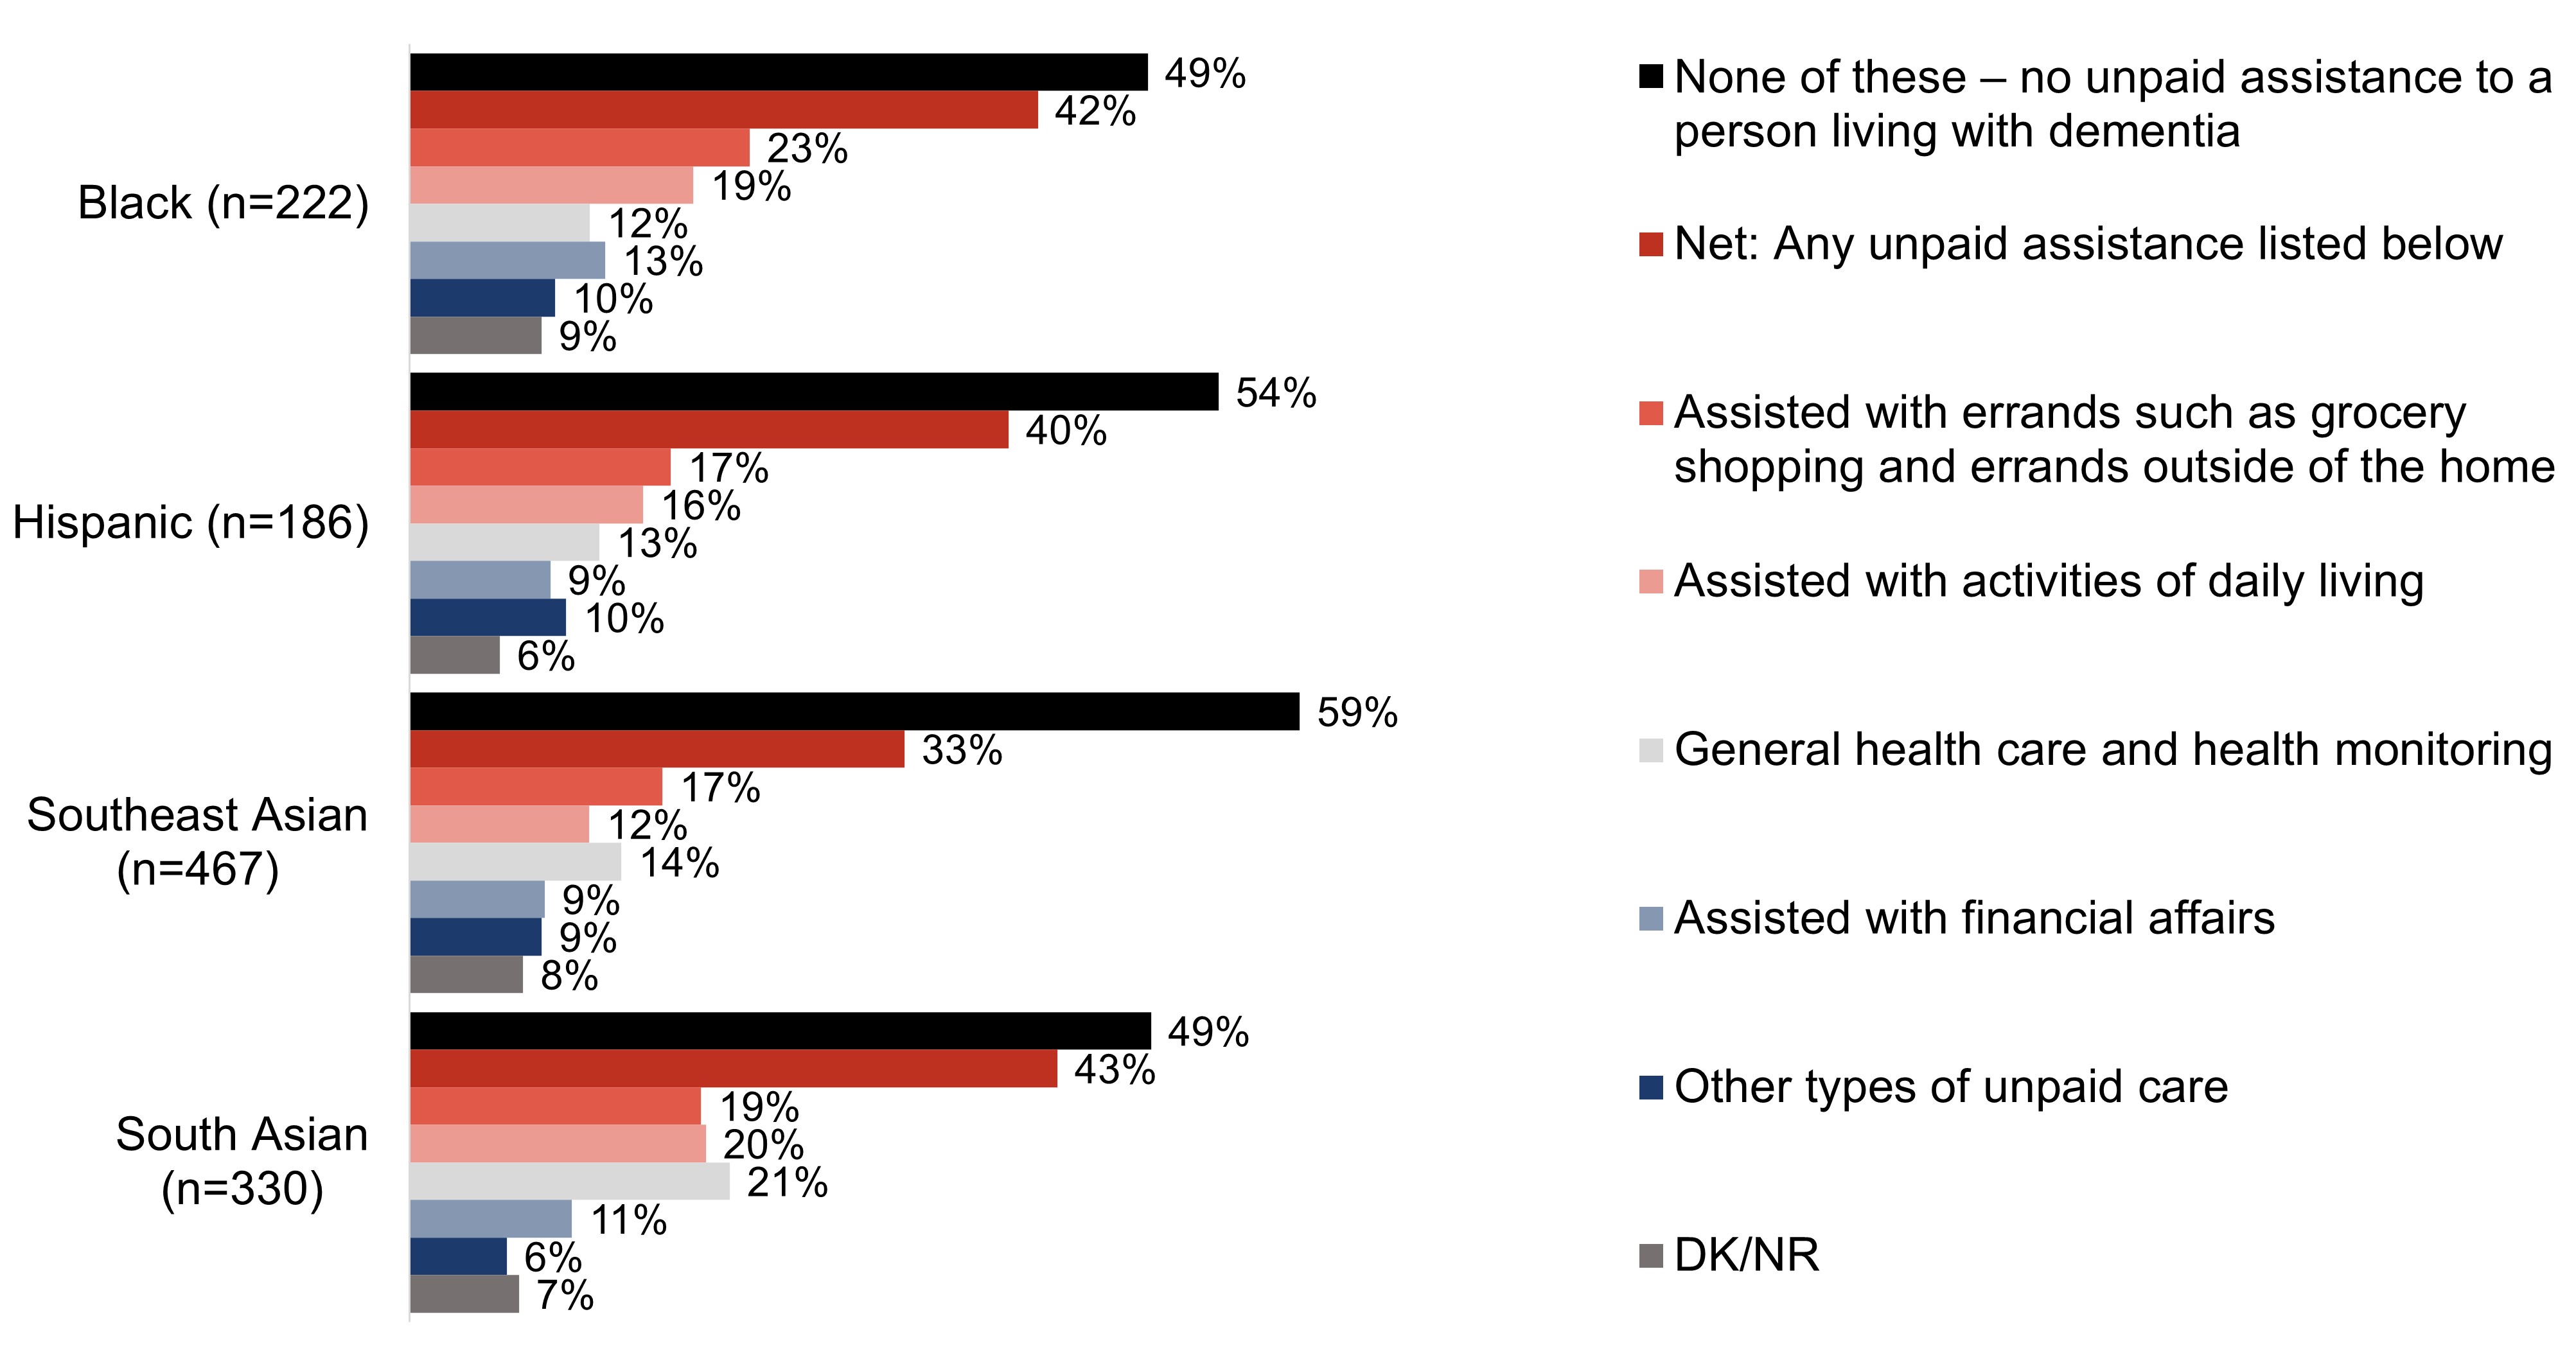
Key demographic differences for the target audiences for this research are shown in the chart below:
Approximately two in five respondents who are South Asian (43%), Black (42%) or Hispanic (40%) have provided unpaid assistance to someone living with dementia in the last five years. One-third of respondents (33%) who are Southeast Asian have provided unpaid assistance to someone living with dementia in the last five years. Approximately one-fifth of respondents who are South Asian have assisted with health care and monitoring (21%), activities of daily living (20%), or errands (19%).
Exhibit A2: Q9: Have you done any of the following in the last 5 years for a person living with dementia, without getting paid? Select all that apply; response total may be greater than 100%.
Base: All respondents.
Figure 2. TitleFigure 2 - Text description
Column %
Black (n=222)
Hispanic (n=186)
Southeast Asian (n=467)
South Asian (n=330)
None of these – no unpaid assistance to a person living with dementia
49%
54%
59%
49%
Net: Any unpaid assistance listed below
42%
40%
33%
43%
Assisted with errands such as grocery shopping and errands outside of the home
23%
17%
17%
19%
Assisted with activities of daily living
19%
16%
12%
20%
General health care and health monitoring
12%
13%
14%
21%
Assisted with financial affairs
13%
9%
9%
11%
Other types of unpaid care
10%
10%
9%
6%
DK/NR
9%
6%
8%
7%
Other quantitative demographic differences include:
Gender
Those who identify as a man are more likely than those who identify as women (33% versus 30%) to say they have provided unpaid assistance to a person living with dementia in the past five years.
Age
At 36%, respondents who are 18 to 34 years of age are the most likely to say they have acted as an unpaid caregiver in the last five years.
Region
Respondents who live in the Territories are the least likely (at 24%) to say that they have provided unpaid assistance to a person living with dementia in the last five years.
Education
At 25%, respondents who have a high school education or less are less likely than those who completed higher levels of education (college/university 34%; post-graduate 36%) to have acted as an unpaid caregiver in the last five years.
Language
English speaking respondents are more likely than French speaking respondents to be an unpaid caregiver (33% versus 29%).
Experience with dementia
Respondents are more likely than their counterparts to say that they have provided unpaid assistance to a person living with dementia in the last five years if they:
know a person living with dementia (46%);
have/had a work (55%) or volunteer (79%) role where they interact(ed) with people living with dementia;
interact with people living with dementia more than monthly (71%);
say they are knowledgeable of dementia (54%);
agree dementia is having a large impact in Canada today (38%);
say they are comfortable interacting with people living with dementia (43%);
are aware of dementia-inclusive communities (46%); or,
feel that communities should prioritize becoming dementia-inclusive (37%).
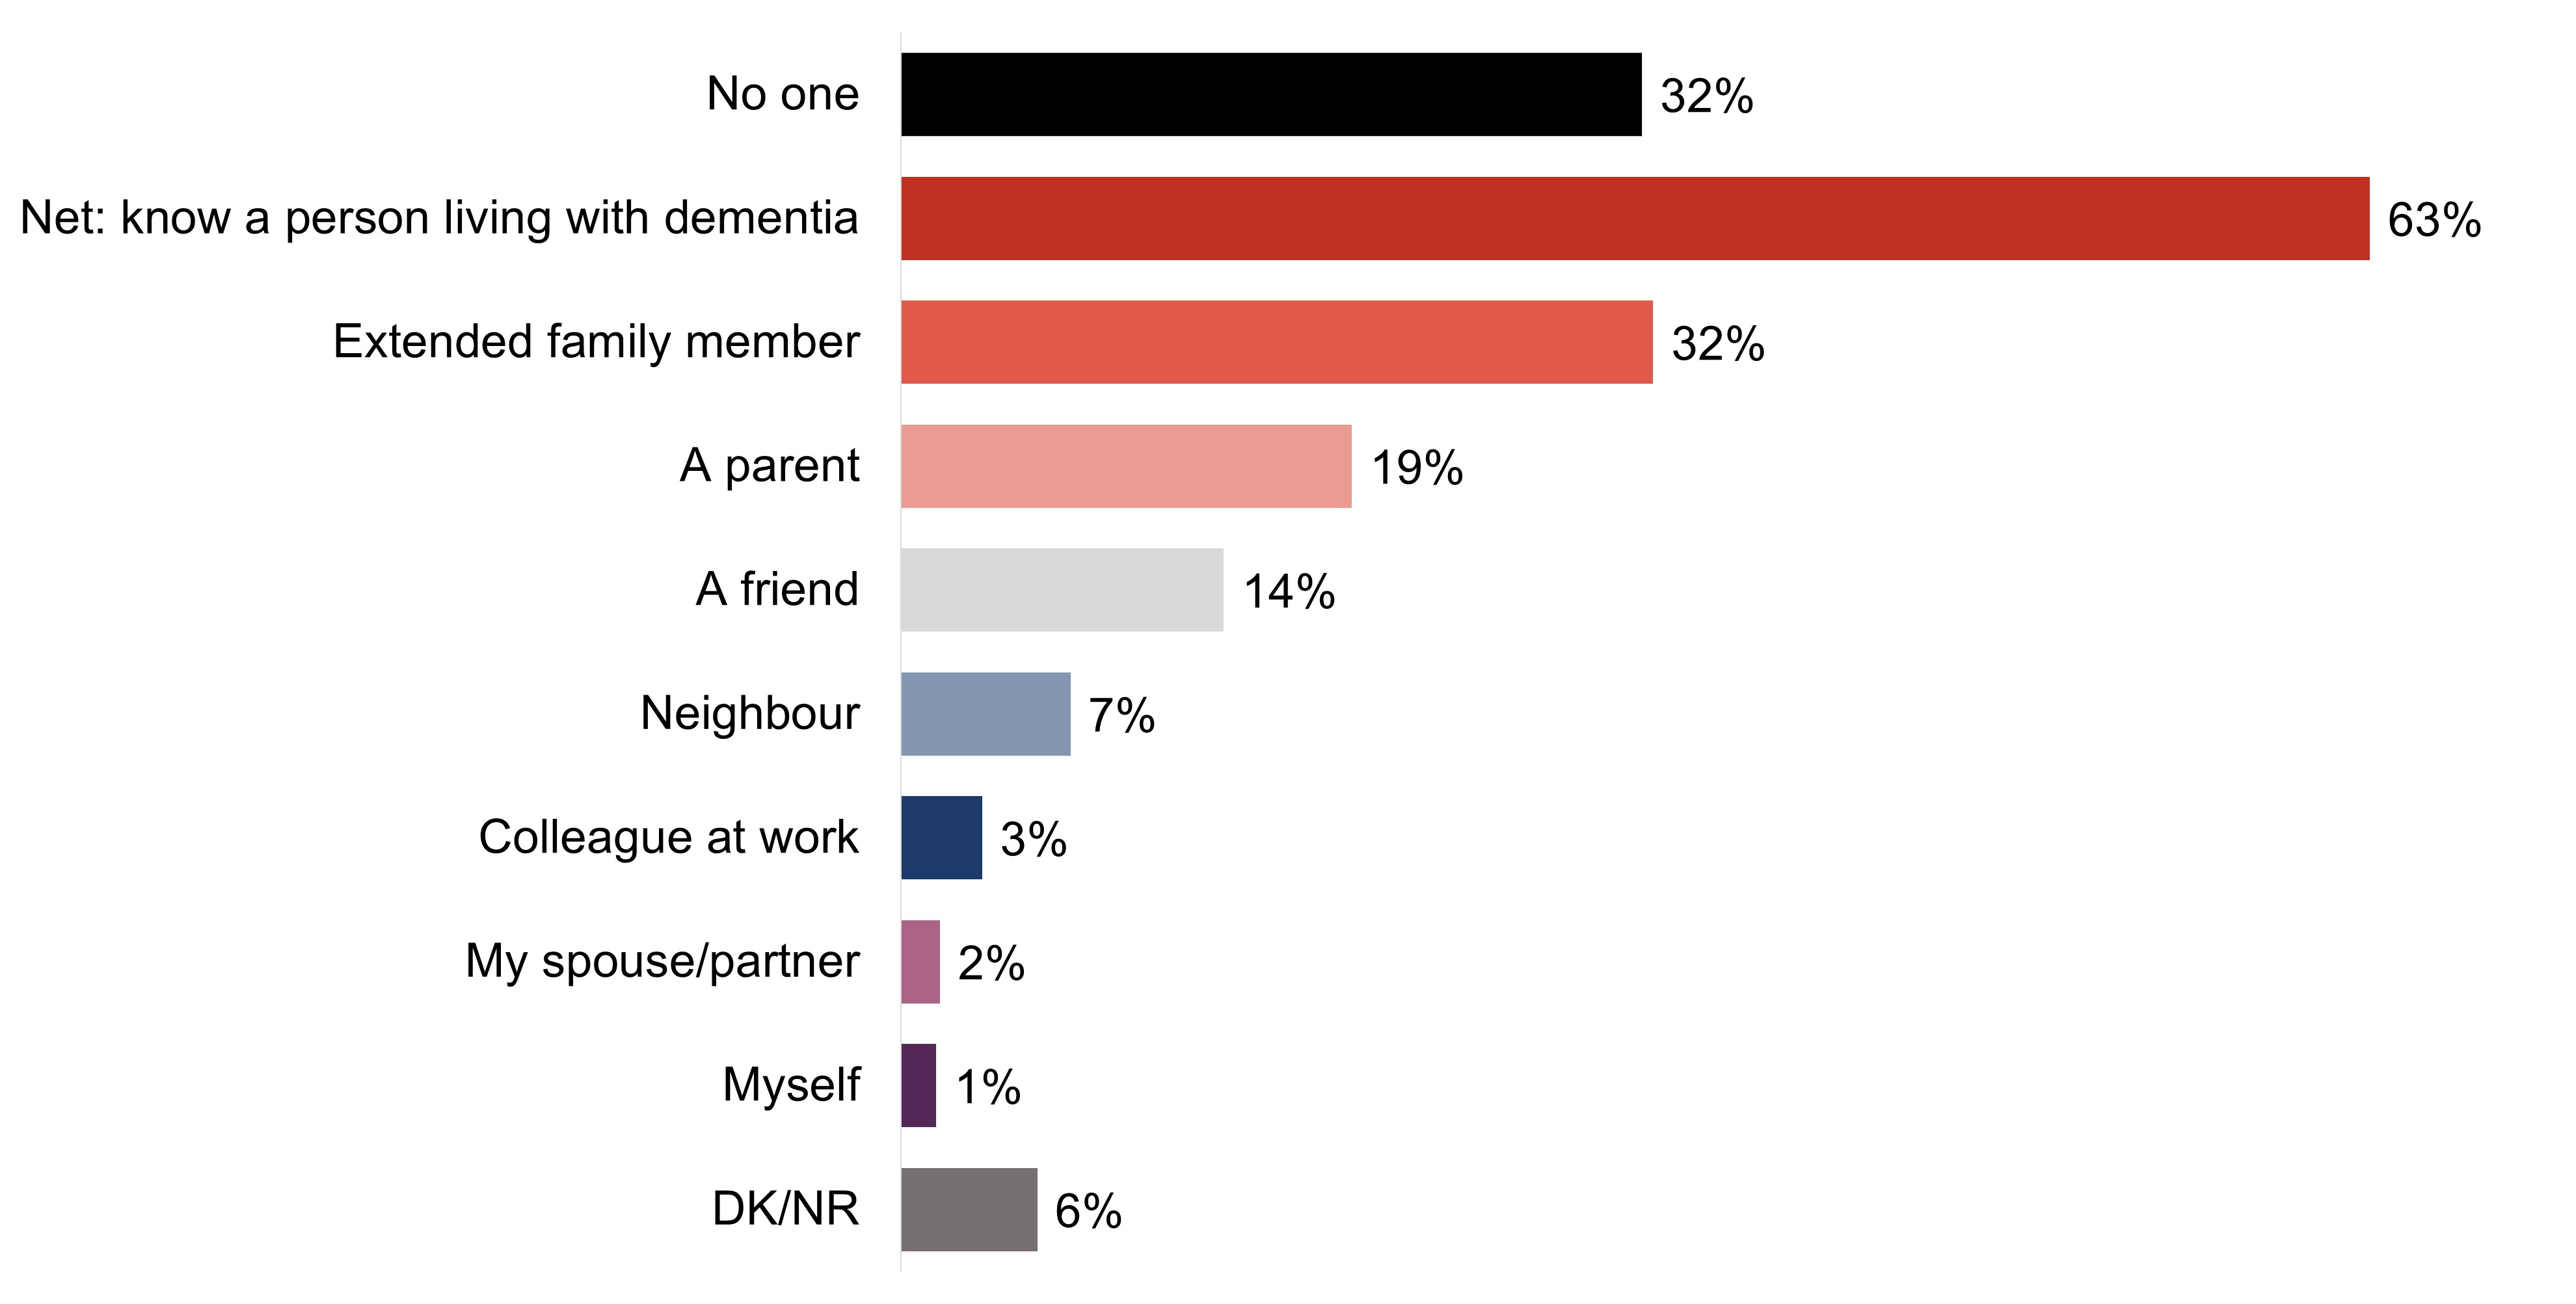
While the majority of respondents are not unpaid caregivers (63%), a majority of respondents (63%) do say they know or knew a person living with dementia. These individuals are most commonly an extended family member (32%), a parent (19%), or a friend (14%). Fewer than 10% of respondents say a colleague (3%), their partner (2%) or they themselves (1%) are living with dementia.
Exhibit A3: Q8: Who do you know (if anyone) that is living/has lived with dementia? Select all that apply; response total may be greater than 100%.
Base: All respondents (n=6,049).
Figure 3Figure 3 - Text description
No one
32%
Net: know a person living with dementia
63%
Extended family member
32%
A parent
19%
A friend
14%
Neighbour
7%
Colleague at work
3%
My spouse/partner
2%
Myself
1%
DK/NR
6%
Key demographic differences for the target audiences for this research are shown in the charts below:
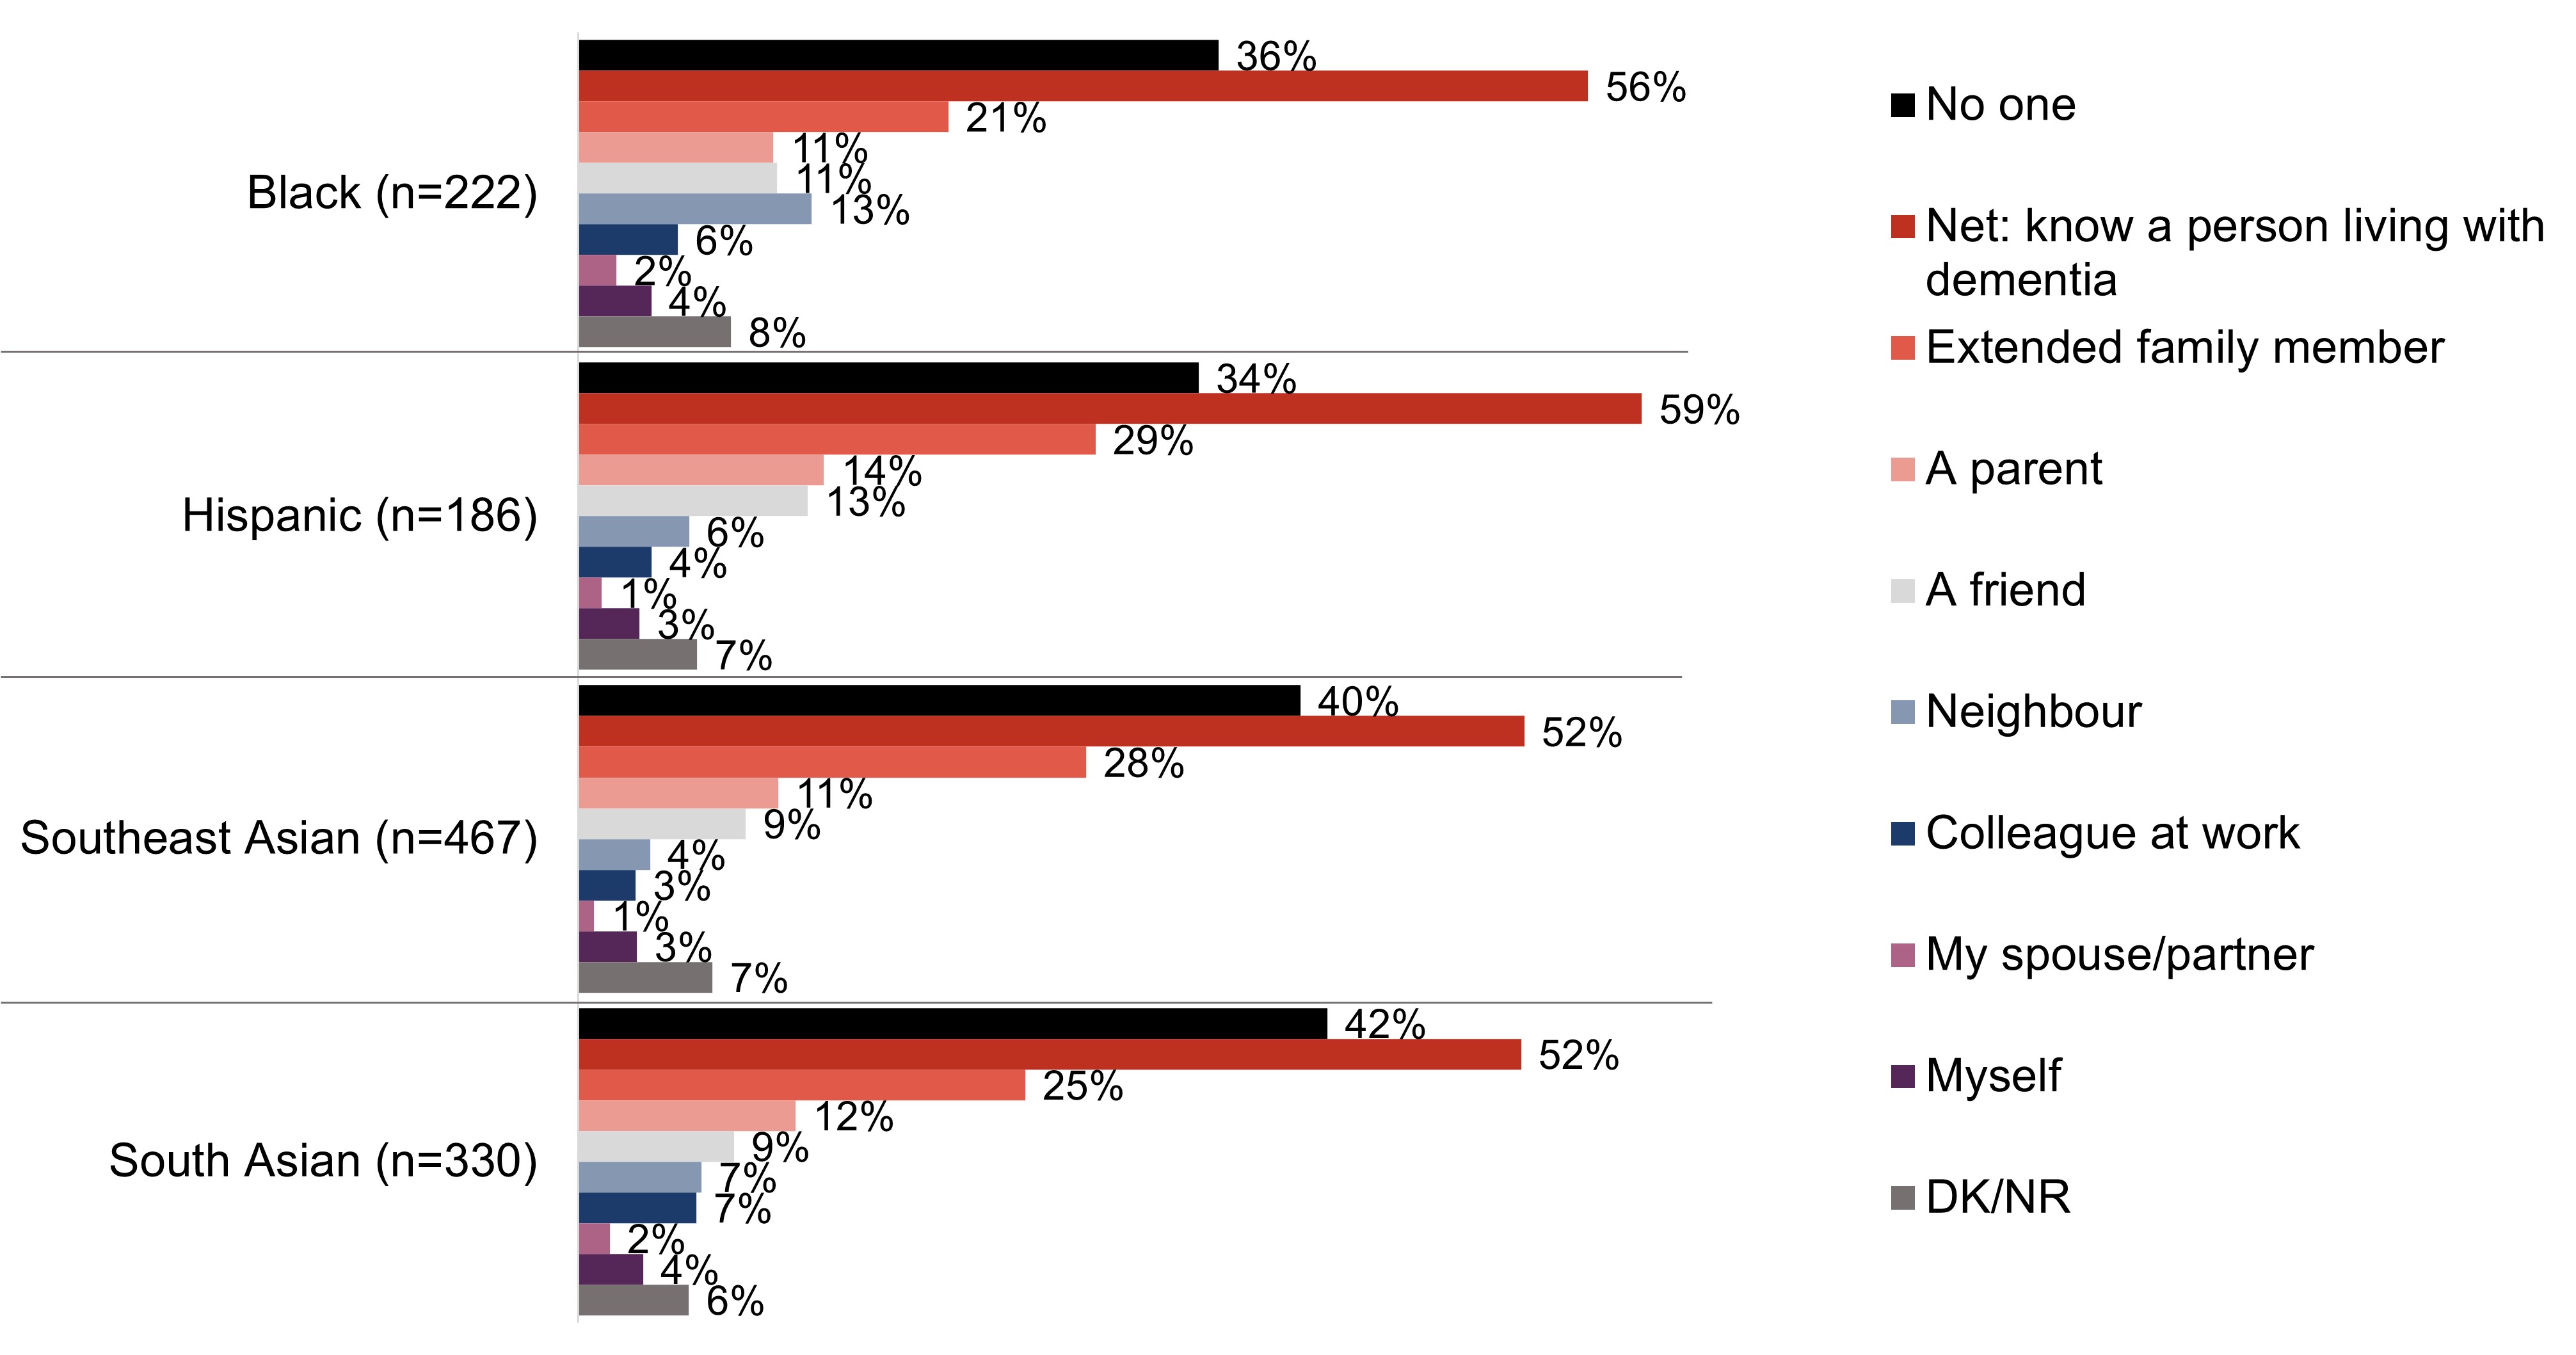
A majority of respondents from the cultural and ethnic minority communities that were a target audience for this project say they know someone living or has lived with dementia. Three in five respondents (59%) who are Hispanic say they know someone living with dementia, including 29% who say the person living with dementia is an extended family members. Half of respondents (52%) who are Southeast Asian and South Asian also say they do, including approximately one-quarter who say an extended family member is living or has lived with dementia. Over half of respondents (56%) who are Black say they know someone living with dementia, most commonly an extended family member (21%) or a neighbour (13%).
Exhibit A4: Q8: Who do you know (if anyone) that is living/has lived with dementia? Select all that apply; response total may be greater than 100%.
Base: All respondents.
Figure 4.Figure 4 - Text description
Column %
Black (n=222)
Hispanic (n=186)
Southeast Asian (n=467)
South Asian (n=330)
No one
36%
34%
40%
42%
Net: know a person living with dementia
56%
59%
52%
52%
Extended family member
21%
29%
28%
25%
A parent
11%
14%
11%
12%
A friend
11%
13%
9%
9%
Neighbour
13%
6%
4%
7%
Colleague at work
6%
4%
3%
7%
My spouse/partner
2%
1%
1%
2%
Myself
4%
3%
3%
4%
DK/NR
8%
7%
7%
6%
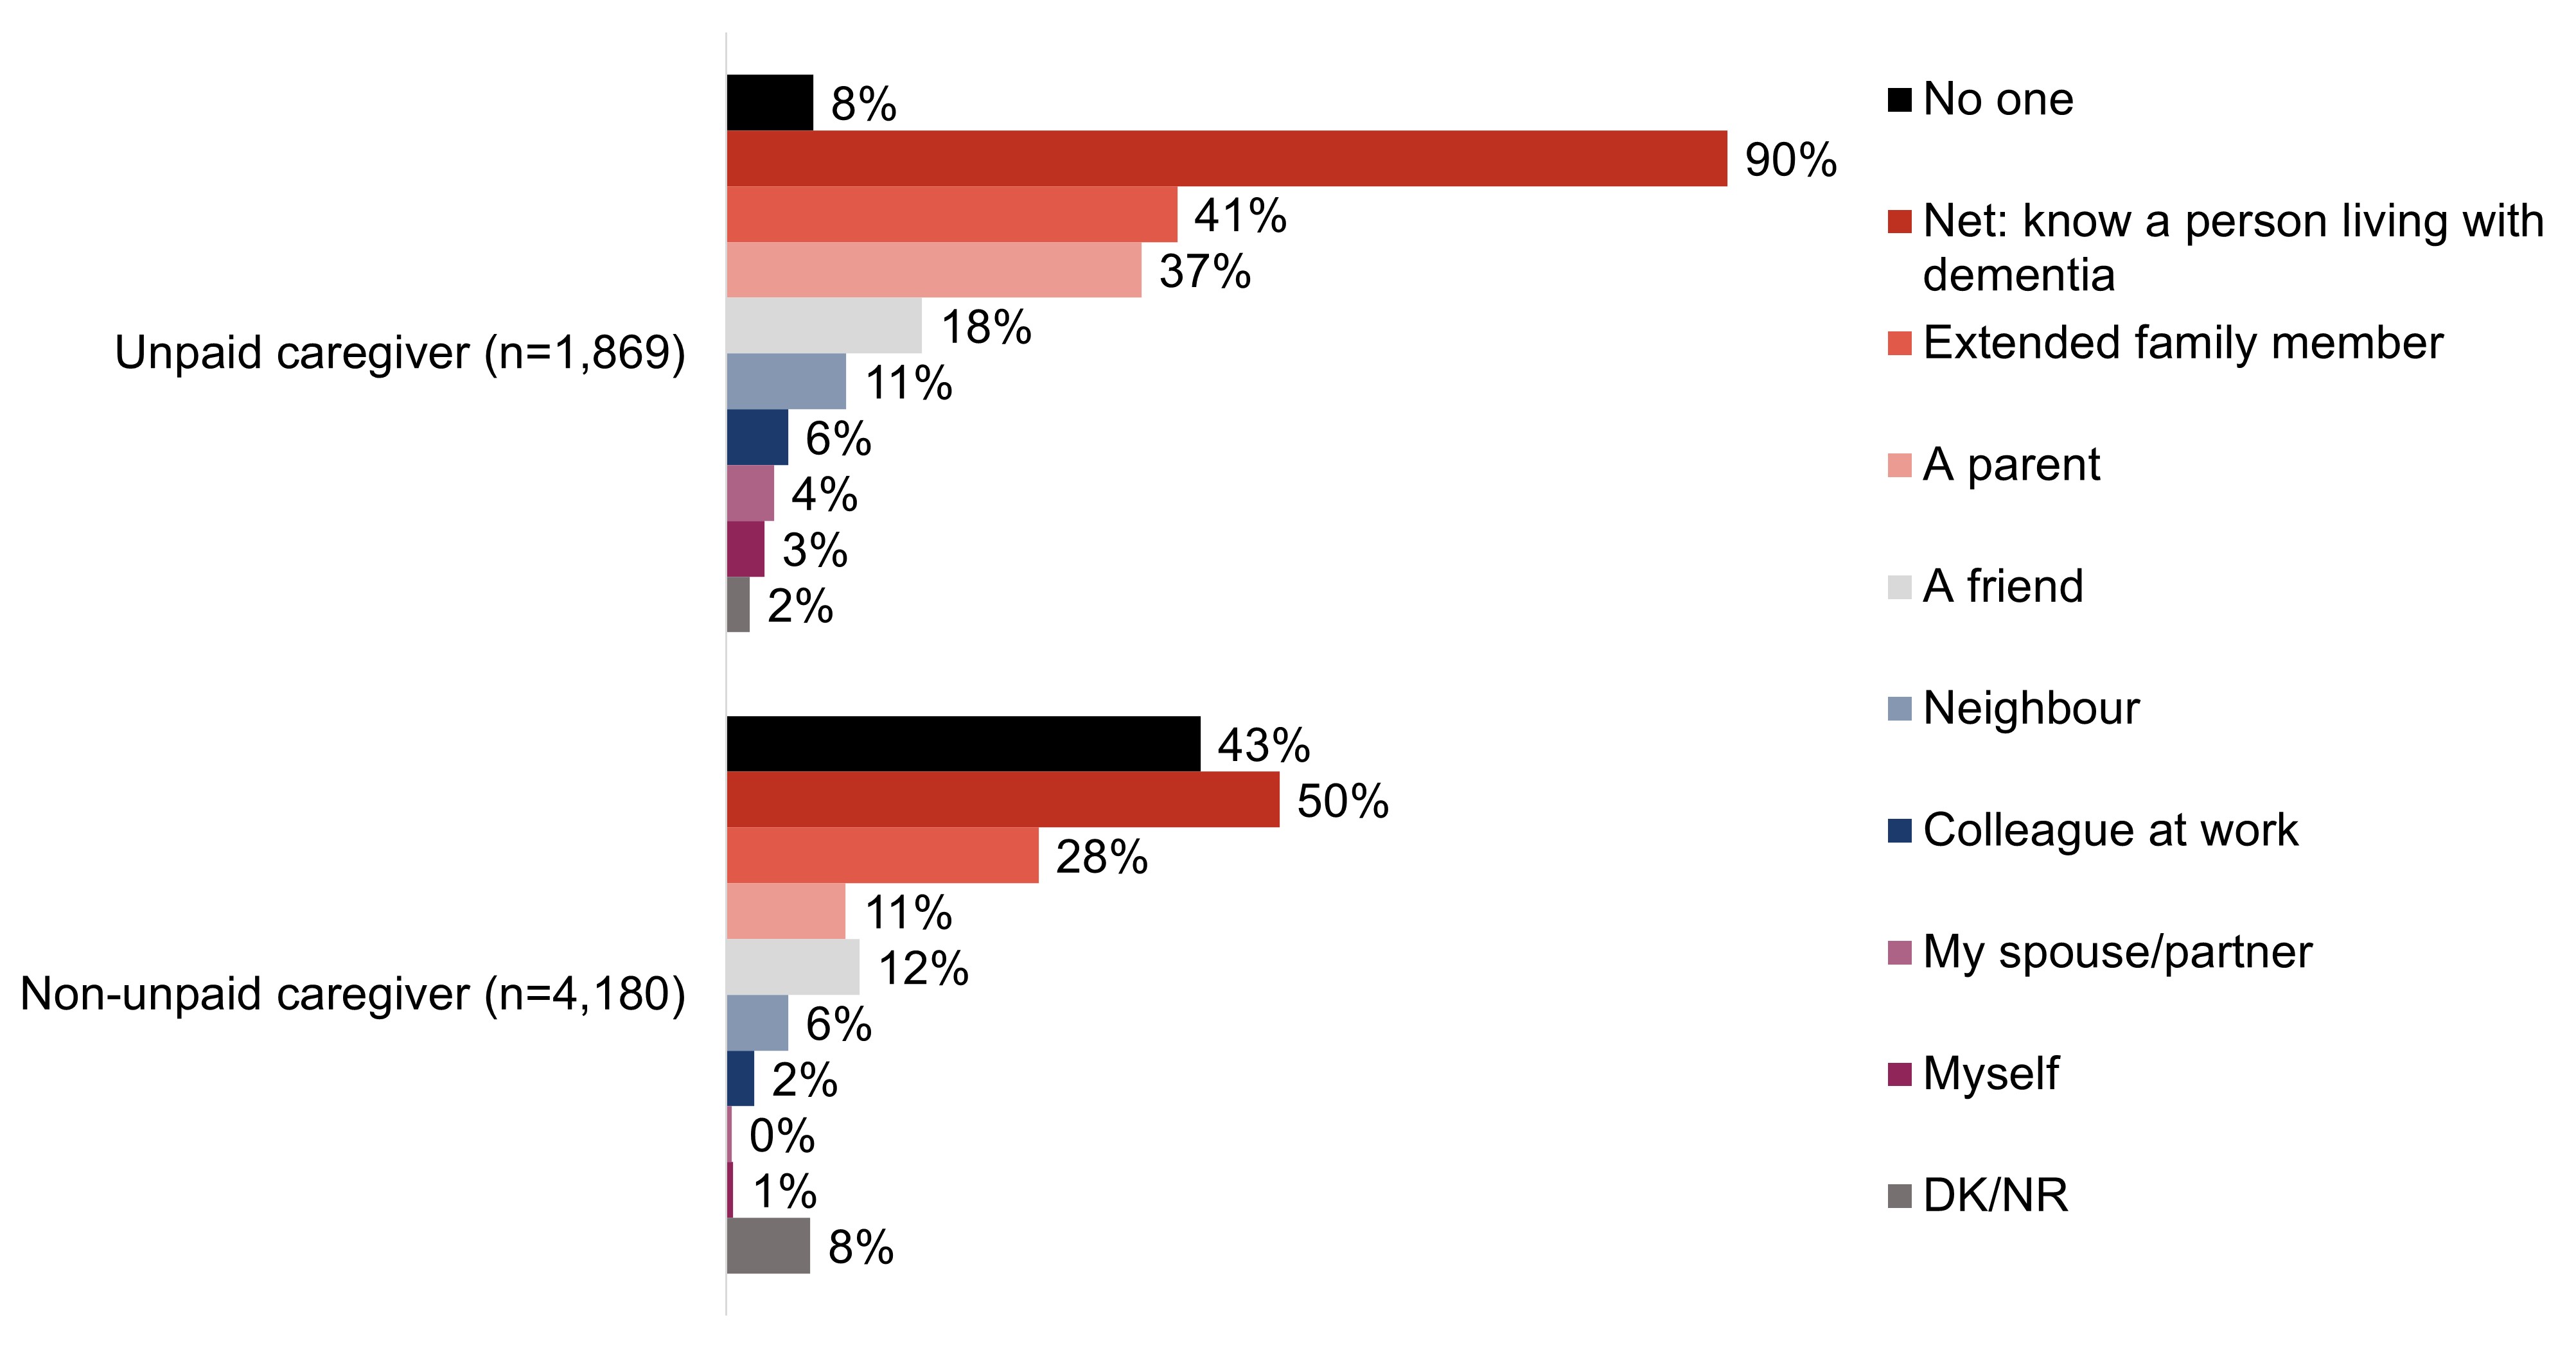
As one would expect, nearly all unpaid caregivers (90%) say they know someone who is living or has lived with dementia, most commonly an extended family member (41%) or a parent (37%). Indeed, unpaid caregivers are three times as likely to have a parent who is living with dementia than those who are not unpaid caregivers (37% versus 11%). That said, half of respondents (50%) who are not unpaid caregivers say they know someone who is living with dementia.
Exhibit A5: Q8: Who do you know (if anyone) that is living/has lived with dementia? Select all that apply; response total may be greater than 100%.
Base: All respondents.
Figure 5.Figure 5 - Text description
Column %
Unpaid caregiver (n=1,869)
Non-unpaid caregiver (n=4,180)
No one
8%
43%
Net: know a person living with dementia
90%
50%
Extended family member
41%
28%
A parent
37%
11%
A friend
18%
12%
Neighbour
11%
6%
Colleague at work
6%
2%
My spouse/partner
4%
0%
Myself
3%
1%
DK/NR
2%
8%
Other quantitative demographic differences include:
Age
There is a correlation between age and knowing someone living with dementia, where those who are 18 to 34 years of age are the least likely to know a person living with dementia (55%) and respondents 65 years of age or older are the most likely to say they know someone who is living with dementia (72%).
Region
Those who live in Atlantic Canada are the most likely to know someone who is living with dementia (71%) compared to other regions.
Education
At 69%, respondents who have completed a post-graduate degree are the most likely to say they know a person living with dementia.
Employment
Respondents who are retired are the most likely (at 72%) to say that they know a person living with dementia.
Income
Those who have a household income of under $60,000 are the least likely to know someone who is living with dementia (60%).
Language
English speaking respondents are more likely than French speaking respondents to say that they know someone who is living with dementia (65% versus 60%).
Experience with dementia
Respondents are more likely than their counterparts to say that they know someone living with dementia if they:
have/had a work (78%) or volunteer (87%) role where they interact or interacted with people living with dementia;
interact with people living with dementia more than monthly (85%);
say they are knowledgeable of dementia (80%);
believe dementia is having a large impact in Canada today (74%);
say they are comfortable interacting with people living with dementia (73%);
are aware of dementia-inclusive communities (78%); or,
feel that communities should prioritize becoming dementia-inclusive (70%).
Qualitative insights
Mirroring the quantitative results, the majority of participants in the focus groups knew someone who is currently living with or has lived with dementia and often they approached the focus group discussions from this experience. Regularly this question inspired emotional recollection whereby the participant would not only acknowledge their awareness of dementia, but also express regret. The most common relationship that participants had with a person living with dementia was through extended family members, although some said their parent or a community member was the individual they knew who was living or is living with dementia.
"Everyone who had to take care of my aunt really suffered." – Financial services; Western Canada
"I remember my grandmother when we would visit, who wouldn't remember any of us. She'd call us different names. I remember seeing my mom struggle with it." – Financial services; Ontario
While the majority of participants knew someone living with dementia, only one or two members of most of the focus groups which ranged from six to ten participants (a few groups had none) said that they provided care in any form for a person living with dementia, which is consistent although somewhat lower than the quantitative findings. Most often this care was unpaid, though a few had done so on a paid basis. This involved basic care (for example, hygiene and food preparation) and logistics, and a handful said they were responsible for the full care of the individual living with dementia.
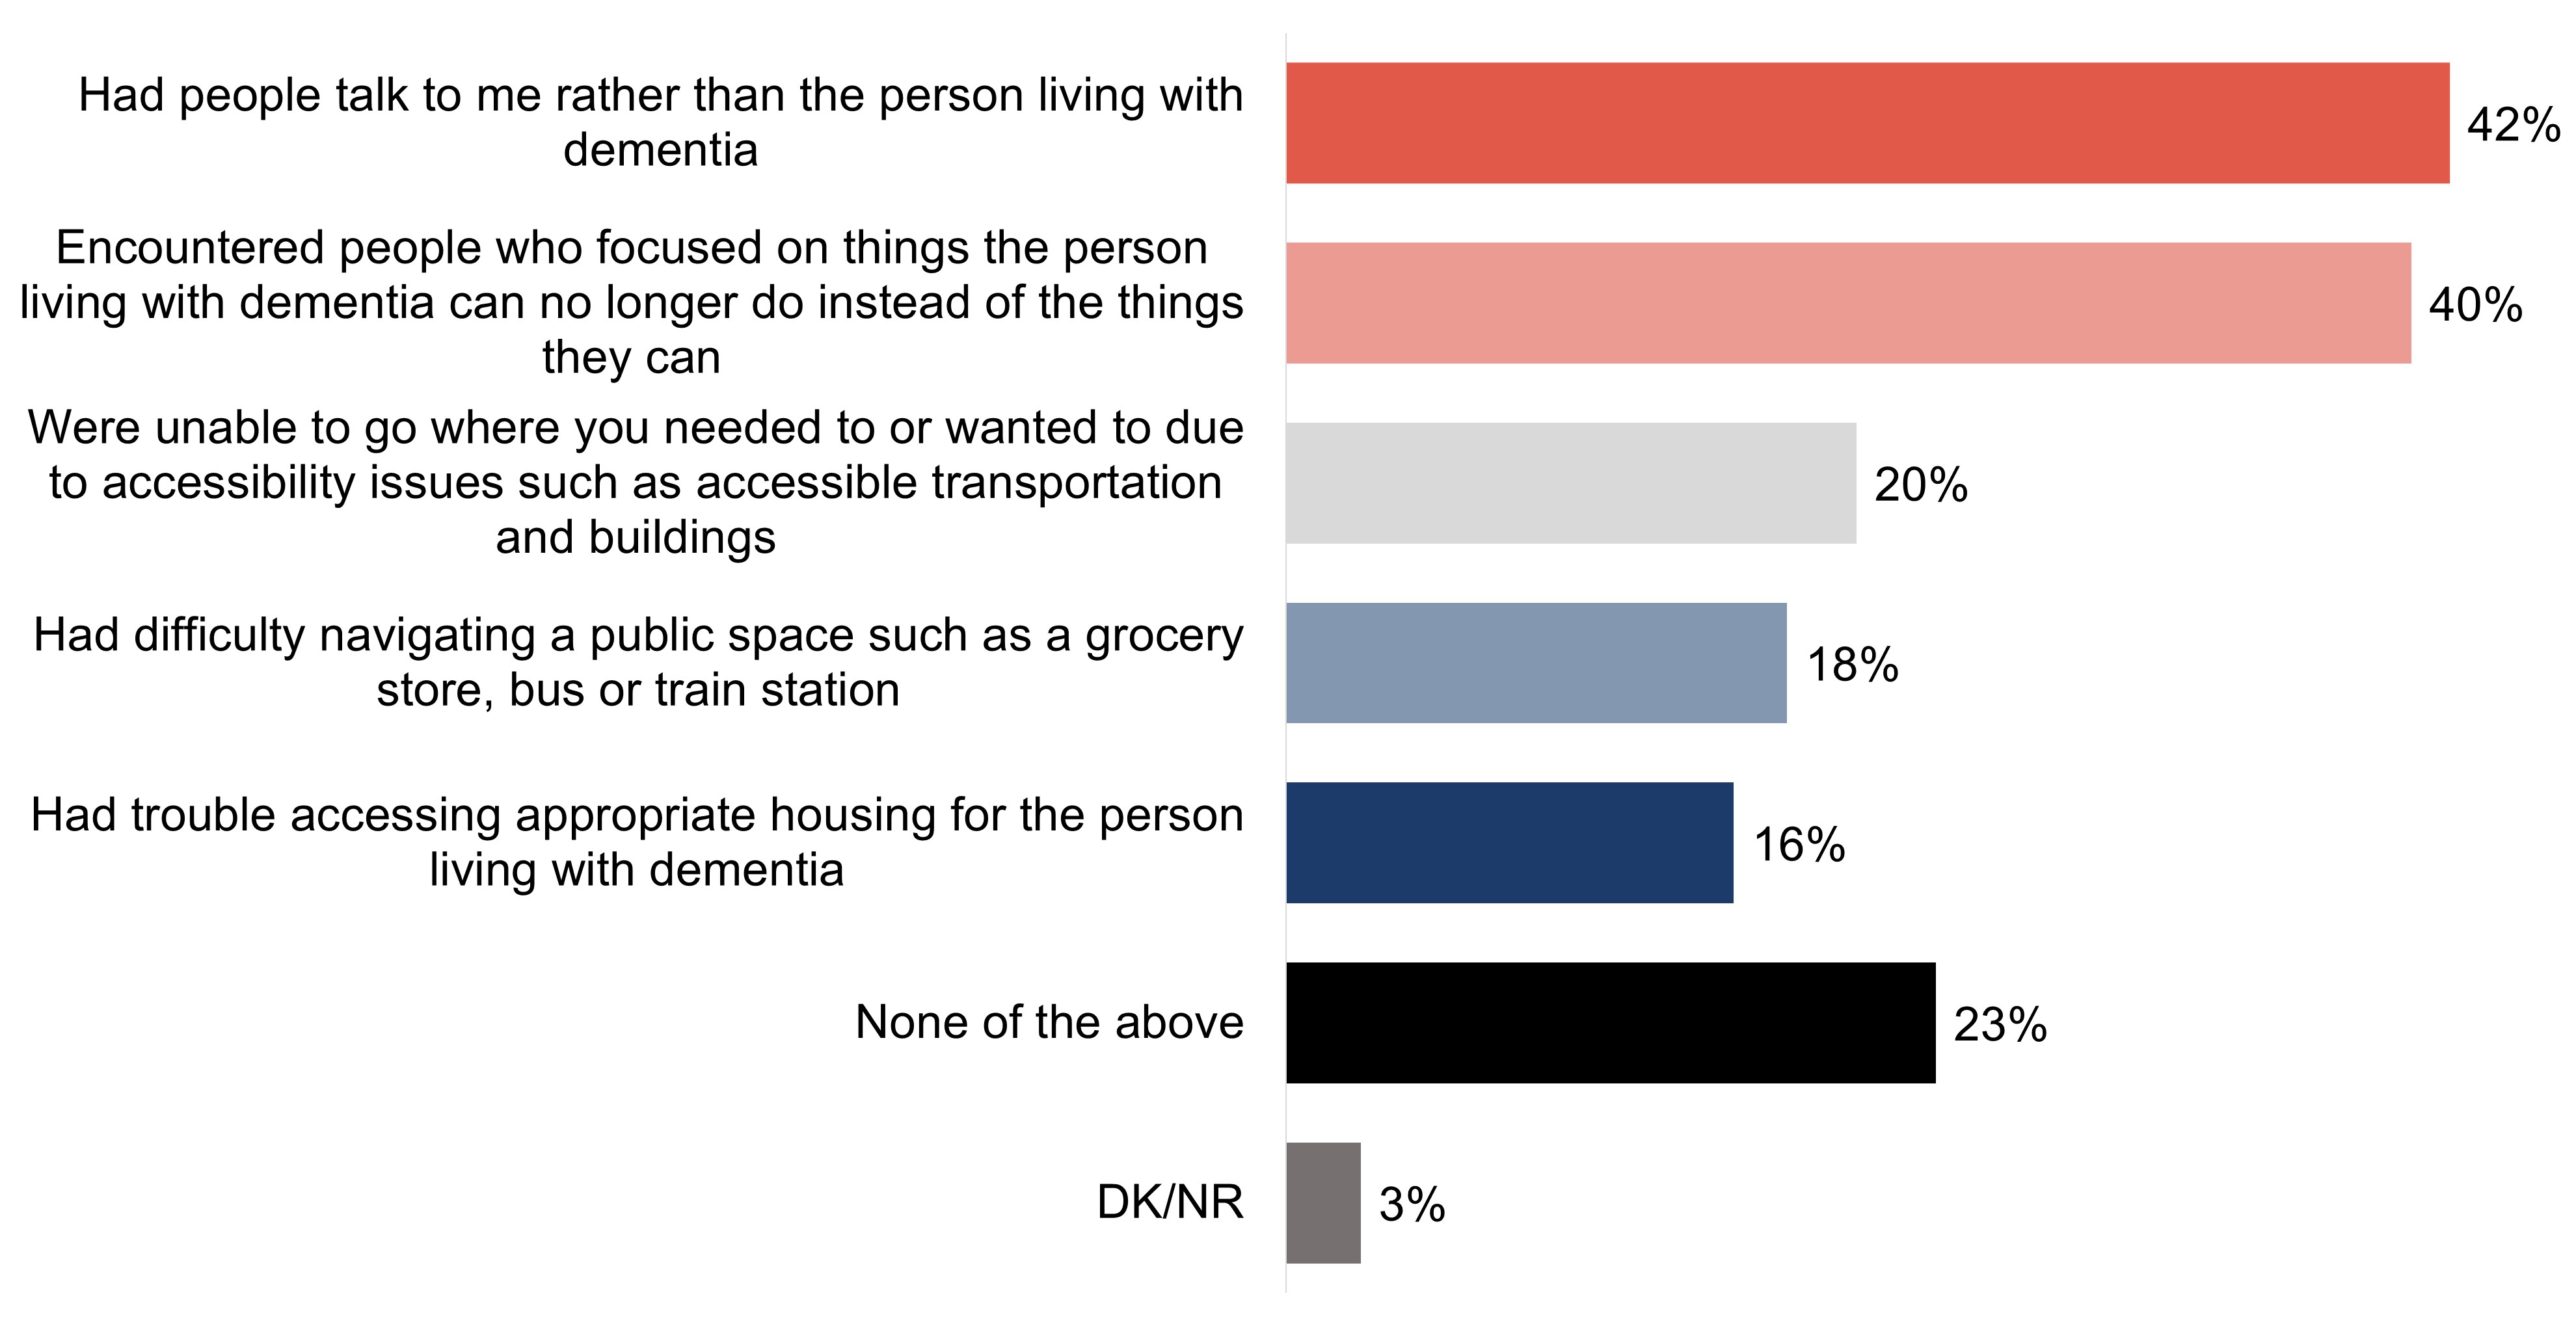
To understand what experiences related to dementia-inclusive communities are faced by people living with dementia and their unpaid caregivers, respondents were shown a list of potential experiences and asked which, if any, they have experienced. The most common experiences faced by respondents while they were with the person with dementia to whom they provided care is having people talk to them instead of the person living with dementia (42%) and encountering people who focus on what the person with dementia cannot do rather than what they can (40%). Fewer say they were unable to go where they needed or wanted due to accessibility issues (20%), had difficulty navigating a public space (18%) or had trouble accessing appropriate housing for the person living with dementia (16%). About one-quarter of respondents (23%) say they have not encountered any of the experiences listed.
Exhibit A6: Q10: In the last five years, have you experienced any of the following while you were with the person living with dementia to whom you provide care? Select all that apply; response total may be greater than 100%.
Base: Those who have been an unpaid caregiver of a person living with dementia in the past 5 years (n=1,869).
Figure 6. TitleFigure 6 - Text description
Had people talk to me rather than the person living with dementia
42%
Encountered people who focused on things the person living with dementia can no longer do instead of the things they can
40%
Were unable to go where you needed to or wanted to due to accessibility issues such as accessible transportation and buildings
20%
Had difficulty navigating a public space such as a grocery store, bus or train station
18%
Had trouble accessing appropriate housing for the person living with dementia
16%
None of the above
23%
DK/NR
3%
Other quantitative demographic differences include:
Gender
While with the person living with dementia to who they provide care, those who identify as a woman are more likely compared to those who identify as a man to say that they had people talk to them rather than the person living with dementia (47% versus 37%) and had trouble accessing appropriate housing for the person living with dementia (18% versus 14%) in the past five years.
Age
Respondents aged 18 to 34 years are more likely to say that they were unable to go where they needed or wanted to due to accessibility issues such as inaccessible transportation (28%, compared to 15% of 55 to 64 years of age and 14% of 65 years or older) and had difficulty navigating a public space such as a grocery store (24%, compared to 14% of 55 to 64 years of age and 13% of 65 years or older) in the past five years while with the person living with dementia to whom they provide care.
Region
Those who live in Quebec are the most likely (at 33%) to say that they did not encounter any of the following experiences in the past five years while with the person living with dementia to whom they provided care.
Language
French speaking respondents are more likely than English speaking respondents to say that they did not encounter any of the following experiences in the past five years while with the person living with dementia to whom they provided care (35% versus 20%).
Experience with dementia
Respondents are more likely than their counterparts to say that they did not encounter any of the following experiences in the past five years while with the person living with dementia to whom they provided care if they:
do not know a person living with dementia (35%);
have not had a work or volunteer role where they interact with people living with dementia (34%);
say they are not knowledgeable of dementia (40%);
are not aware of dementia-inclusive communities (27%); or,
feel that communities should not prioritize becoming dementia-inclusive (38%).
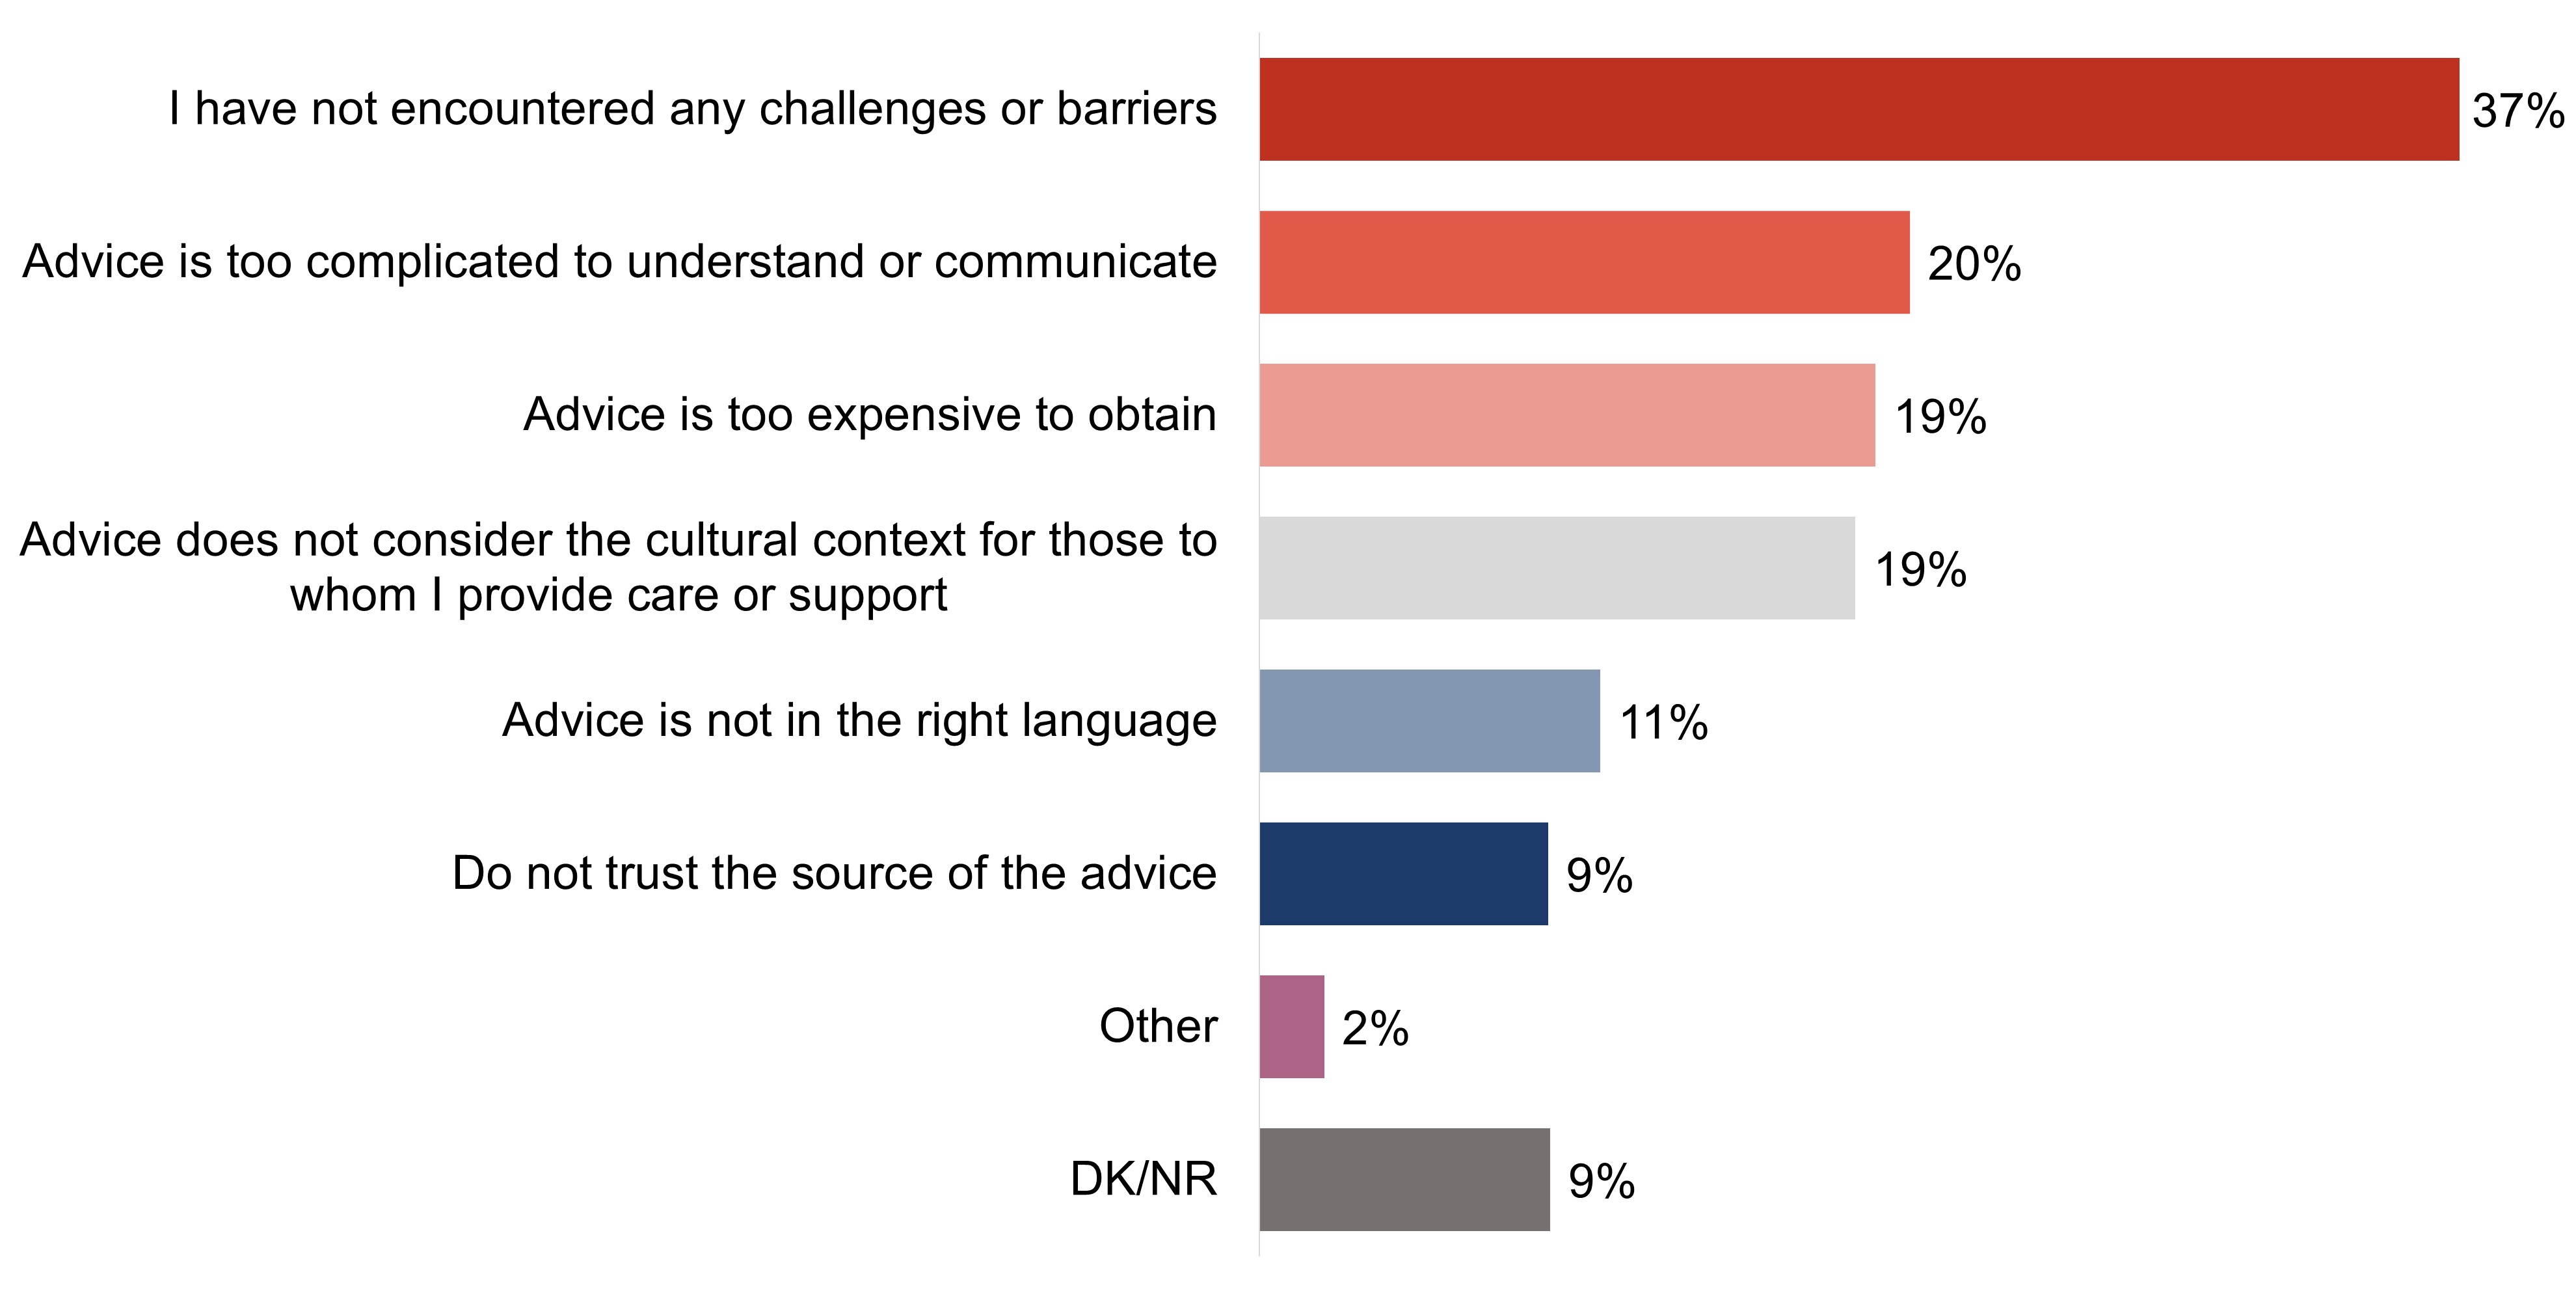
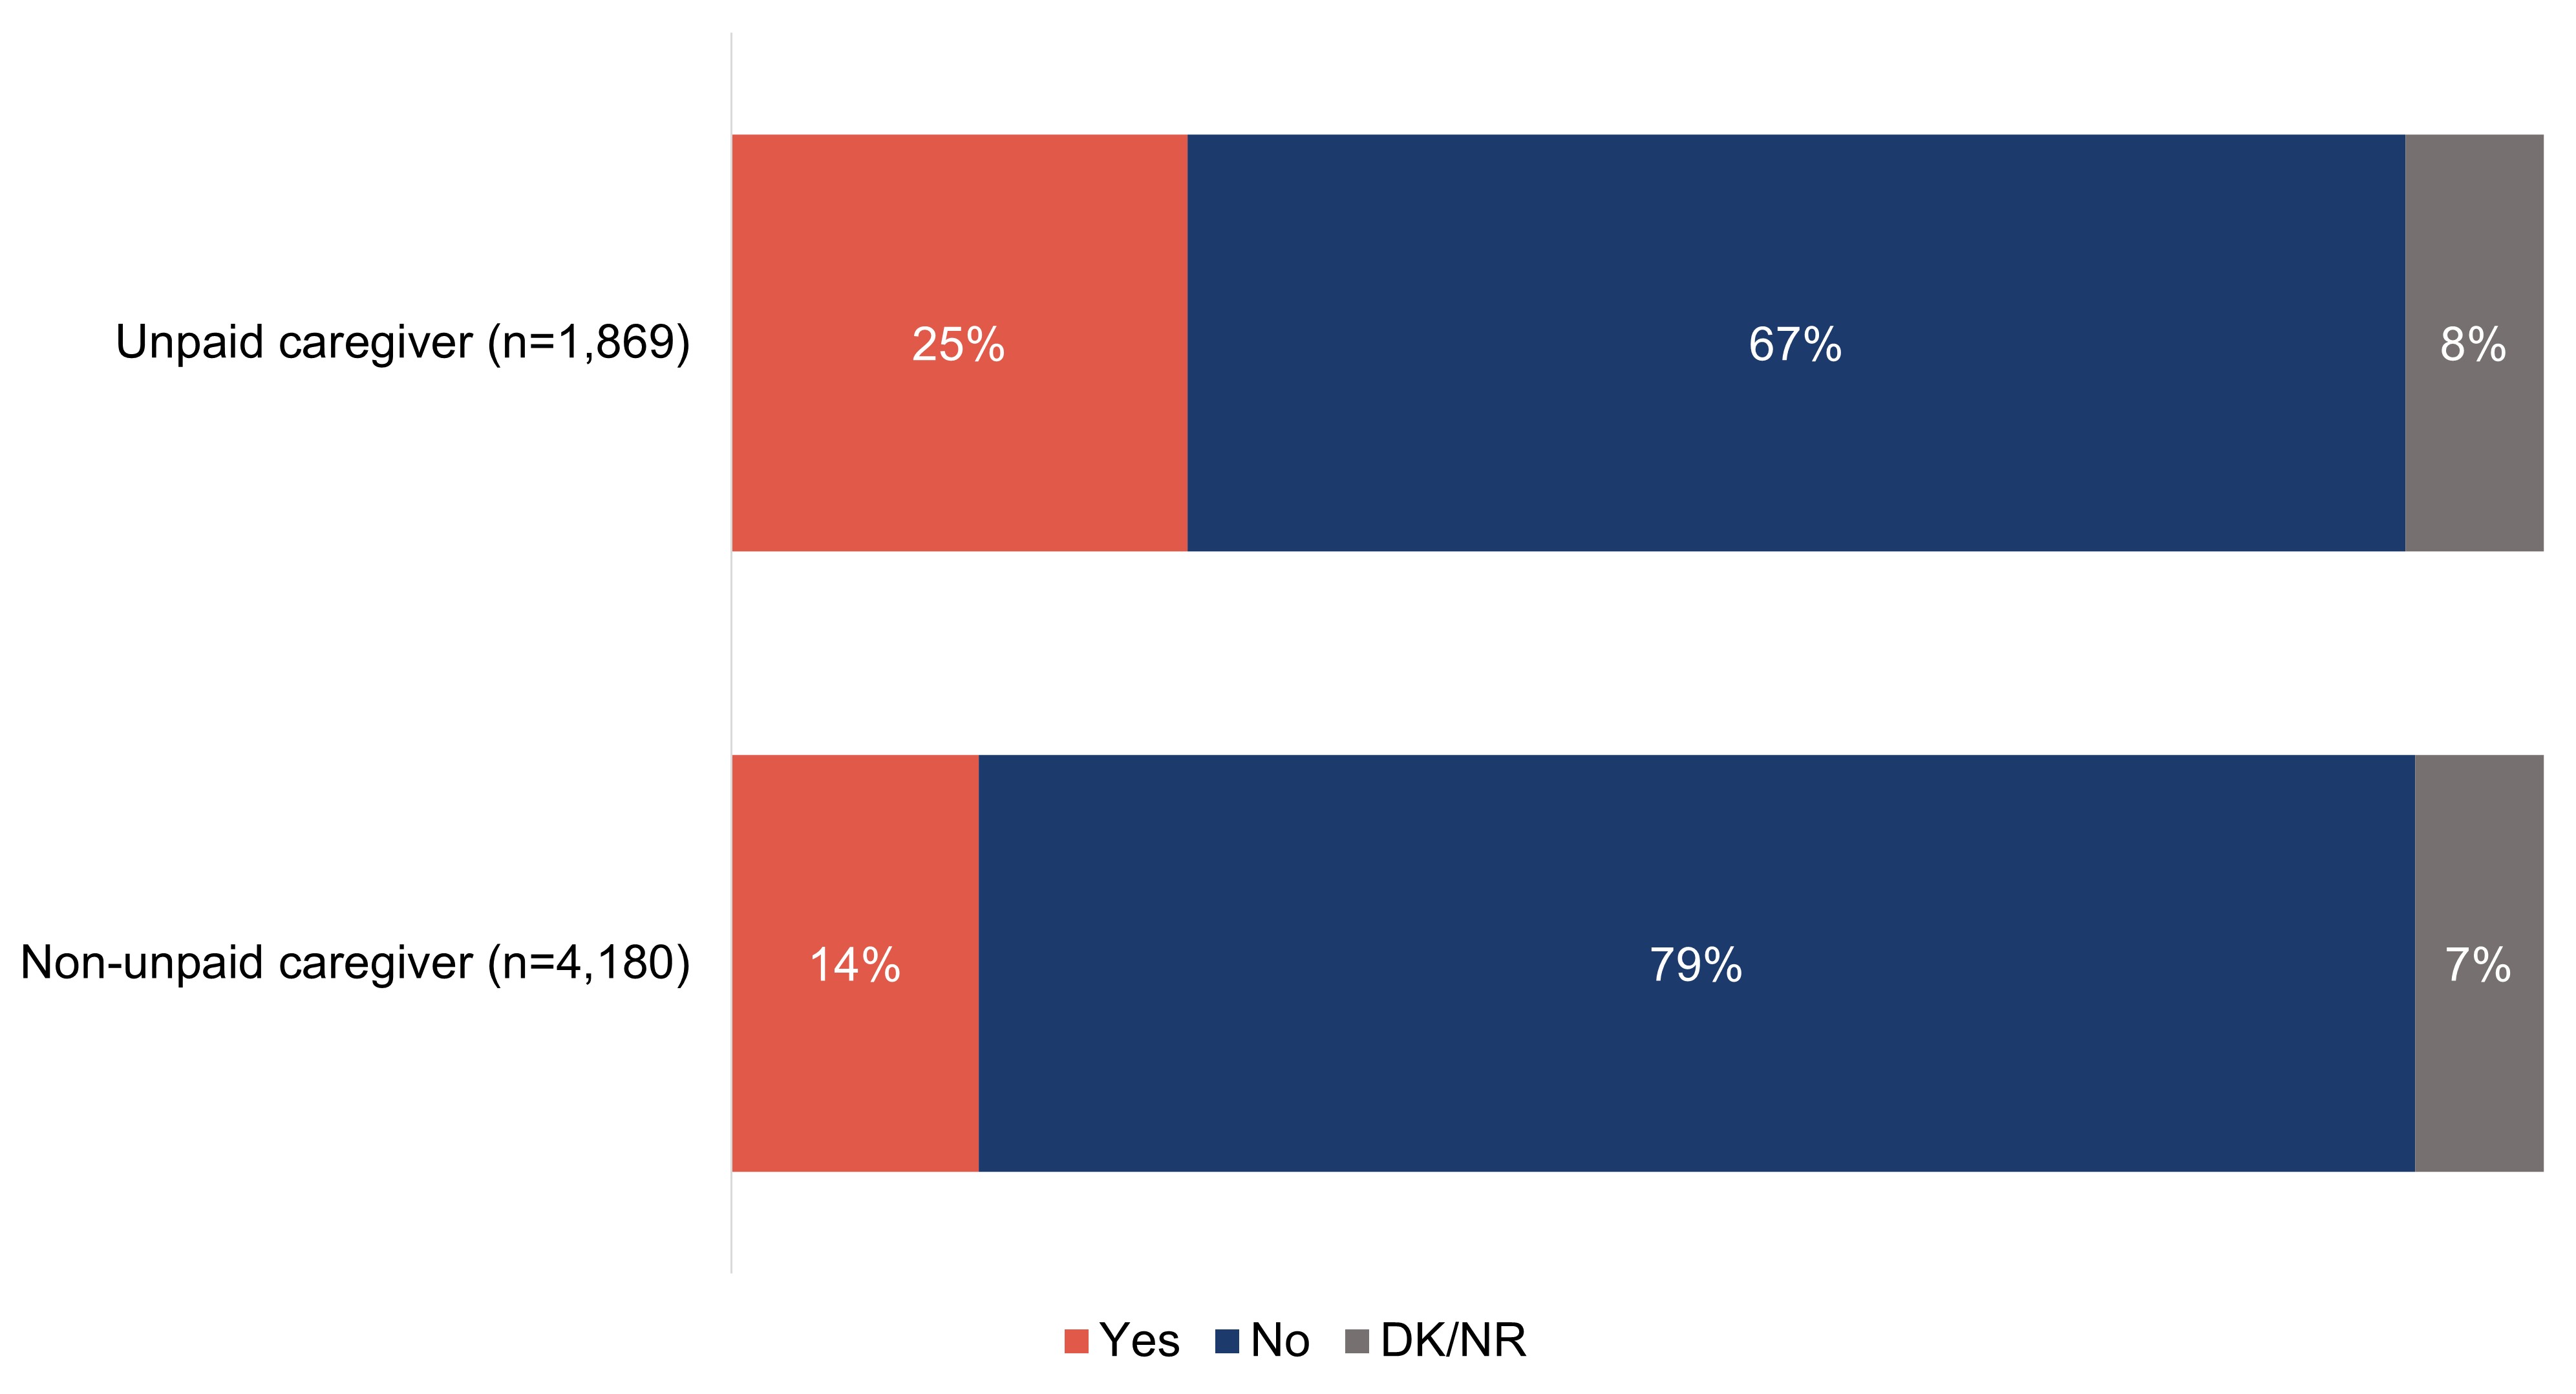
In terms of facing challenges accessing or using dementia recommendations or advice, over one-third (37%) of respondents who are or have been an unpaid caregiver say they have not experienced any challenges while 54% have experienced challenges. In terms of challenges, approximately one-fifth of respondents who are unpaid caregivers say that the advice is too complicated to understand or communicate (20%), is too expensive to obtain (19%), or does not reflect important cultural context for those to whom they provide care (19%).
Exhibit A7: Q11: Which of the following challenges, if any, have you encountered when accessing or using dementia recommendations and advice related to the care you are providing? Select all that apply; response total may be greater than 100%.
Base: Those who have been an unpaid caregiver of a person living with dementia in the past 5 years (n=1,869).
Figure 7.Figure 7 - Text description
I have not encountered any challenges or barriers
37%
Advice is too complicated to understand or communicate
20%
Advice is too expensive to obtain
19%
Advice does not consider the cultural context for those to whom I provide care or support
19%
Advice is not in the right language
11%
Do not trust the source of the advice
9%
Other
2%
DK/NR
9%
Key demographic differences for the target audiences for this research are shown in the charts below:
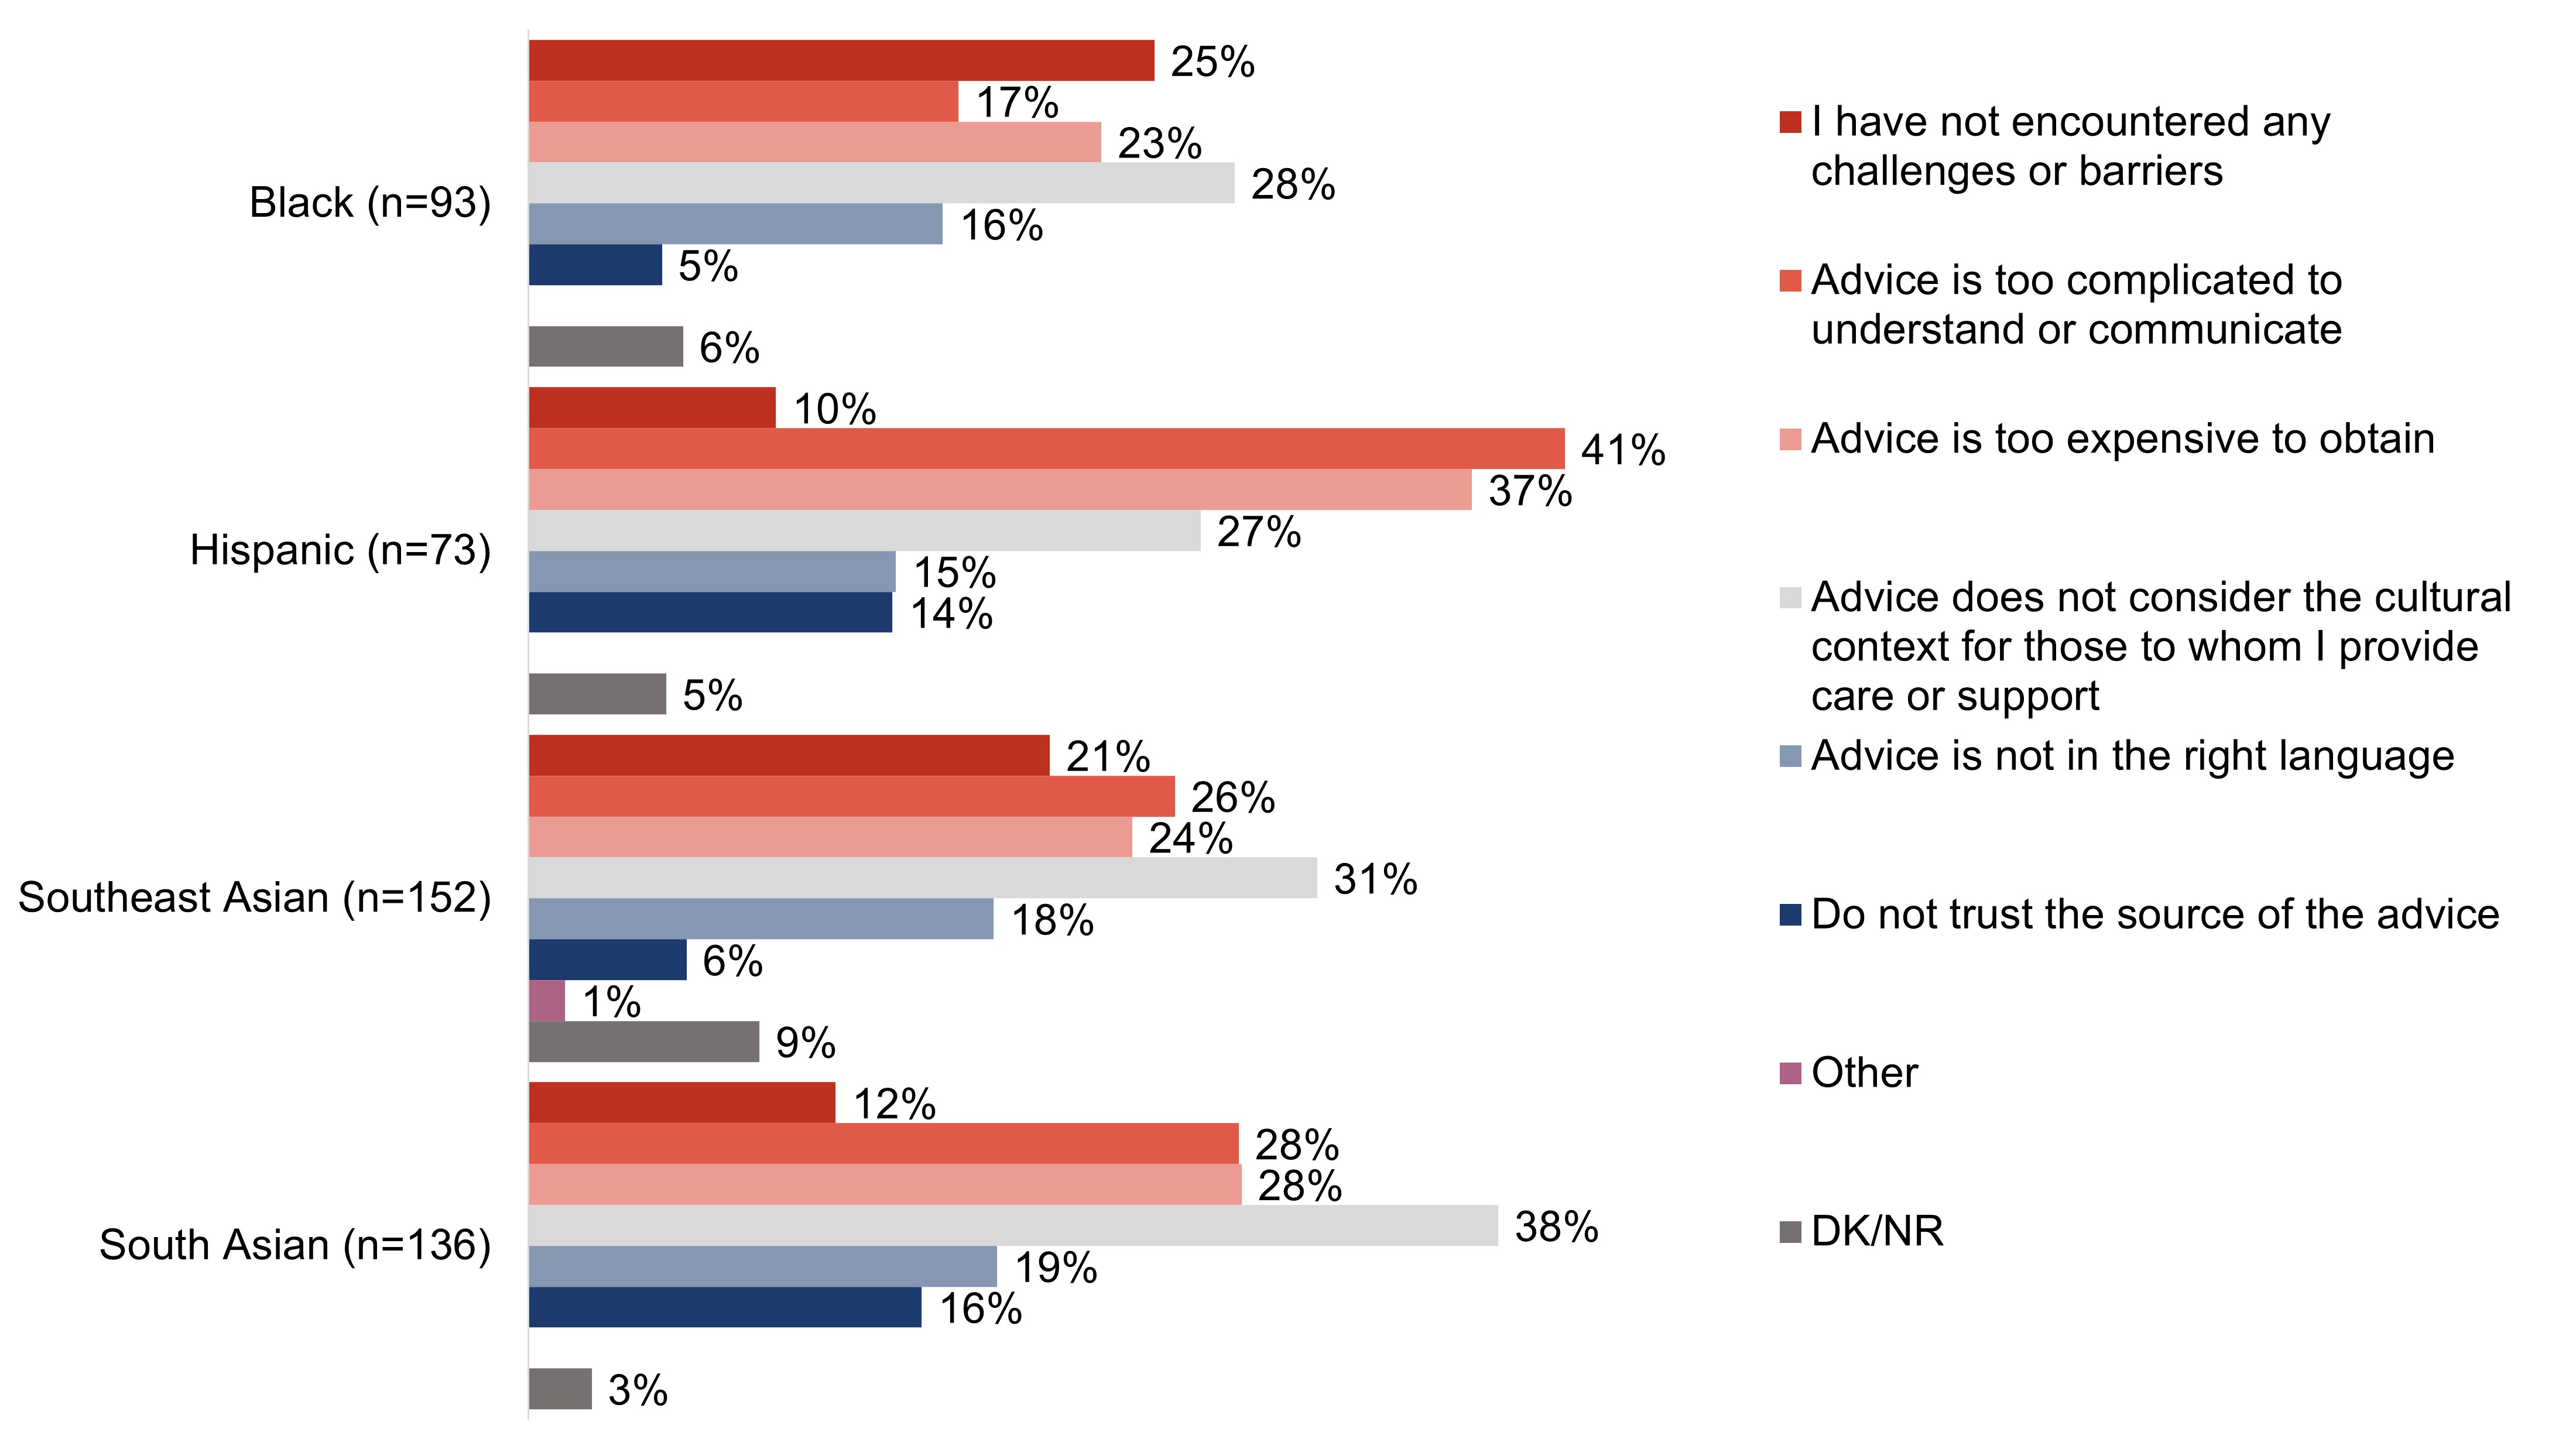
Respondents who are Hispanic are the most likely to say that the advice they received is too complicated (41%), or too expensive to obtain (37%). Respondents who are South Asian are the most likely (at 38%) to say that the advice did not reflect the cultural context of the individual to whom they provided care. Nearly one in six respondents who are South Asian (16%) or Hispanic (14%) say that they did not trust the advice they received.
Exhibit A8: Q11: Which of the following challenges, if any, have you encountered when accessing or using dementia recommendations and advice related to the care you are providing? Select all that apply; response total may be greater than 100%.
Base: Those who have been an unpaid caregiver of a person living with dementia in the past 5 years.
Figure 8.Figure 8 - Text description
Column %
Black (n=93)
Hispanic (n=73)
Southeast Asian (n=152)
South Asian (n=136)
I have not encountered any challenges or barriers
25%
10%
21%
12%
Advice is too complicated to understand or communicate
17%
41%
26%
28%
Advice is too expensive to obtain
23%
37%
24%
28%
Advice does not consider the cultural context for those to whom I provide care or support
28%
27%
31%
38%
Advice is not in the right language
16%
15%
18%
19%
Do not trust the source of the advice
5%
14%
6%
16%
Other
0%
0%
1%
0%
DK/NR
6%
5%
9%
3%
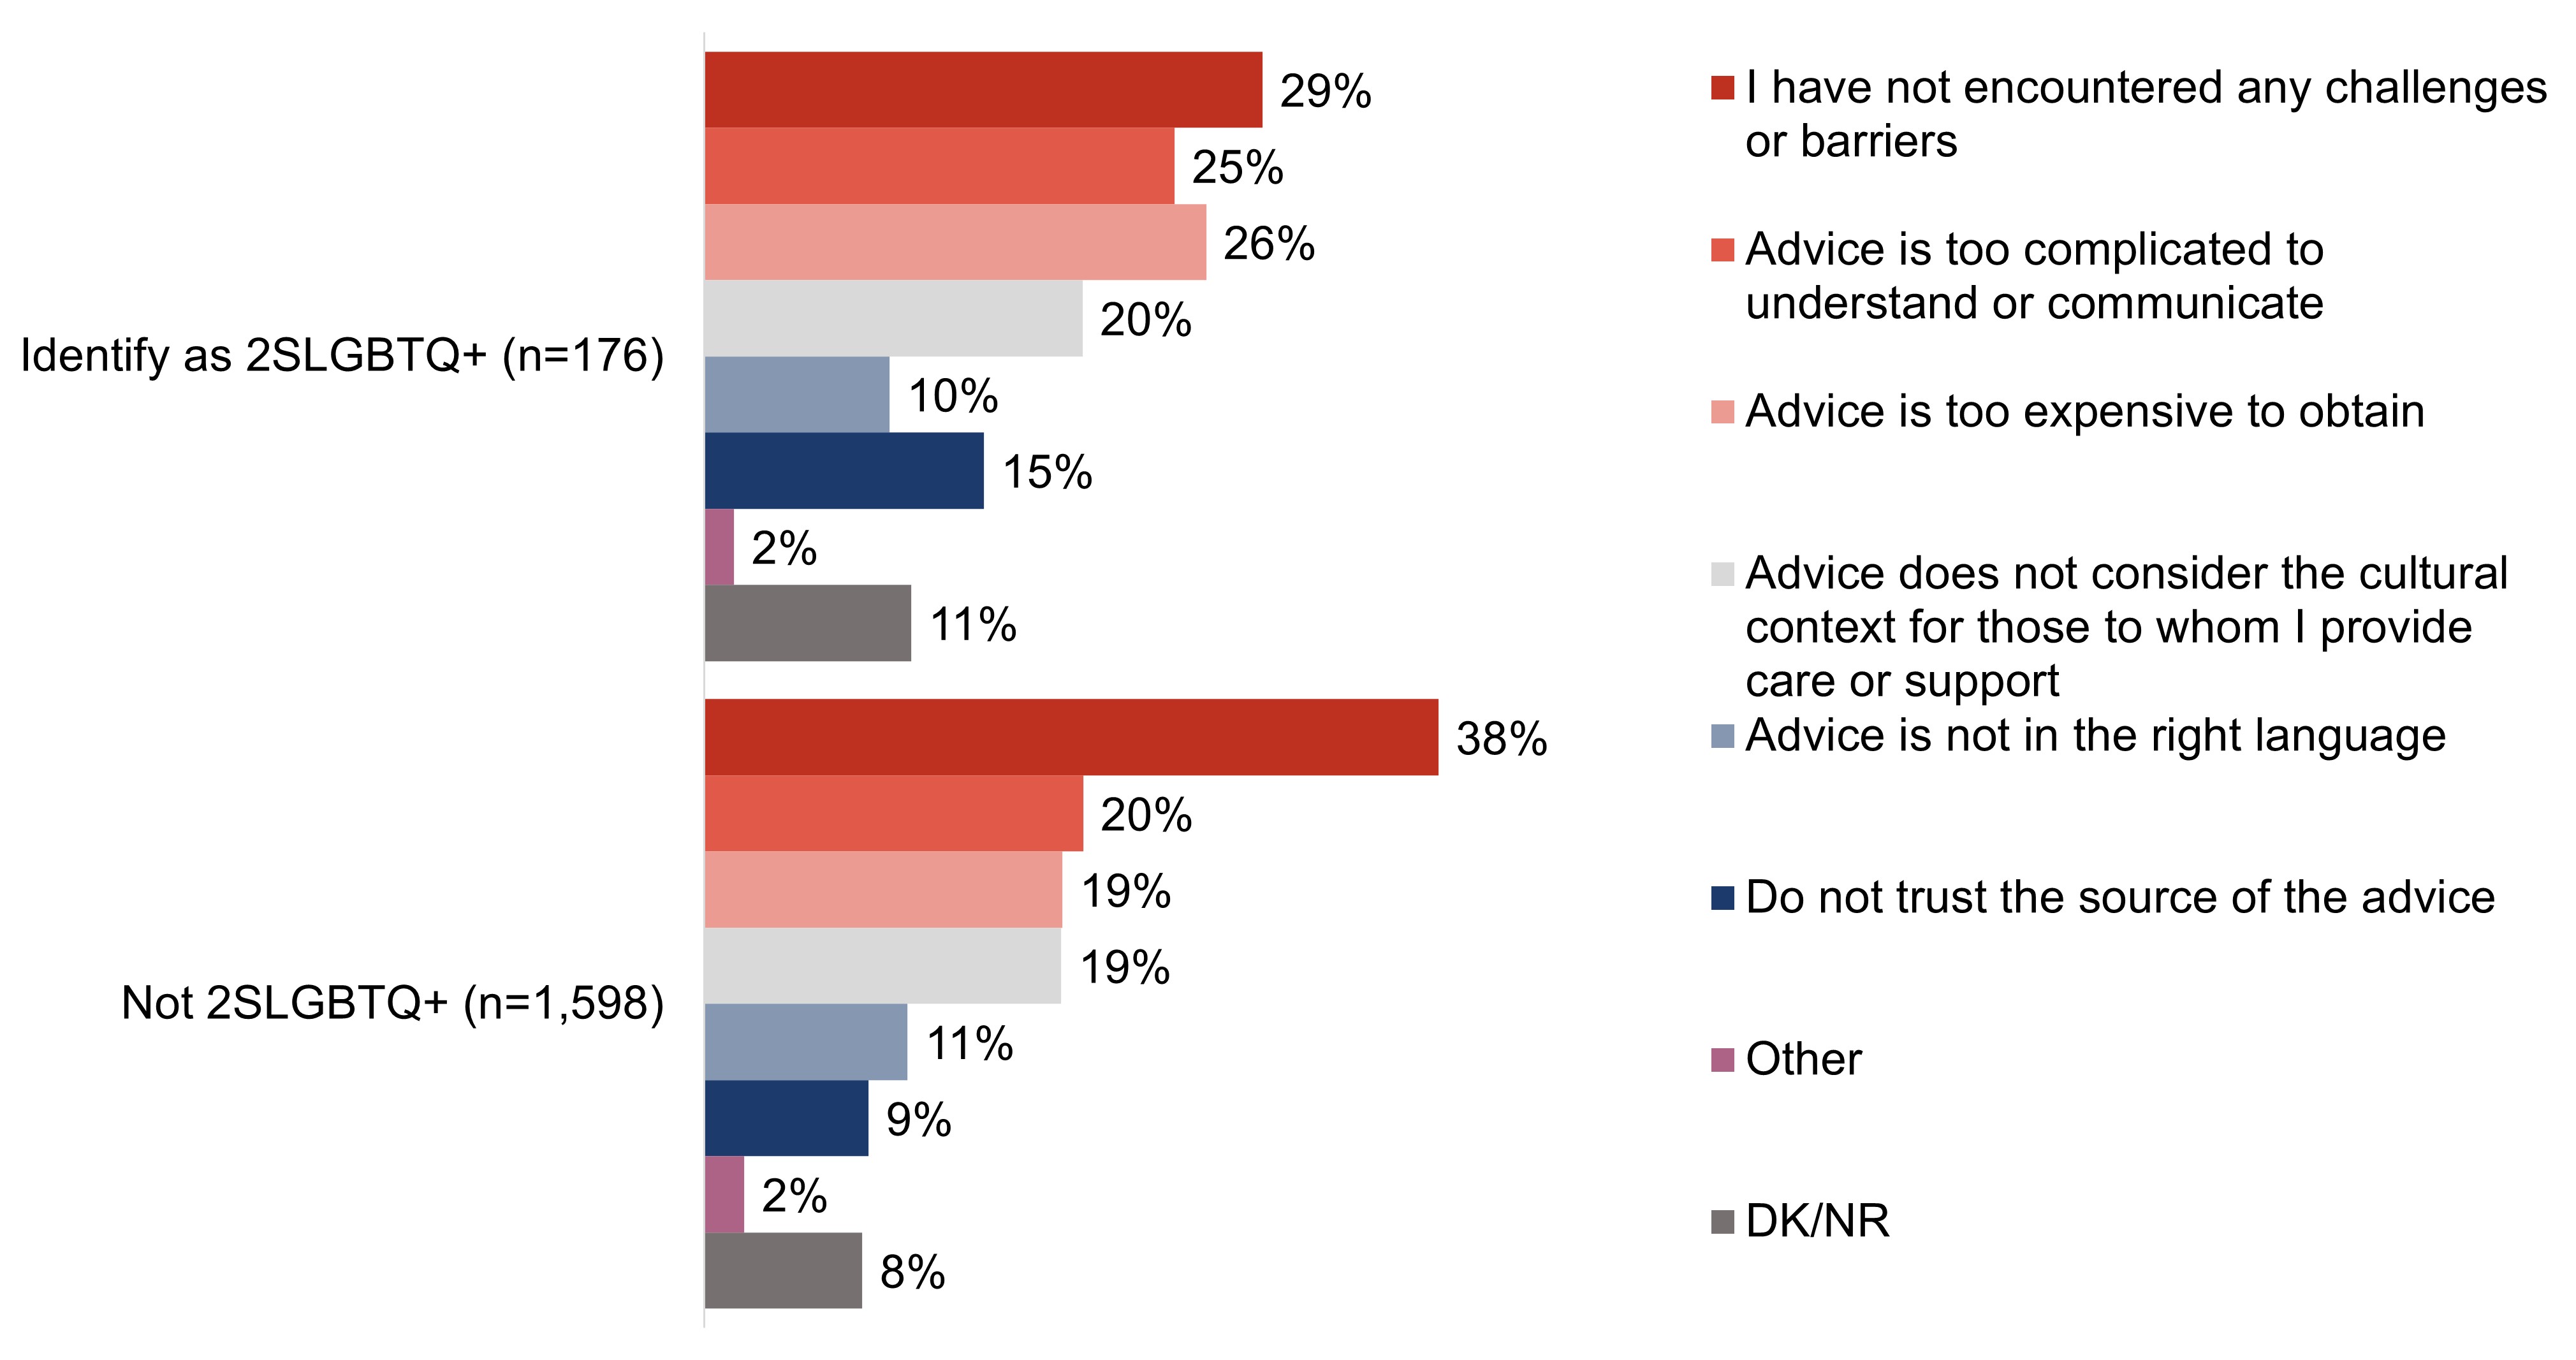
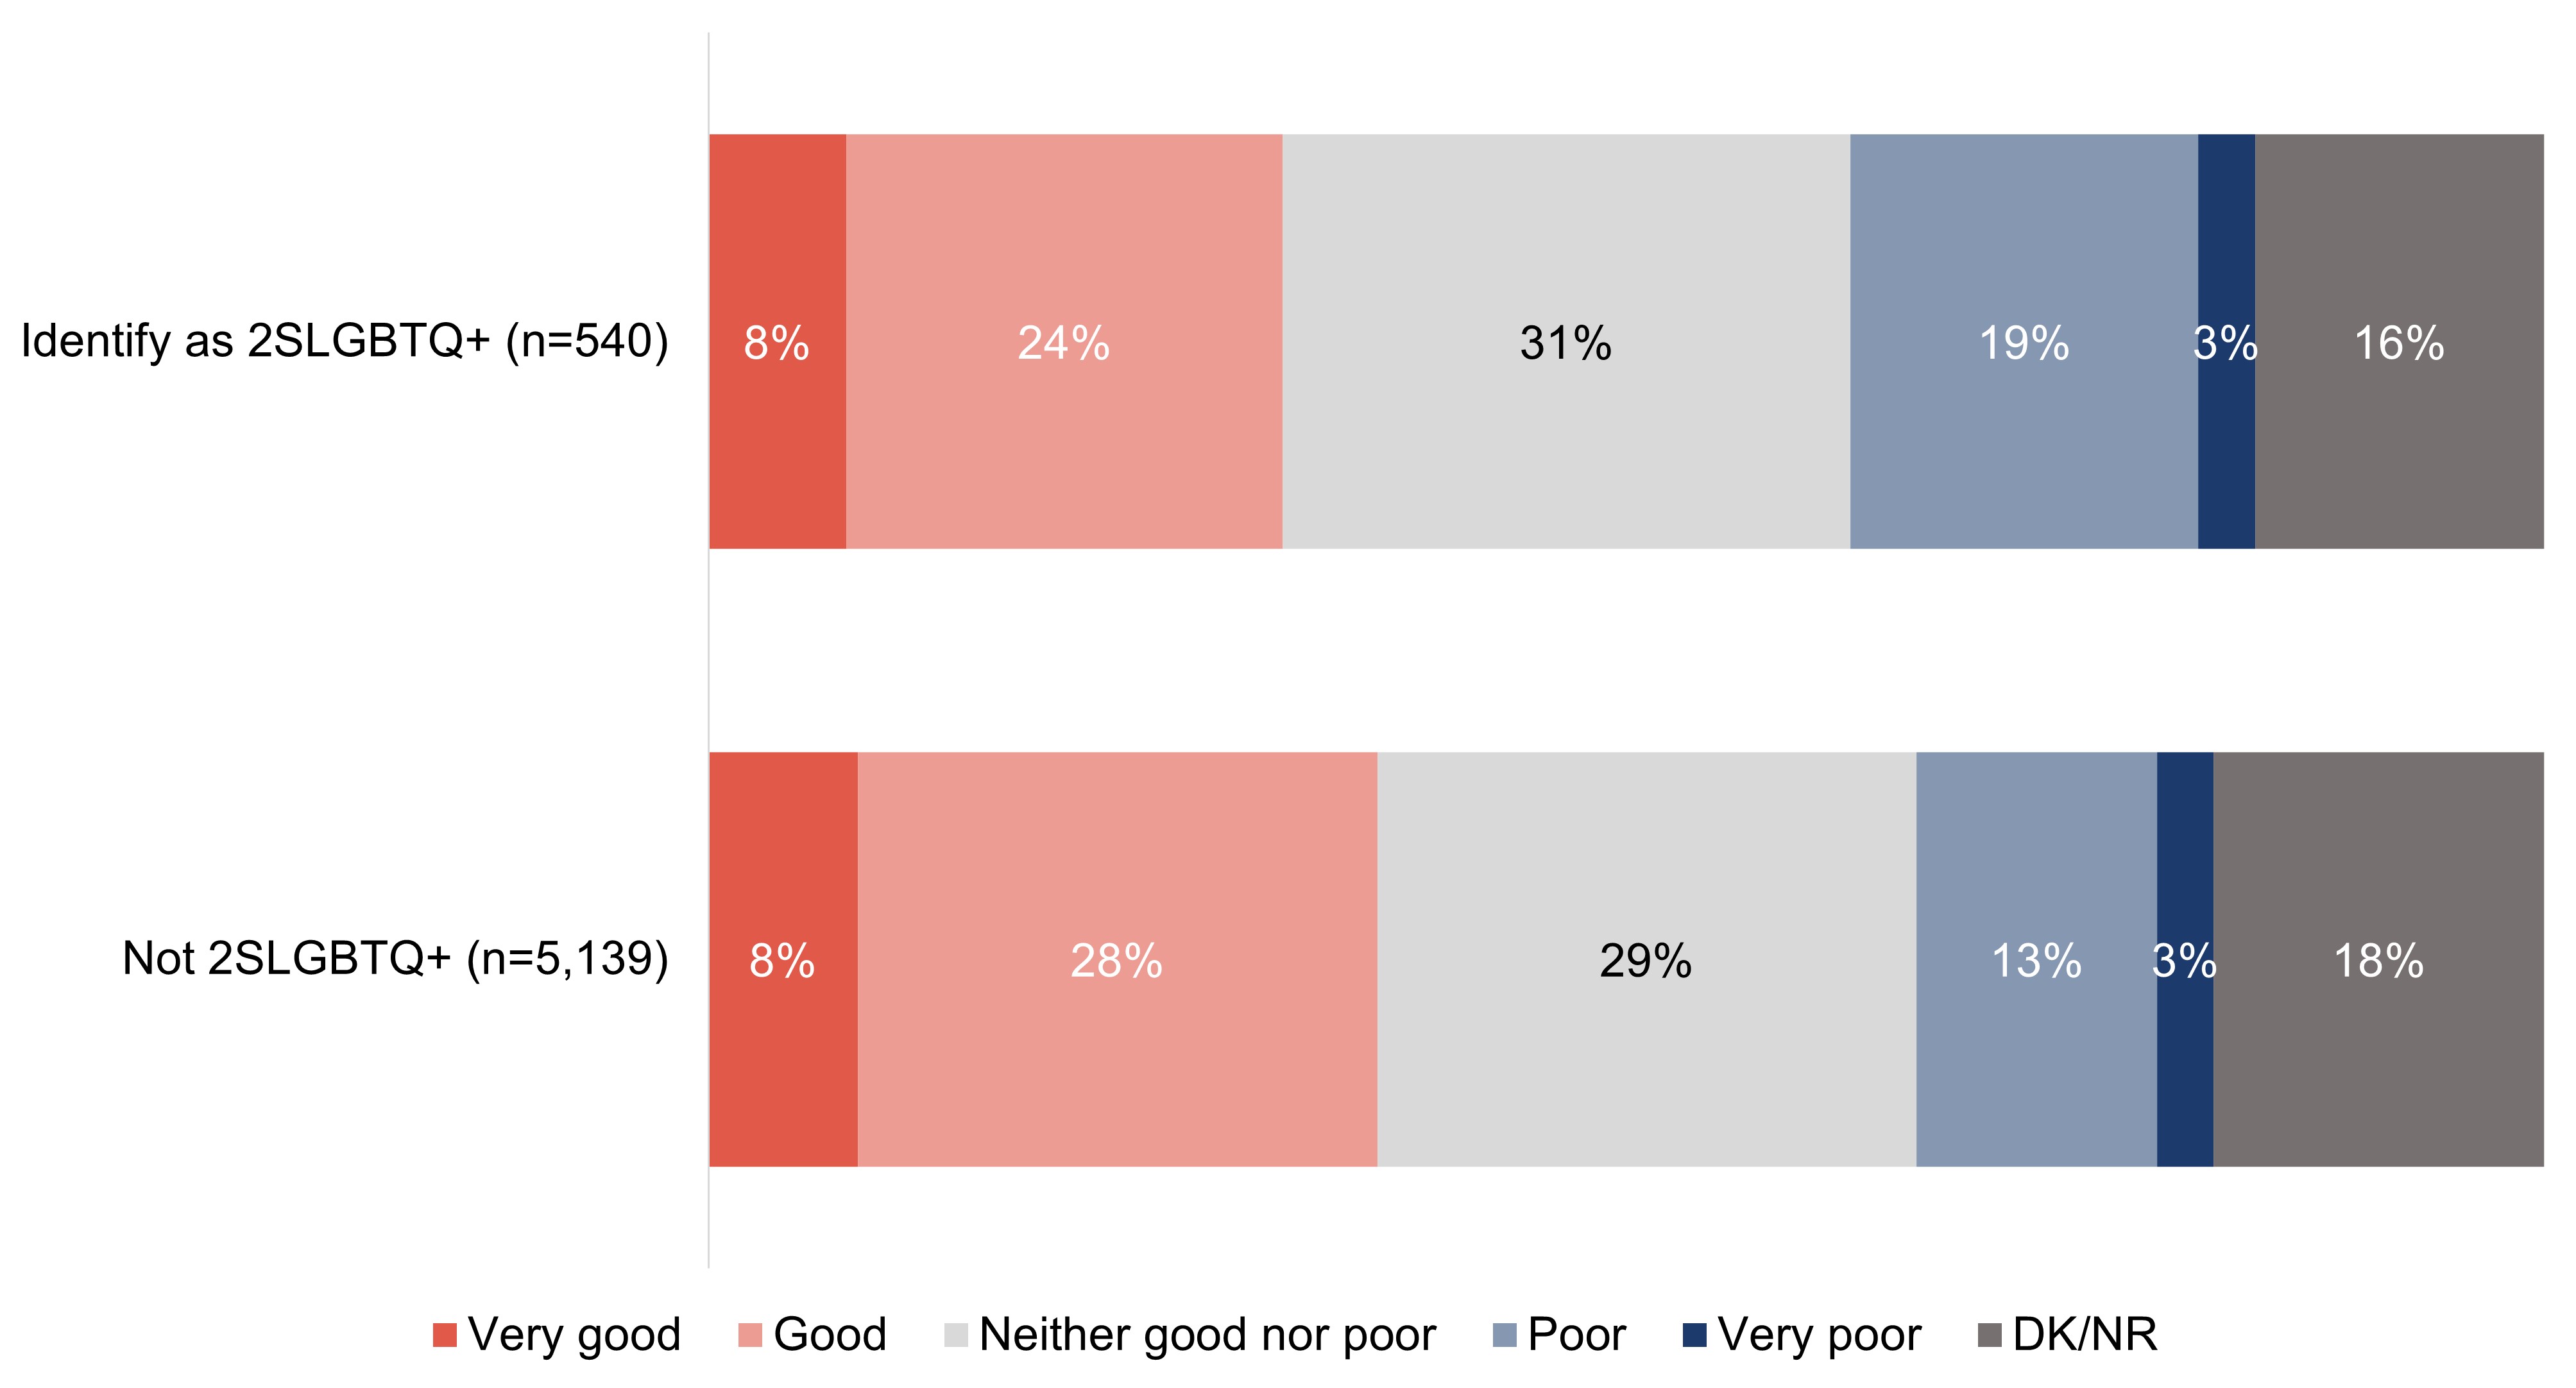
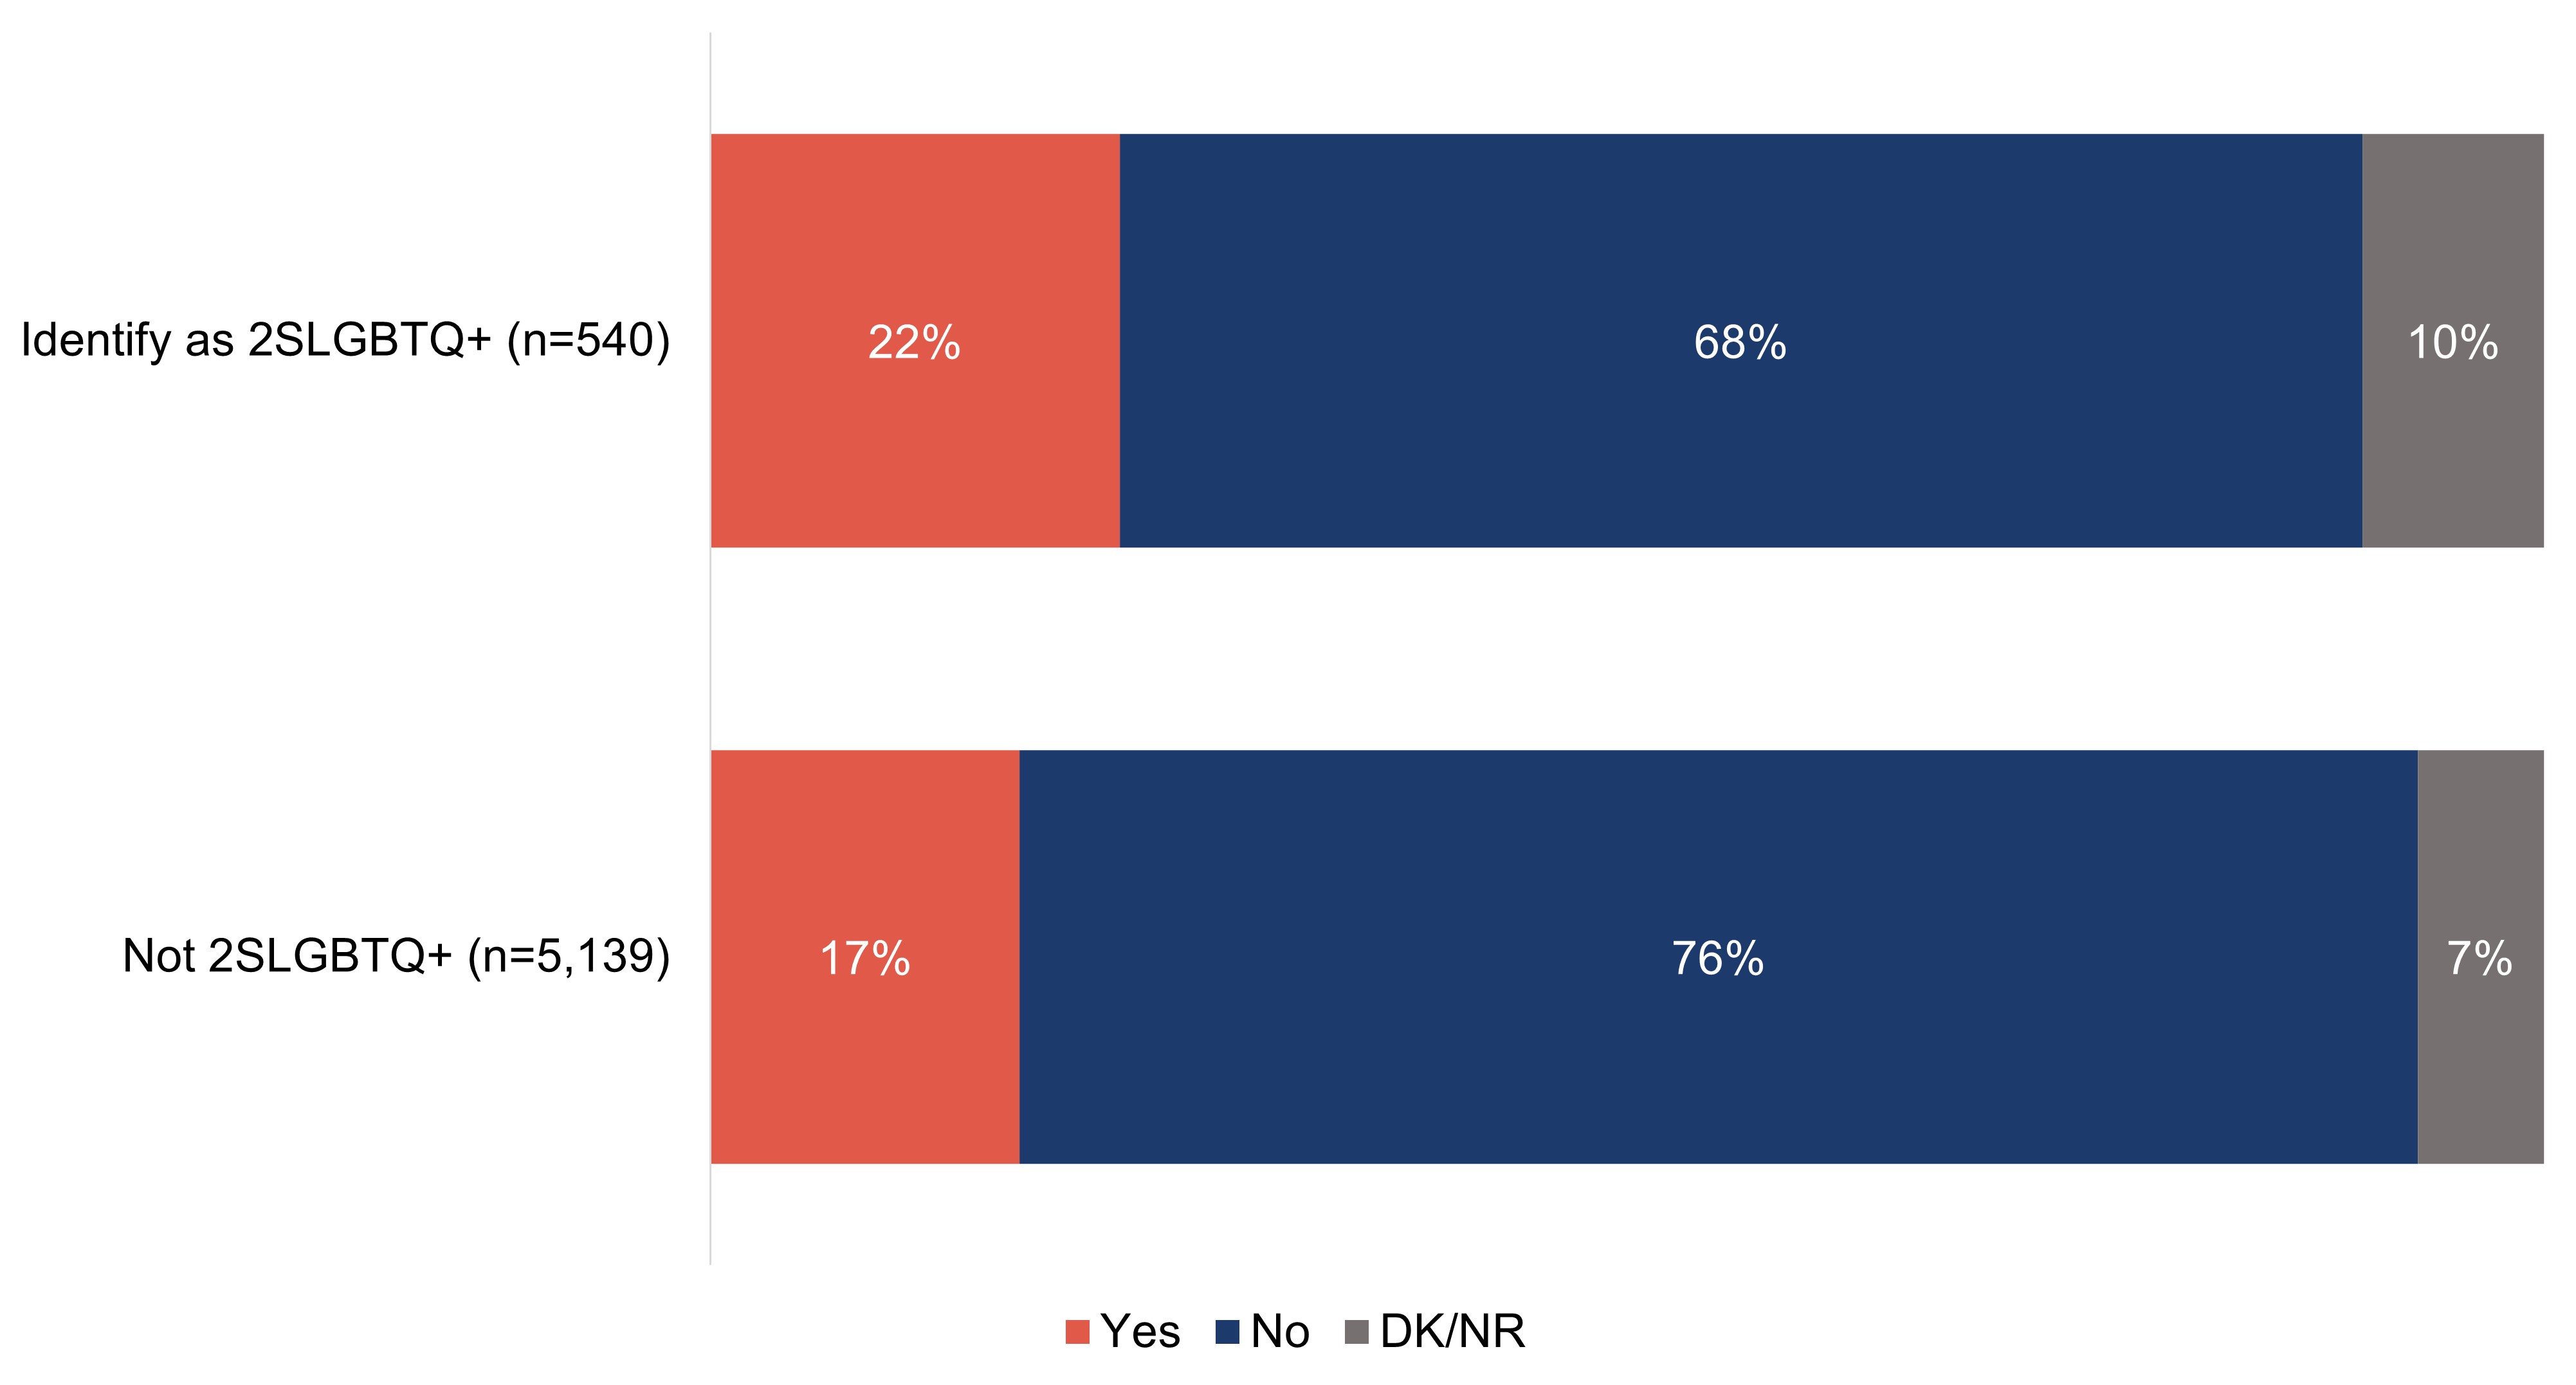
Respondents who do not identify as 2SLGBTQ+ are more likely than those who do to say that they have not encountered any challenges or barriers when accessing or using dementia recommendations and advice (38% and 29%, respectively). Respondents who identify as 2SLGBTQ+ are more likely to say that the advice is too expensive to obtain (26%) or that they do not trust the source of the advice received (15%).
Exhibit A9: Q11: Which of the following challenges, if any, have you encountered when accessing or using dementia recommendations and advice related to the care you are providing? Select all that apply; response total may be greater than 100%.
Base: Those who have been an unpaid caregiver of a person living with dementia in the past 5 years.
Figure 9.Figure 9 - Text description
Column %
Identify as 2SLGBTQ+ (n=176)
Not 2SLGBTQ+ (n=1,598)
I have not encountered any challenges or barriers
29%
38%
Advice is too complicated to understand or communicate
25%
20%
Advice is too expensive to obtain
26%
19%
Advice does not consider the cultural context for those to whom I provide care or support
20%
19%
Advice is not in the right language
10%
11%
Do not trust the source of the advice
15%
9%
Other
2%
2%
DK/NR
11%
8%
Other quantitative demographic differences include:
Age
Respondents aged 65 years or older are the most likely to indicate that they have not encountered any challenges or barriers (at 59%), while respondents who are 18 to 34 years of age are the least likely (19%).
Region
Those who live in Quebec are more likely than other regions in Canada to say they have not experienced any of the difficulties listed when accessing or using dementia recommendations and advice (48%).
Employment
Respondents who are retired are the most likely to say they have not experienced any of the difficulties listed when accessing or using dementia recommendations and advice (60%).
Language
French speaking respondents are more likely than English speaking respondents to say that they have never encountered challenges or barriers (50% versus 36%).
Experience with dementia
Respondents are more likely to say they have not experienced any of the difficulties listed when accessing or using dementia recommendations and advice if they:
have not had and do not have a work or volunteer role where they interact with people living with dementia (44%); or,
are not aware of dementia-inclusive communities (40%).
Section A2: Personal knowledge of dementia
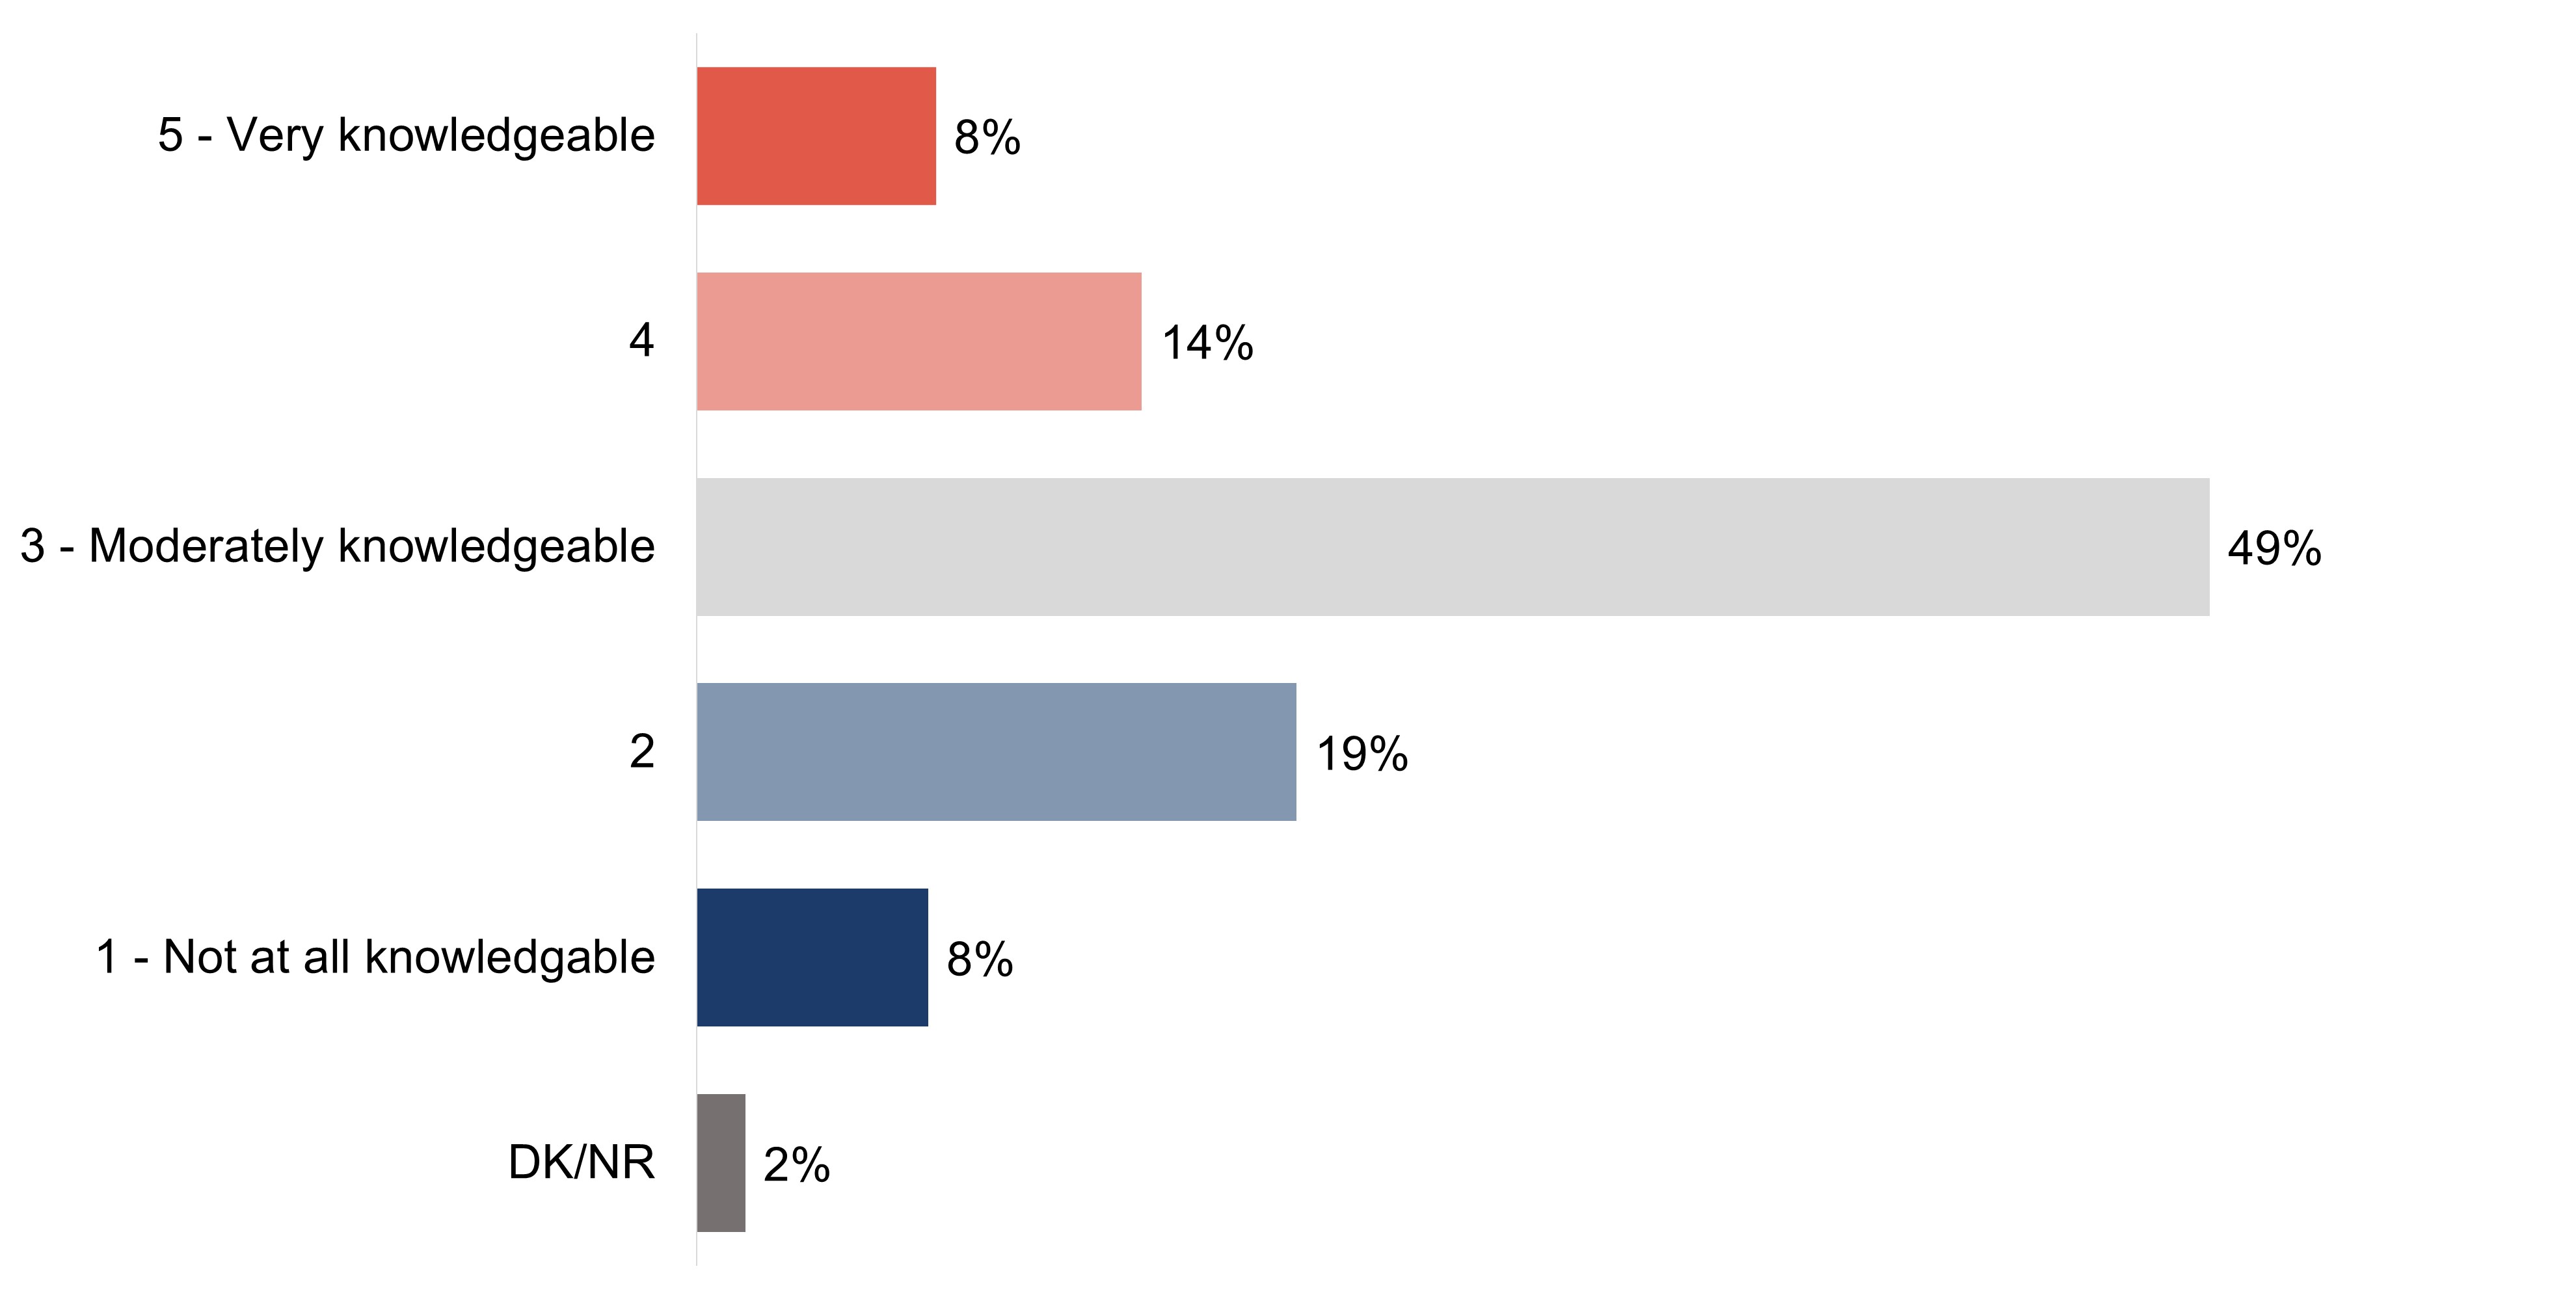
More survey respondents rate their knowledge of dementia as 'not at all or not very knowledgeable' at one or two (27%) compared to more than moderately knowledge at four or five (22%). The remaining respondents (49%) say their knowledge of dementia is 'moderate' (a rating of three).
Exhibit A10: Q12: On a scale of 1 to 5 where 1 means not at all knowledgeable, 3 means moderately knowledgeable and 5 means very knowledgeable, how knowledgeable would you say you are about dementia?
Base: All respondents (n=6049).
Figure 10. TitleFigure 10 - Text description
5 - Very knowledgeable
8%
4
14%
3 - Moderately knowledgeable
49%
2
19%
1 - Not at all knowledgeable
8%
DK/NR
2%
Key demographic differences for the target audiences for this research are shown in the charts below:
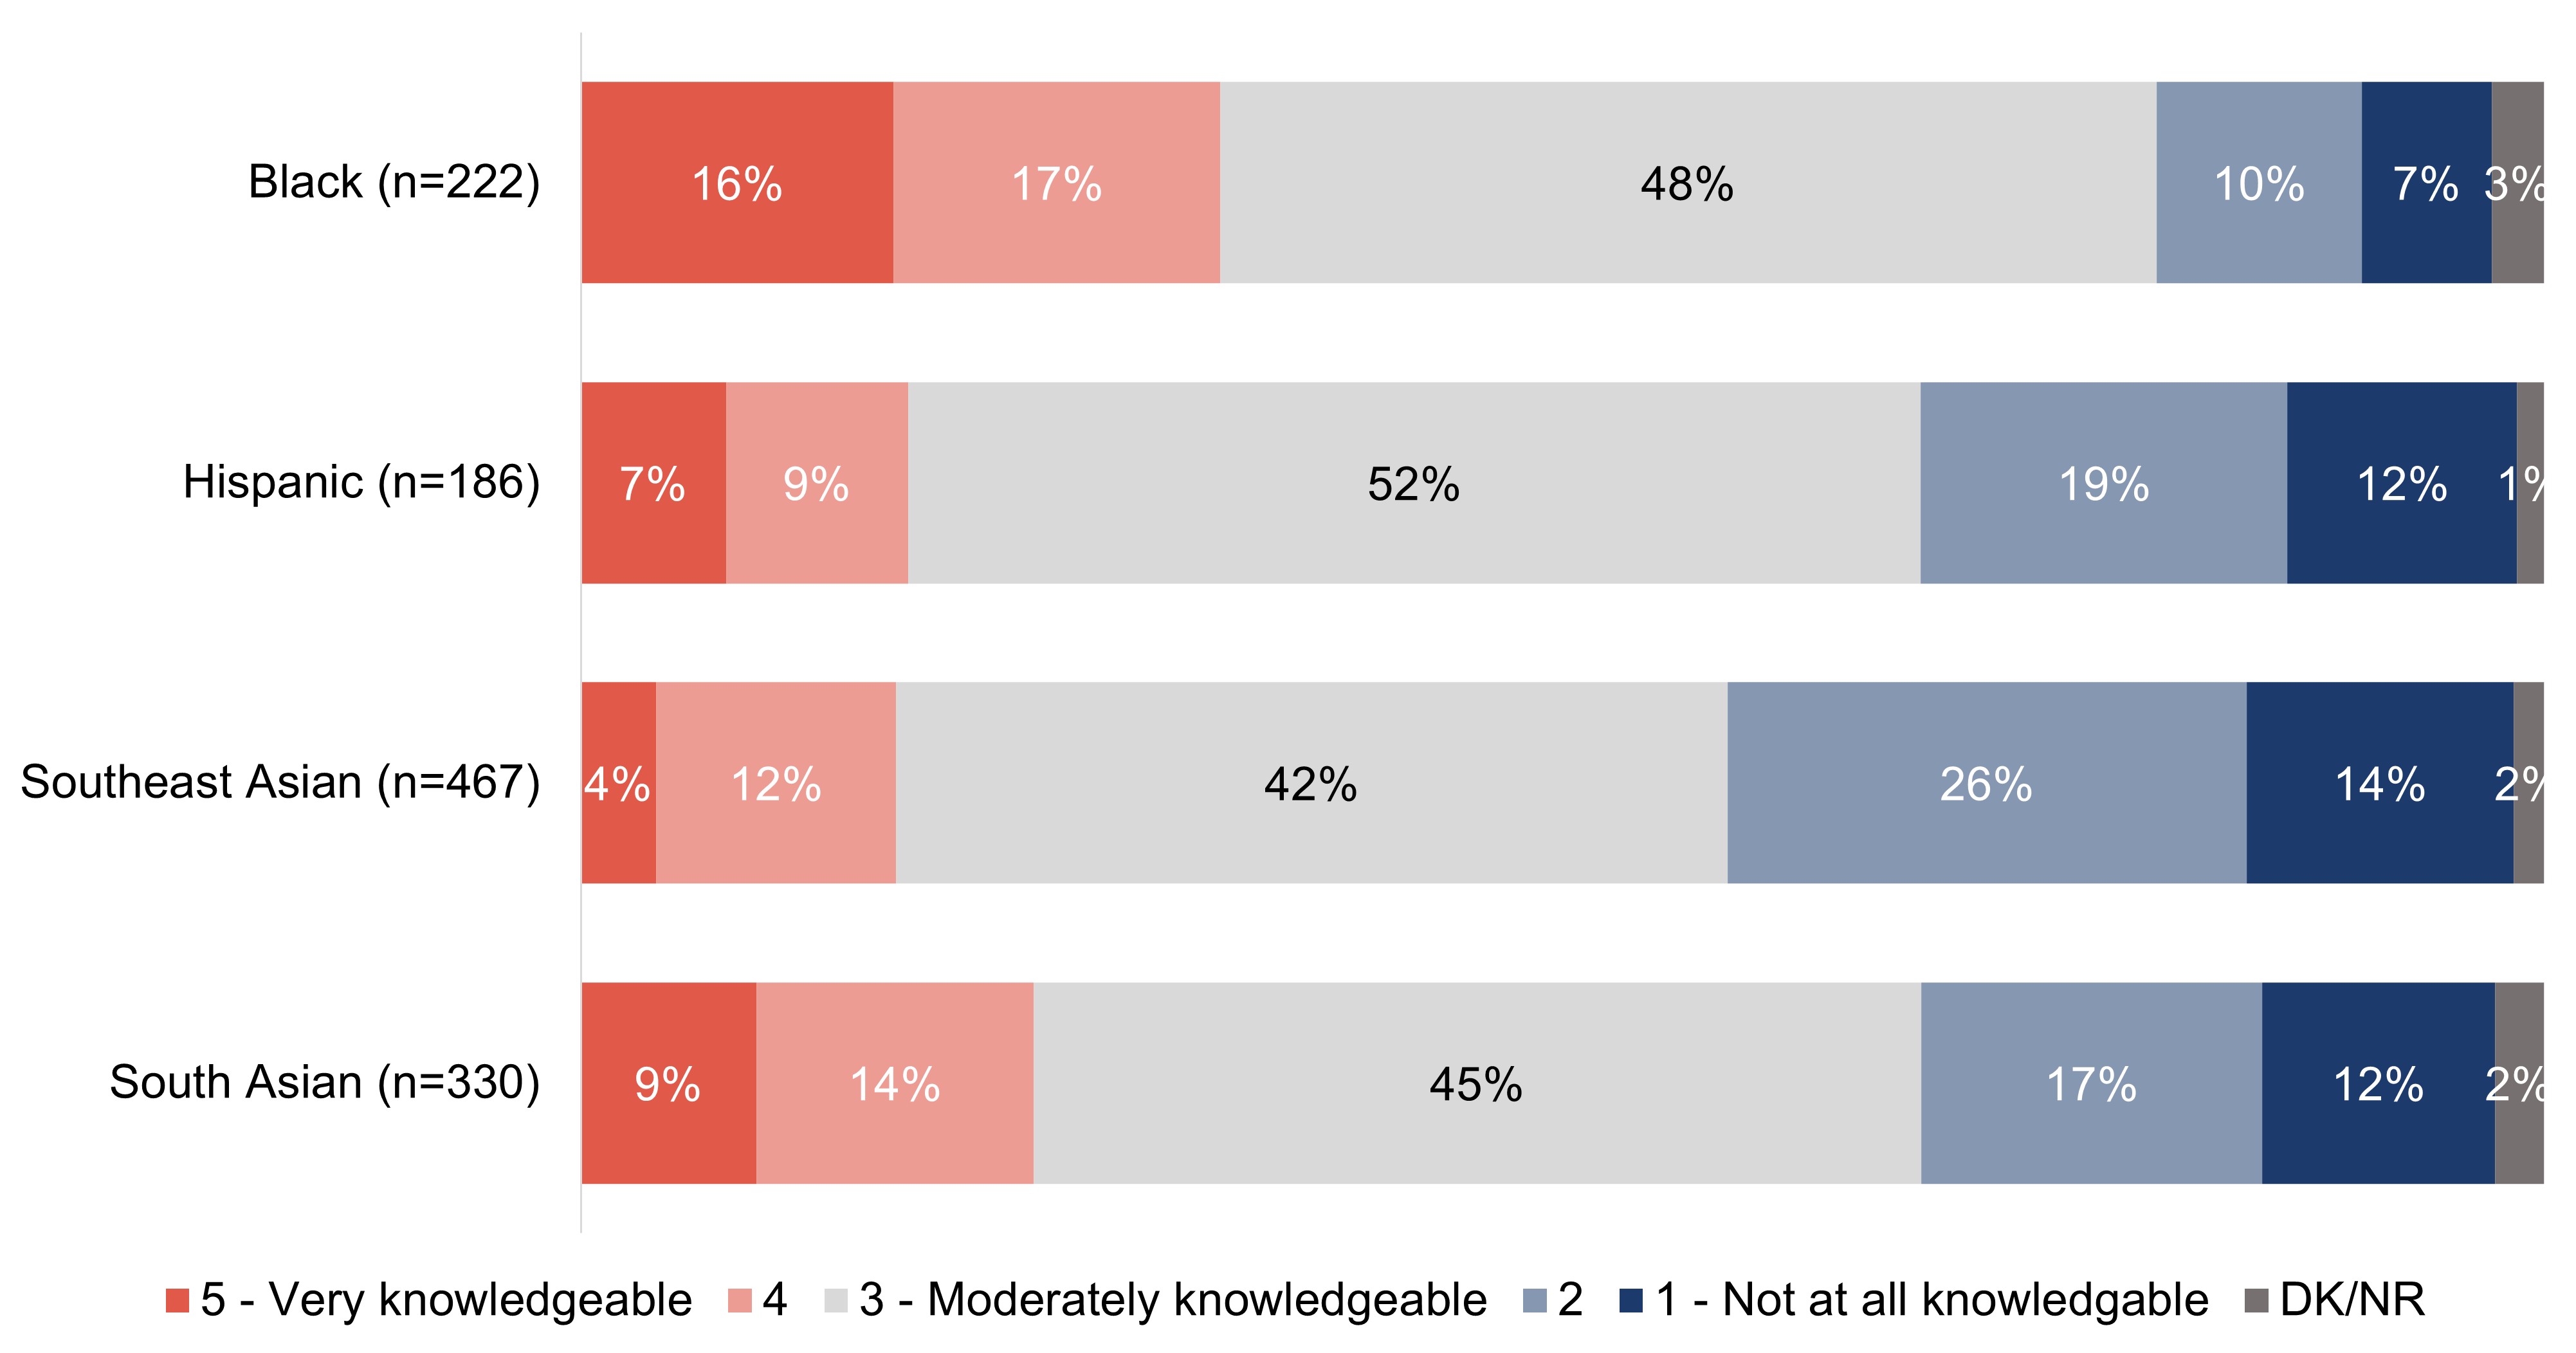
One-third (33%) of respondents who are Black and one-quarter (23%) of respondents who are South Asian say their knowledge about dementia is more than moderate. Two in five (40%) respondents who are Southeast Asian rate their knowledge of dementia lower than moderate. Among respondents who are Hispanic, twice as many assess their knowledge of dementia as lower than moderate compared to greater (30% versus 17%, respectively).
Exhibit A11: Q12: On a scale of 1 to 5 where 1 means not at all knowledgeable, 3 means moderately knowledgeable and 5 means very knowledgeable, how knowledgeable would you say you are about dementia?
Base: All respondents.
Figure 11.Figure 11 - Text description
Column %
Black (n=222)
Hispanic (n=186)
Southeast Asian (n=467)
South Asian (n=330)
5 - Very knowledgeable
16%
7%
4%
9%
4
17%
9%
12%
14%
3 - Moderately knowledgeable
48%
52%
42%
45%
2
10%
19%
26%
17%
1 - Not at all knowledgable
7%
12%
14%
12%
DK/NR
3%
1%
2%
2%
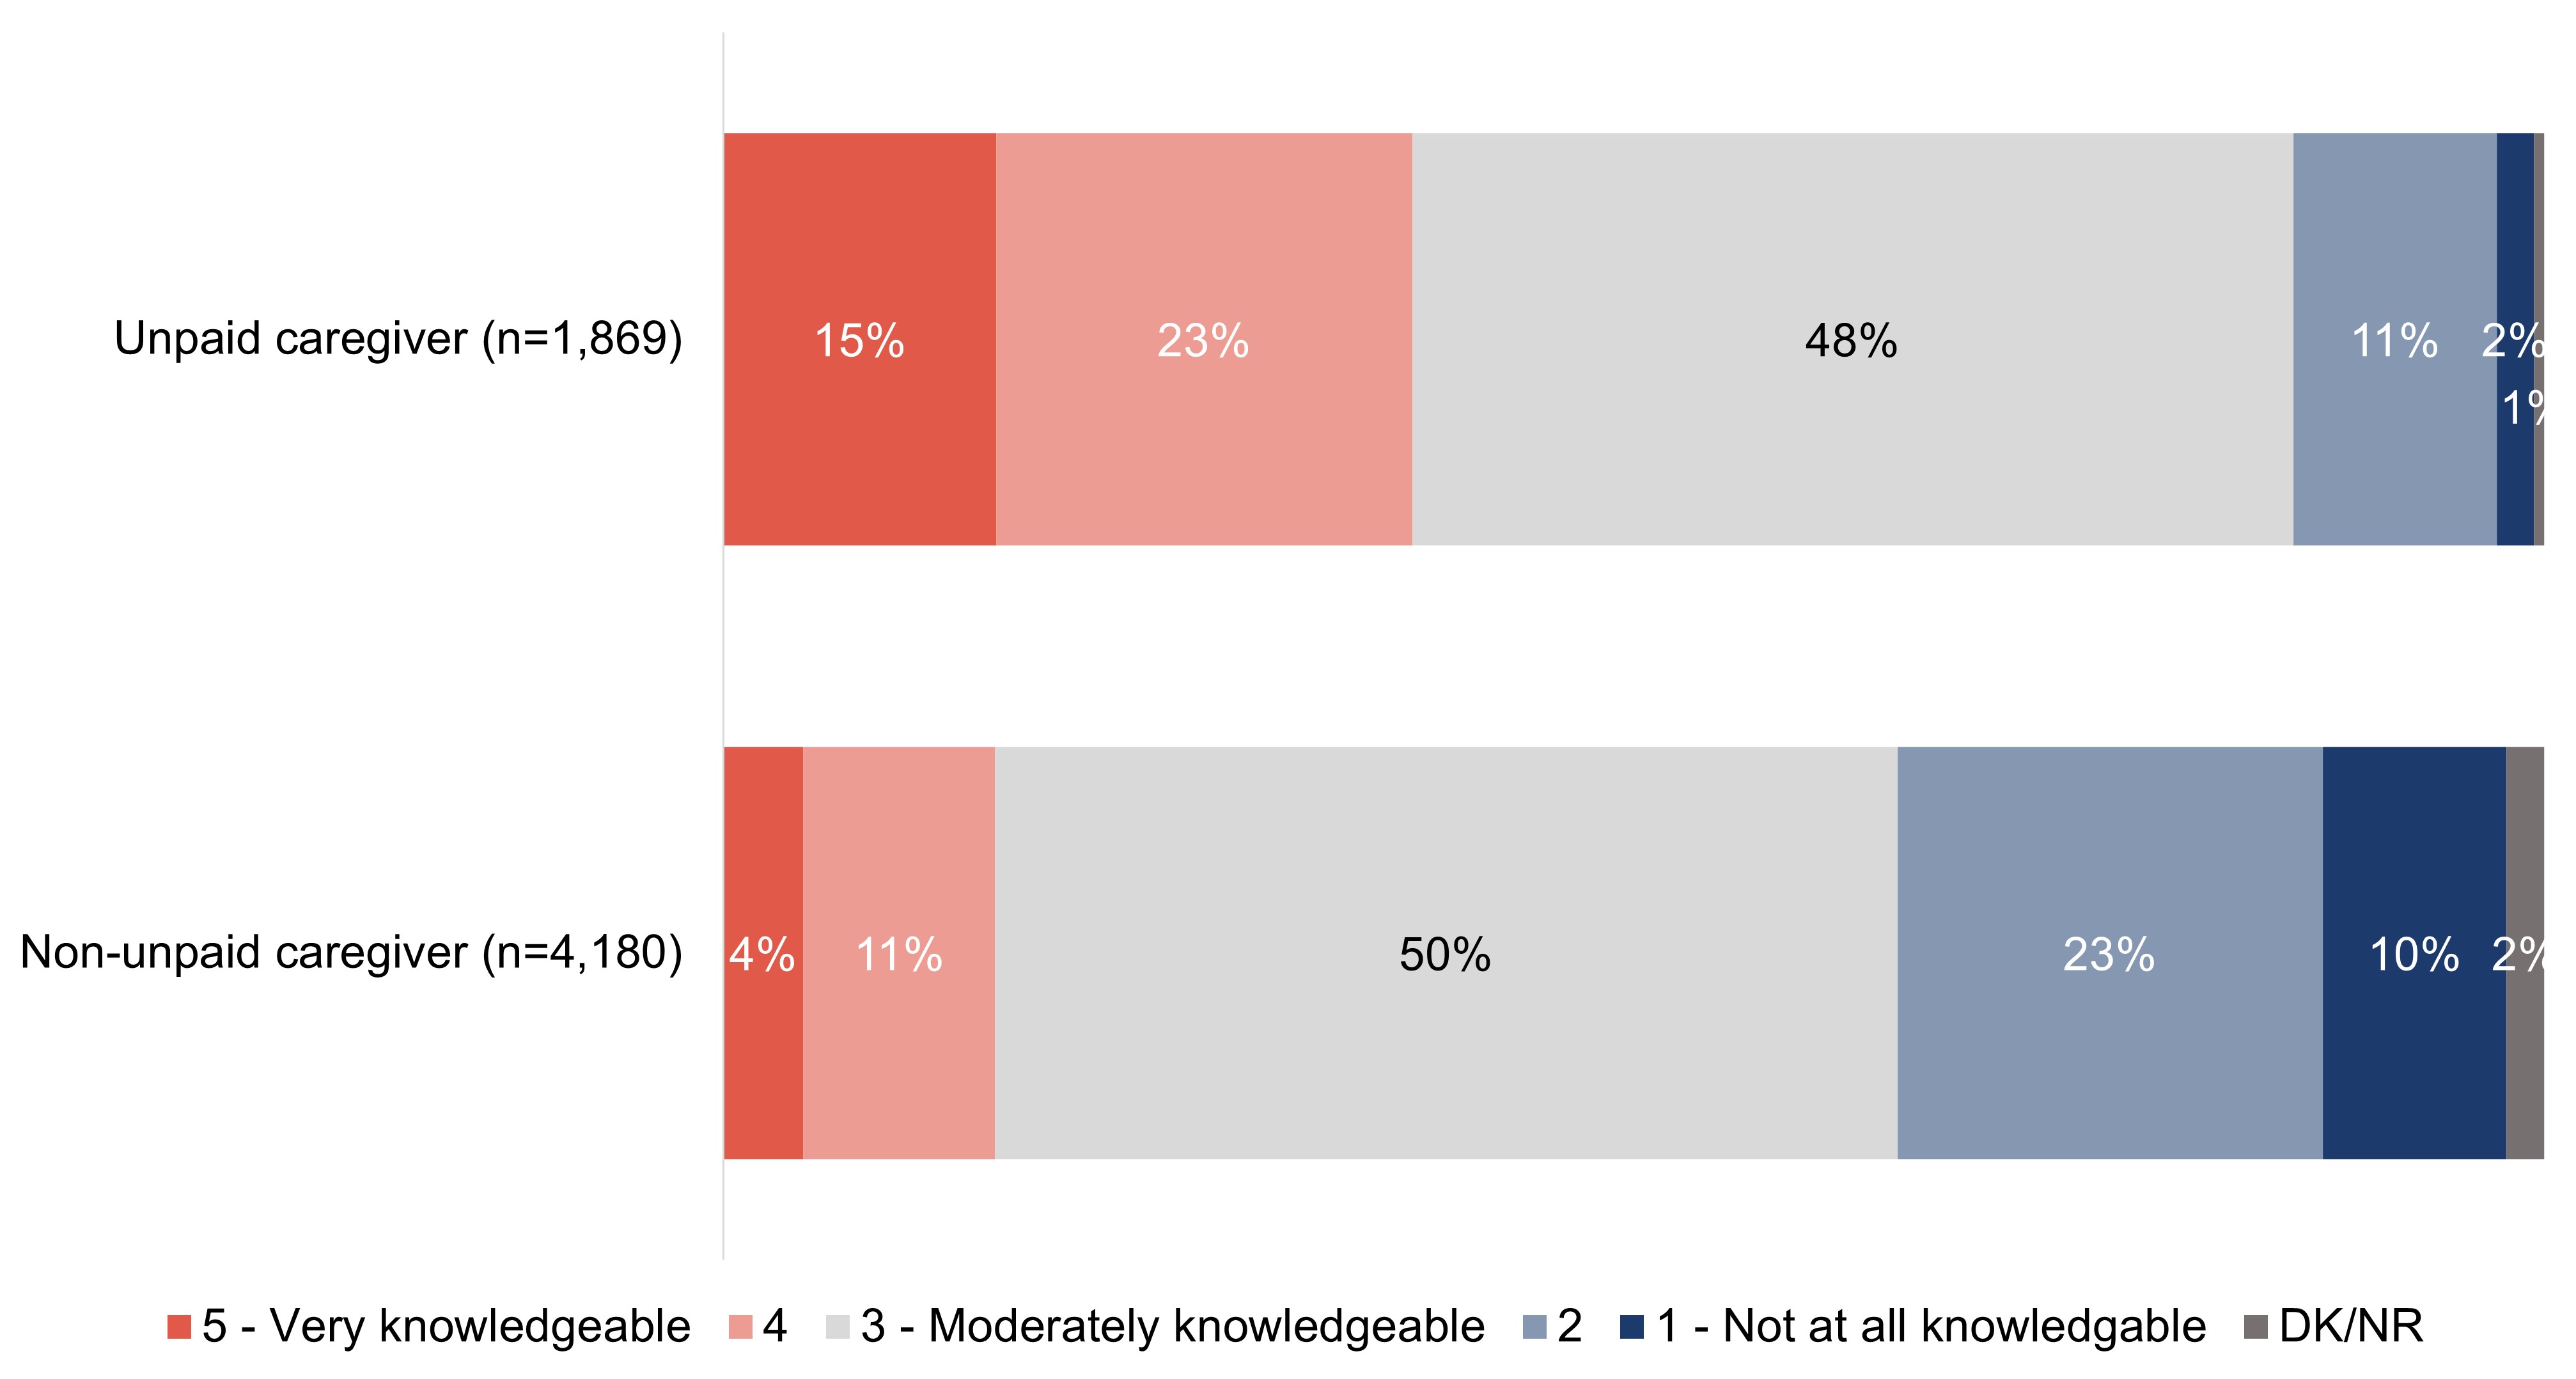
Two in five (38%) respondents who are unpaid caregivers say their knowledge of dementia is greater than moderate, while 13% rate it as less than moderate. The reverse is true of respondents who are not unpaid caregivers, with one-third (33%) saying their knowledge of dementia is lower than moderate and 15% rating their knowledge as more than moderate.
Exhibit A12: Q12: On a scale of 1 to 5 where 1 means not at all knowledgeable, 3 means moderately knowledgeable and 5 means very knowledgeable, how knowledgeable would you say you are about dementia?
Base: All respondents.
Figure 12.Figure 12 - Text description
Column %
Unpaid caregiver (n=1,869)
Non-unpaid caregiver (n=4,180)
5 - Very knowledgeable
15%
4%
4
23%
11%
3 - Moderately knowledgeable
48%
50%
2
11%
23%
1 - Not at all knowledgeable
2%
10%
DK/NR
1%
2%
Other quantitative demographic differences include:
Gender
Those who identify as a woman are more likely than those who identify as a man to say they are knowledgeable or very knowledgeable about dementia (24% versus 21%).
Region
Those who live in Quebec (48%) are more likely than other regions in Canada, including Manitoba/Saskatchewan (17%) and British Columbia (19%), to say they are knowledgeable about dementia.
Education
Respondents who have a high school education or less (at 16%) are the least likely to say they are knowledgeable about dementia.
Language
French speaking respondents are more likely than those who speak English to say they are knowledgeable about dementia (27% versus 21%).
Experience with dementia
Respondents who say they are knowledgeable about dementia are more likely than their counterparts to:
know a person living with dementia (28%);
have/had a work (48%) or volunteer (38%) role where they interact with people living with dementia;
interact with people living with dementia more than weekly (56%);
believe dementia is having a large impact in Canada today (33%);
say they are comfortable interacting with people living with dementia (37%);
are aware of dementia-inclusive communities (37%);
feel that communities should prioritize becoming dementia-inclusive (29%); or,
have received training on interacting with people living with dementia (59%).
Qualitative insights
Almost everyone was aware of the term dementia and seemed to have an understanding of some of the advanced symptoms (for example, memory loss, loss of time and place). There were a few participants, however, who seemed to be confused and linked dementia to a state of "lunacy" or "insanity," alcohol abuse, and/or drug addiction.
"Maladie liée à la perte de mémoire et des facultés cognitives." (A disease that's linked to memory loss and cognitive difficulties)– Recreational/fitness/community/religious and faith; Quebec
"La démence c'est quand on perd contact avec la réalité." (Dementia is when we lose contact with reality.)– Recreational/fitness/community/religious and faith; Quebec
When asked to define dementia, many used medical descriptions or symptoms, but there were also many who used terms that described the tragic loss feared or felt by the person living with dementia or the impact of the illness on loved ones, and in particular, their caregivers. The definitions participants most commonly elected to use fell into four thematic buckets; they were:
Symptoms – for example, confusion, impaired ability to think and make everyday decisions, and behaviour changes. Deterioration – for example, slow loss of memory, degenerative condition, cognitive or mental decline, deteriorating health and wellness, and gradual loss. Impact – for example, causing daily struggles, affects both the person and everyone around them, life changing, and an important topic. Adjectives – for example, heartbreaking, difficult, frightening, devastating, and complicated.
"A horrible disease that takes you away from your loved one not once, but twice." – Retail and food services; Ontario
"C'est plus les proches qui souffrent beaucoup, car la personne perd la mémoire et a besoin d'encadrement constant." (It is more their close ones that suffer the most, since the individual with dementia is losing their memory and needs constant care.)– Recreational/fitness/community/religious and faith; Quebec
Some were also familiar with the behaviours that may be exhibited by some people living with dementia, depending on symptoms, such as the potential for anger or violence, paranoia, isolation, and lack of confidence. Seeking participants' understanding of dementia as well as what first comes to mind when they think of dementia regularly uncovered personal experiences, most of which could be interpreted as difficult.
"Frustrating – it hurts them a lot. We all know that feeling when we want to tell someone something, but we lose the thought. And it's so frustrating when it's on the tip of your tongue but you can't get it. I imagine that's how it feels for them." – Retail and food services; Ontario
"A disease that robs you of who you are." – Financial services; Atlantic Canada
A handful of participants shared positive recollections of the person they knew who was living or had lived with dementia.
"My aunt is actually nicer. She's so innocent." – Financial services; West/Northern Canada
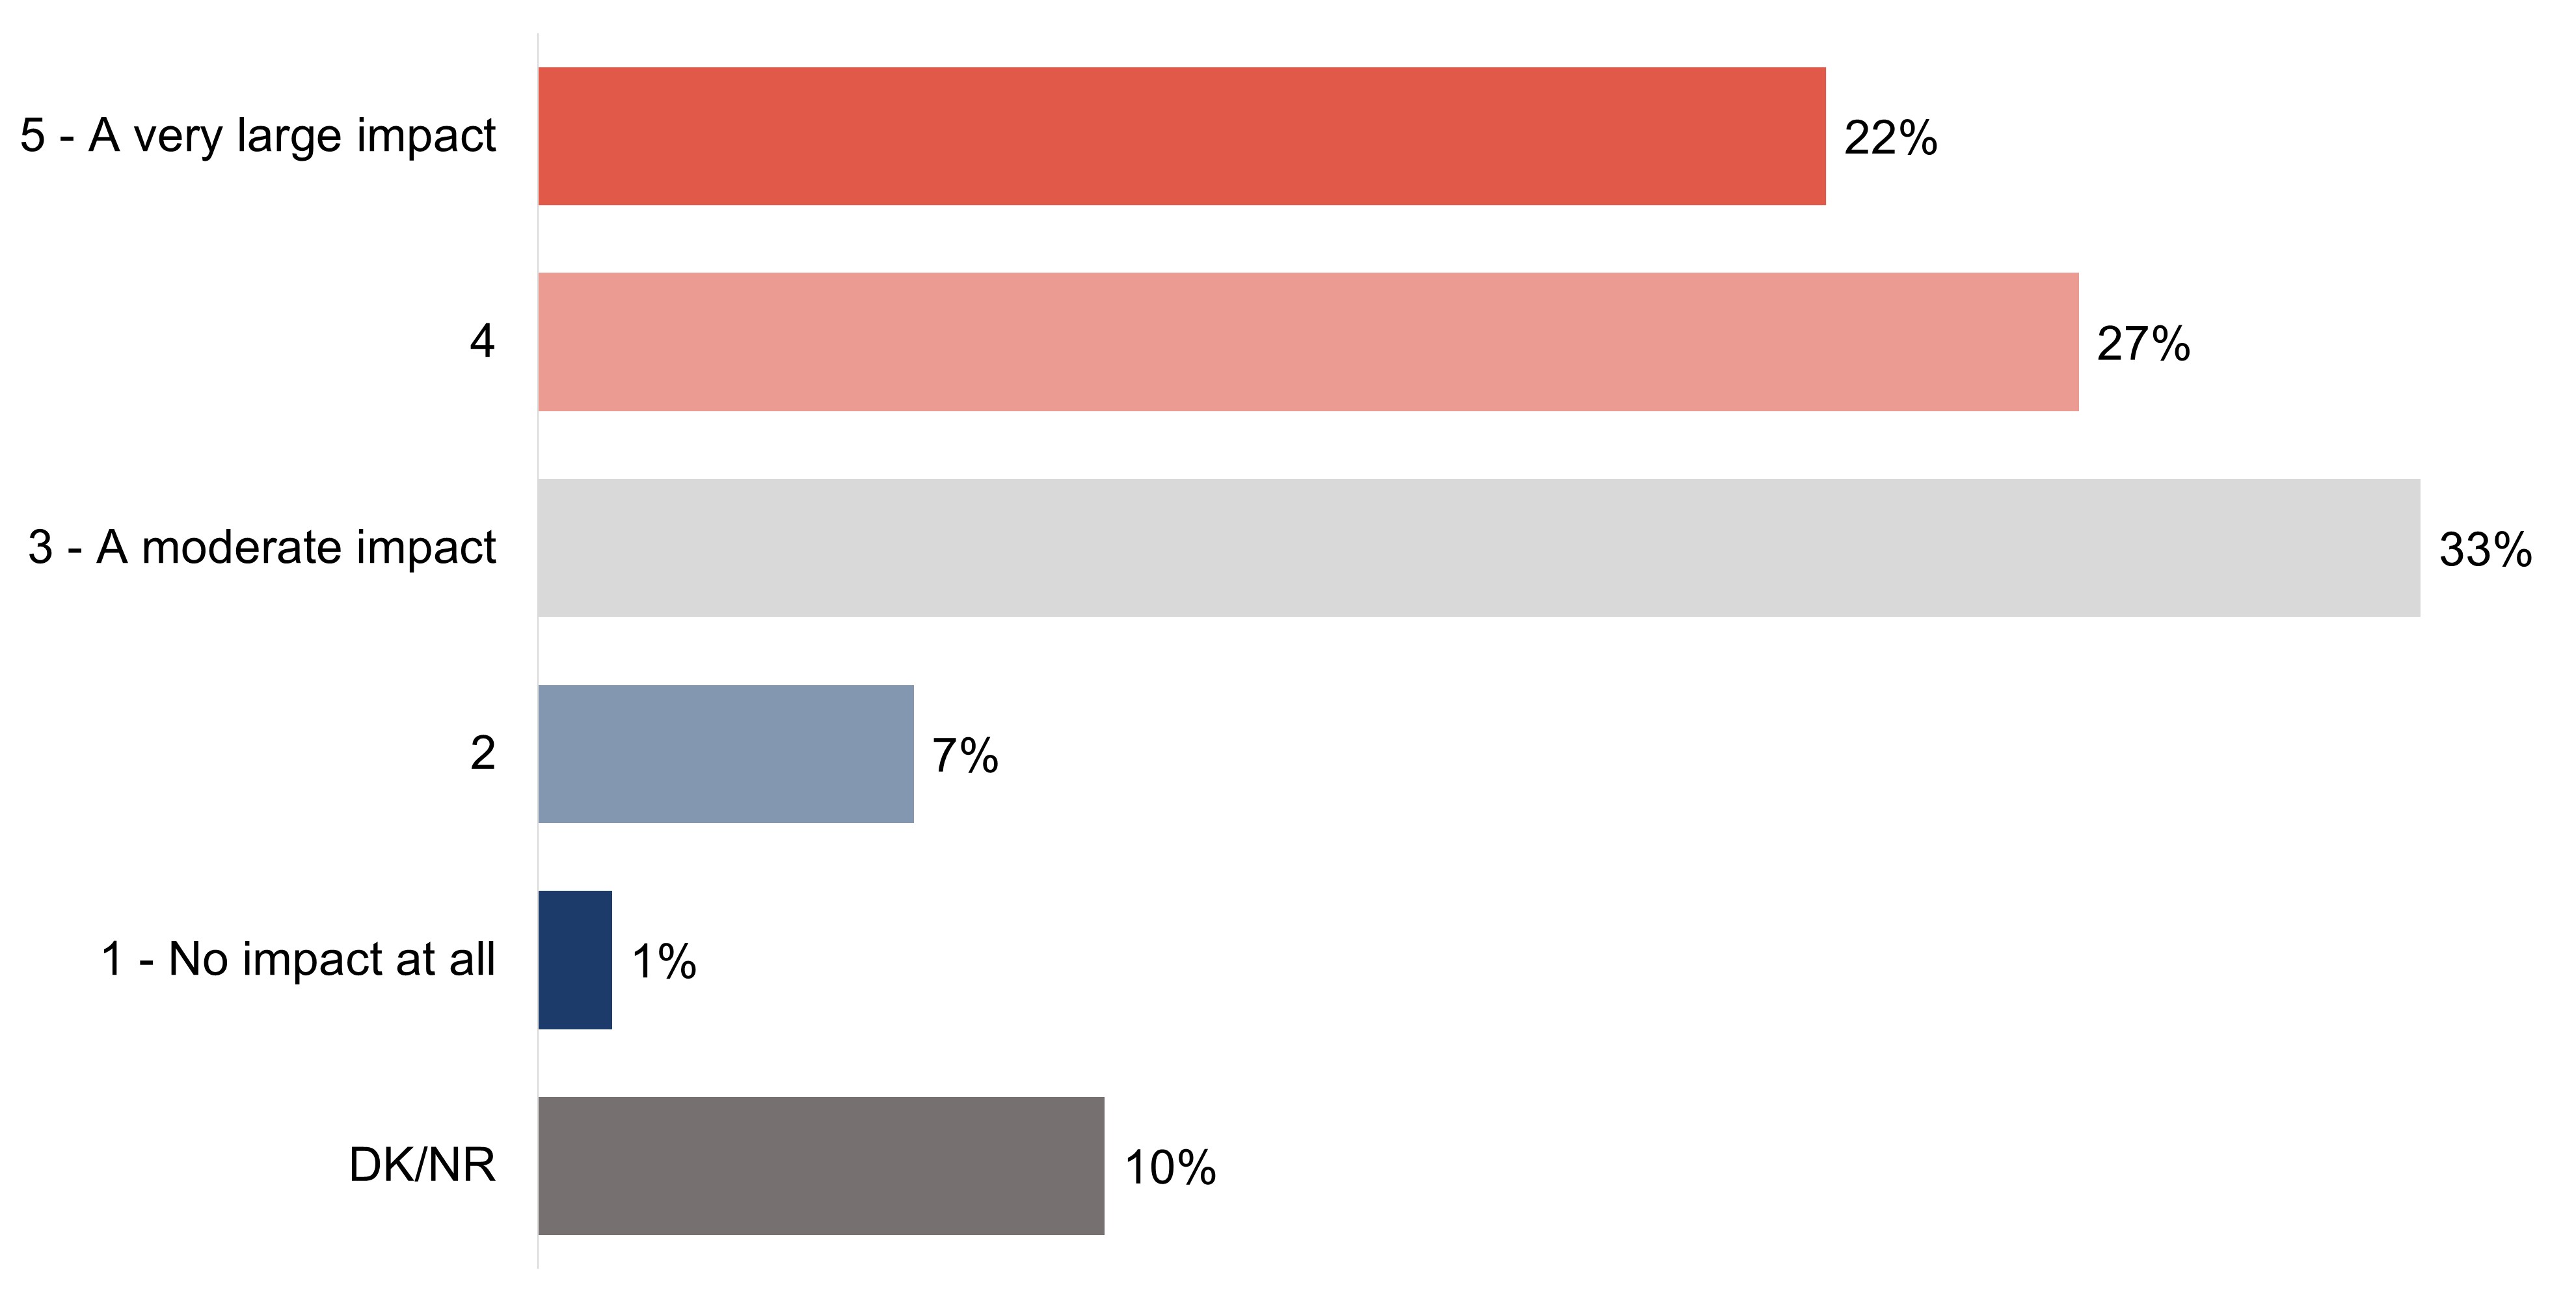
While knowledge of dementia varied, impressions of its impact in Canada do not. Nearly half (49%) of respondents believe that dementia has a large impact on Canada today (rating of four or five), while one-third (33%) say it has a moderate impact. Fewer (8%) believe dementia is having little or no impact in Canada today (rating of one or two) and the remaining 10% are unsure of dementia's impact.
Exhibit A13: Q13: On a scale of 1 to 5 where 1 means no impact at all, 3 means a moderate impact and 5 means a very large impact, overall, how much of an impact do you think dementia is having in Canada today?
Base: All respondents (n=6,049).
Figure 13.Figure 13 - Text description
5 - A very large impact
22%
4
27%
3 - A moderate impact
33%
2
7%
1 - No impact at all
1%
DK/NR
10%
Key demographic differences for the target audiences for this research are shown in the charts below:
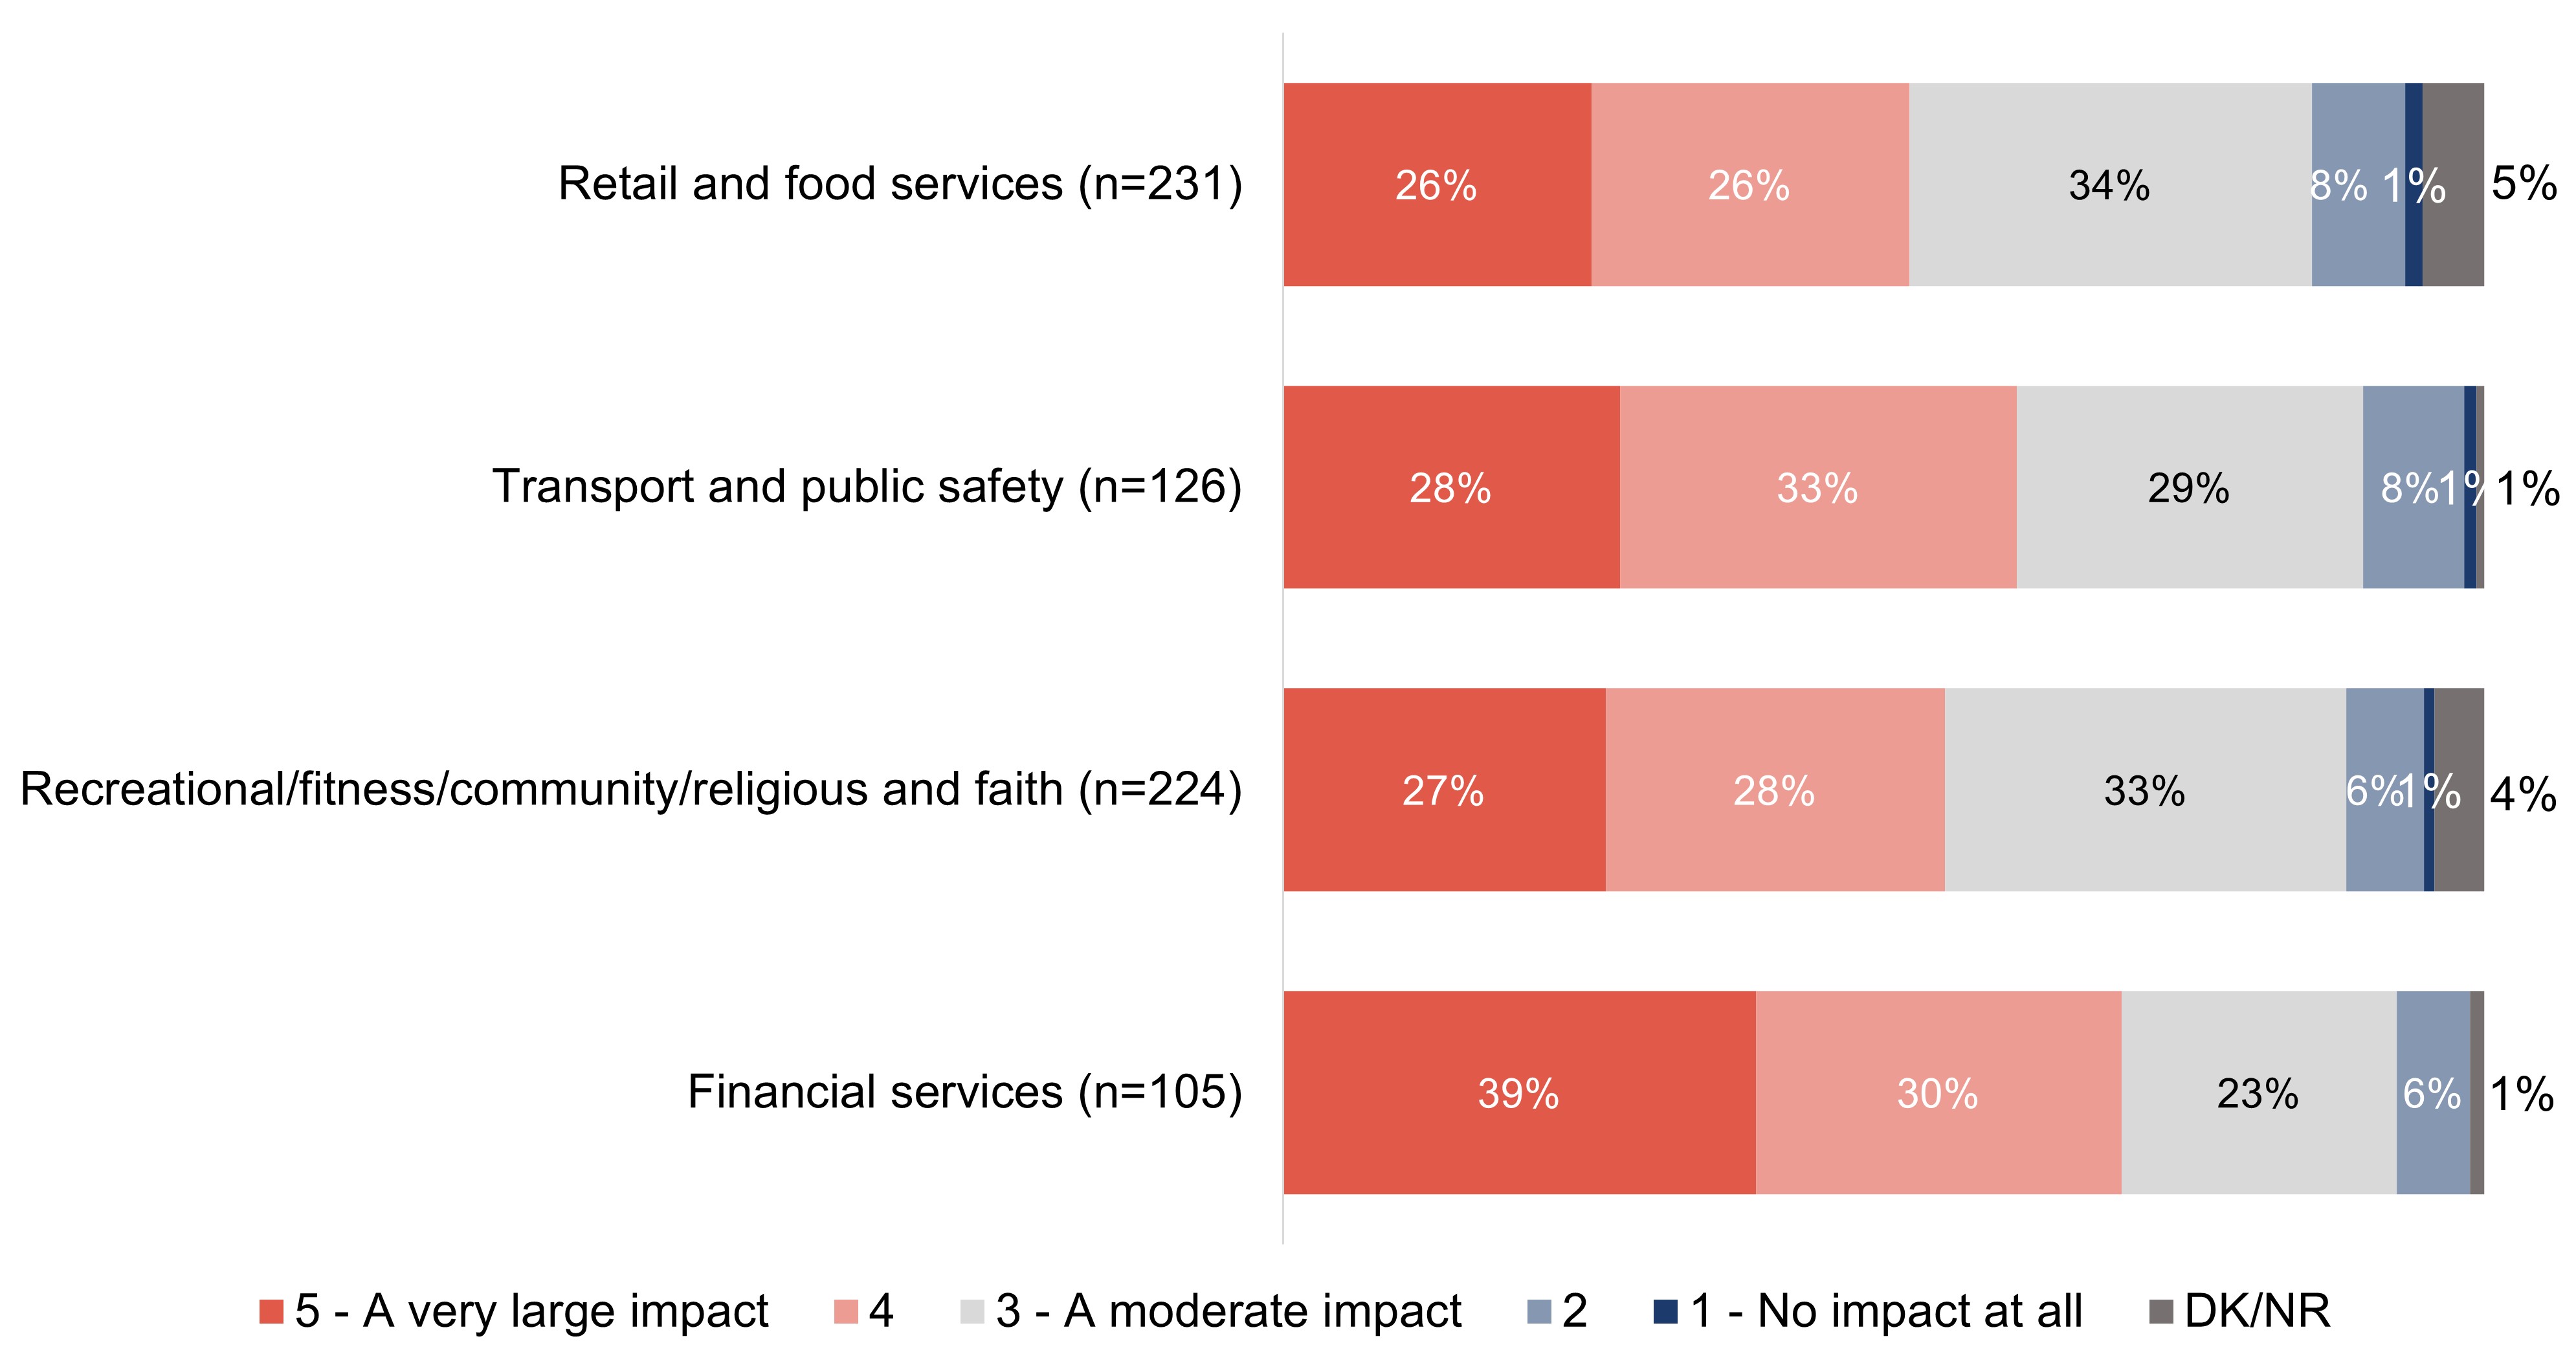
Nearly all respondents who work in financial services (at 93%) believe that dementia is having at least a moderate impact in Canada today, including two in five (39%) who say it has a very large impact. Similar proportions of respondents who work in transport and public safety (61%), recreational, fitness, community and religious or faith organizations (55%), and retail and food services (52%) feel that dementia is having a large impact in Canada today.
Exhibit A14: Q13: On a scale of 1 to 5 where 1 means no impact at all, 3 means a moderate impact and 5 means a very large impact, overall, how much of an impact do you think dementia is having in Canada today?
Base: All respondents.
Figure 14.Figure 14 - Text description
Column %
Retail and food services (n=231)
Transport and public safety (n=126)
Recreational/fitness/community/religious and faith (n=224)
Financial services (n=105)
5 - A very large impact
26%
28%
27%
39%
4
26%
33%
28%
30%
3 - A moderate impact
34%
29%
33%
23%
2
8%
8%
6%
6%
1 - No impact at all
1%
1%
1%
0%
DK/NR
5%
1%
4%
1%
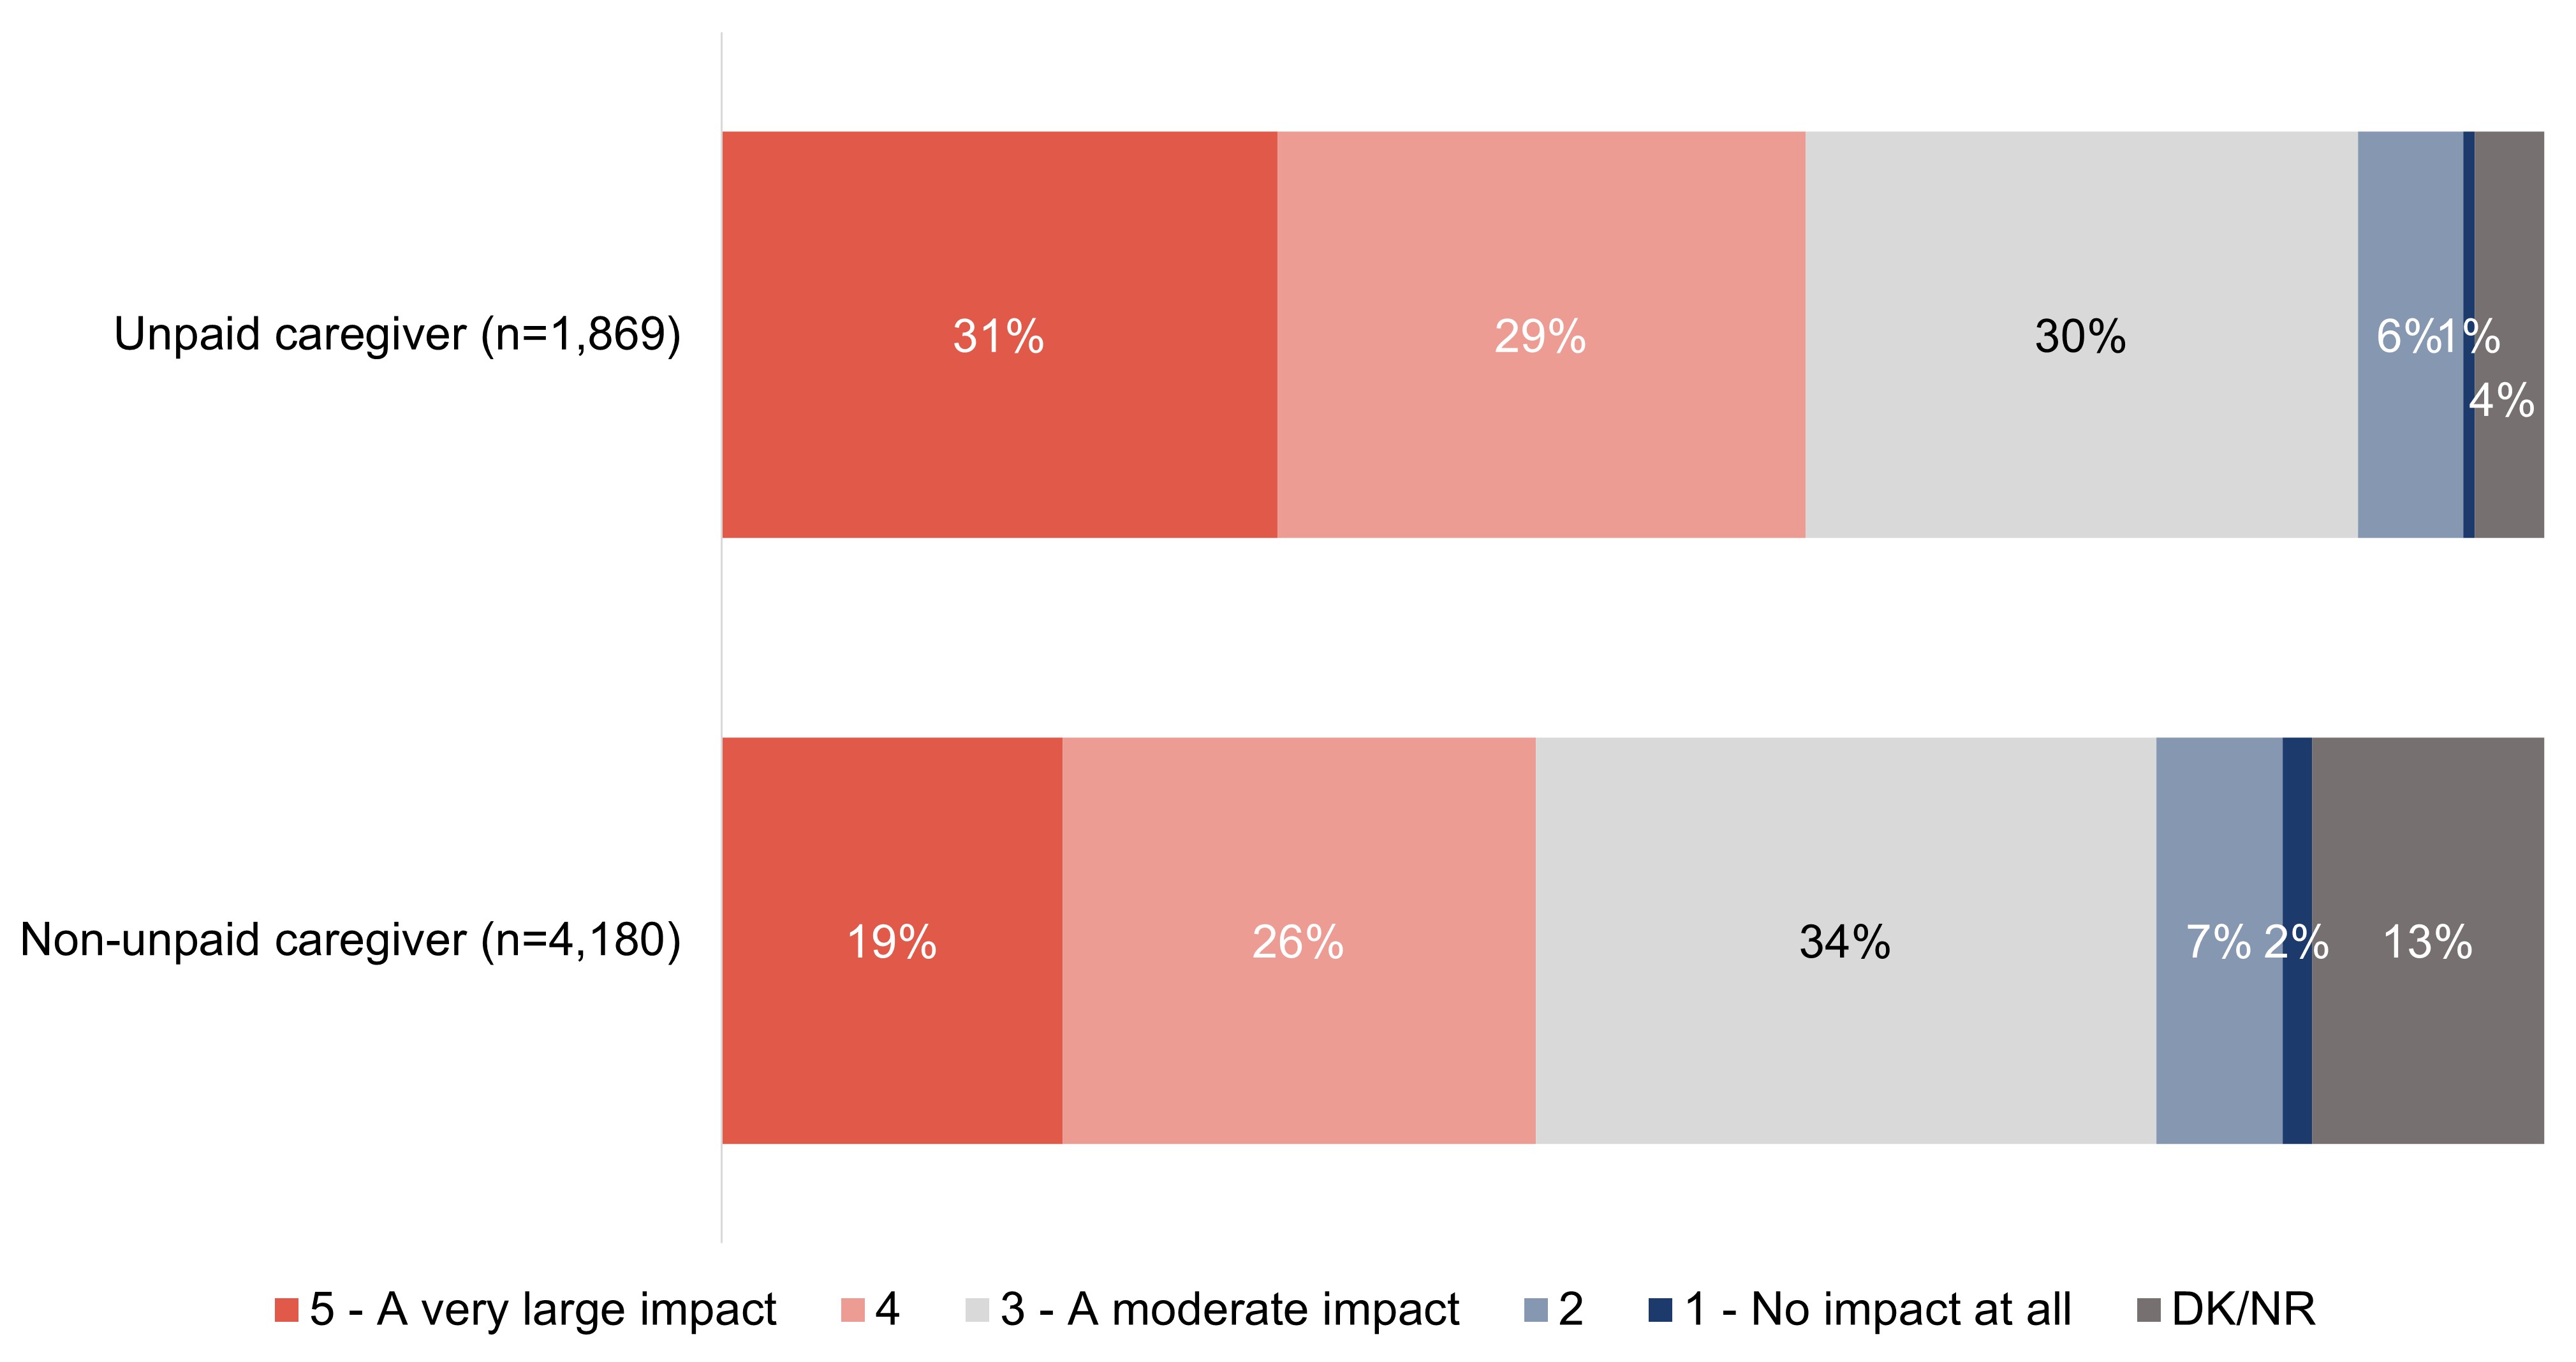
Nearly three in five (59%) respondents who are unpaid caregivers believe that dementia is having a large impact in Canada today, half of which classify that impact as 'very large'. While fewer respondents who are not unpaid caregivers say that dementia is having a large impact in Canada (45%), a similar number of respondents who are not unpaid caregivers believe dementia has little or no impact in Canada today as unpaid caregivers (9% versus 6% among unpaid caregivers).
Exhibit A15: Q13: On a scale of 1 to 5 where 1 means no impact at all, 3 means a moderate impact and 5 means a very large impact, overall, how much of an impact do you think dementia is having in Canada today?
Base: All respondents.
Figure 15. TitleFigure 15 - Text description
Column %
Unpaid caregiver (n=1,869)
Non-unpaid caregiver (n=4,180)
5 - A very large impact
31%
19%
4
29%
26%
3 - A moderate impact
30%
34%
2
6%
7%
1 - No impact at all
1%
2%
DK/NR
4%
13%
Other quantitative demographic differences include:
Gender
Those who identify as a woman (56%) are more likely than those who identify as a man (43%) to say that dementia is having a large impact in Canada.
Age
Respondents who are 55 to 64 years (54%) and 65 years or older (57%) are more likely than those 18 to 34 years (43%) and 35 to 54 years (46%), to say that dementia is having a large impact in Canada.
Region
At 56%, respondents in Atlantic Canada are the most likely to believe that dementia is having a large impact in Canada today.
Employment
Those who say they are retired are the most likely to feel that dementia is having a large impact in Canada (57%).
Size of community
Respondents who live in a rural or remote community (61%) are the most likely to say that dementia has a large impact in Canada.
Experience with dementia
Respondents are more likely than their counterparts to say that dementia is having a large impact in Canada today if they:
know a person living with dementia (58%);
have/had a work (63%) or volunteer (57%) role where they interact with people living with dementia;
interact with people living with dementia more than monthly (58%) or weekly (67%);
say they are knowledgeable of dementia (73%);
say they are comfortable interacting with people living with dementia (62%);
are aware of dementia-inclusive communities (61%); or,
feel that communities should prioritize becoming dementia-inclusive (62%).
Section A3: Personal perceptions of dementia
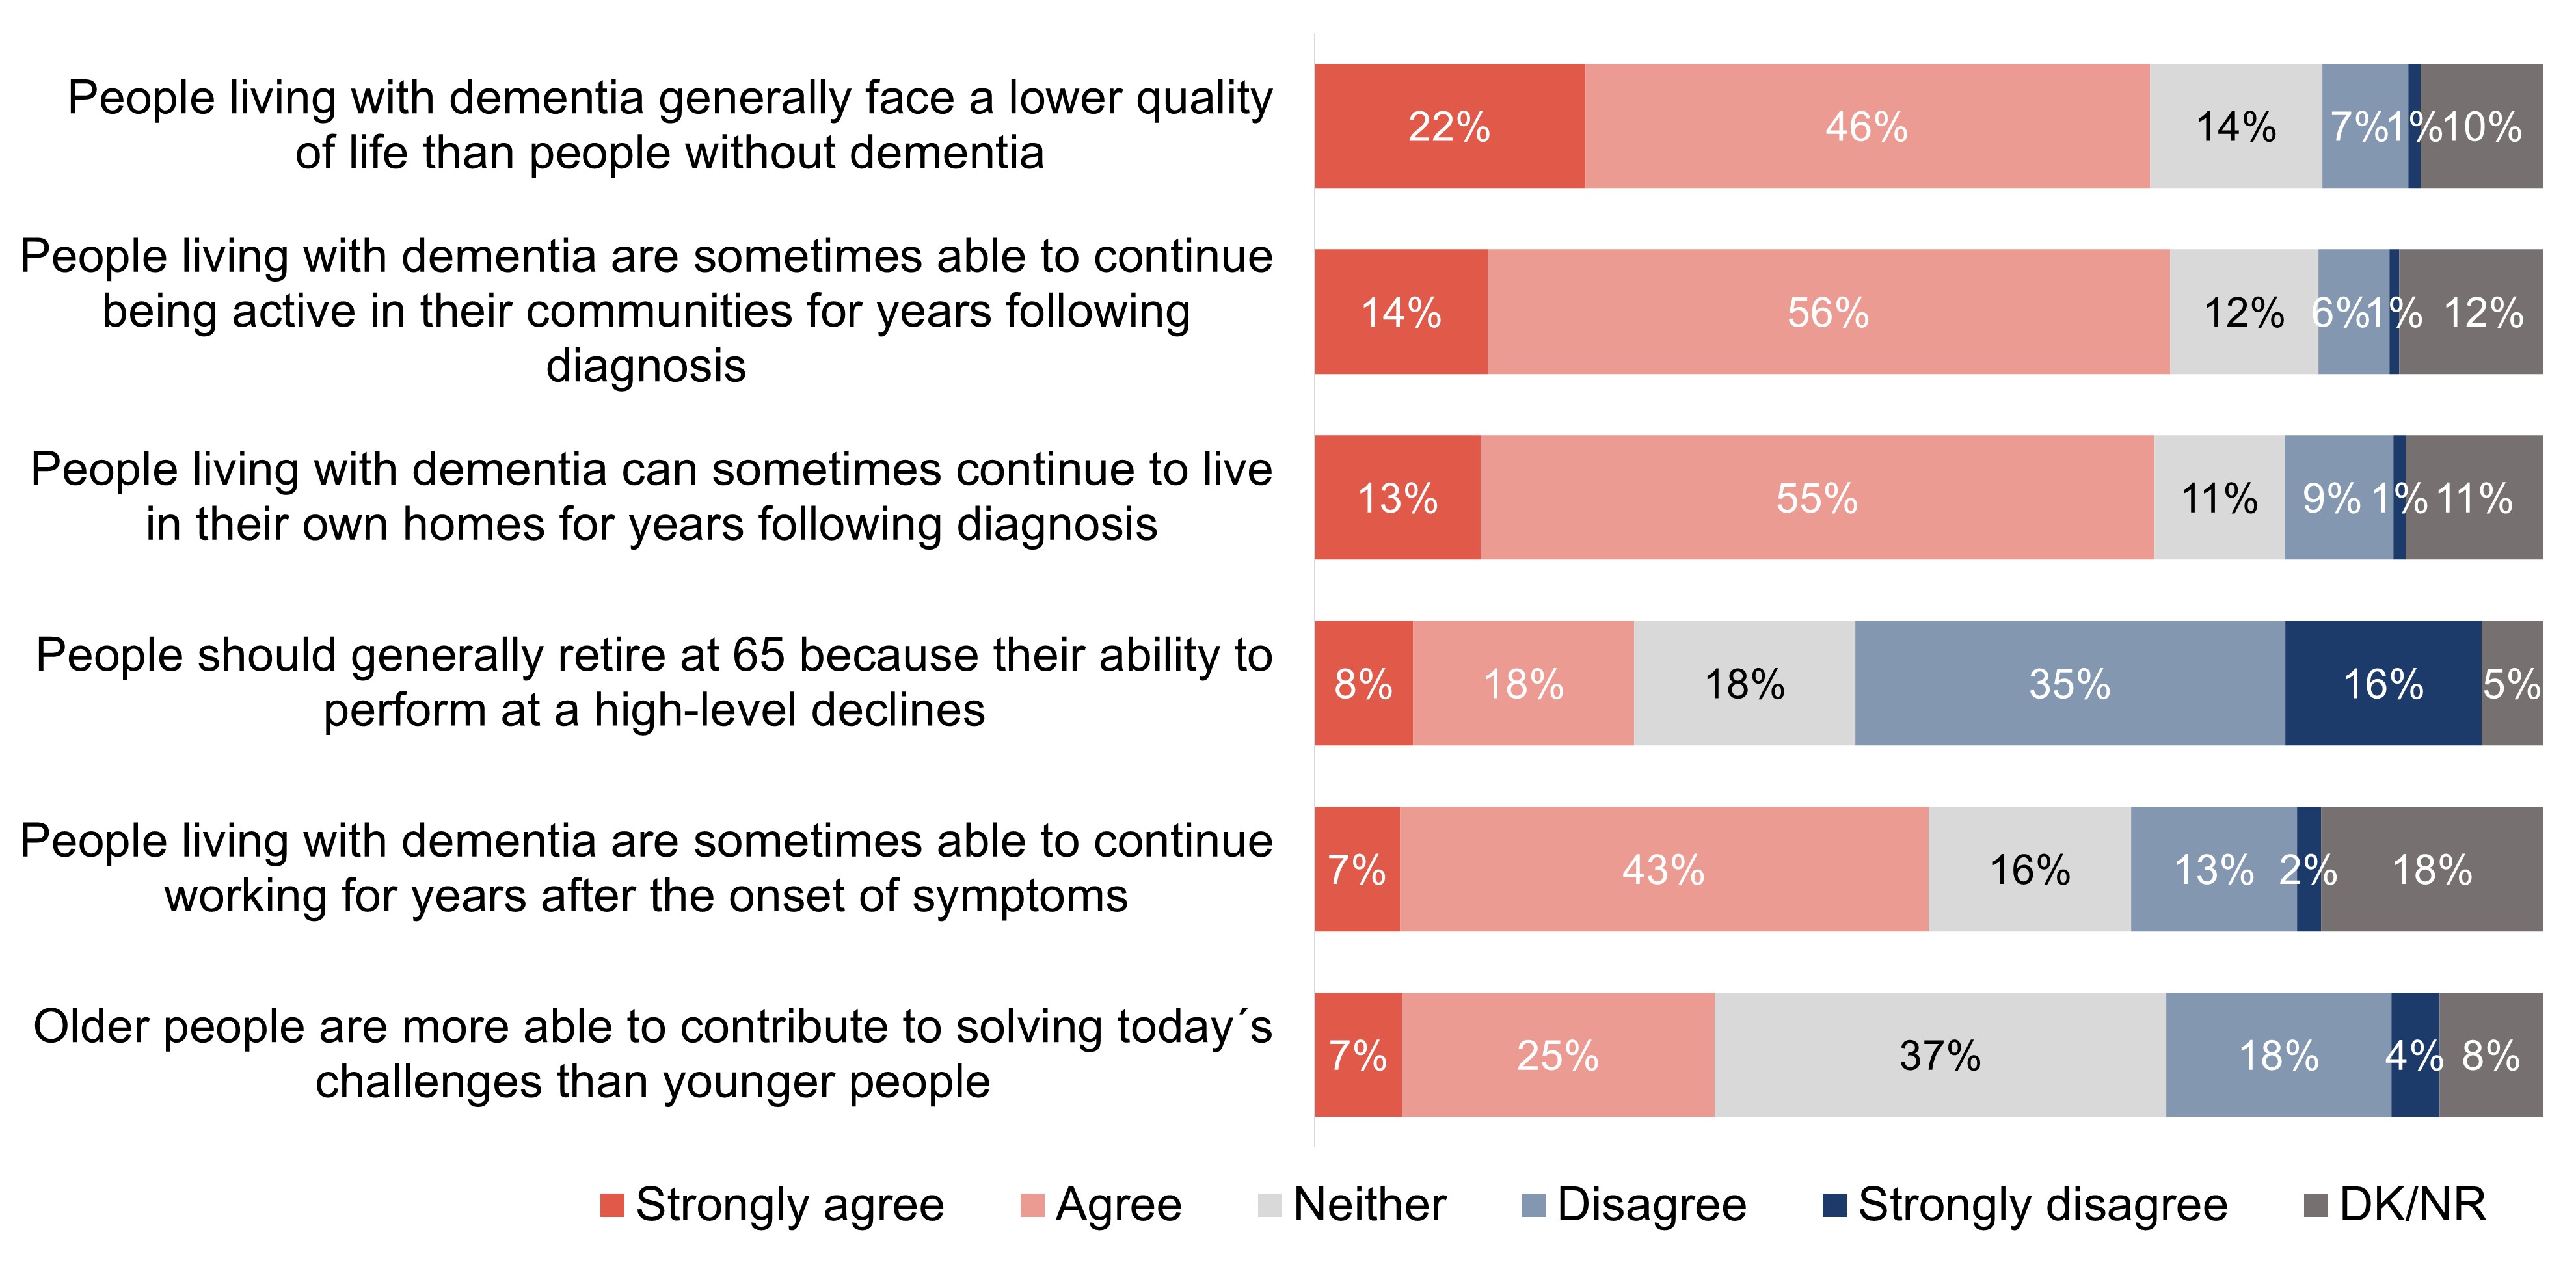
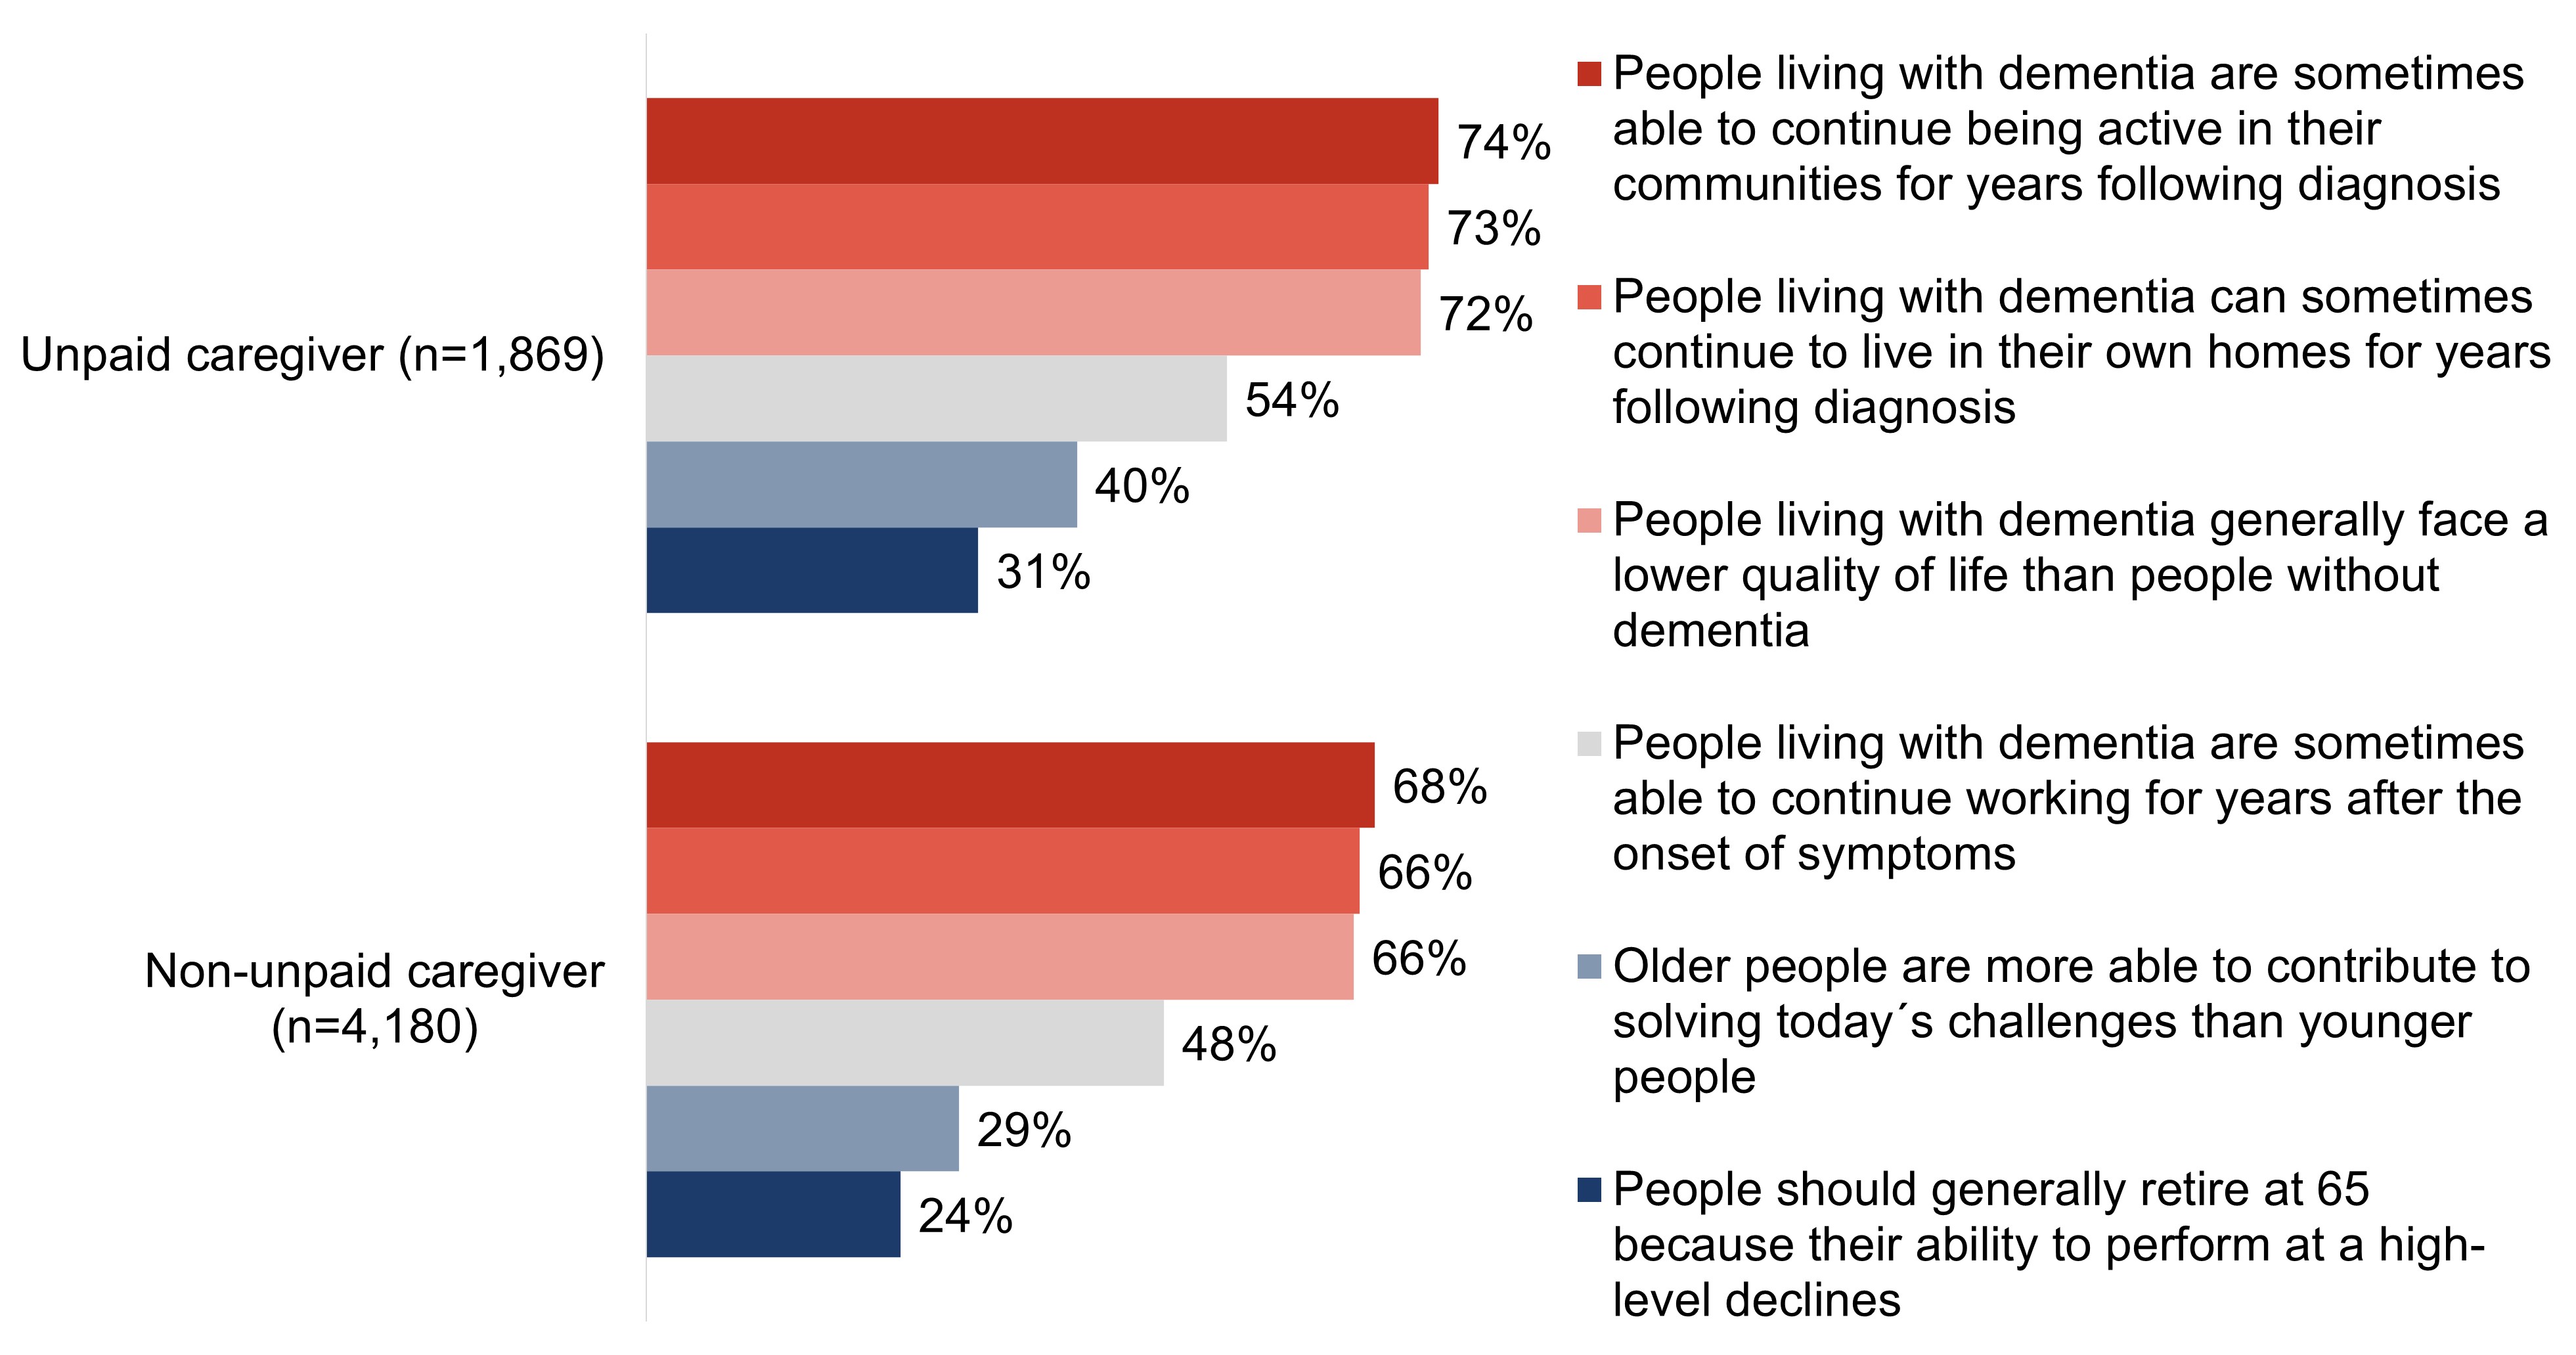
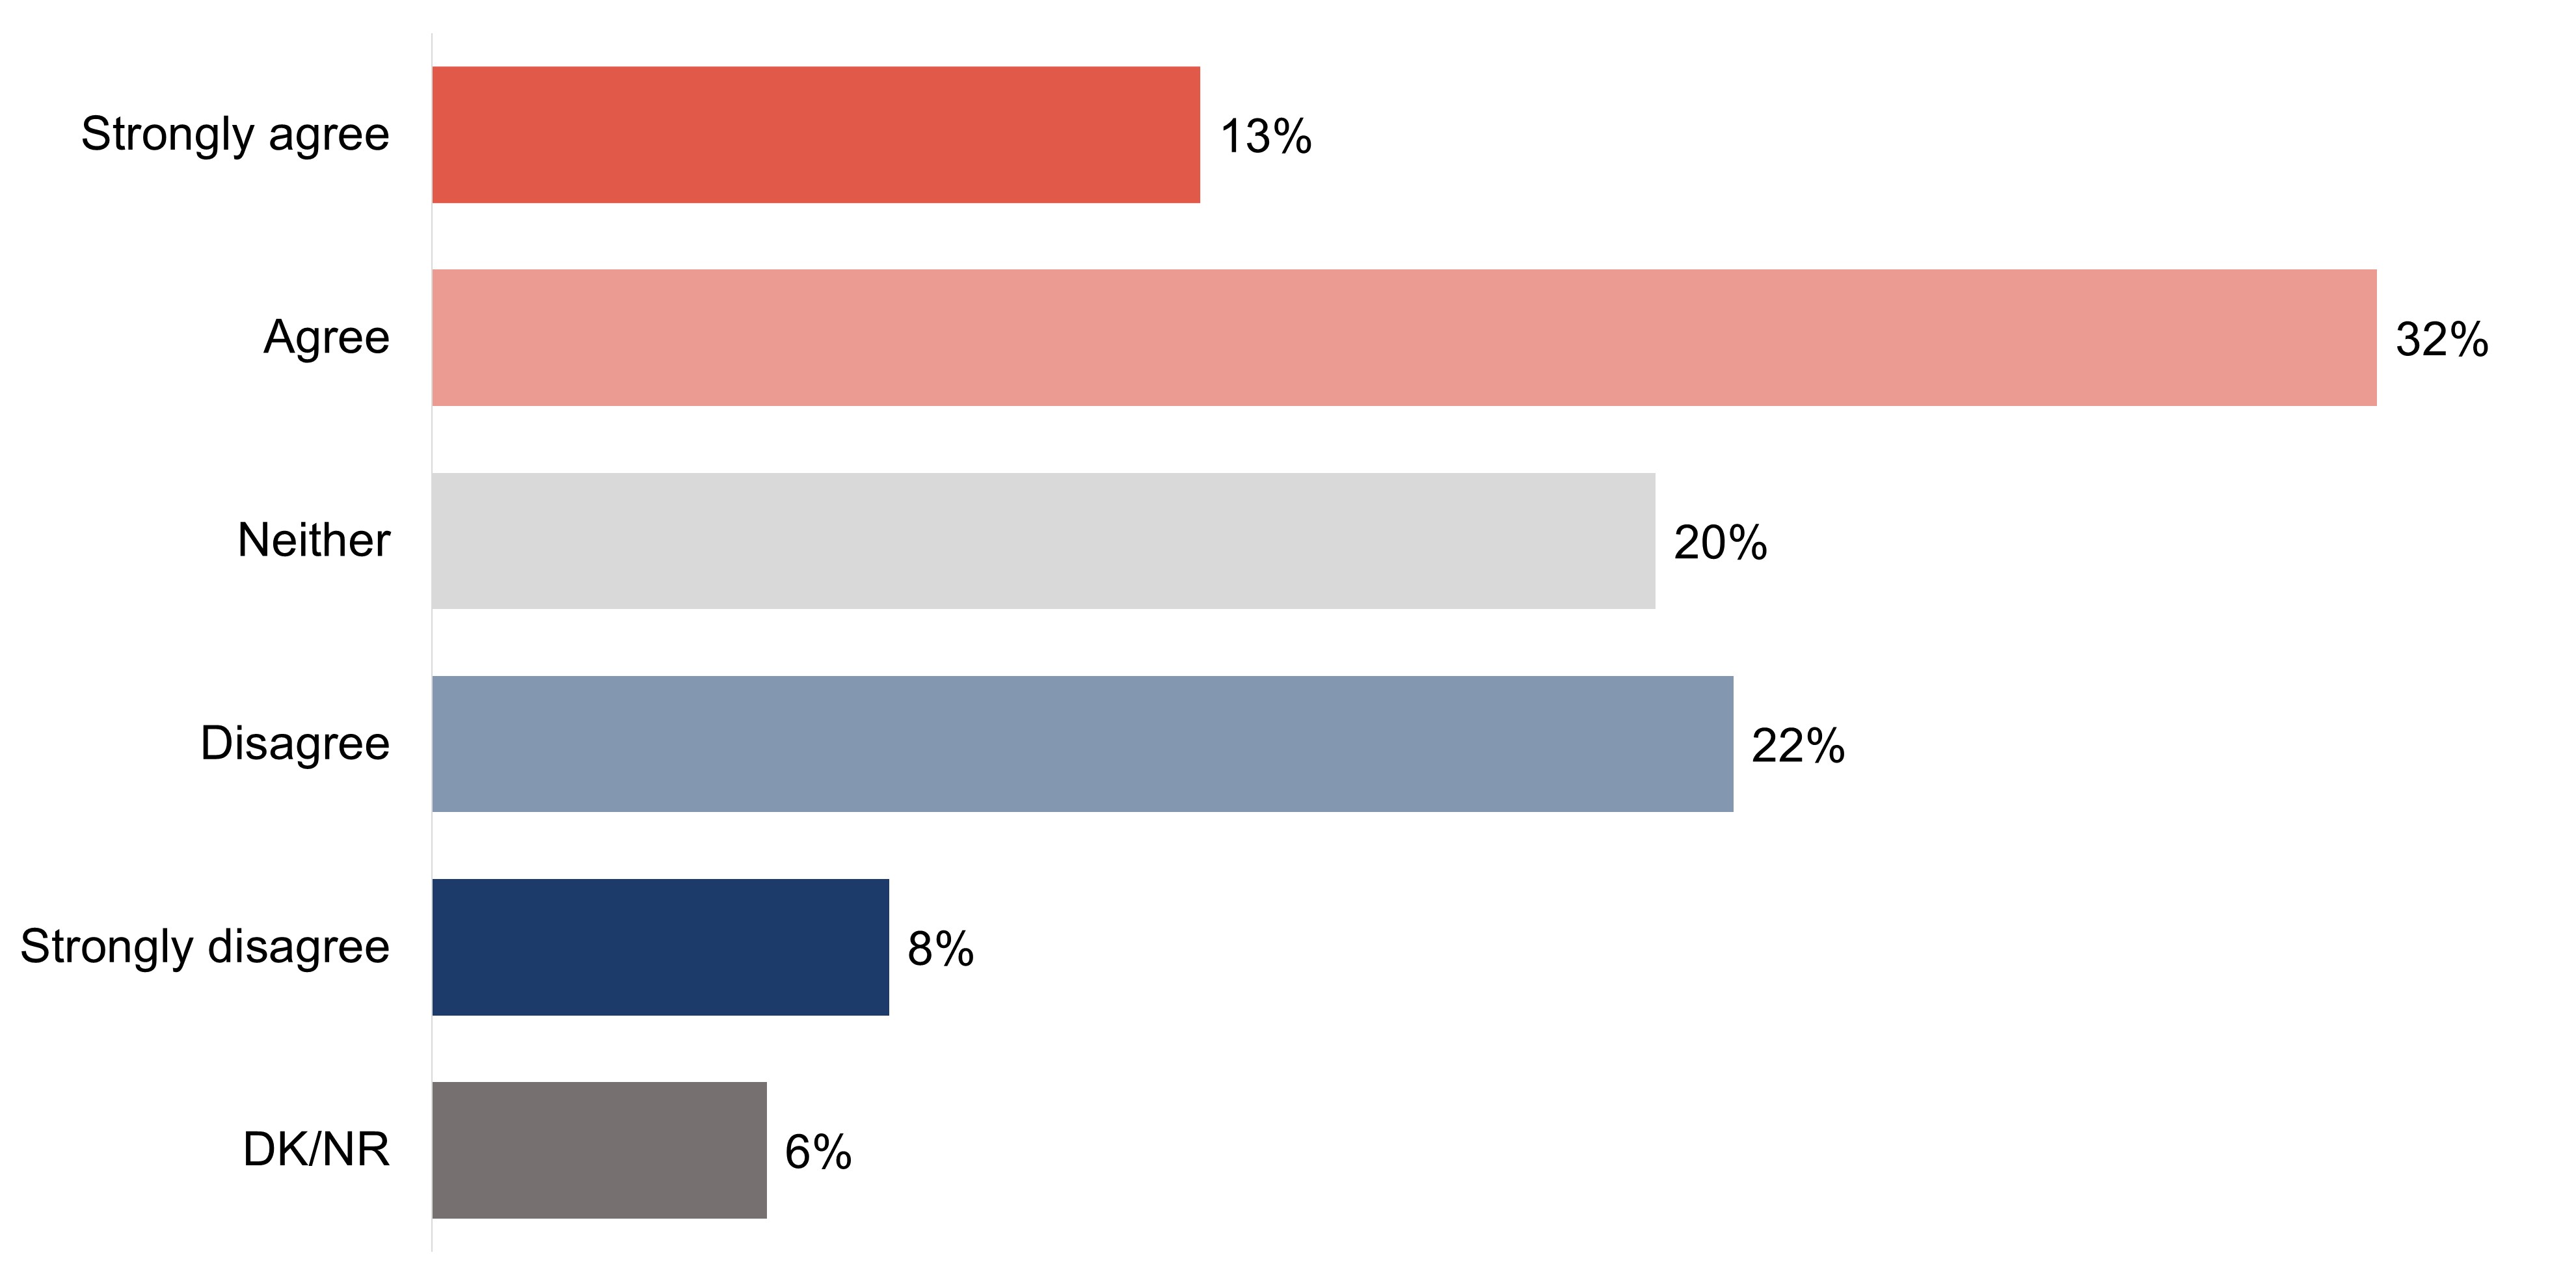
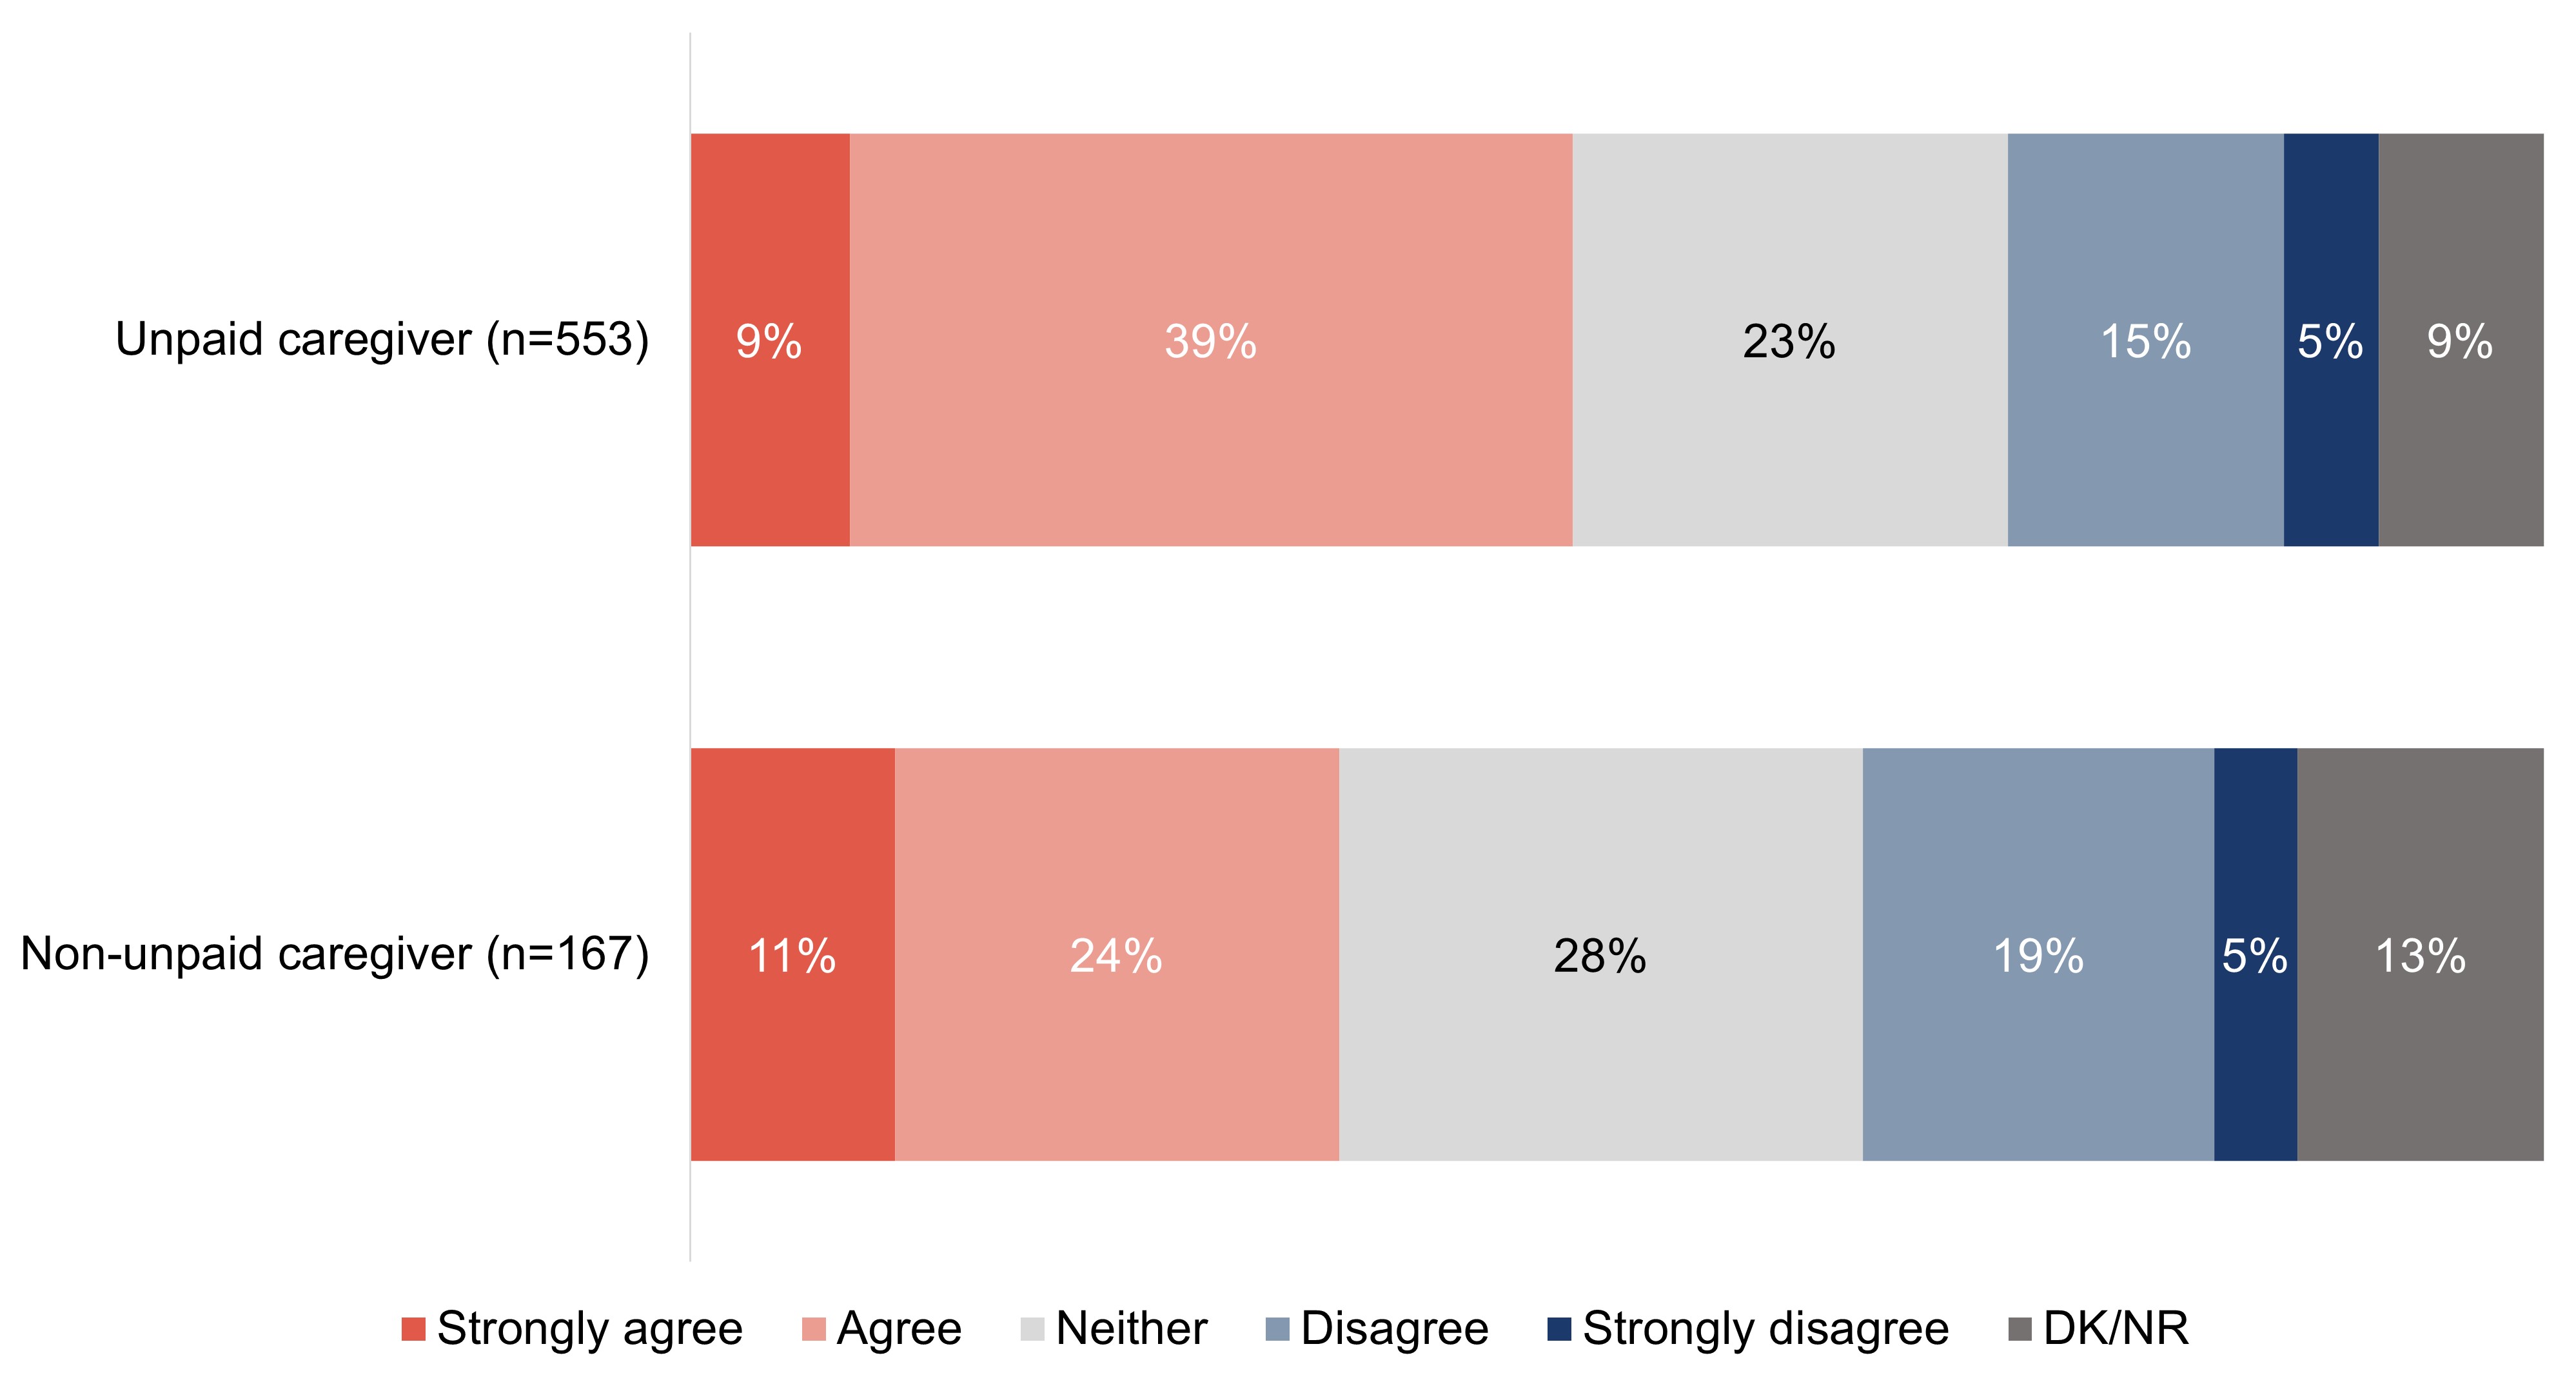
In order to assess the attitudes of Canadians regarding dementia, including the role of stigma, a variety of statements were shown to respondents, and they were asked to say how much they agreed with each on a five-point scale. A majority agree or strongly agree that people living with dementia are sometimes able to continue being active in their communities (70%), live in their own homes (68%) and continue to work for years (50%). One-third (33%) agree that older people are more able to contribute to solving today's challenges than younger people. Conversely, a strong majority agree or strongly agree that people living with dementia generally face a lower quality of life than people without dementia (68%). Over one-quarter (26%) agree or strongly agree that people should retire at 65 due to decreases in their ability to perform.
Exhibit A16: Q14: To what extent do you agree or disagree with the following statements?
Base: All respondents (n=6,049).
Figure 16. TitleFigure 16 - Text description
Row %
Strongly agree
Agree
Neither
Disagree
Strongly disagree
DK/NR
People living with dementia generally face a lower quality of life than people without dementia
22%
46%
14%
7%
1%
10%
People living with dementia are sometimes able to continue being active in their communities for years following diagnosis
14%
56%
12%
6%
1%
12%
People living with dementia can sometimes continue to live in their own homes for years following diagnosis
13%
55%
11%
9%
1%
11%
People should generally retire at 65 because their ability to perform at a high-level declines
8%
18%
18%
35%
16%
5%
People living with dementia are sometimes able to continue working for years after the onset of symptoms
7%
43%
16%
13%
2%
18%
Older people are more able to contribute to solving today´s challenges than younger people
7%
25%
37%
18%
4%
8%
Key demographic differences for the target audiences for this research are shown in the chart below:
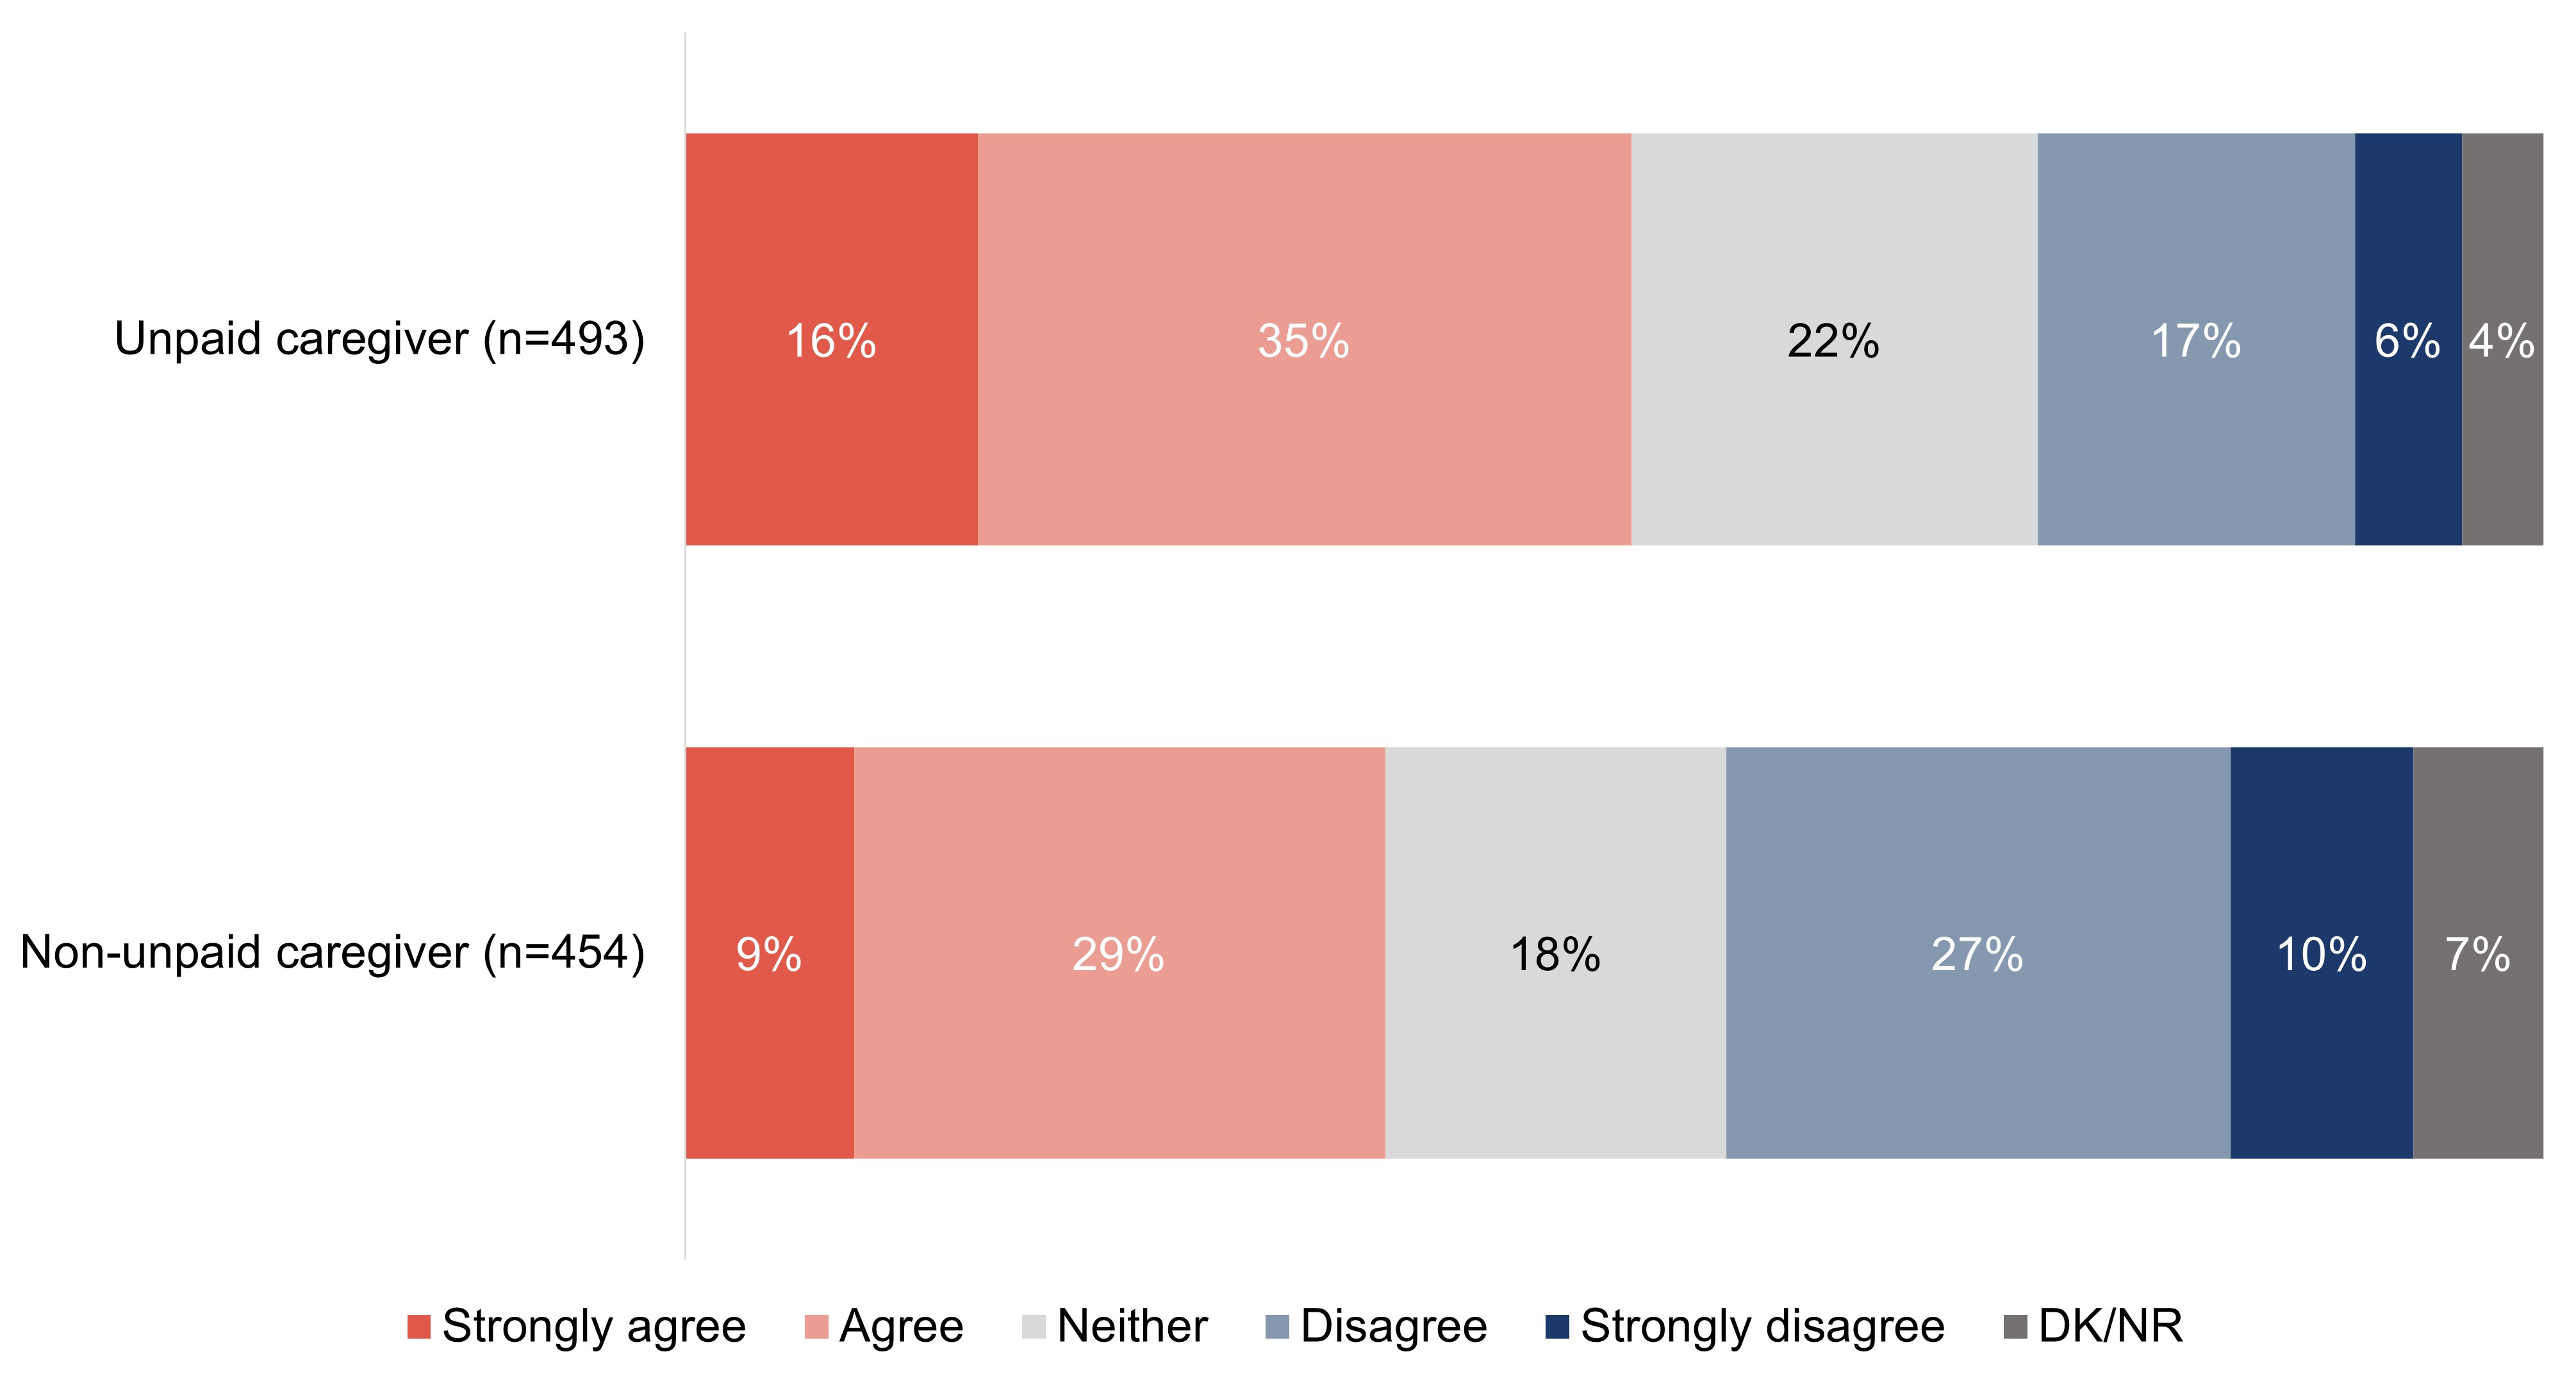
For each of the statements related to attitude that were shared with respondents, unpaid caregivers are more likely to agree than those who are not unpaid caregivers.
Exhibit A17: Q14: To what extent do you agree or disagree with the following statements?
Base: All respondents. Percent "strongly agree" and "agree".
Figure 17. TitleFigure 17 - Text description
Column %
Unpaid caregiver (n=1,869)
Non-unpaid caregiver (n=4,180)
People living with dementia are sometimes able to continue being active in their communities for years following diagnosis
74%
68%
People living with dementia can sometimes continue to live in their own homes for years following diagnosis
73%
66%
People living with dementia generally face a lower quality of life than people without dementia
72%
66%
People living with dementia are sometimes able to continue working for years after the onset of symptoms
54%
48%
Older people are more able to contribute to solving today´s challenges than younger people
40%
29%
People should generally retire at 65 because their ability to perform at a high-level declines
31%
24%
Other quantitative demographic differences include:
Gender
Those who identify as a man are more likely than those who identify as a woman to agree that people living with dementia are sometimes able to continue working for years after the onset symptoms (53% versus 48%) but are also more likely to agree that people should generally retire at 65 because their ability to perform at a high-level declines (30% versus 22%).
Age
Respondents between the ages of 18 to 34 years (26%) are the least likely to agree that older people are more able to contribute to solving today's challenges than younger people, and the most likely to agree that people should generally retire at 65 because their ability to perform at a high-level decline (41%).
Region
Those who live in Quebec are the least likely agree that people living with dementia are sometimes able to continue being active in their communities for years following diagnosis (59%) and can sometimes continue to live in their own homes for years following diagnosis (56%); whereas respondents in the Territories are the most likely agree that people living with dementia are sometimes able to continue being active in their communities (84%).
Education
Respondents who have a high school education or lower are the least likely to agree with the majority of the statements, except that older people are more able to contribute to solving today's challenges than younger people (38%) and people should generally retire at 65 because their ability to perform at a high-level declines (28%) where they are the most likely to agree.
Income
Those who have a household income of under $60,000 are the least likely to agree with the majority of the statements, except that older people are more able to contribute to solving today's challenges than younger people (38%) and people should generally retire at 65 because their ability to perform at a high-level declines (29%) where they are the most likely to agree.
Language
English speaking respondents are more likely than those who speak French to agree with all of the provided statements, except "People living with dementia generally face a lower quality of life than people without dementia" (69% and 67%, respectively) and "People should generally retire at 65 because their ability to perform at a high-level declines" (25% for both), where the responses are statistically similar between both groups of respondents.
Size of community
Respondents who live in medium or large urban areas (31%) are less likely than those who live in small urban areas (36%) and rural/remote areas (39%) to agree that older people are more able to contribute to solving today's challenges than younger people.
Qualitative insights
The quality of life for persons living with dementia was rarely described in positive terms among focus group participants. Participants spoke of a life of mild frustration, confusion, or limitation, and a life where a person may need to live a very controlled life. They shared examples of some whose experience with dementia severely limited their capacity to participate in many of their past activities (for example, driving, and socializing). Furthermore, quality of life was also noted as dependent on the stage of the condition, but most had the sense that the advancement of the disease was inevitable, and the pace of advancement was unpredictable.
"At the start it comes and goes. So, it would be hard to not understand what you can and can't do. Especially because people with dementia are physically healthy." – Retail and food services; Atlantic Canada
"Depends on what stage of the dementia they are in. At the beginning they have a relatively normal life." – Transportation and public safety; West/Northern Canada
In addition to a perceived diminished quality of life for the person living with dementia, many participants offered, on an unaided basis, the perspective that loved ones and caretakers also experience a decrease in quality of life, in some cases more than the person living with dementia.
"Very poor [quality of life for the person living with dementia] though I've always seen it as harder on the family members." – Retail and food services; Ontario
These views appeared to be important context for the latter part of the group discussions; almost creating a barrier for the conversations about the feasibility of accommodating people living with dementia in the workplace and in their communities. When asked directly, participants rarely believed that a person living with dementia could remain active, such as working or staying involved in community activities, beyond the "early stages."
"From what I understand, people definitely lose a sense of independence. Their ability to stay active definitely decreases or gets eliminated altogether." – Transportation and public safety; Ontario
In addition to feasibility, participants were divided on whether people living with dementia could remain active in their normal lives (especially in the work context). This was the case among both those without close personal experience and those who had close personal experience with a person living with dementia. Many who had personal experience coloured their impressions (usually negatively) by their singular experiences, while others appeared to have become more informed and educated on the complexities of the disease in general and could see the benefits of keeping the person living with dementia active for as long as possible.
"Depends on age and life stage, but I think it's important [they continue to work]." – Financial services; West/Northern Canada
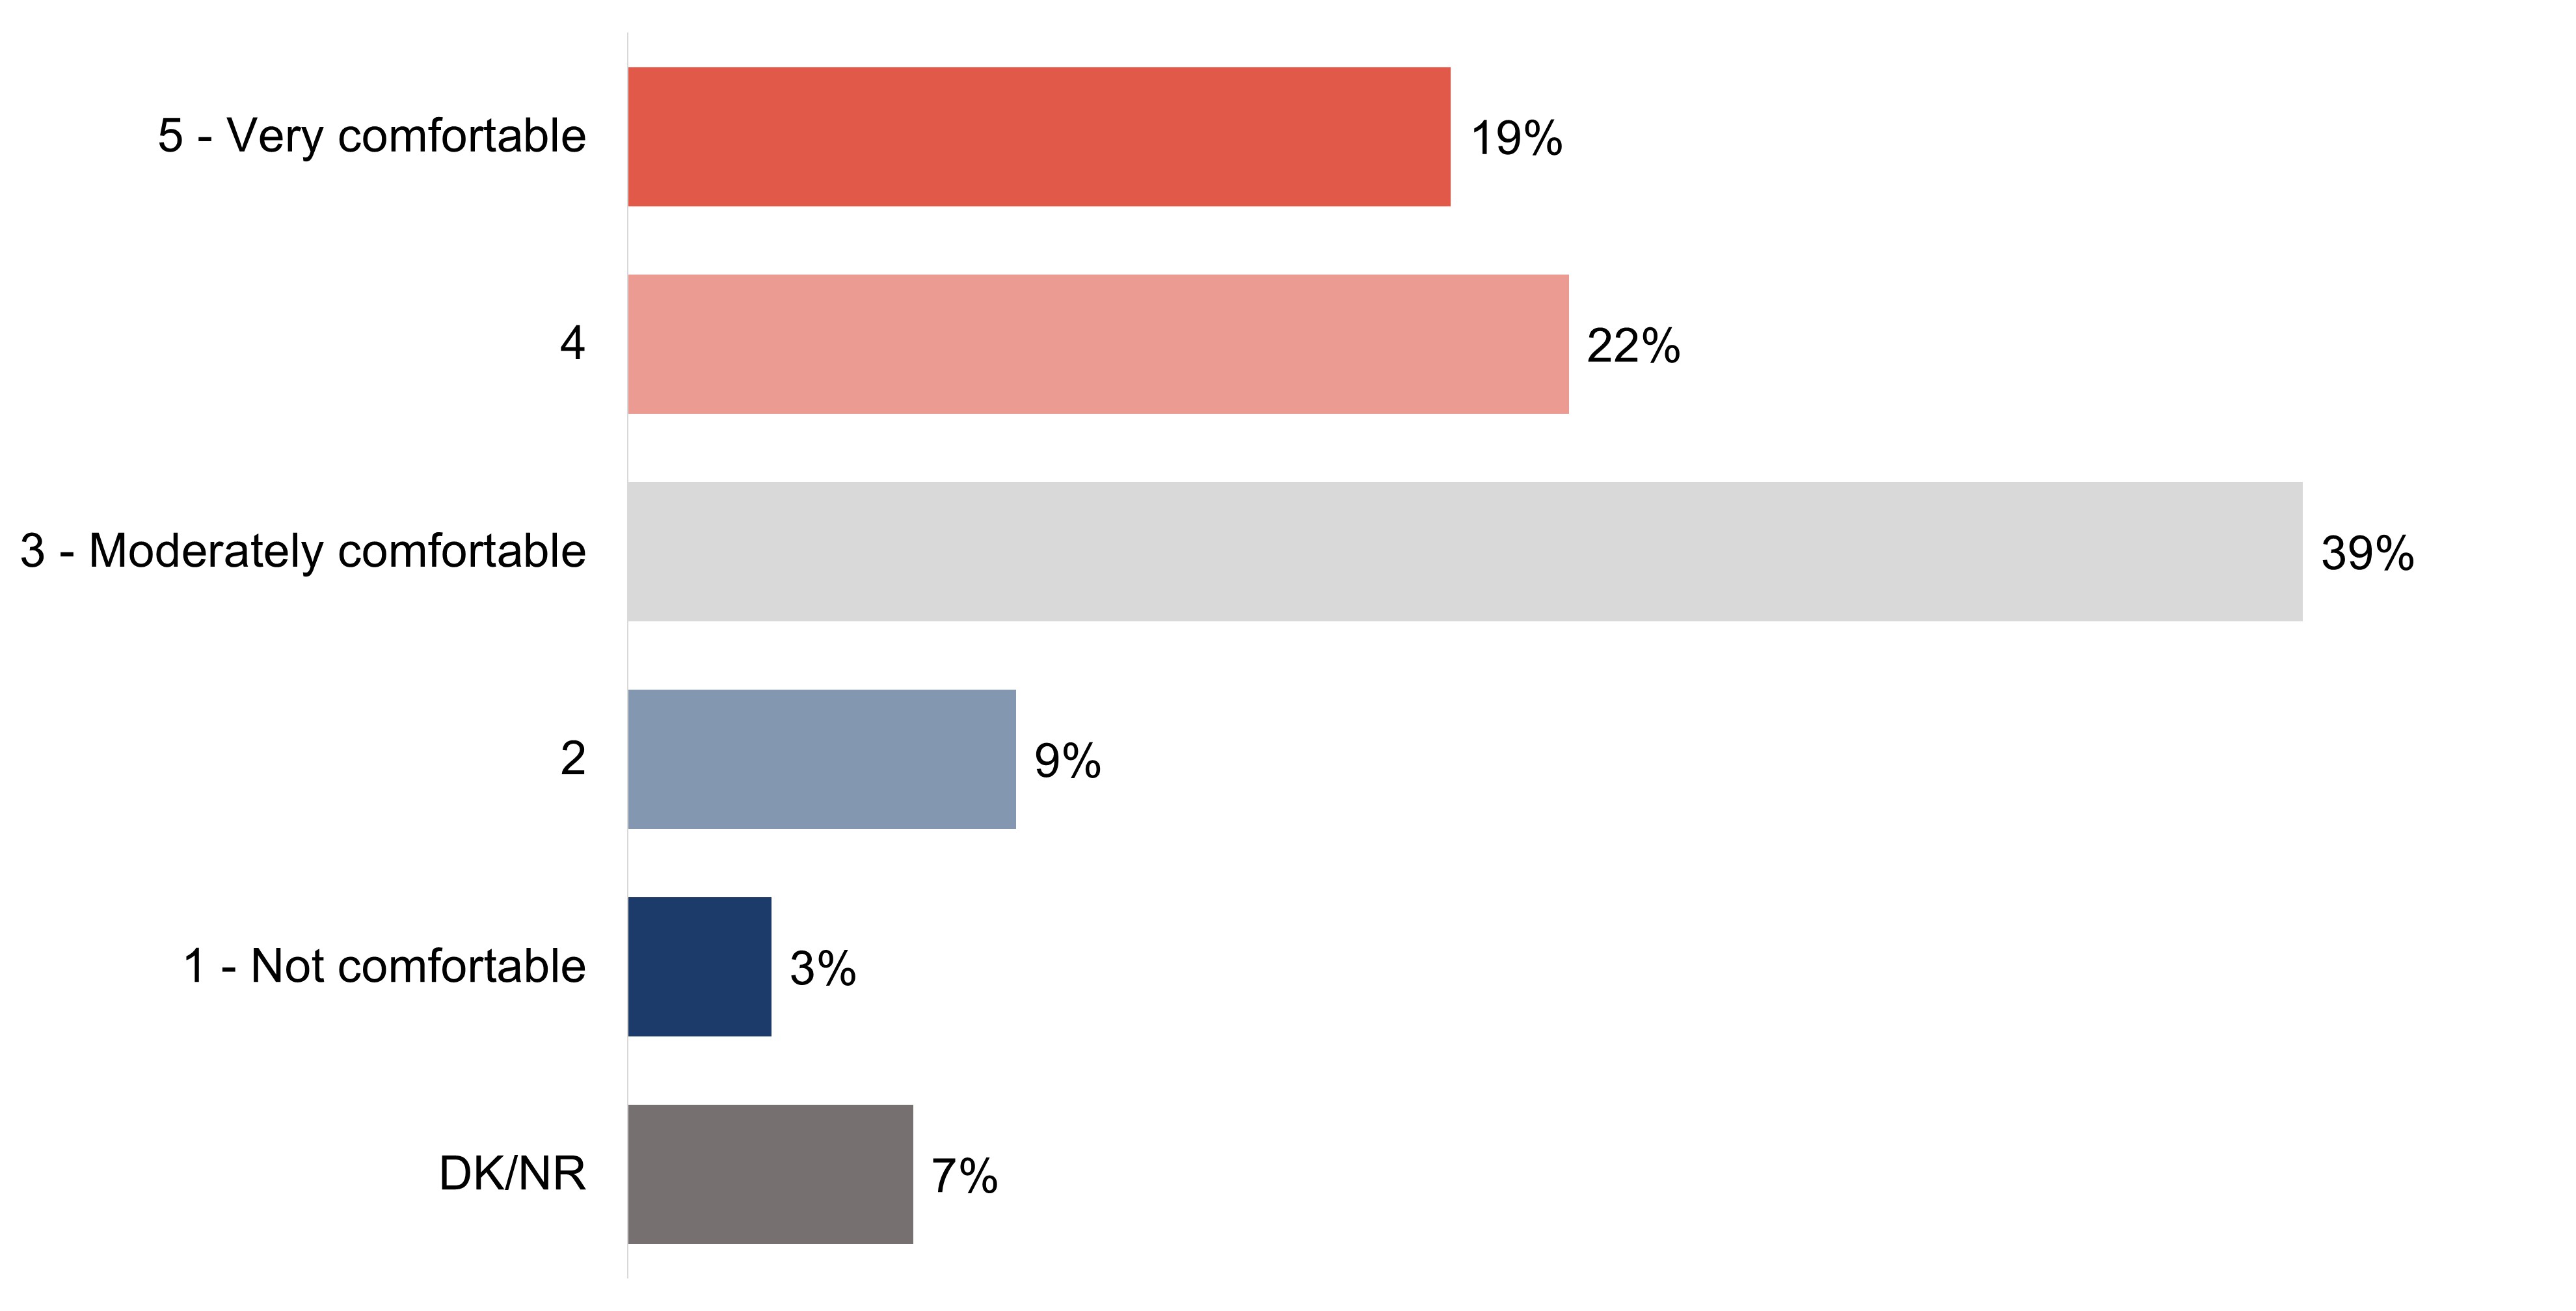
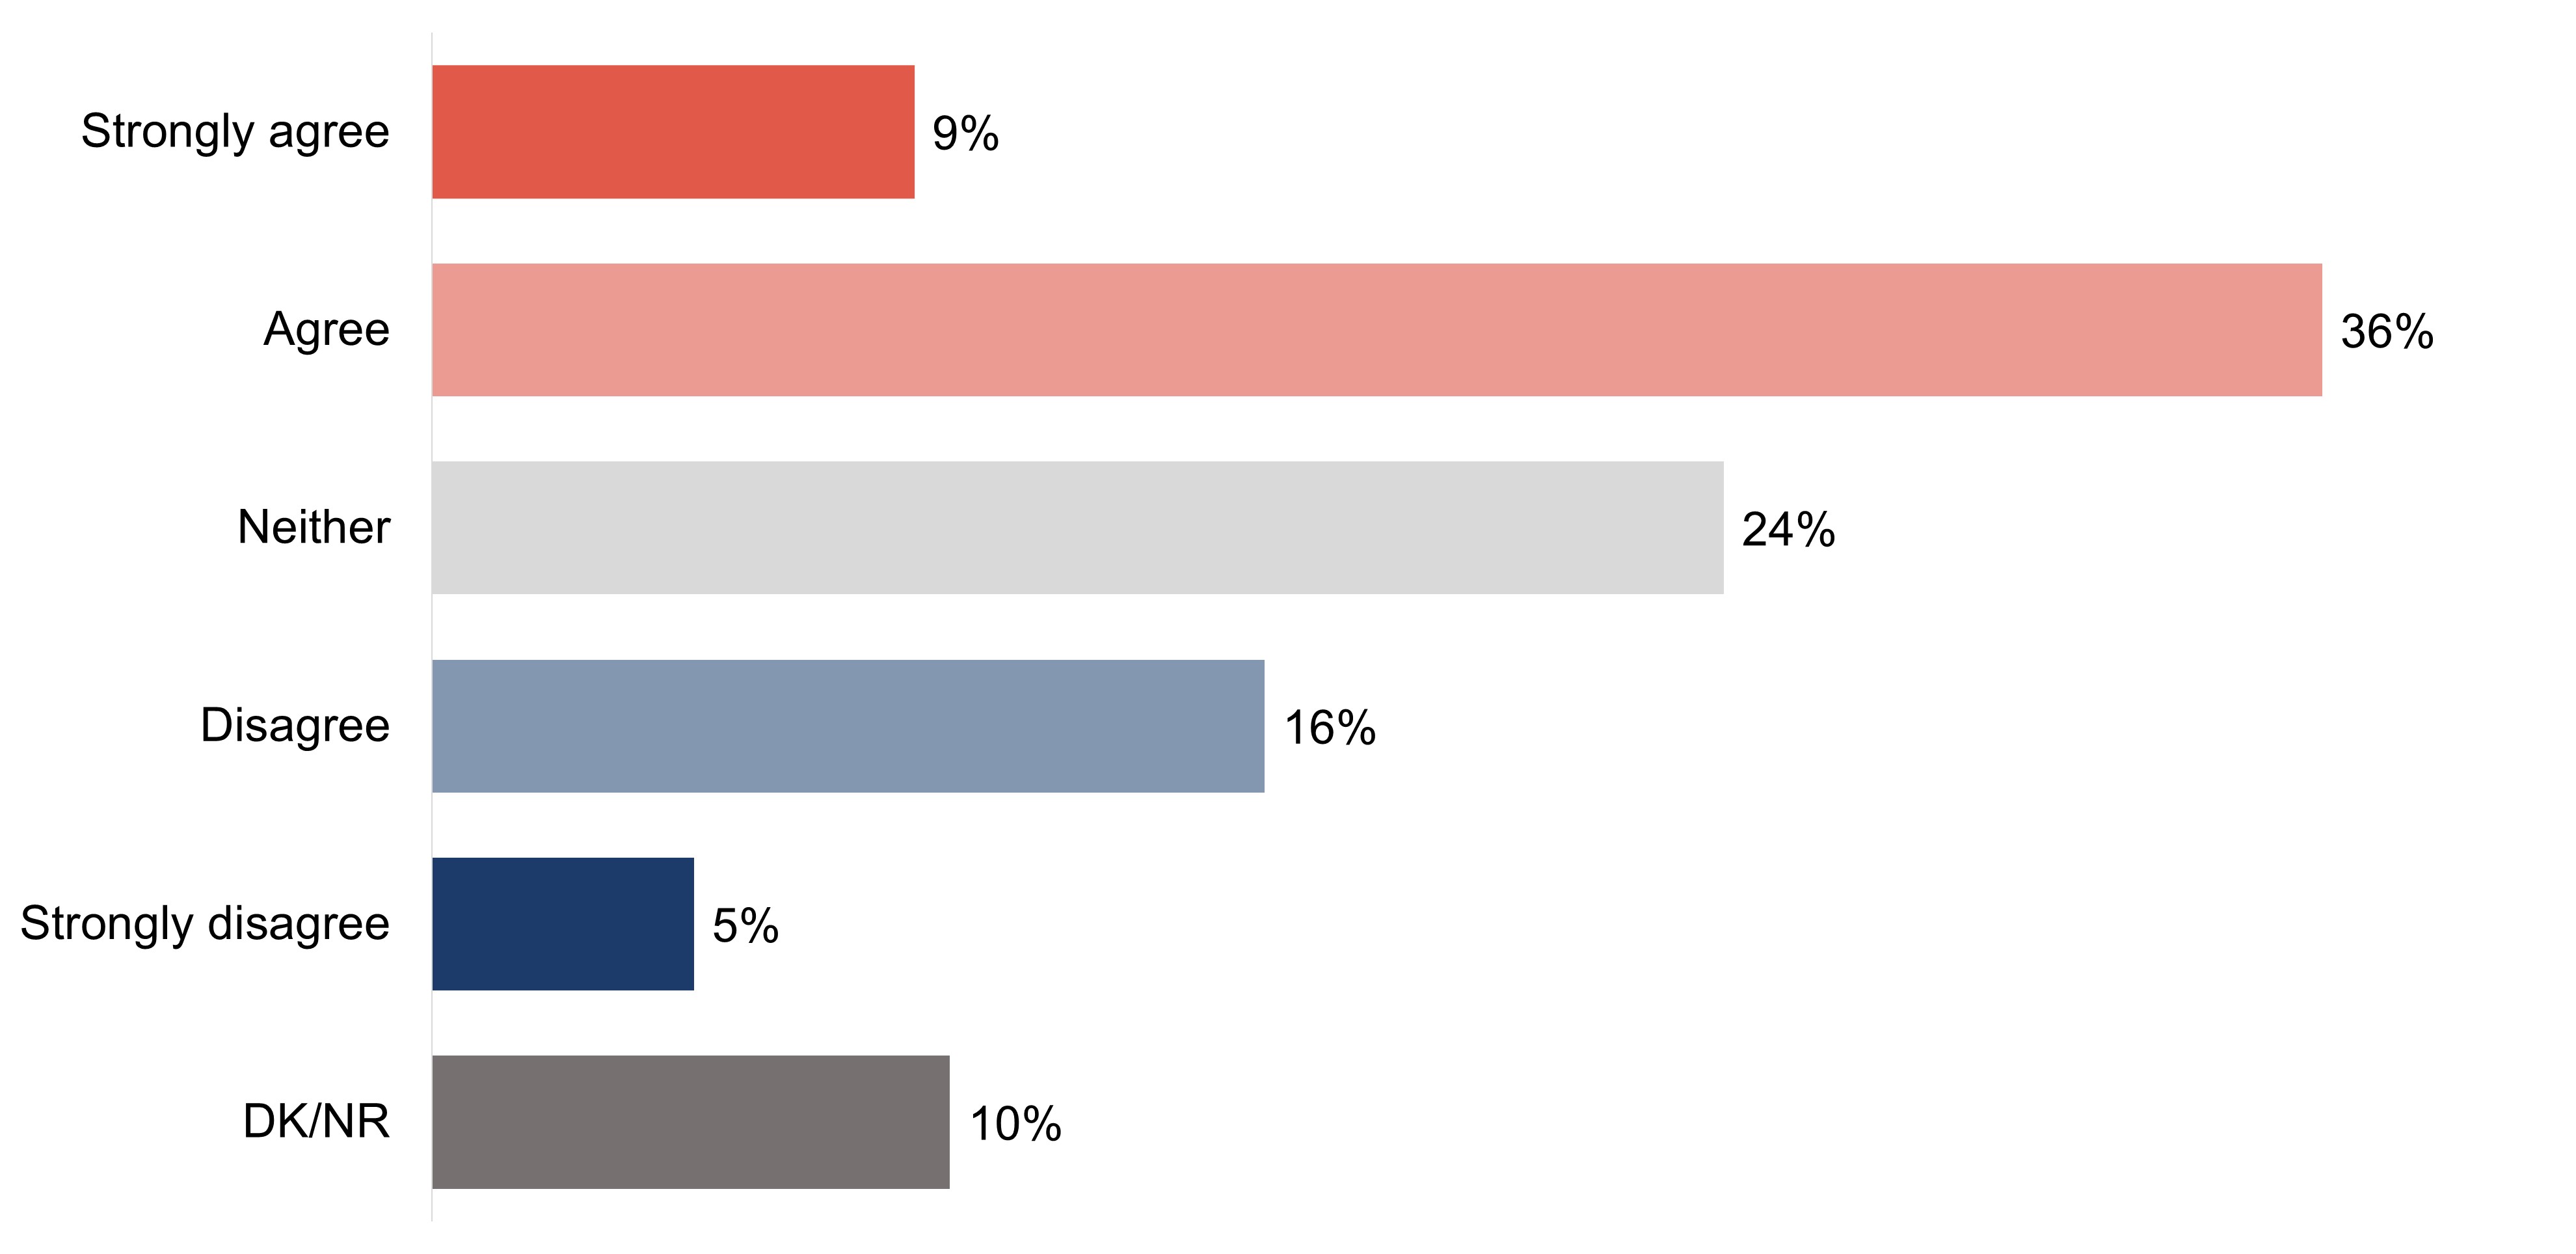
Respondents were asked to rate their level of comfort interacting with people living with dementia using a five-point scale. A similar proportion of respondents say they are more than moderately comfortable (rating of four or five; 41%) or moderately comfortable (39%) interacting with people living with dementia. Over one in ten respondents (13%) say they are not comfortable (rating of one or two), while 7% are unable to rate their level of comfort interacting with someone living with dementia.
Exhibit A18: Q15: On a scale of 1 to 5 where 1 means not comfortable, 3 means moderately comfortable and 5 means very comfortable, how comfortable would or do you feel interacting with someone living with dementia?
Base: All respondents (n=6,049).
Figure 18. TitleFigure 18 - Text description
5 - Very comfortable
19%
4
22%
3 - Moderately comfortable
39%
2
9%
1 - Not comfortable
3%
DK/NR
7%
Key demographic differences for the target audiences for this research are shown in the charts below:
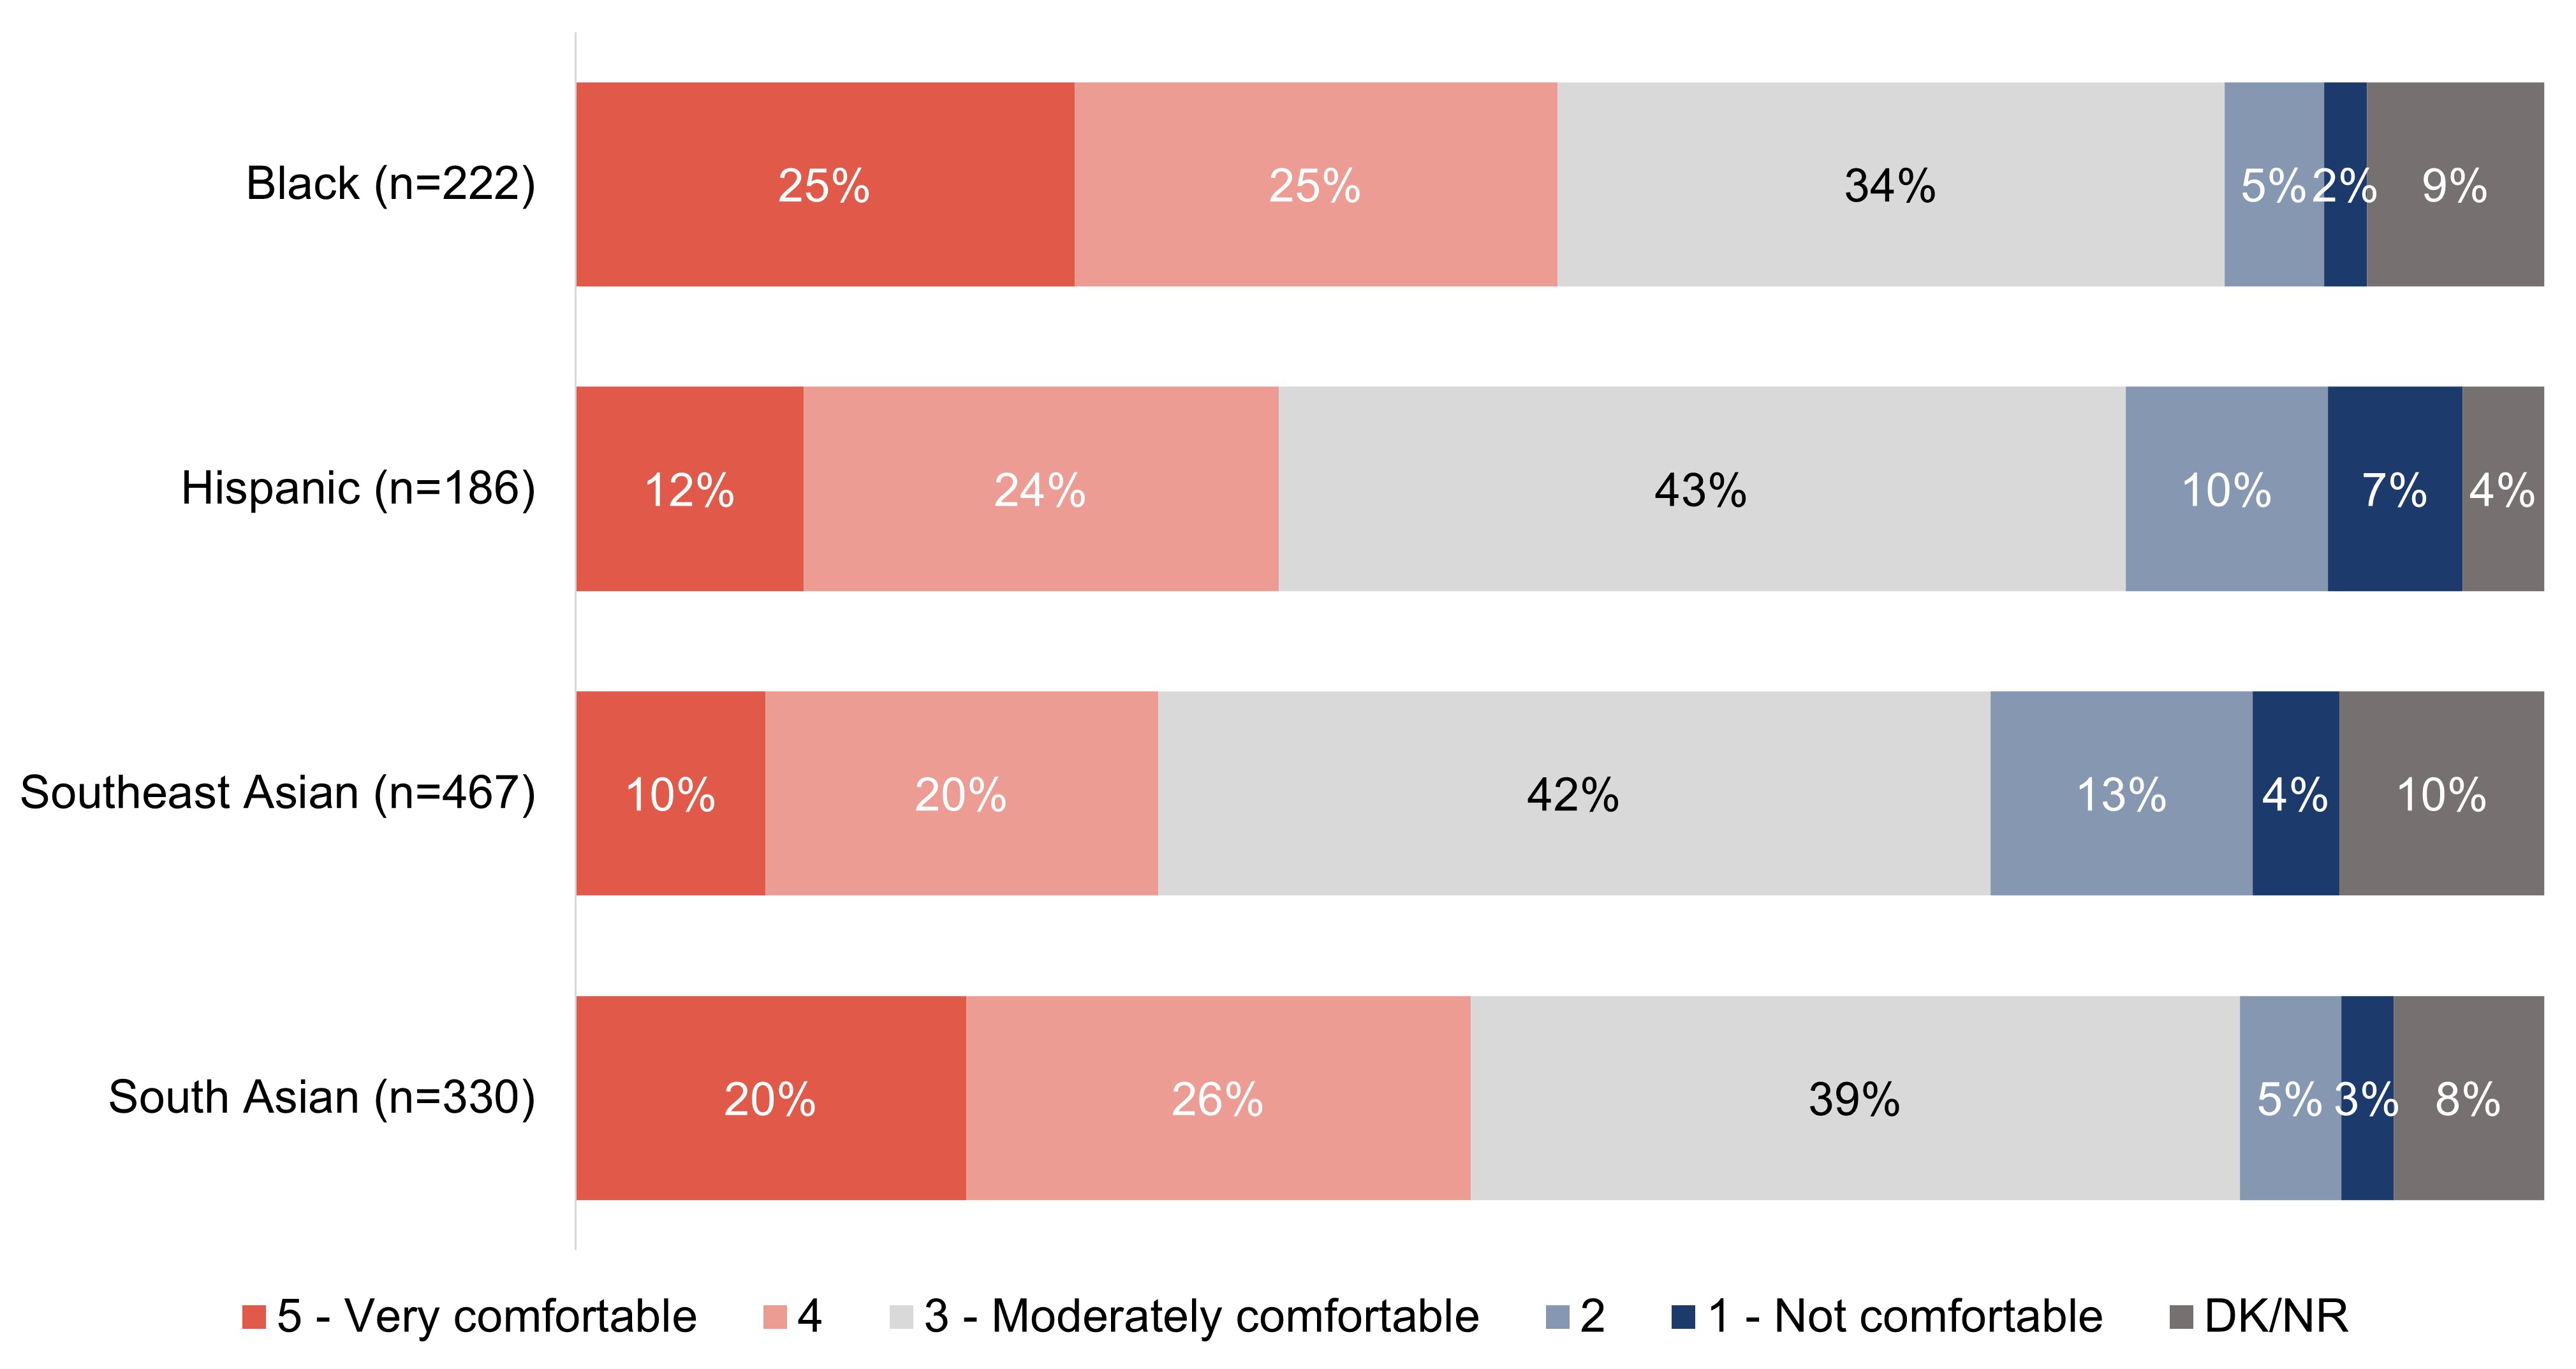
Half of respondents who are Black (50%) or who are South Asian (45%) say they are more than moderately comfortable interacting with someone living with dementia (rating of four or five). Over one-third of respondents (36%) who are Hispanic rate their level of comfort as a four or five on a five-point scale and three in ten (30%) respondents who are Southeast Asian do the same. Conversely, just under one in five respondents who are Hispanic (17%) or Southeast Asian (18%) say they are less than moderately comfortable interacting with someone living with dementia.
Exhibit A19: Q15: On a scale of 1 to 5 where 1 means not comfortable, 3 means moderately comfortable and 5 means very comfortable, how comfortable would or do you feel interacting with someone living with dementia?
Base: All respondents.
Figure 19. TitleFigure 19 - Text description
Column %
Black (n=222)
Hispanic (n=186)
Southeast Asian (n=467)
South Asian (n=330)
5 - Very comfortable
25%
12%
10%
20%
4
25%
24%
20%
26%
3 - Moderately comfortable
34%
43%
42%
39%
2
5%
10%
13%
5%
1 - Not comfortable
2%
7%
4%
3%
DK/NR
9%
4%
10%
8%
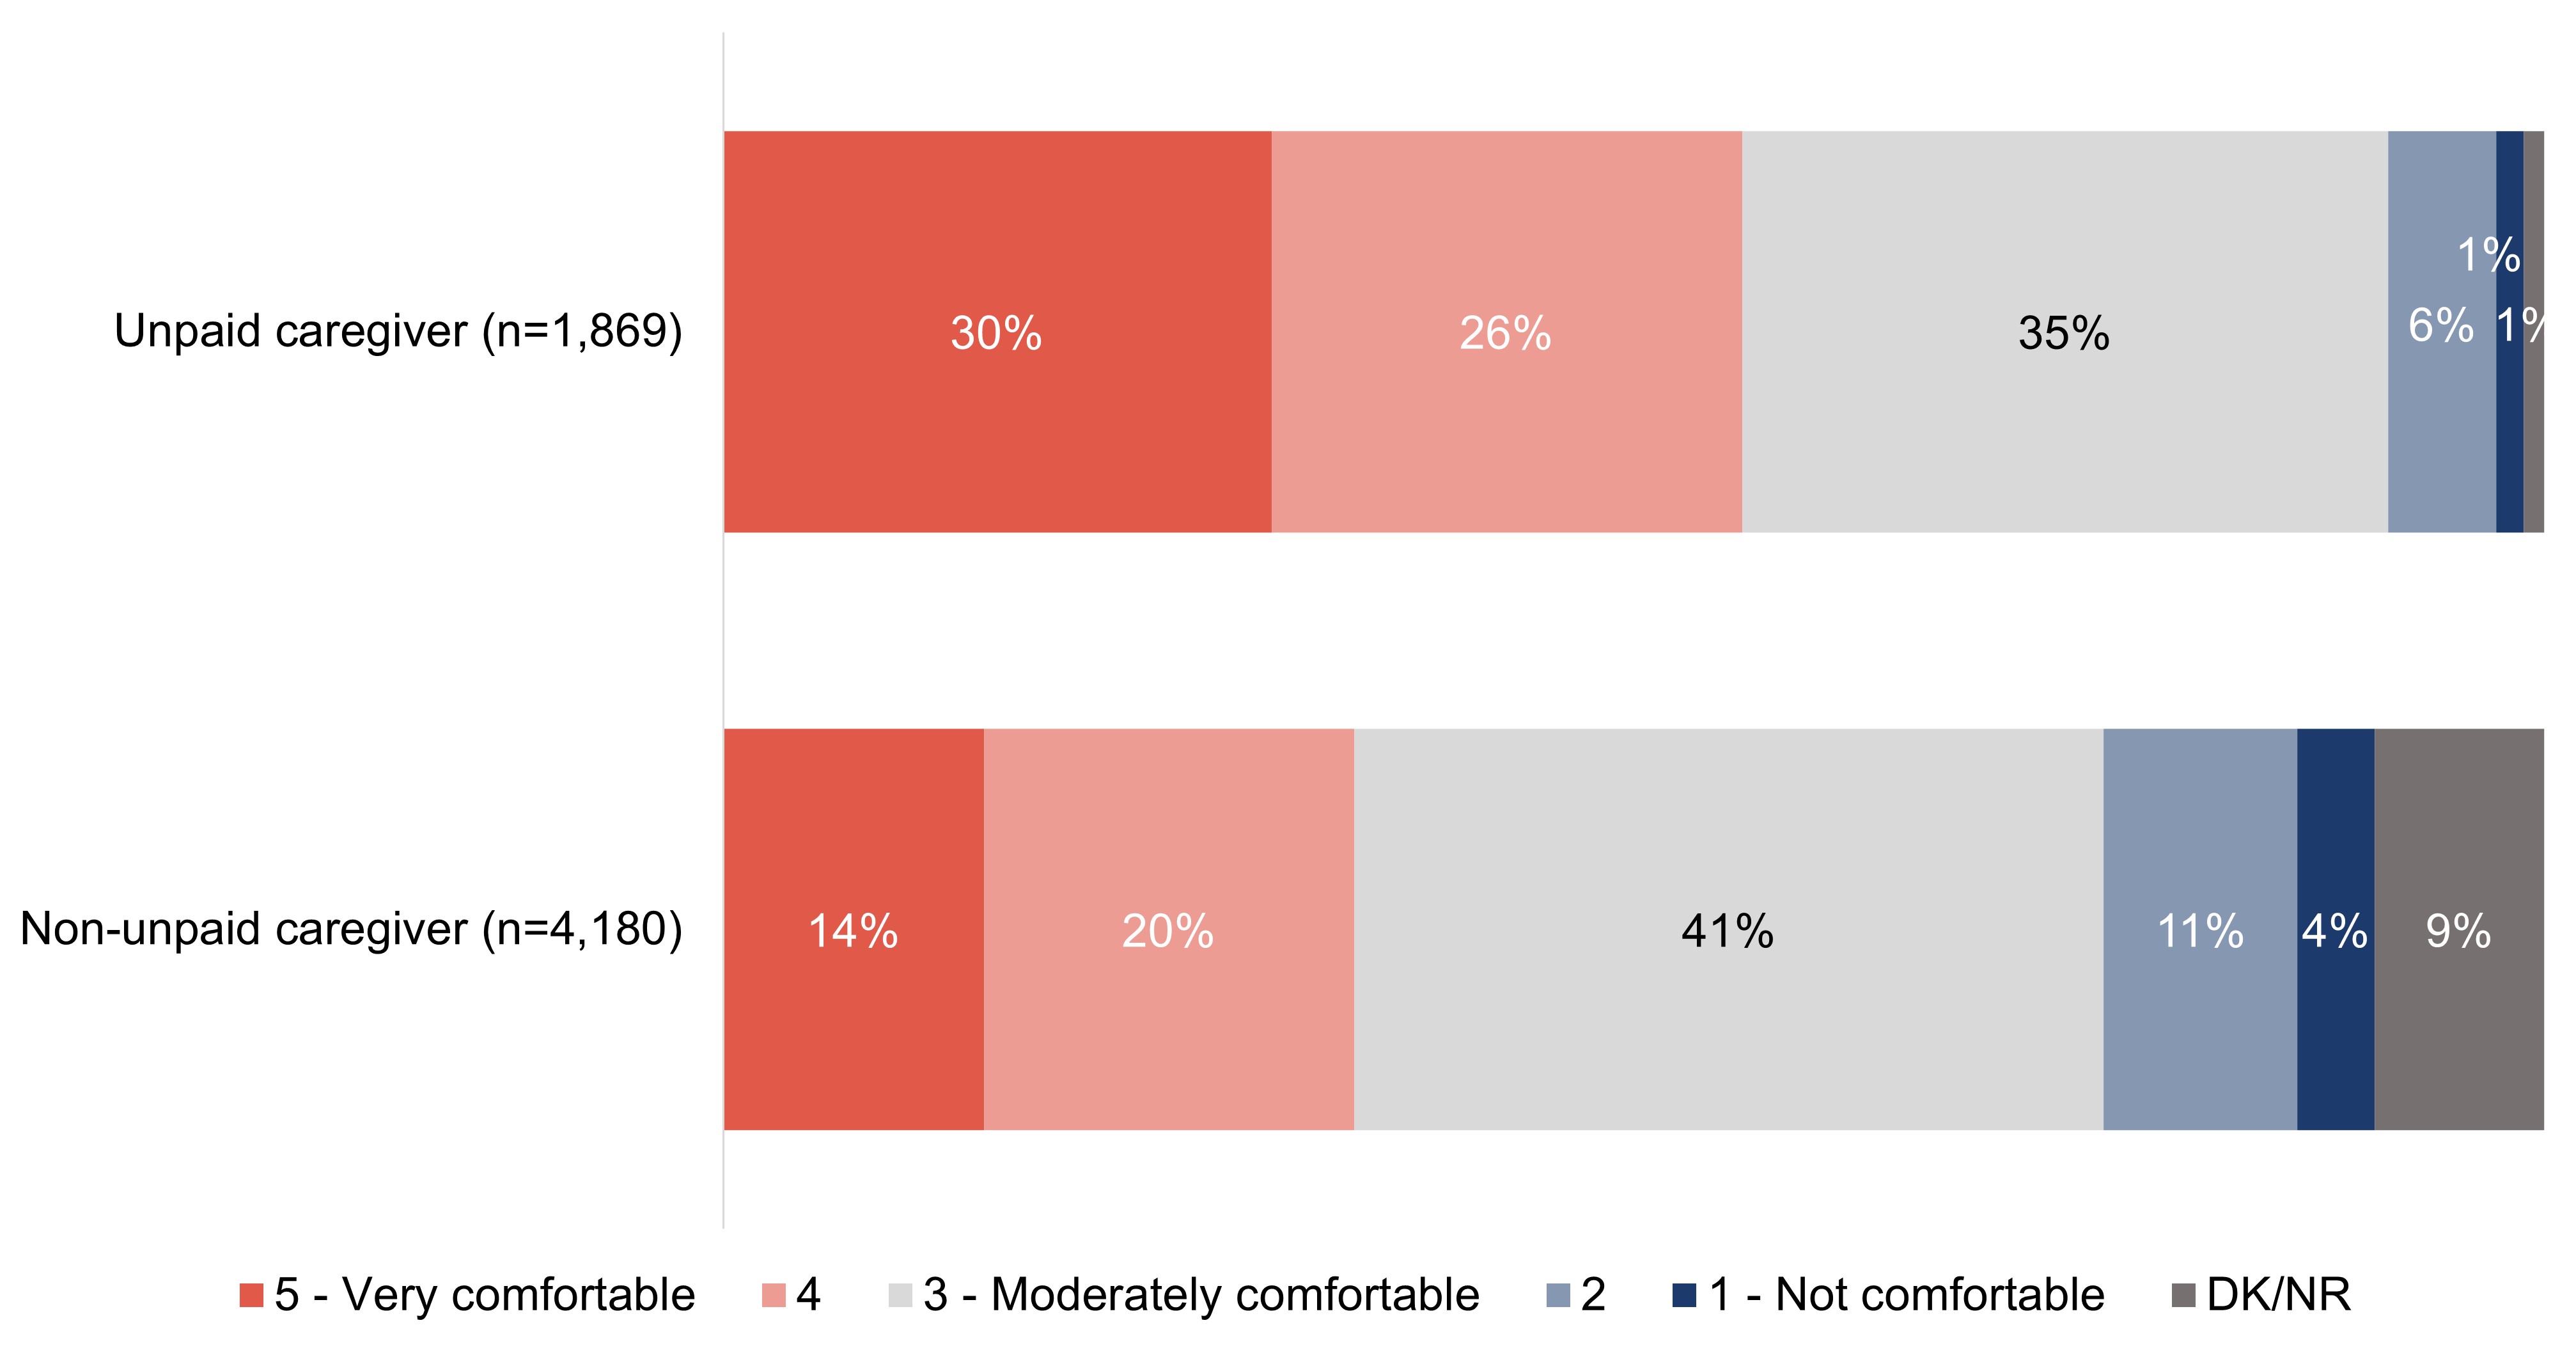
Nearly all respondents who are unpaid caregivers (at 91%) say they are at least moderately comfortable interacting with someone living with dementia, including 56% who rate their comfort as either a four or five, on a five-point scale. Over three-quarters (76%) of respondents who are not unpaid caregivers say they are at least moderately comfortable, with over one-third (35%) who say they are comfortable (rating of four or five).
Exhibit A20: Q15: On a scale of 1 to 5 where 1 means not comfortable, 3 means moderately comfortable and 5 means very comfortable, how comfortable would or do you feel interacting with someone living with dementia?
Base: All respondents.
Figure 20. TitleFigure 20 - Text description
Column %
Unpaid caregiver (n=1,869)
Non-unpaid caregiver (n=4,180)
5 - Very comfortable
30%
14%
4
26%
20%
3 - Moderately comfortable
35%
41%
2
6%
11%
1 - Not comfortable
1%
4%
DK/NR
1%
9%
Other quantitative demographic differences include:
Gender
Those who identify as a woman (44%) are more likely than those who identify as a man (40%) to say that they are comfortable interacting with someone living with dementia.
Region
At 52%, respondents who live in the Territories are the most likely compared to other regions in Canada to say they are comfortable with interacting with people living with dementia, whereas those in Quebec are the least likely (37%).
Education
Respondents who have a high school education or lower (37%) are less likely than those with college/university education (42%) and post-graduate (45%) to say that they are comfortable interacting with someone living with dementia.
Income
Those who have a household income of under $60,000 are the least likely to say that they are comfortable interacting with people living with dementia (39%).
Language
English speaking respondents are more likely than those who speak French to say that they are comfortable interacting with someone living with dementia (43% versus 37%).
Experience with dementia
Respondents are more likely than their counterparts to say that they are comfortable interacting with someone living with dementia if they:
know a person living with dementia (48%);
have/had a work (62%) or volunteer (59%) role where they interact with people living with dementia;
interact with people living with dementia more than weekly (69%);
say they are knowledgeable of dementia (69%);
believe dementia is having a large impact in Canada today (52%);
are aware of dementia-inclusive communities (55%);
feel that communities should prioritize becoming dementia-inclusive (51%); or,
have received training on how to interact with people living with dementia (71%).
All respondents were asked to explain the reasons for their level of comfort in interacting with someone living with dementia. Among those who say they are comfortable interacting with people living with dementia, the most common reasons are personally knowing someone living with dementia (40%), and a general feeling of confidence in most situations (38%). One in six (15%) say that they are comfortable because of the information they have received about supporting people living with dementia.
Exhibit A21: Q16: Why would or do you feel comfortable interacting with someone living with dementia? Select all that apply; response total may be greater than 100%.
Base: Those who are comfortable (rating of 4 or 5 on 5-point scale) interacting with people living with dementia (n=2,542).
Figure 21. TitleFigure 21 - Text description
Currently know or have known people living with dementia
40%
Generally confident in dealing with most situations
38%
Have information on supporting people living with dementia
15%
Other
1%
DK/NR
6%
Other quantitative demographic differences include:
Gender
Those who identify as a woman are more likely to say they are comfortable interacting with someone living with dementia because they currently know or have known people living with dementia (46%), while those who identify as a man are more likely to say they are comfortable because they are generally confident in dealing with most situations (43%).
Age
At 56%, respondents 65 years or older are most likely to say they are comfortable because they know or have known someone living with dementia, while respondents between 18 and 34 years of age are the most likely to say they are comfortable because they have information on supporting people living with dementia (22%).
Size of community
Respondents who live in a rural or remote community are the most likely to say that they are comfortable interacting with someone living with dementia because they know or have known people living with dementia (50%). c
Experience with dementia
Respondents are more likely than their counterparts to say they are comfortable interacting with someone living with dementia because they currently know or have known people living with dementia if they:
know a person living with dementia (51%);
have/had a work (43%) or volunteer (49%) role where they interact with people living with dementia;
interact with people living with dementia more than monthly (48%) or weekly (49%);
believe dementia is having a large impact in Canada today (44%);
are aware of dementia-inclusive communities (46%); or,
feel that communities should prioritize becoming dementia-inclusive (43%).
Respondents are more likely than their counterparts to say they are comfortable interacting with someone living with dementia because they have information on supporting people living with dementia if they:
have/had a work (22%) or volunteer (19%) role where they interact with people living with dementia;
say they are knowledgeable of dementia (21%); or,
are aware of dementia-inclusive communities (18%).
Among those who say they are not comfortable interacting with people living with dementia, the most common reasons, shared by a majority of respondents, are lacking the knowledge of how to communicate with or support a person living with dementia (65%), and being worried about how the person will behave or act (60%). One-third (34%) of respondents say they do not have enough information to be comfortable and 18% say that they have never known anyone living with dementia to gain that comfort.
Exhibit A22: Q17: Why would or do you feel uncomfortable interacting with someone living with dementia? Select all that apply; response total may be greater than 100%.
Base: Those who are not comfortable (rating of 1 or 2 on 5-point scale) interacting with people living with dementia (n=754).
Figure 22. TitleFigure 22 - Text description
Not sure how to talk to or support/help the person
65%
Worried about or unsure of how the person will behave/react
60%
Don't have enough information about dementia
34%
I have never known anyone with dementia
18%
Other
2%
DK/NR
1%
Other quantitative demographic differences include:
Age
At 46%, respondents aged 18 to 34 years are more likely than respondents in any other age group to say that they are uncomfortable interacting with someone living with dementia because they do not have enough information about dementia.
Language
English speaking respondents are more likely than those who speak French (67% versus 59%) to say that they are uncomfortable interacting with someone living with dementia because they are not sure how to talk to or support/help the person.
Experience with dementia
Respondents who say they do not know someone living with dementia are more likely than those who do to:
feel uncomfortable interacting with someone living with dementia because they don't have enough information (39% versus 29%); or,
have never known anyone with dementia (35% versus 3%).
Those who have a work role where they interact with people living with dementia are the most likely to say that they are uncomfortable interacting with people living with dementia because they are worried about or unsure of how the person will react or behave (78%).
To assess familiarity with recommendations for communicating with people living with dementia, respondents were shown a short list of false communication tips and asked which, if any, they think are recommended. Many incorrectly identified physical contact (46%) and providing plenty of information (40%) as recommended communication tips. Nearly one-fifth (17%) of respondents incorrectly thought that avoiding non-verbal encouragement when communicating with someone living with dementia is recommended. Three in ten respondents (30%) do not know any recommended tips for communicating with people living with dementia.
Exhibit A23: Q18: When it comes to communicating with a person living with dementia, which of the following tips do you think are recommended? Select all that apply; response total may be greater than 100%.
Base: All respondents (n=6,049).
Figure 23. TitleFigure 23 - Text description
Physical contact like handshakes is encouraged
46%
Provide plenty of information
40%
Non-verbal encouragement (such as making eye contact and nodding) should be avoided
17%
DK/NR
30%
Key demographic differences for the target audiences for this research are shown in the chart below:
With nearly two in five (38%) of respondents who are not unpaid caregivers indicating that they do not know what tips are recommended, unpaid caregivers are more likely to believe each of the communication tips shown are recommended, including physical contact (59%), providing plenty of information (47%), and avoiding non-verbal encouragement (21%) to the person living with dementia.
Exhibit A24: Q18: When it comes to communicating with a person living with dementia, which of the following tips do you think are recommended? Select all that apply; response total may be greater than 100%.
Base: All respondents.
Figure 24. TitleFigure 24 - Text description
Column %
Unpaid caregiver (n=1,869)
Non-unpaid caregiver (n=4,180)
Physical contact like handshakes is encouraged
59%
39%
Provide plenty of information
47%
37%
Non-verbal encouragement (such as making eye contact and nodding) should be avoided
21%
14%
DK/NR
13%
38%
Other quantitative demographic differences include:
Gender
Those who identify as a man are more likely than those who identify as a woman to say that 'providing plenty of information' is a recommended tip when communicating with a person living with dementia (42% versus 39%, respectively).
Qualitative insights
When asked what knowledge or expertise is needed to best serve people living with dementia, most focus group participants admitted that they had not really given it much consideration. Rather, in response, they tended to reason that such interactions should be handled with patience, compassion, and sensitivity.
"You need to understand that they are vulnerable, so they need to be protected. But still allow them to have some dignity." – Financial services; Atlantic Canada
Furthermore, participants were asked if they were aware of any recommendations for how best to interact with people living with dementia, and beyond mirroring the previous response of patience, compassion and sensitivity, the majority of participants were unable to provide an unaided response. Among the few that did offer another response, not correcting the person and remaining calm were provided by a few participants.
"Try not to constantly correct them. Just play along for the things that don't matter. Let them live in their own world." – Retail and food services; Atlantic Canada
"Biggest one on there is avoid correcting them. That really escalates things. It's not that you go on with whatever they said, but you try to reorient them, so they get there on their own." – Transportation and public safety; Atlantic Canada
To understand which recommendations and tips participants were aware of and their personal experience using any, all participants were shown the following two lists:
Recommendations for how best to interact with people living with dementia
Be patient and give time to respond
Active listening – for example, repeat back the information to confirm you've understood
Sit or stand at the same level and make eye contact
Respect physical space
Avoid assumptions about competency and capacity
Avoid talking to people living with dementia like they're children
Avoid sudden movements
Speak directly to the person speaking with dementia and not their caregiver
Stand directly in front of them, do not approach from behind
Communication tips
Use shorter sentences with one point each
Choose words that express dignity and respect
Provide reassurance
Avoid lots of detailed information
Find a quiet place to talk and lower the volume around you
Avoid correcting the person
Be prepared to repeat information or find other ways to express it that are more easily understood
Try drawing pictures or pointing to objects
Pay attention to non-verbal cues – such as body language, facial expressions, hand gestures and posture
Again, few were aware of these specific recommendations for interactions or communication with people living with dementia. The ones that tended to be recalled once shown were: being patient; choosing words that express dignity and respect; providing reassurance; and avoiding correcting the person.
"C'est très important d'avoir la patience et d'agir comme si la personne posait leur question pour la première fois." (It is very important to have a lot of patience and act as if they were asking their question for the first time.)– Recreational/fitness/community/religious and faith; Quebec
"Faut savoir c'est quoi la démence. Être patient et aller mollo pour ne pas brusquer la personne."(We need to know what dementia is. Be patient and gentle so we don't abrupt the person.)– Transportation and public safety; Quebec
As was true of both lists, participants felt they were intuitive and helpful. Several remarked that more people should be made aware of these and expressed gratitude for seeing them. Several also remarked how it would be helpful to have such lists visibly displayed or at the ready.
The recommendations that resonated most with participants included: active listening; sitting or standing at the same level and making eye contact; avoid talking to people living with dementia like they're children; speaking directly to the person living with dementia and not their caregiver; standing directly in front of them and not approaching from behind; finding a quiet place to talk and lower the volume around them; and drawing pictures or pointing to objects.
"Speaking at their eye level makes a lot of sense. Especially if they are afraid." – Retail and food services; Atlantic Canada
While not the majority, a few participants who work in public transportation (particularly bus drivers) commented on the challenges of operating the vehicle (or bus) while trying to interact and communicate with people living with dementia in the ways suggested by lists shown to participants (as noted above).
Section B: Interactions with people living with dementia in workplace and volunteer settings
The following section explores experience interacting with people living with dementia at work and in volunteer roles, including the frequency of those interactions and the industry sectors in which these interactions take place. This section also explores any awareness of specific issues clients or customers have experienced that might be related to symptoms of dementia.
A majority of respondents (69%) say that they have never had a role in which they have interacted or needed to interact with people living with dementia, however, nearly one in ten say that they used to (9% in a work capacity and 8% on a volunteer basis). Fewer say that they currently work (6%) or volunteer (4%) in such a role.
Exhibit B1: Q5: Now or in the past 10 years, through paid work or as a volunteer, have you been in a role where you have interacted or may need to interact with people living with dementia? Select all that apply; response total may be greater than 100%.
Base: All respondents (n=6049).
Figure B1. TitleFigure B1 - Text description
Yes, I currently work in such a role
6%
Yes, I currently volunteer in such a role
4%
I used to work in such a role, but I no longer do
9%
I used to volunteer in such a role, but I no longer do
8%
No, I have never had such a role whether at work or as a volunteer
69%
DK/NR
5%
No respondents from the key employment industries say that they have not had a role where they interacted or may need to interact with people living with dementia. Respondents from recreation, fitness, community, or religious and faith organizations are the least likely to say that they work in a role that requires them to interact with people living with dementia (15%). Conversely, respondents from organizations in retail and food and transport and public safety are the most likely to say that they currently work in a role requires them to interact with people living with dementia (29% and 24%, respectively).
Exhibit B2: Q5: Now or in the past 10 years, through paid work or as a volunteer, have you been in a role where you have interacted or may need to interact with people living with dementia? Select all that apply; response total may be greater than 100%.
Base: All respondents.
Figure B2. TitleFigure B2 - Text description
Column %
Retail and food services (n=231)
Transport and public safety (n=126)
Recreational/fitness/community/religious and faith (n=224)
Financial services (n=105)
Yes, I currently work in such a role
29%
24%
15%
21%
Yes, I currently volunteer in such a role
20%
23%
26%
13%
I used to work in such a role, but I no longer do
31%
36%
24%
28%
I used to volunteer in such a role, but I no longer do
29%
23%
41%
40%
No, I have never had such a role whether at work or as a volunteer
0%
0%
0%
0%
DK/NR
0%
0%
0%
0%
Key demographic differences for the target audiences for this research are shown in the charts below:
Two in five (40%) respondents who are Black say that they currently or previously worked or volunteered in a role where they interacted or may need to interact with people living with dementia, including 15% who currently work in such a role. Approximately three in ten respondents who are Hispanic (31%), Southeast Asian (27%) and South Asian (32%) say that they currently or have worked or volunteered in a role where they have interacted or may need to interact with people living with dementia.
Exhibit B3: Q5: Now or in the past 10 years, through paid work or as a volunteer, have you been in a role where you have interacted or may need to interact with people living with dementia? Select all that apply; response total may be greater than 100%. Base: All respondents.
Figure B3. TitleFigure B3 - Text description
Column %
Black (n=222)
Hispanic (n=186)
Southeast Asian (n=467)
South Asian (n=330)
Yes, I currently work in such a role
15%
6%
7%
5%
Yes, I currently volunteer in such a role
10%
5%
5%
5%
I used to work in such a role, but I no longer do
9%
10%
7%
13%
I used to volunteer in such a role, but I no longer do
10%
13%
10%
11%
No, I have never had such a role whether at work or as a volunteer
55%
63%
68%
62%
DK/NR
5%
6%
5%
6%
At 54%, unpaid caregivers are more likely than those who are not (13%) to say that they currently or previously worked or volunteered in a role where they have interacted or may need to interact with people living with dementia.
Exhibit B4: Q5: Now or in the past 10 years, through paid work or as a volunteer, have you been in a role where you have interacted or may need to interact with people living with dementia? Select all that apply; response total may be greater than 100%.
Base: All respondents.
Figure B4. TitleFigure B4 - Text description
Column %
Unpaid caregiver (n=1,869)
Non-unpaid caregiver (n=4,180)
Yes, I currently work in such a role
11%
4%
Yes, I currently volunteer in such a role
12%
0%
I used to work in such a role, but I no longer do
14%
6%
I used to volunteer in such a role, but I no longer do
19%
3%
No, I have never had such a role whether at work or as a volunteer
41%
82%
DK/NR
5%
5%
Other quantitative demographic differences include:
Gender
Those who identify as a man (72%) are more likely than those who identify as a woman (66%) to say that they have never had such a role whether at work or as a volunteer.
Age
Respondents who are 18 to 34 are the least likely (at 61%) to say that they have never had such a role whether at work or as a volunteer.
Education
Respondents who have a high school education or less are most likely (at 76%) to say that they have never had such a role whether at work or as a volunteer.
Income
Those who have a household income of $100,000 or more (72%) are the most likely to say that they have never had such a role whether at work or as a volunteer.
Language
French speaking respondents (72%) are more likely than English speaking respondents (68%) to say that they have never had such a role whether at work or as a volunteer.
Community size
Respondents who live in medium or large urban communities (70%) are the most likely to say that they have never had such a role whether at work or as a volunteer.
Experience with dementia
Respondents are more likely to say that they have never had a work or volunteer role that required them to interact with people living with dementia if they:
say they know someone living with dementia are more likely to say that they currently or have worked or volunteered in a role where they have interacted or may need to interact with people living with dementia (34%), compared to those who say they do not know anyone living with dementia (11%).
Qualitative insights
So that all participants had a consistent definition from which to base the rest of the discussion, and to inform any participant who lacked a base level knowledge of dementia, the following definition of dementia was provided to all participants at this point in the discussion:
Dementia is an umbrella term used to describe a set of symptoms affecting brain function that are caused by neurodegenerative and vascular diseases or injuries. It is characterized by a decline in cognitive abilities. These abilities include: memory; awareness of person, place and time; language; basic math skills; judgment; and planning. Dementia can also affect mood and behaviour.
Following the definition, participants were asked if they have ever interacted with people living with dementia as part of their work. Some participants indicated that they did or do have interactions with people living with dementia at their workplace, while others were not certain whether the people they suspected might have had dementia really did, or whether they had not had any such interactions.
"Working at the Y, I can imagine I have, but I am never certain." – Recreational/fitness/community/religious and faith; Ontario
There were notable differences based upon the sector. Those in transportation and public safety, religion or faith, and financial services (to a lesser degree) seemed to more frequently have had interactions with people living with dementia in their work. Those in retail and food services appeared to do so less frequently, though some reasoned they most certainly may have had such interactions unbeknownst to them.
"As a firefighter, if we don't know that they have dementia, it can be confusing. It catches you off guard. Residents [in the apartment buildings] might not even realize there is a fire alarm going off." – Transportation and public safety; Atlantic Canada
"It's very difficult. He comes into my office, and I am with him for an hour, and I have to repeat things over and over. And when he leaves, I can't make any decisions because I can't be sure what he wants to do." – Financial services; Western/Northern Canada
"Even walking through the terminal, you can see them. I always stop and ask, 'are you lost, do you need help?'" – Transportation and public safety; Ontario
Among those who do or have had a role that may have required them to interact with people living with dementia, nearly half (49%) did/do more than weekly, 30% did/do a few time times a month to weekly, and 18% did/do so once a month or less.
Exhibit B5: Q6: How frequently do you (or did you) interact with people living with dementia?
Base: Those who have experience interacting with people living with dementia (n=1,598).
Figure B5. TitleFigure B5 - Text description
Daily
24%
A few times a week
25%
Weekly
16%
A few times a month
14%
Monthly
6%
Less often than once a month
12%
DK/NR
3%
Key demographic differences for the target audiences for this research are shown in the chart below:
Among those who have experience interacting with people living with dementia, a majority of unpaid caregivers (53%) say they do/did so more than weekly compared to over two in five (41%) of those who are not unpaid caregivers. Nearly three in ten (29%) of respondents who are not unpaid caregivers interact with people living with dementia once a month or less.
Exhibit B6: Q6: How frequently do you (or did you) interact with people living with dementia?
Base: Those who have experience interacting with people living with dementia.
Figure B6. TitleFigure B6 - Text description
Column %
Unpaid caregiver (n=998)
Non-unpaid caregiver (n=600)
Daily
25%
22%
A few times a week
28%
19%
Weekly
18%
12%
A few times a month
14%
13%
Monthly
6%
7%
Less often than once a month
7%
22%
DK/NR
2%
5%
Other quantitative demographic differences include:
Gender
Those who identify as a woman are more likely to say that they interact or interacted with people living with dementia daily or a few times a week (52%), while those who identify as a man are more likely to say that they interact or interacted with people living with dementia weekly or a few times a month (34%).
Region
Respondents who live in Atlantic Canada are the most likely to say that they interact or interacted with people living with dementia daily or a few times a week (61%).
Income
Those who have a household income of under $60,000 are more likely to say that they interact or interacted with people living with dementia monthly or less often than once a month (20%), while people who have a household income over $60,000 say they are more likely to weekly or a few times a month.
Language
English speaking respondents (31%) are more likely to say that they interact with people living with dementia weekly or a few times a month, compared to French speaking respondents (25%).
Experience with dementia
Respondents are more likely than their counterparts to say they interact or interacted with people living with dementia at least a few times per week if they:
know a person living with dementia (51%);
have/had a work role where they interact with people living with dementia (57%);
say they are knowledgeable of dementia (63%);
believe dementia is having a large impact in Canada today (55%); or,
say they are comfortable interacting with people living with dementia (55%).
Over half (57%) of respondents who have experience interacting with people living with dementia in a work or volunteer role did so in the health care field. Fewer than one-fifth of respondents who have experience interacting with people living with dementia work in retail and food services (16%), recreation, fitness, community and religious organizations (14%), transportation and public safety (8%), or financial services (6%).
Exhibit B7: Q7: Which of the following best describes the sector you are or were in when interacting with people living with dementia? Select all that apply; response total may be greater than 100%.
Base: Those who have experience interacting with people living with dementia (n=1,598).
Figure B7. TitleFigure B7 - Text description
Health care
57%
Retail and food services
16%
Recreation / fitness / community and religious orgs
14%
Personal (not work related)
11%
Transportation and public safety
8%
Financial services
6%
Federal or provincial client services centres
3%
Cultural organization or institution
3%
Tourism
2%
Other
3%
DK/NR
3%
Key demographic differences for the target audiences for this research are shown in the charts below:
Three in five (61%) respondents who are Black who have experience interacting with people living with dementia work or worked in health care, so too do half of respondents who are Southeast Asian (51%) or South Asian (53%). Nearly two in five (36%) respondents who are South Asian and three in ten (29%) of respondents who are Hispanic work or worked in retail and food services.
Exhibit B8: Q7: Which of the following best describes the sector you are or were in when interacting with people living with dementia? Select all that apply; response total may be greater than 100%.
Base: Those who have experience interacting with people living with dementia.
Figure B8. TitleFigure B8 - Text description
Column %
Black (n=91)
Hispanic (n=59)
Southeast Asian (n=130)
South Asian (n=102)
Healthcare
61%
33%
51%
53%
Retail and food services
20%
29%
24%
36%
Recreation / fitness / community and religious orgs
17%
27%
19%
18%
Personal (not work related)
3%
4%
8%
5%
Transportation and public safety
14%
20%
12%
14%
Financial services
5%
13%
5%
10%
DK/NR
4%
1%
2%
2%
Respondents who are not unpaid caregivers are more likely than unpaid caregivers to have worked in health care when they were interacting with people living with dementia (67% compared to 52%, respectively). Unpaid caregivers are more likely to have worked in each of the key employment areas, including retail and food services (20%), recreation, fitness, community and religious organizations (16%), transportation and public safety (11%), and financial services (7%).
Exhibit B9: Q7: Which of the following best describes the sector you are or were in when interacting with people living with dementia? Select all that apply; response total may be greater than 100%.
Base: Those who have experience interacting with people living with dementia.
Figure B9. TitleFigure B9 - Text description
Column %
Unpaid caregiver (n=998)
Non-unpaid caregiver (n=600)
Healthcare
52%
67%
Retail and food services
20%
8%
Recreation / fitness / community and religious orgs
16%
11%
Personal (not work related)
14%
5%
Transportation and public safety
11%
4%
Financial services
7%
5%
DK/NR
2%
3%
Respondents who do not identify as 2SLGBTQ+ are more likely to work or have worked in recreation, fitness, community and religious organizations (15%) when they were required to interact with people living with dementia, whereas respondents who identify as 2SLGBTQ+ are more likely to work or have worked in retail and food services (at 21%) when interacting with people living with dementia.
Exhibit B10: Q7: Which of the following best describes the sector you are or were in when interacting with people living with dementia? Select all that apply; response total may be greater than 100%.
Base: Those who have experience interacting with people living with dementia.
Figure B10. TitleFigure B10 - Text description
Column %
Identify as 2SLGBTQ+ (n=156)
Not 2SLGBTQ+ (n=1,358)
Healthcare
60%
56%
Retail and food services
21%
15%
Recreation / fitness / community and religious orgs
10%
15%
Personal (not work related)
5%
12%
Transportation and public safety
7%
9%
Financial services
4%
7%
DK/NR
3%
3%
To understand the symptoms or behaviours that respondents have experienced among their clients or customers that they associated with dementia, all were shown a list and asked which, if any, they have experienced. The most common issues faced by clients or customers that respondents felt were related to dementia are confusion (73%) and issues with communication (65%). Fewer respondents say that they noticed clients or customers with mobility issues (44%), problems for paying for services (31%) or bumping into objects and barriers (25%) that they thought might be related to dementia.
Exhibit B11: Q35: What issues, if any, have you ever noticed clients or customers experiencing that might be related to symptoms of dementia? Select all that apply; response total may be greater than 100%.
Base: Those who have experience interacting with people living with dementia (n=1,598).
Figure B11. TitleFigure B11 - Text description
Confusion, such as seeming lost or unsure of surroundings
73%
Communication issues, such as having difficulty finding words
65%
Mobility difficulties, such as navigation
44%
Problems in paying for services, such as remembering pin numbers
31%
Bumping into objects and barriers (spatial awareness)
25%
I (do/did) not interact directly with clients or customers
4%
Other
2%
None
2%
DK/NR
4%
Key demographic differences for the target audiences for this research are shown in the charts below:
Respondents in recreation, fitness, community and religious organizations are the most likely to say they noticed clients or customers experiencing confusion, like seeming lost or unsure of surroundings (at 78%), and those who work in financial services are the most likely to say they noticed clients or customers with problems paying for services (at 44%).
Exhibit B12: Q35: What issues, if any, have you ever noticed clients or customers experiencing that might be related to symptoms of dementia? Select all that apply; response total may be greater than 100%.
Base: Those who have experience interacting with people living with dementia.
Figure B12. TitleFigure B12 - Text description
Column %
Retail and food services (n=231)
Transport and public safety (n=126)
Recreational/fitness/community/religious and faith (n=224)
Financial services (n=105)
Confusion, such as seeming lost or unsure of surroundings
63%
61%
78%
64%
Communication issues, such as having difficulty finding words
52%
57%
69%
67%
Mobility difficulties, such as navigation
34%
52%
45%
35%
Problems in paying for services, such as remembering pin numbers
25%
25%
28%
44%
Bumping into objects and barriers (spatial awareness)
21%
24%
29%
23%
I (do/did) not interact directly with clients or customers
3%
4%
2%
5%
Other
0%
2%
1%
2%
None
0%
2%
1%
4%
DK/NR
3%
1%
3%
1%
Respondents who are not unpaid caregivers are more likely to say that they noticed clients or customers appear confused (77%) or experience communication issues (69%) that they associated with dementia, whereas unpaid caregivers are more likely to say they noticed problems paying for services (34% versus 26%).
Exhibit B13: Q35: What issues, if any, have you ever noticed clients or customers experiencing that might be related to symptoms of dementia? Select all that apply; response total may be greater than 100%.
Base: Those who have experience interacting with people living with dementia.
Figure B13. TitleFigure B13 - Text description
Column %
Unpaid caregiver (n=998)
Non-unpaid caregiver (n=600)
Confusion, such as seeming lost or unsure of surroundings
71%
77%
Communication issues, such as having difficulty finding words
63%
69%
Mobility difficulties, such as navigation
44%
44%
Problems in paying for services, such as remembering pin numbers
34%
26%
Bumping into objects and barriers (spatial awareness)
26%
25%
I (do/did) not interact directly with clients or customers
3%
4%
Other
2%
3%
None
2%
2%
DK/NR
3%
6%
Other quantitative demographic differences include:
Gender
Those who identify as a woman are more likely than those who identify as a man to recognize each the issues listed as symptoms of dementia among their clients or customers; most notably confusion (79%) and communication issues (71%).
Age
Respondents who are 18 to 34 years of age are the least likely to say that they noticed each of the issues provided; most notably confusion (64%) and communication issues (56%).
Experience with dementia
Respondents are more likely than their counterparts to recognize all or most of the issues listed as symptoms of dementia among their clients or customers if they:
know a person living with dementia, interact with people living with dementia more than weekly;
say they are knowledgeable of dementia;
believe dementia is having a large impact in Canada today;
say they are comfortable interacting with people living with dementia;
are aware of dementia-inclusive communities;
feel that communities should prioritize becoming dementia-inclusive; or,
have received training on how to interact with people living with dementia.
Qualitative insights
Participants in the focus groups were asked what behaviours, signs, or symptoms might make them think that a person is living with dementia. Mirroring the quantitative findings, many participants cited confusion, frustration, forgetting, repeating themselves, and mistaking a person for someone else as the signs they would expect to encounter when interacting with someone living with dementia. Not reflected in the quantitative research, some focus group participants indicated that they might expect quick changes in behaviour or temperament, a lack of autonomy, communicating like a child, and appearing disheveled. A few others said a person leaving something in the wrong place, mixing up words, or recounting the past as if it were the present as behaviours that might make them expect someone was living with dementia. While participants had no trouble citing at least one sign or symptom, several noted that they would not necessarily think that a person was living with dementia if they exhibited any one of these symptoms on their own.
When asked what types of physical or cognitive challenges they might expect a person living with dementia to experience, participants collectively cited all areas of one's life including activities of daily living (for example, cooking and eating), managing one's health (for example, taking medications appropriately), mobility and speech, behaviour and mood, and managing finances (cited exclusively by participants in the financial services groups). Some participants noted that these challenges would depend on the stage of dementia, and others were not confident they know the barriers and challenges a person living with dementia might experience.
"I have a hard time differentiating forgetfulness with dementia. I don't know that I would recognize the difference." – Retail and food services; Atlantic Canada
"Poor judgment, confusion, even reading and writing." – Transportation and public safety; Ontario
When asked what they would do if they encountered someone visiting their workplace as a client or customer who appeared to be searching, wandering, or confused, many participants seemed puzzled by the question. One person from the financial services West/Northern Canada group immediately responded with, "be a decent human being and talk to them" as if there was no other possible response to the question. As it were, most participants who offered a response said that approaching the person and talking to them to determine how they might be able to help would be the way they would respond in that situation.
"Approach them at their own pace. Try and figure out if they are looking for something. Have a general conversation with them." – Transportation and public safety; Atlantic Canada
"I would ask them permission if I could help them find where they are going." – Retail and food services; Atlantic Canada
Still some others indicated that they might seek guidance from superiors or call 911, and a few admitted that they do not know what they would do. One individual, who worked in Quebec in transportation and public safety, disclosed that witnessing this would make them feel uneasy, wanting to avoid a potentially violent situation; however, they too indicated that they would do what they could to keep the person living with dementia calm.
"If they were really lost, I would have to call the police." – Retail and food services; Ontario
"I wouldn't have a clue how to deal with this. Now with the list [provided by PHAC], I feel like I would be more mindful." – Recreational/fitness/community/religious and faith; Ontario
Regardless of the approach taken, all participants expressed some form of care they would take if faced with this situation.
"I'd ask first if they knew what they were looking for. Then if not, I would try offering suggestions. I would also walk with them and give more assistance than an average customer." – Retail and food services; Atlantic Canada
"Approach with care and compassion." – Financial services; Atlantic Canada
"Offering hospitality and then trying to determine what was going on." – Recreational/fitness/community/religious and faith; Ontario
Section C: Workplace and volunteer setting measures and training to support clients living with dementia
The following section explores the training provided by workplaces and volunteer organizations to improve interactions and experiences with people living with dementia, as well as the training received by individuals and the recency of that training. This section, regardless of one's personal experience interacting with people living with dementia, explores perceptions of whether organizations provide enough training to improve potential interactions, as well as what measures or policies are in place, if any, to ensure positive and helpful interactions in person and online for people living with dementia.
Roughly half of respondents who currently have a work (53%) or volunteer (50%) role or who had a work role (51%) that required them to interact with people living with dementia say their organization provided specific training on how to interact with people living with dementia; fewer who used to have a volunteer role say the same of their organization (at 40%).
Exhibit C1: Q28: The next few questions are about each of the roles you indicated. For each of those experiences, do or did staff / volunteers at that or those organizations receive training on how to interact with people living with dementia? At the place where you…
Base: Those who have experience interacting with people living with dementia (n=236-532); percent who responded "yes."
Figure C1. TitleFigure C1 - Text description
Row %
Yes
Currently work
53%
Used to work
51%
Currently volunteer
50%
Used to volunteer
40%
Qualitative insights
Differing from the quantitative findings (potentially due to the proportion of those who work or volunteer in the health care field), when asked about the training in place for employees at their organizations to assist in recognizing and supporting people who may be living with dementia, the majority of focus group participants said there is none.
"There's no training to identify or how to interact with a person living with dementia." – Financial services; West/Northern Canada
A few described their workplace as having provided specific training for serving and interacting with people living with dementia although some indicated that their training included mention of dementia as among the health issues they may encounter.
This was more often the case for those working in health care, such as paramedics, pharmacists, and personal support workers, than those working in other industry sectors. These participants described having had one session or module relating to dementia as part of their training.
"Just initial onboarding; half an hour video and answered some questions at the end." – Transportation and public safety; Ontario
"Une formation générale de gestion des situations de santé mentale est offerte à la plupart des policiers."(General training on how to work through mental health situations is given to most police officers.) – Transportation and public safety; Quebec
Those in law enforcement described dementia as something that was included in their training relating to missing persons cases; for example, how to find a missing person who is living with dementia and how to get them home safely. Among those in financial services, regulatory compliance was at the center of the majority of training they had received on dementia.
Among respondents who are from organizations that provide training on how best to interact with people living with dementia, the majority (68%) say that they have personally received this type of training, while three in ten (28%) say they have not.
Exhibit C2: Q29: Have you personally received training on how to interact with people living with dementia?
Base: Those whose organization(s) provided staff / volunteers training on how to interact with people living with dementia (n=780).
Figure C2. TitleFigure C2 - Text description
Yes
68%
No
28%
DK/NR
4%
Other quantitative demographic differences include:
Gender
Those who identify as a woman are more likely than those who identify as a man to say they have received training on how to interact with people living with dementia (73% versus 62%).
Language
French speaking respondents (35%) are more likely to say they have not received training on how to interact with people living with dementia.
Experience with dementia
Respondents are more likely than their counterparts to say that they have received training on how to interact with people living with dementia if they:
interact with people living with dementia more than weekly (75%);
say they are knowledgeable of dementia (77%);
say they are comfortable interacting with people living with dementia (73%); or,
are aware of dementia-inclusive communities (80%).
Among those who have received this type of training, a majority (87%) were trained over a year ago, including 45% who received their training one to five years ago and 41% who say it has been more than 5 years. Thirteen percent (13%) say they received training on how to interact with people living with dementia in the past year.
Exhibit C3: Q30: How long ago?
Base: Those who have received training on how to interact with people living with dementia (n=531).
Figure C3. TitleFigure C3 - Text description
Within the past year
13%
1 to 5 years ago
45%
More than 5 years ago
41%
DK/NR
1%
General knowledge (78%), communication or interaction tips (72%), and instructions on how to assist those who are confused or lost (66%) are all common focuses of training received by respondents.
Exhibit C4: Q31: What was the focus or purpose of the training? Select all that apply; response total may be greater than 100%.
Base: Those who have received training on how to interact with people living with dementia (n=531).
Figure C4. TitleFigure C4 - Text description
General knowledge about dementia, including what signs or symptoms may be present
78%
Communication and interaction tips
72%
How to assist someone who seems confused or lost
66%
Other
2%
DK/NR
1%
Among those who have or had a work role that required them to interact with people living with dementia, nearly half (45%) agree or strongly agree their organization provides or provided enough training for proper interaction with people living with dementia. Nearly three in ten (29%) respondents disagree or strongly disagree that their employer provides or provided enough training to appropriately interact with clients or customers who are living with dementia.
Exhibit C5: Q32: To what extent do you agree or disagree with the following statement about the place you work or worked in which you have had interaction with people living with dementia? That organization (does/did) enough to provide training for staff and volunteers on how to appropriately interact with clients or customers who are living with dementia in a supportive, respectful and effective way.
Base: Those who have experience interacting with people living with dementia at work (n=947).
Figure c5. TitleFigure C5 - Text description
Strongly agree
13%
Agree
32%
Neither
20%
Disagree
22%
Strongly disagree
8%
DK/NR
6%
Key demographic differences for the target audiences for this research are shown in the chart below:
Respondents who are unpaid caregivers are more likely than those who are not to agree that their employer provides or provided enough training on how to interact with people living with dementia (51% compared to 38%, who agree or strongly agree). Over one-third (37%) of respondents who are not unpaid caregivers say they disagree that their employer provided enough training, compared to 23% of unpaid caregivers.
Exhibit C6: Q32: To what extent do you agree or disagree with the following statement about the place you work or worked in which you have had interaction with people living with dementia? That organization (does/did) enough to provide training for staff and volunteers on how to appropriately interact with clients or customers who are living with dementia in a supportive, respectful and effective way.
Base: Those who have experience interacting with people living with dementia at work.
Figure C6. TitleFigure C6 - Text description
Column %
Unpaid caregiver (n=493)
Non-unpaid caregiver (n=454)
Strongly agree
16%
9%
Agree
35%
29%
Neither
22%
18%
Disagree
17%
27%
Strongly disagree
6%
10%
DK/NR
4%
7%
Other quantitative demographic differences include:
Experience with dementia
Respondents are more likely than their counterparts to believe that their employer provides or provided enough training on how to interact with people living with dementia if they:
say they are knowledgeable of dementia (53%)
believe dementia is having a large impact in Canada today (47%);
say they are comfortable interacting with people living with dementia (50%);
are aware of dementia-inclusive communities (53%); or,
say that they have received training on how to interact with people living with dementia (66%).
Among those who have or had a volunteer role that required them to interact with people living with dementia, nearly half (45%) agree their organization provides or provided enough training for proper interaction with people living with dementia, while one-fifth (21%) of respondents disagree.
Exhibit C7: Q33: To what extent do you agree or disagree with the following statement about the place you volunteer or volunteered in which you have had interaction with people living with dementia? That organization does/did enough to provide training for staff and volunteers on how to appropriately interact with clients or customers who are living with dementia in a supportive, respectful and effective way.
Base: Those who have experience interacting with people living with dementia as a volunteer (n=720).
Figure C7. TitleFigure C7 - Text description
Strongly agree
9%
Agree
36%
Neither
24%
Disagree
16%
Strongly disagree
5%
DK/NR
10%
Key demographic differences for the target audiences for this research are shown in the chart below:
As was true among those who have or had a work role, respondents who are unpaid caregivers are more likely than those who are not to agree or strongly agree that the organization they volunteer or volunteered with provides or provided enough training on how to interact with people living with dementia (48% compared to 35%, who agree or strongly agree).
Exhibit C8: Q33: To what extent do you agree or disagree with the following statement about the place you volunteer or volunteered in which you have had interaction with people living with dementia? That organization does/did enough to provide training for staff and volunteers on how to appropriately interact with clients or customers who are living with dementia in a supportive, respectful and effective way.
Base: Those who have experience interacting with people living with dementia as a volunteer.
Figure C8. TitleFigure C8 - Text description
Column %
Unpaid caregiver (n=553)
Non-unpaid caregiver (n=167)
Strongly agree
9%
11%
Agree
39%
24%
Neither
23%
28%
Disagree
15%
19%
Strongly disagree
5%
5%
DK/NR
9%
13%
Other quantitative demographic differences include:
Experience with dementia
Respondents are more likely than their counterparts to believe that the organization they volunteer or volunteered with provides or provided enough training on how to interact with people living with dementia if they:
say they are knowledgeable about dementia (51%);
say they are comfortable interacting with people living with dementia (50%);
are aware of dementia-inclusive communities (54%); or,
say that they have received training on how to interact with people living with dementia (74%).
Qualitative insights
To one degree or another, many focus groups participants felt that education or training on how to interact with people living with disabilities, more broadly, would be of value. In fact, many felt that the recommendations that had been provided about interacting and communicating with people living with dementia would be prudent and helpful communications advice for interacting with anyone with any sort of disability.
"I think it's tricky with the wide range of disabilities to focus on one. On a larger sweeping one might be better." – Recreational/fitness/community/religious and faith; Ontario
Mirroring the proportion of training across organizations, approximately half of respondents (between 49% and 54%) say their organization has or had measures or policies in place specifically to ensure positive and helpful interactions with people living with dementia.
Exhibit C9: Q34: Does or did that organization have any measures or policies specifically to ensure positive and helpful interactions with people living with dementia? At the place where you…
Base: Those who have experience interacting with people living with dementia (n=236-532); percent who responded "yes."
Figure C9. TitleFigure C9 - Text description
Row %
Yes
Currently work
54%
Currently volunteer
54%
Used to work
50%
Used to volunteer
49%
Key demographic differences for the target audiences for this research are shown in the chart below:
Respondents who are unpaid caregivers are more likely than those who are not to say that their current (61%) or previous employers (59%), and current (56%) or previous (52%) volunteer organizations have or had measures and policies specifically to ensure positive and helpful interactions with people living with dementia.
Exhibit C10: Q34: Does or did that organization have any measures or policies specifically to ensure positive and helpful interactions with people living with dementia? At the place where you…
Base: Those who have experience interacting with people living with dementia; percent who responded "yes."
Figure C10. TitleFigure C10 - Text description
Column %
Unpaid caregiver (n=216-337)
Non-unpaid caregiver (n=20-256)
Currently work in role
61%
46%
Used to work in role
59%
39%
Currently volunteer in role
56%
17%
Used to volunteer in role
52%
41%
Qualitative insights
Most participants were unsure as to whether their workplace had in place any measures to specifically accommodate and support clients or customers living with dementia, though the majority were quick to point out accommodations and policies in place for interacting with people living with disabilities that might also be applicable. In fact, few confirmed measures in place at their work for accommodating people living with dementia specifically.
"We help people who are hard of hearing, or who are blind, but we never have anything for dementia." – Retail and food services; Ontario
To stimulate the discussion and uncover policies and measures that participants may not have had top-of-mind recollection of at their workplace, the following examples were provided to participants:
Accommodations – such as longer appointments
Information provided in larger text, using pictures
Following up multiple times (via phone, email, letter)
No loud music / availability of quiet spaces and areas
Well lit
Appropriate signage
Minimizing obstacles for walking
Well-signed bathrooms
When shown the list, most participants said that their workplace had at least one of these measures in place, most commonly being well lit, having appropriate signage, minimizing obstacles for walking, and having well-signed bathrooms. Many participants, having seen the list, said that they considered these measures as being applicable to multiple groups, including people living with disabilities, and also regular customers who may benefit from them (for example, parents with strollers).
"My workplace would have had most of those. It was well-lit and the signage was in a larger font as well." – Retail and food services; Atlantic Canada
"The physical space in the centre would satisfy some of these already, but not necessarily for dementia." – Recreational/fitness/community/religious and faith; Ontario
For participants from some industry sectors, such as religious, faith, recreational, fitness, and community services, transportation and public safety, and some retail and food services, there were questions as to the feasibility of some of the suggested accommodations. For example, a few who work in fitness and community centers commented on the challenges of some of the accommodations, such as finding a quiet place to talk and lower the volume around you, which was singled out as particularly challenging.
"Il est très difficile de réduire le bruit et la musique." (It is very difficult to reduce noise and music.) – Recreational/fitness/community/religious and faith; Quebec
Beyond these specific challenges, the main barriers preventing their workplaces from becoming more supportive and welcoming of people living with dementia that participants cited usually related to resources – financial, but also time, and human capital.
"Ce sont de très bonnes mesures. Par contre, c'est important d'avoir les bonnes personnes pour mettre ces mesures en main. En revanche, on doit avoir plus de financement des centres communautaires, c'est peu probable."(These are very good measures. But it is important to have the right people to enforce these measures. But then we need more financing in community centers, which is very unlikely.)– Recreational/fitness/community/religious and faith; Quebec
Looking at the online experience for people living with dementia, over one-fifth of respondents (22%) say that their organization takes or took steps to make online interactions more accessible for those with cognitive impairment, while nearly half (47%) say it does or did not. The remaining 31% of respondents are not sure whether their organization took any steps to make online interaction more accessible.
Exhibit C11: Q36: Does/Did your organization take any steps to make online interactions more accessible for those with cognitive impairment (such as dementia)?
Base: Those who have experience interacting with people living with dementia at work (n=947).
Figure C11. TitleFigure C11 - Text description
Yes
22%
No
47%
DK/NR
31%
Other quantitative demographic differences include:
Gender
Those who identify as a man are more likely than those who identify as a woman to say their organization takes steps to make online interaction more accessible for those with cognitive impairments such as dementia (27% versus 20%).
Age
Respondents who are between the ages of 18 and 34 years are the most likely (at 30%) to say their organization takes steps to make online interaction more accessible for those with cognitive impairments such as dementia, whereas respondents who are 65 years are older are the least likely (at 10%).
Experience with dementia
Respondents are more likely than their counterparts to say their organization takes steps to make online interaction more accessible for those with cognitive impairments such as dementia if they:
say they are knowledgeable of dementia (26%);
say they are comfortable interacting with people living with dementia (26%);
are aware of dementia-inclusive communities (32%); or,
feel that communities should prioritize becoming dementia-inclusive (26%).
Among respondents who say their organization took steps to make online interactions more accessible, a similar proportion of respondents (ranging from 37% to 43%) say their organization takes or took steps to make online interactions more accessible, including chat or call options (43%), shorter text (43%), printable content and forms (41%), including contract information (41%), subtitles or transcripts and/or video or audio content (37%), and plain backgrounds to avoid distraction (37%).
Exhibit C12: Q37: What are those measures? Select all that apply; response total may be greater than 100%.
Base: Those whose organization takes steps to make online interactions more accessible for those with cognitive impairment (n=203).
Figure C12. TitleFigure C12 - Text description
Chat or call options
43%
Shorter text
43%
Printable content and forms
41%
Including contact information
41%
Subtitles or transcripts and / or video or audio content
37%
Plain backgrounds to avoid distraction
37%
Other
7%
DK/NR
3%
Section D: Efforts to support healthy aging and dementia-inclusive communities
The following section explores awareness and attitudes surrounding dementia-inclusive communities. It explores how well communities are doing in supporting healthy aging, as well as what measures and activities are currently in place at the community level to support the quality of life of people living with dementia in community settings, including their ability to participate actively.. It explores overall awareness of the concept of dementia-inclusive communities, and understanding of what these communities would have in place or might offer people living with dementia. Finally, the section explores views of the level of priority communities should place on becoming more dementia-inclusive, and whether communities have plans in place towards the achievement of that.
Section D1: Healthy aging in communities
Asked to rate their community, over one-third of respondents (36%) give their community a good or very good rating as a place that supports healthy aging, while slightly fewer (29%) rate it as neither good nor poor. Fewer than one-fifth of respondents would rate their community as poor or very poor (17%) or are unsure how to rate their community (18%).
Exhibit D1: Q19: How would you rate your community as a place that supports healthy aging including making it possible for older people to remain engaged in community life?
Base: All respondents (n=6,049).
Figure D1. TitleFigure D1 - Text description
Very good
8%
Good
28%
Neither good nor poor
29%
Poor
14%
Very poor
3%
DK/NR
18%
Key demographic differences for the target audiences for this research are shown in the charts below:
At 50%, respondents who are South Asian are the most likely to rate their community as good or very good as a place that supports healthy aging, and the least likely to say they are unable to provide a rating (12%). Respondents who are Southeast Asian are the most likely to say their community is neither good nor poor at supporting healthy aging (36%) and the least likely to rate their community as either good or very good (31%).
Exhibit D2: Q19: How would you rate your community as a place that supports healthy aging including making it possible for older people to remain engaged in community life?
Base: All respondents.
Figure D2. TitleFigure D2 - Text description
Column %
Black (n=222)
Hispanic (n=186)
Southeast Asian (n=467)
South Asian (n=330)
Very good
15%
9%
4%
15%
Good
28%
31%
26%
35%
Neither good nor poor
29%
30%
36%
28%
Poor
7%
9%
13%
8%
Very poor
2%
5%
2%
2%
DK/NR
20%
16%
18%
12%
At one-fifth (22%), respondents who are not unpaid caregivers are more likely to select 'don't know' or 'prefer not to say' when asked to rate their community on its ability to support healthy aging.
Exhibit D3: Q19: How would you rate your community as a place that supports healthy aging including making it possible for older people to remain engaged in community life?
Base: All respondents.
Figure D3. TitleFigure D3 - Text description
Column %
Unpaid caregiver (n=1,869)
Non-unpaid caregiver (n=4,180)
Very good
10%
7%
Good
31%
26%
Neither good nor poor
30%
29%
Poor
15%
13%
Very poor
4%
3%
DK/NR
8%
22%
Respondents who identify as 2SLGBTQ+ are divided in their assessment of their community as a place that supports healthy aging, with over three in ten who rate their community as good or very good (31%), and neither good nor poor (31%). While approximately one-fifth rate their community as poor or very poor (22%) or select 'don't know' or 'prefer not to say' (16%). Over one-third (36%) of respondents who do not identify as 2SLGBTQ+ would rate their community as good or very good.
Exhibit D4: Q19: How would you rate your community as a place that supports healthy aging including making it possible for older people to remain engaged in community life?
Base: All respondents.
Figure D4. TitleFigure D4 - Text description
Column %
Identify as 2SLGBTQ+ (n=540)
Not 2SLGBTQ+ (n=5,139)
Very good
8%
8%
Good
24%
28%
Neither good nor poor
31%
29%
Poor
19%
13%
Very poor
3%
3%
DK/NR
16%
18%
Other quantitative demographic differences include:
Age
At 39%, respondents who are between 18 and 34 years are the most likely to rate their community as a "good" or "very good" place that supports healthy aging; they are also less likely than respondents in any other age group to say they "don't know" (14%).
Experience with dementia
Respondents are more likely than their counterparts to rate their community as a good place that supports healthy aging if they:
have/had a work (43%) or volunteer (43%) role where they interact or interacted with people living with dementia;
say they are knowledgeable of dementia (45%);
say they are comfortable interacting with people living with dementia (43%);
are aware of dementia-inclusive communities (41%); or,
feel that communities should prioritize becoming dementia-inclusive (40%).
Among those who provided their community a positive rating for how well it supports healthy aging, the most common reason is due to the activities available (37%). Fewer (20%) say their community is geared towards supporting older individuals. Over one-third (37%) are unsure why they rated their community positively as a place that supports healthy aging.
Exhibit D5: Q20: Why do you give your community that rating (for how well it supports healthy aging including community engagement for older people)? Select all that apply; response total may be greater than 100%.
Base: Those who gave their community a negative rating (1 or 2 on 5-point scale) (n=2,210).
Figure D5. TitleFigure D5 - Text description
Community activities are available (senior centres, support programs, social activities, events, etc)
37%
Community geared towards supporting older individuals (staff, homes, people)
20%
Supportive community (caring, family oriented, respectful, etc.)
8%
Lack of resources and supports (staff, information, wait lists, support programs, services, etc)
2%
Other
12%
DK/NR
37%
Among those who provided their community a negative rating for supporting healthy aging, the most common reason is due a lack of resources and supports (51%). One-quarter (25%) of respondents select 'don't know' or 'prefer not to say' when asked why they provided their community a negative rating as a place that supports healthy aging.
Exhibit D6: Q20: Why do you give your community that rating (for how well it supports healthy aging including community engagement for older people)? Open-ended response; response total may be greater than 100%.
Base: Those who gave their community a positive rating (4 or 5 on 5-point scale).
Figure D6. TitleFigure D6 - Text description
Lack of resources and supports (staff, information, wait lists, support programs, services, etc)
51%
Not a community geared towards caring for older people
16%
Other
12%
DK/NR
25%
Section D2: Dementia-inclusive communities
Awareness of dementia-inclusive communities is low. The vast majority (75%) of respondents say they have not heard of the concept of dementia-inclusive communities, while 17% say they have.
Exhibit D7: Q21: Have you heard of the concept of dementia-inclusive communities?
Base: All respondents (n=6,049).
Figure D7. TitleFigure D7 - Text description
Yes
17%
No
75%
DK/NR
7%
Key demographic differences for the target audiences for this research are shown in the charts below:
While still the minority, unpaid caregivers are more likely than respondents who are not to say that they have heard of dementia-inclusive communities (25% compared to 14%).
Exhibit D8: Q21: Have you heard of the concept of dementia-inclusive communities?
Base: All respondents.
Figure D8. TitleFigure D8 - Text description
Column %
Unpaid caregiver (n=1,869)
Non-unpaid caregiver (n=4,180)
Yes
25%
14%
No
67%
79%
DK/NR
8%
7%
While still the minority, respondents who identify as 2SLGBTQ+ are more likely than respondents who do not identify as 2SLGBTQ+ to say that they have heard of dementia-inclusive communities (22% compared to 17%).
Exhibit D9: Q21: Have you heard of the concept of dementia-inclusive communities?
Base: All respondents.
Figure D9. TitleFigure D9 - Text description
Column %
Identify as 2SLGBTQ+ (n=540)
Not 2SLGBTQ+ (n=5,139)
Yes
22%
17%
No
68%
76%
DK/NR
10%
7%
Other quantitative demographic differences include:
Gender
Respondents who identify as a woman are more likely than those who identify as a man to have heard of the concept of dementia-inclusive communities (20% versus 15%).
Region
At 27%, respondents in British Columbia are the most likely to have heard of the concept of dementia-inclusive communities, whereas respondents in Quebec are the least likely to have (8%).
Education
Those who have a post-graduate degree above bachelor's level or more (23%) are the most likely to have heard of the concept of dementia-inclusive communities, whereas respondents who have a high school education or less are the least likely (12%).
Income
Respondents whose household income is $100,000 or more (20%) are more likely than respondents who have a household income of less than $100,000 (16%) to have heard of the concept of dementia-inclusive communities.
Language
English speaking respondents are more like to have heard of the concept of dementia-inclusive communities than French speaking respondents (21% versus 7%).
Experience with dementia
Respondents are more likely than their counterparts to say that they have heard of the concept of dementia-inclusive communities if they:
know a person living with dementia (21%);
have/had a work (30%) or volunteer (28%) role where they interact(ed) with people living with dementia;
interact with people living with dementia more than monthly (30%) or weekly (31%);
say they are knowledgeable of dementia (29%);
believe dementia is having a large impact in Canada today (21%);
say they are comfortable interacting with people living with dementia (23%);
feel that communities should prioritize becoming dementia-inclusive (21%); or,
have received training on how to interact with people living with dementia (41%).
Qualitative insights
Among the focus group participants, virtually none felt their community was well-suited for people living with dementia, and some balked at the notion that was even plausible. They cited dangers such as busy streets, parks where a person living with dementia might easily get lost, or construction that might pose dangers to them. A few (most notably in Ontario) felt that their communities would not be considered safe by general standards of safety (for example, high crime areas), so would certainly not be suitable for any vulnerable populations, including those living with dementia.
"No, not even the kids are safe to go around." – Financial services; Ontario
"I live in [in a city where] there's a lot of violence here. So, no one wants to get involved." – Retail and food services; Ontario
What participants fairly consistently demonstrated is that the perception they have of dementia requires much more control, supervision, and protection for people living with dementia than is realistically feasible in a typical neighbourhood.
"[My community is] not dementia-discriminative, but I don't think it's inclusive. In my opinion, you lose your independence when you have dementia, so dementia-independence is confusing me." – Transportation and public safety; Atlantic Canada
Some ideas participants had to make their communities more dementia-inclusive included encouraging people in a community to be on the lookout for neighbours who are living with dementia, or perhaps identifying (for example, with a sign in the window or on the street) where a person living with dementia lives, ensuring people living with dementia wear a bracelet or necklace identifying that fact, or even using GPS tags on clothing to make it easier to find a person living with dementia who has wandered.
"I am in a suburb that has its own Facebook group where community members can post on things they need. I am pretty confident that if we had someone in my community that had dementia and has specific needs, our community would do that." – Financial services; Atlantic Canada
"More things family members can do, like making sure they always have a bracelet with their name, address, and phone number on it. It's hard for a community to do that." – Transportation and public safety; Ontario
However, the view was most often that these were temporary and unreliable measures that left them feeling that their community was a risky place for people living with dementia to live. For most participants, regular neighbourhood features, like roadways and traffic, as well as outdoor features, like lakes, mountains, and forests were hazards that could not be effectively mitigated.
"Je pense que c'est une utopie comme idée, je ne pense pas que c'est possible."(I think it is a utopic idea, and I don't think it's possible.) – Transportation and public safety; Quebec
"I just can't imagine a neighbourhood that can be dementia-inclusive. I guess maybe really small communities where everyone knows each other." – Financial services; West/Northern Canada
Mirroring the quantitative results, very few focus groups participants claimed or demonstrated awareness of the term "dementia-inclusive community". Assumptions that were made about the term almost always meant something more akin to a long-term care community tailored to serve residents who were living with dementia (and possibly their partner). Participants envisioned a community custom-designed to have small homes, car-less streets, and to be gated in a way that would prevent the residents from being able to wander out of the community. Staff working in that community would be people who were also trained in being dementia caregivers to one degree or another, even if they worked in the shops or in some other capacity other than being a health care provider.
"An apartment complex; somewhere where they can be together in an inclusive environment." – Retail and food services; Atlantic Canada
"I pictured independent living, like a gated community. Somewhere they could wander and be safe." – Transportation and public safety; Ontario
Among the few that could envision a community that had dementia-inclusive features without being dementia-exclusive, the most common assumptions were that these communities would have tailored infrastructure (for example, signage), and there would be heightened awareness of dementia among its community members.
"Assuming infrastructure, like signage, sights and sounds, catered to people living with dementia." – Financial services; Ontario
"Ensuring that they are able to function around the community like anyone else." – Financial services; Atlantic Canada
"Having public places be in the know about people with dementia, and how to deal with them and their caregivers in a positive way." – Retail and food services; Atlantic Canada
Following the unaided discussion, all participants were given the following definition of dementia-inclusive communities to inform the discussion:
In a dementia-inclusive community, measures are in place that make it possible for people living with dementia to protect and improve their health and wellbeing, live independently, safely navigate and access local activities, and maintain social networks.
Providing participants with the description of dementia-inclusive communities did little to dispel the aforementioned assumptions.
The majority of respondents (54%) rate it is a high priority (that is, a rating of four or five) for their community to become more dementia-inclusive, and three in ten (30%) would classify the priority as 'moderate'. A handful (7%) do not believe it is a priority and the remaining 9% select 'don't know' or 'prefer not to say' when asked how much of a priority it is for their community.
Exhibit D10: Q22: What level of priority rating would you assign to having your community become more dementia-inclusive in these ways?
Base: All respondents (n=6,049).
Figure D10. TitleFigure D10 - Text description
5 - Very high priority
24%
4
29%
3 - Moderate priority
30%
2
5%
1 - Not at all a priority
2%
DK/NR
9%
At almost two-thirds (63%), respondents who are unpaid caregivers are more likely than those who are not (50%) to say it is a high priority for their community to become more dementia-inclusive.
Exhibit D11: Q22: What level of priority rating would you assign to having your community become more dementia-inclusive in these ways?
Base: All respondents.
Figure D11. TitleFigure D11 - Text description
Column %
Unpaid caregiver (n=1,869)
Non-unpaid caregiver (n=4,180)
5 - Very high priority
31%
21%
4
32%
28%
3 - Moderate priority
28%
31%
2
4%
5%
1 - Not at all a priority
2%
2%
DK/NR
3%
12%
Other quantitative demographic differences include:
Gender
Respondents who identify as a woman are more likely than those who identify as a man to believe it is a priority for their community to become more dementia-inclusive (58% versus 49%).
Age
Those who are older than 54 years are more likely to say that it is a priority for their community to become dementia-inclusive (59% among those 55 to 64 years and 60% among those 65 years or older), while those who are 54 years or younger are more likely to say it is not a priority (9% among those 18 to 34 years and 7% among those 35 to 54 years).
Region
Respondents in Quebec (59%), the Territories (59%), and Atlantic Canada (58%) are more likely than in other regions to say it is a priority for their community to become dementia-inclusive.
Education
At 60%, respondents who have completed a post-graduate degree above a bachelor's level are the most likely to say it is a priority for their community to become dementia-inclusive, and those who have a high school education or less are the least likely (50%).
Employment
Those who are retired (59%) are the most likely to say it is a priority for their community to become dementia-inclusive, whereas respondents who are students are the most likely to say that it is not a priority (11%).
Language
French speaker respondents are more likely than those who speak English to believe it should be a priority for their community to become dementia-inclusive (60% versus 53%).
Experience with dementia
Respondents who say it is a priority for their community to become dementia-inclusive are more likely than their counterparts to:
know a person living with dementia (61%);
have/had a work (64%) or volunteer (65%) role where they interact with people living with dementia;
say they are knowledgeable of dementia (71%);
say dementia is having a large impact in Canada today (67%);
say they are comfortable interacting with people living with dementia (67%); or,
say they are aware of dementia-inclusive communities (66%).
Qualitative insights
While several were unsure of the feasibility, the majority of focus group participants felt it was important for their community to become more dementia-inclusive, which is in line with qualitative findings. Many participants referenced Canada's aging population as a reason there was an increasing need for individuals and communities to understand and adapt to the needs of people living with dementia. Some participants noted that they themselves might be the next person they knew who was living with dementia, and this idea that it could "strike anyone" made participants feel that dementia inclusion was important. A few felt that communities becoming more dementia-inclusive was akin to any other act of human decency, in that everyone should help one another, regardless of who they are or what they may be living with.
"En vérité, dans ma communauté (religieuse) c'est important d'aider tous les gens dans notre communauté même s'ils ont la démence." (In truth, in my [religious] community it's important to help all people in our community even if they have dementia.) – Recreational/fitness/community/religious and faith; Quebec
"Huge with the increases in dementia that we are facing. It's going to be important that there's a place for everyone and that we are taking care of one another." – Retail and food services; Atlantic Canada
"I just think 'why not?' Seems like a no-brainer. The things we talked about are things that should be in place regardless of if someone has dementia." – Transportation and public safety; West/Northern Canada
Among those who did not think that it was important for their community to become more dementia-inclusive, their position was usually more in line with apathy rather than opposition to the idea.
Among those who say it should be a priority for their community to become more dementia-inclusive, the most common reasons are to provide a better quality of life for people living with dementia (25%) and so their community is prepared to meet the needs of an aging population (23%). Fewer than one-fifth of respondents express the importance of having an inclusive and supportive community (16%) or believe there are other good benefits (13%). Three in ten (30%) of respondents are unsure why it should be a priority.
Exhibit D12: Q23: Why did you rate the priority for your community to be more dementia-inclusive this way? Open-ended response; response total may be greater than 100%.
Base: Those that said it was a priority (rating 4 or 5 on a 5-point scale) for their community to become more dementia-inclusive (n=3,296).
Figure D12. TitleFigure D12 - Text description
Better quality of life for older people (active, environment, activities, etc)
25%
Being prepared to meet the needs of an aging population
23%
Importance of an inclusive and supportive community
16%
Good benefits
13%
Other priorities are more important/ Community does not need it
3%
Improving education and awareness
2%
Other
6%
DK/NR
30%
Conflicting priorities or not seeing the need are the most common reasons cited (at 26%) among those who do not believe communities becoming more dementia-inclusive is a priority; however, over two in five (43%) of respondents are unable to provide a reason for believing it is not a priority.
Exhibit D13: Q23: Why did you rate the priority for your community to be more dementia-inclusive this way? Open-ended response; response total may be greater than 100%.
Base: Those that said it was not a priority (rating 1 or 2 on a 5-point scale) for their community to become more dementia-inclusive.
Figure D13. TitleFigure D13 - Text description
Other priorities are more important/ Community does not need it
26%
Being prepared to meet the needs of an aging population
8%
Better quality of life for older people (active, environment, activities, etc)
3%
Importance of an inclusive and supportive community
3%
Improving education and awareness
2%
Other
18%
DK/NR
43%
Most respondents (82%) select 'don't know' or 'prefer not to say' when asked if their community has a guide or plan in place to be more dementia-inclusive, while 13% say it does not, and a handful (5%) say it does.
Exhibit D14: Q24: Do you know if your community has a guide or plan in place to be more dementia-inclusive?
Base: All respondents (n=6,049).
Figure D14. TitleFigure D14 - Text description
My community does have a guide or plan in place
5%
My community does not have a guide or plan in place
13%
DK/NR
82%
Key demographic differences for the target audiences for this research are shown in the chart below:
While the majority of unpaid caregivers and those who are not unpaid caregivers do not know if their community has a plan in place to become more dementia-inclusive (66% and 89%, respectively), unpaid caregivers are more likely to have conviction that it does (10%) or does not (24%).
Exhibit D15: Q24: Do you know if your community has a guide or plan in place to be more dementia-inclusive?
Base: All respondents.
Figure D15. TitleFigure D15 - Text description
Column %
Unpaid caregiver (n=1,869)
Non-unpaid caregiver (n=4,180)
My community does have a guide or plan in place
10%
2%
My community does not have a guide or plan in place
24%
9%
DK/NR
66%
89%
Qualitative insights
When it came to the implementation of a community's plan to become more dementia-inclusive, focus group participants had little trouble citing potential challenges or barriers to doing so. While no single barrier was cited by a majority of participants, the most common mentions were: funding or other fiscal responsibilities; the complexity of dementia, the varying needs of people living with dementia, the implementation challenges of such measures in a community or geography, and apathy or lack of public awareness.
"Just don't think it's a focus. Governments are more focused on putting the money in other places." – Financial services; Atlantic Canada
"On vit dans une société qui est de plus en plus individualiste et on devrait prendre davantage attention aux autres."(We live in a society who is becoming more individualistic, and we should pay attention to others other much more.) – Recreational/fitness/community/religious and faith; Quebec
A strong majority of respondents are unable to name any measures a dementia-inclusive community might provide on an unaided basis. Nearly one-fifth (19%) think general care and other supports might be provided in such a community, and 13% cite recreational, social, and educational activities. Nearly one in ten (9%) respondents think safe spaces and opportunities to be outdoors might be a feature of dementia-inclusive communities.
Exhibit D16: Q25: What measures or activities, if any, do you think a dementia-inclusive community might provide? Open-ended response; response total may be greater than 100%.
Base: All respondents (n=6,049).
Figure D16. TitleFigure D16 - Text description
Care and other supports are available
19%
Recreational, social and education activities
13%
Safe spaces and opportunity to be outdoors and active
9%
Supports aging in place/familiar surroundings and lifestyle (pets, independence, housing, etc)
Focus group participants were asked to consider what their own community would need to change to be more inclusive and supportive of people living with dementia. Commonly, participants appeared to get stuck on their idealized image of a dementia-inclusive community, that in most cases was highly segregated, instead of considering how their communities could progressively improve inclusion of people living with dementia.
Among those who did not have a utopic image, the most common improvement was on knowledge and awareness. These participants felt that if more people were aware of and familiar with dementia, their communities would naturally become more dementia-inclusive. As is common in these types of discussions, a few participants cited a change in their mindset due to their participation in this research topic as evidence of the impact of awareness and familiarity. Others noted the benefit of tailored infrastructure (specifically, signage), programs, and transportation.
"I don't find dementia is top of mind for people. Increasing knowledge would increase inclusion." – Retail and food services; Ontario
"You don't need to do everything at once. Start with big signage and you go from there. You make baby steps." – Financial services; Ontario
Among the dementia-inclusive measures tested below, no single measure is recognized at the community level by a majority of respondents, however, one-third or more say that their community has inclusive crosswalks (37%), well-maintained pathways (34%) and easily recognizable transit signs (33%). Rounding out the top five most common community measures are well-lit sidewalks and outdoor spaces (29%), and wide sidewalks absent of obstructions (26%). One-quarter of respondents say their community has ample outdoor seating (25%) or easy to recognize public washrooms (24%). The remaining respondents are unsure of the measures in place in their community (22%) or say their community has none of the measures tested (16%).
Exhibit D17: Q26: From the following list, please indicate which, if any, of the following measures your community has in place that contribute to making a community more dementia-inclusive? Select all that apply; response total may be greater than 100%.
Base: All respondents (n=6,049).
Figure D17. TitleFigure D17 - Text description
Well-signed crosswalks with advance crossing for pedestrians and / or audio signals
37%
Well-maintained sidewalks and pathways
34%
Easy to recognize public transit signs such as bus stops and subway entrances
33%
Well-lit sidewalks and public outdoor spaces
29%
Wide sidewalks and pathways with no or very few obstructions
26%
Ample outdoor seating
25%
Easy to recognize public washrooms
24%
None of the above
16%
DK/NR
22%
Key demographic differences for the target audiences for this research are shown in the chart below:
While unpaid caregivers are more likely to say that their community has put all suggested measures in place, those who are not unpaid caregivers are more likely to say that they do not know of their community's measures (27% compared to 11%).
Exhibit D18: Q26: From the following list, please indicate which, if any, of the following measures your community has in place that contribute to making a community more dementia-inclusive? Select all that apply; response total may be greater than 100%.
Base: All respondents.
Figure D18. TitleFigure D18 - Text description
Column %
Unpaid caregiver (n=1,869)
Non-unpaid caregiver (n=4,180)
Well-signed crosswalks with advance crossing for pedestrians and / or audio signals
40%
36%
Well-maintained sidewalks and pathways
38%
33%
Easy to recognize public transit signs such as bus stops and subway entrances
37%
32%
Well-lit sidewalks and public outdoor spaces
32%
28%
Wide sidewalks and pathways with no or very few obstructions
29%
25%
Ample outdoor seating
29%
23%
Easy to recognize public washrooms
29%
21%
None of the above
15%
16%
DK/NR
11%
27%
Other quantitative demographic differences include:
Gender
Those who identify as women are more likely than those who identify as a man to say their community has put in place easy to recognize signs such as bus stops and subway entrances (35% versus 31%) and wide sidewalks and pathways with no or very few obstructions (28% versus 25%).
Age
Respondents between the ages of 18 and 34 years are less likely than respondents in any other age group to say their community has none of the measures in place (10%) or that they "don't know" (15%).
Region
Respondents in Atlantic Canada (27%) and Manitoba/Saskatchewan (24%) are the most likely to say that their community has 'none of the above' measures in place to contribute to making a community more dementia-inclusive.
Size of community
At 29%, respondents who live in a rural or remote community are more likely to say their community has 'none of the above' measures that contribute to making a community more dementia-inclusive.
Experience with dementia
Respondents are more likely than their counterparts to say their community has all or most of the listed measures in place if they:
know a person living with dementia;
have/had a work or volunteer role where they interact with people living with dementia;
are aware of dementia-inclusive communities;
feel that communities should prioritize becoming dementia-inclusive; or,
have received training on how to interact with people living with dementia.
Respondents are less likely than their counterparts to say their community has all or most of the listed measures in place if they:
say they are not knowledgeable of dementia; or,
say they are not comfortable interacting with people living with dementia.
Two in five (41%) respondents say they do not know if their community offers any of the dementia-inclusive activities listed, though a similar proportion (37%) say their community centre provides dementia-inclusive activities. One-fifth of respondents say their community provides peer support groups (22%) and cultural activities (21%). 14% of respondents say that intergenerational programs are available in their community, while 11% say that their community does not provide any of these activities.
Exhibit D19: Q27: Thinking of activities designed specifically to welcome and include people living with dementia in your community, to the best of your knowledge, which, if any, of the following does your community provide? Select all that apply; response total may be greater than 100%.
Base: All respondents (n=6,049).
Figure D19. TitleFigure D19 - Text description
Community centre activities
37%
Peer support groups
22%
Cultural activities such as participating in dance sessions and visiting museums
21%
Intergenerational programs
14%
None of the above
11%
DK/NR
41%
Key demographic differences for the target audiences for this research are shown in the chart below:
While unpaid caregivers are more likely to say that their community offers each of the activities listed, those who are not unpaid caregivers are more likely to say that they do not know what activities their community offers (50% compared to 22%).
Exhibit D20: Q27: Thinking of activities designed specifically to welcome and include people living with dementia in your community, to the best of your knowledge, which, if any, of the following does your community provide? Select all that apply; response total may be greater than 100%.
Base: All respondents.
Figure D20. TitleFigure D20 - Text description
Column %
Unpaid caregiver (n=1,869)
Non-unpaid caregiver (n=4,180)
Community centre activities
45%
33%
Peer support groups
32%
18%
Cultural activities such as participating in dance sessions and visiting museums
29%
18%
Intergenerational programs
20%
12%
None of the above
12%
11%
DK/NR
22%
50%
Other quantitative demographic differences include:
Gender
Those who identify as a woman are more likely than those who identify as a man to say their community offers community centre activities (39% versus 34%), whereas they are less likely to say it offers cultural activities (20% versus 23%).
Age
Respondents between the ages of 18 and 34 years are the least likely to say they "don't know" what, if any, activities their community offers (31%), while respondents who are 65 years or older are the most likely to (46%).
Region
Respondents in Atlantic Canada are the most likely to say that their community offers 'none of the above' activities designed specifically to welcome and include people living with dementia (20%); respondents in Quebec are the most likely to say they "don't know" (50%); and respondents in the Territories are more likely than respondents in any other region across Canada to say that their community offers each of the activities listed.
Qualitative insights
Awareness of community measures or activities in place that support inclusion of people living with dementia was very low among focus group participants. The handful of responses offered by participants were the Alzheimer's Society, long-term care facilities, seniors' groups, community centres, and home and community support services.
"The Alzheimer's Society has a lot of events in the community." – Financial services; Atlantic Canada
"Local community centers that can offer specific programs" – Financial services; Ontario
Conclusions
Participants' and respondents' experiences with people living with dementia vary widely. Most are aware of dementia, many of which are knowledgeable of the symptoms associated and can define the illness, and the majority personally know someone who has lived with or is living with dementia. Furthermore, one-third of survey respondents are or have been an unpaid caregiver of someone living with dementia recently (in the past five years), and one-quarter have had a work or volunteer role that required them to interact with people living with dementia.
Few dispute the impact dementia has in Canada today, including half of survey respondents who believe it is having a large impact. Focus group participants note Canada's aging population and prevalence of dementia and feel that they or someone close to them could very well be the next person they know who is diagnosed with dementia.
All considered, stigma still plays an important role in contextualizing perceptions of dementia. There are varying degrees of stigmatization based upon one's views when it comes to how realistic it is for people living with dementia to continue to have an engaged, participatory life within their existing community, and to what extent, if any, that the quality of life of a person living with dementia is impacted.
As previous public opinion research has noted, the most common experiences faced by unpaid caregivers are having people talk to them instead of the person living with dementia, and encountering people who focus on what the person with dementia cannot do rather than what they can. Encouragingly, a majority of unpaid caregivers were either unable to name any challenges they have faced accessing dementia resources or say they have not faced any challenges at all.
Reported level of comfort interacting with people living with dementia among survey respondents and focus group participants shows room for growth. Fewer than half of survey respondents say they are comfortable interacting with people living with dementia and many focus group participants express uncertainty, unease, or worry when asked how they would react if they saw a client or customer who appeared lost or confused.
This comfort may stem, at least in part, by the proportion of organizations who provide training to their employees or volunteers on how to interact with people living with dementia, which appears to be around half, at most. While half of organizations may offer this training, it appears that the content may not be tailored specifically to dementia in many cases. Regardless, fewer than half of survey respondents believe their organization provides enough training, and most focus group participants felt that they would benefit from more.
Most respondents and participants would not necessarily recognize all the behaviours or symptoms that are associated with dementia, like mobility issues or spatial awareness, and some participants assumed they interact with people living with dementia unbeknownst to them. As a few participants noted, increased awareness and familiarity of dementia (beyond its most extreme symptoms) may increase comfort (and inclusion, noted below) naturally.
As it relates to dementia-inclusive communities, awareness appears to be in its infancy, and as was evidenced by the focus group discussions, impressions of these communities are often utopic or otherwise could be considered dementia-exclusive. Furthermore, a strong majority of survey respondents and focus group participants are unable to name on an unaided basis any measures a dementia-inclusive community might provide. Despite being shown possible measures that could be taken to make a community more dementia-inclusive, many participants continued to question the feasibility of such a community.
This research demonstrates that most believe their communities should take necessary steps to encourage healthy aging and become dementia-inclusive. While some note dementia-inclusive activities available in their community (at community centres, for example), and supportive physical features (for example, well-lit sidewalks, clear signage, and outdoor seating), others (in the focus groups) note other unavoidable hazards (like traffic and crime).
An important component of this research was the exploration of the findings among key audiences identified by PHAC, which, again, are key employment industries, specific ethnic and cultural communities, unpaid caregivers of people living with dementia, and 2SLGBTQ+ identity. While significant differences by question have been identified and illustrated throughout, this research suggests that one's personal experience with dementia (most commonly relationships with people living with dementia) underpins one's awareness, knowledge, and perceptions of dementia (more so than demographic differences).
In summary, while study participants represent a variety of experiences with and perceptions of dementia, there continues to be an appetite for learning more about dementia, including how to improve the inclusion of and quality of life for people living with the disease. Overcoming a lack of knowledge about dementia or how best to interact with people living with dementia is likely a bigger hurdle than any that stigma about dementia itself presents.
Appendix A: Qualitative methodology report
Methodology
The first phase of the research was qualitative and involved online focus groups.
To begin, we conducted a series of sixteen (16) online discussion groups between April 3 and 5, 2023. The target audiences included adults aged 18 and older who work in retail and food services; transportation and public safety; religious, faith, recreational, fitness, and community services; and financial services. Within each of these industry sectors, participants were screened to ensure they work in a role in which they interact with members of the general public.
One discussion group among each of the four target audience was conducted with residents of Atlantic Canada (Newfoundland, Prince Edward Island, Nova Scotia, New Brunswick), Quebec, Ontario, and the West/Northern Canada (Manitoba, Saskatchewan, Alberta, British Columbia, Yukon, Northwest Territories, Nunavut). The discussions in Quebec were conducted in French, while all other were conducted in English.
Additionally, four of the discussion groups, one with each of the four target audiences, were conducted with residents of communities with older populations. In Atlantic Canada, we conducted the group with those in financial services; in Quebec, we conducted the group with those in retail and food services; in Ontario, we conducted the group with those in transportation and public safety; and in the West, we conducted the group with those in religious, faith, recreational, fitness and community services.
Participants were asked for consent for recording of all sessions and were provided an honorarium of $150 in appreciation of their time.
All participants were offered the opportunity to participate in their official language of choice irrespective of their location in Canada to accommodate those in official language minority communities (OLMCs).
The breakdown of the focus groups by target audience, region, language [in brackets] and number of participants (in brackets) is summarized in the table below:
Target audience
Atlantic Canada
Quebec
Ontario
West/Northern Canada
Total
Retail and food services
1
(6)
1
(9; residents of communities with older populations)
1
(10)
1
(9)
4
(34)
Transportation and public safety
1
(6)
1
(10)
1
(7; residents of communities with older populations)
1
(8)
4
(31)
Religious, faith, recreational, fitness, and community services
1
(8)
1
(8)
1
(7)
1
(6; residents of communities with older populations)
4
(29)
Financial services
1
(7; residents of communities with older populations)
1
(9)
1
(9)
1
(10)
4
(35)
Total
4 (27)
4 (36)
4 (33)
4 (33)
16 (129)
Recruitment
Participants were recruited using the recruitment screener in Appendix B. Ten (10) participants were recruited for each focus group.
The screener contained a series of standard screening questions to ensure participants qualified based on their age, region, employment industry, and community size, ensuring a good mix of other demographics such as gender, household income, location, etc.
Our fieldwork subcontractor, Quality Response, relied on panels and databases of Canadians. This is the approach employed most often. Quality Response reaches out to members of their database first via email and follows-up with telephone calls to pre-qualify respondents.
Quality Response's database includes approximately 35,000 Canadians with profiling on a range of attributes including standard personal demographics, household composition, medical background, technology usage, financial services, health and wellness, business profiles, and other relevant criteria. Their database is constantly being updated and replenished and operates out of their own, onsite telephone room in Toronto, Ontario. Potential group participants are recruited to their database via mixed-mode: following a proprietary telephone survey, online, referral, social media and print advertising. Initial contact is often made via email or online pre-screening for speed and economies, followed up by personal telephone recruitment and pre-group attendance confirmation.
Quality Response supplemented their recruitment with qualitative panel partners for specific areas including Metroline (Atlantic Canada; 4,500 Canadians), Brookson Research (Atlantic Canada; 9,500 Canadians); MBA Recherche (Quebec; 35,000 Canadians), Pele Research (Western and Northern Canada; 3,000 Canadians), Qualitative Coordination (Western and Northern Canada; 5,500 Canadians), and Walmsley (Western and Northern Canada; 5,500 Canadians).
While qualitative research and their panels more generally are not meant to be representative of the general population in Canada, every attempt is made to ensure each panel composition is reflective of the general population by region, age, and gender.
Quality Response understands the nuances of qualitative recruiting and the importance of locating qualified, interested respondents. Their recruiting is undertaken in strict accordance with the Standards for the Conduct of Government of Canada Public Opinion Research – Qualitative Research.
Reminder calls were made prior to the groups to confirm participants' intention to attend and to encourage higher rates of participation.
Moderation
Two senior researchers were used to moderate the online focus groups. Upon completion of the initial focus groups, moderators met and compared their findings and thoughts about the groups. The moderators conferred with each other after each subsequent set of focus groups, again comparing findings to confirm the effectiveness of the discussion guide (in Appendix C). In this instance, the discussion guide was not changed.
A note about interpreting qualitative research results
It is important to note that qualitative research is a valid form of scientific, social, policy, and public opinion research. However, focus group research is not designed to help a group reach a consensus or to make decisions, but rather to elicit the full range of ideas, attitudes, experiences and opinions of a selected sample of participants on a defined topic, as was done in this research. Because of the small numbers involved the participants cannot be expected to be thoroughly representative in a statistical sense of the larger population from which they are drawn and findings cannot reliably be generalized beyond their number.
Glossary of terms
The following is a glossary of terms which explains the generalizations and interpretations of qualitative terms used throughout the report. These phrases are used when groups of participants share a specific point of view and emerging themes can be reported. Unless otherwise stated, it should not be taken to mean that the rest of participants disagreed with the point; rather others either did not comment or did not have a strong opinion on the question.
Generalization
Interpretation
Few
Few is used when less than 10% of participants have responded with similar answers.
Several
Several is used when more than 10% but fewer than 20% of the participants responded with similar answers.
Some
Some is used when more than 20% but significantly fewer than 50% of participants respondents with similar answers.
Many
Many is used when nearly 50% of participants responded with similar answers.
Plurality
Plurality is used when noting the most common response, despite the response being shared by fewer than 50% of the participants.
Majority
Majority is used when more than 50% but fewer than 75% of the participants responded with similar answers.
Most
Most is used when more than 75% of the participants responded with similar answers.
Vast majority
Vast majority is used when nearly all participants responded with similar answers, but a few had differing views.
Unanimous/Almost all
Unanimous or almost all are used when all participants gave similar answers or when the vast majority of participants gave similar answers and the remaining few declined to comment on the issue in question.
Appendix B: Recruitment Screener
Focus Group Summary
Sixteen (16) focus groups total
Recruit 10 participants for each group
Focus groups are approximately 90 minutes in length
All must work in specific service-sector industries (see below) and in a role in which they interact with members of the general public
Four (4) focus groups with people who work in each of the following industry sectors:
Retail/Food services
Transportation/Public safety
Recreational/Fitness/Community/Religious/Faith
Financial services
Four (4) focus groups in each of four (4) regions, including one group in each region in communities with older populations:
West/North (Yukon, Northwest Territories, Nunavut, British Columbia, Alberta, Saskatchewan, and Manitoba)
Ontario
Quebec
Atlantic Canada (New Brunswick, Nova Scotia, Prince Edward Island, and Newfoundland and Labrador)
Ensure good mix of other demos (province within regions, age, gender, income, education, household type, ethnic/cultural background, etc.)
Focus group schedule by audience and region
Group #
Date
Audience
Region
Time
1
Monday, April 3, 2023
Retail/Food services
Atlantic Canada (EN)
4:00 pm ET/5:00 pm AT/ 5:30 pm NT
2
Monday, April 3, 2023
Retail/Food services in communities with older populations
Quebec (FR)
6:00 pm ET
3
Monday, April 3, 2023
Transportation/Public safety in communities with older populations
Ontario (EN)
6:00 pm ET
4
Monday, April 3, 2023
Retail/Food services
West/North (EN)
8:00 pm ET/7:00 pm CT/6:00 pm MT/5:00 pm PT
5
Monday, April 3, 2023
Transportation/Public safety
West/North (EN)
8:00 pm ET/7:00 pm CT/6:00 pm MT/5:00 pm PT
6
Tuesday, April 4, 2023
Recreational/Fitness/Community/
Religious/Faith
Atlantic Canada (EN)
4:00 pm ET/5:00 pm AT/5:30 pm NT
7
Tuesday, April 4, 2023
Transportation/Public safety
Atlantic Canada (EN)
4:00 pm ET/5:00 pm AT/5:30 pm NT
8
Tuesday, April 4, 2023
Transportation/Public safety
Québec (FR)
6:00 pm ET
9
Tuesday, April 4, 2023
Retail/Food services
Ontario (EN)
6:00 pm ET
10
Tuesday, April 4, 2023
Recreational/Fitness/Community/
Religious/Faith in communities with older populations
West (EN)
8:00 pm ET/7:00 pm CT/6:00 pm MT/5:00 pm PT
11
Tuesday, April 4, 2023
Financial services
West/North (EN)
8:00 pm ET/7:00 pm CT/6:00 pm MT/5:00 pm PT
12
Wednesday, April 5, 2023
Financial services in communities with older populations
Atlantic Canada (EN)
4:00 pm ET/6:00 pm AT/5:30 pm NT
13
Wednesday, April 5, 2023
Recreational/Fitness/Community/
Religious/Faith
Quebec (FR)
5:00 pm ET
14
Wednesday, April 5, 2023
Financial services
Quebec (FR)
7:00 pm ET
15
Wednesday, April 5, 2023
Recreational/Fitness/Community/
Religious/Faith
Ontario (EN)
6:00 pm ET
16
Wednesday, April 5, 2023
Financial services
Ontario (EN)
8:00 pm ET
Hello/Bonjour, this is _______________ calling on behalf of Earnscliffe, a national public opinion research firm. We are organizing a series of discussion groups on issues of importance on behalf of the Government of Canada, specifically the Public Health Agency of Canada (PHAC). We are looking for people who would be willing to participate in an online discussion group that will last up to 90 minutes. Up to 10 participants will be taking part and for their time, participants will receive an honorarium of $150. May I continue?
Yes [continue]
No [thank and terminate]
Would you prefer that I continue in English or French? Préférez-vous continuer en français ou en anglais? [If French, continue in French or arrange a call back with French interviewer: Nous vous rappellerons pour mener cette entrevue de recherche en Français. Merci. Au revoir].
Participation is voluntary. We are interested in hearing your opinions; no attempt will be made to sell you anything or change your point of view. No opinions shared during the focus group will be attributed to any individual, and all views expressed will be grouped together to ensure no particular individual is identified.
But before we invite you to attend, we need to ask you a few questions about your demographics and employment information to ensure that we get a good mix and variety of people. If you are not eligible for the focus group then any information you provide will be immediately deleted. Your personal information is governed by the Privacy Act. Please let me know if you would like additional details on how your personal information will be collected, used and disclosed, or for more information about your privacy rights [additional privacy information appended to the end of the screener]. May I ask you a few questions? This will only take about 5 minutes.
Yes [continue]
No [thank and terminate]
Monitoring text:
[read to all]: "This call may be monitored or audio taped for quality control and evaluation purposes."
[additional clarification if needed]:
To ensure that I (the interviewer) am reading the questions correctly and collecting your answers accurately;
To assess my (the interviewer) work for performance evaluation;
To ensure that the questionnaire is accurate/correct (i.e. evaluation of programming and methodology – we're asking the right questions to meet our clients' research requirements – kind of like pre-testing)
If the call is recorded, it is only for the purposes of playback to the interviewer for a performance evaluation immediately after the interview is conducted or it can be used by the Project Manager/client to evaluate the questionnaire if they are unavailable at the time of the interview – all audio tapes are destroyed after the evaluation.
Which of the following age categories do you fall in to? Are you…?
[ensure good mix]
Under 18 years 1 [thank and terminate]
18-24 years 2
25-29 years 3
30-34 years 4
35-44 years 5
45-54 years 6
55-64 years 7
65-74 years 8
75+ 9
Don't know/Prefer not to answer 99 [thank and terminate]
Do you or does anyone in your immediate family or household work in any of the following areas?
A marketing research firm
A magazine or newspaper, online or print
A radio or television station
A public relations company
An advertising agency or graphic design firm
An online media company or as a blog writer
The government, whether federal, provincial or municipal
[if "yes" to any of the above, thank and terminate]
What is your current employment status?
Working full-time 1
Working part-time 2
Self-employed 3
Retired 4 [thank and terminate]
Unemployed 5 [thank and terminate]
Student 6 [thank and terminate]
Other 7 [thank and terminate]
Prefer not to answer 9 [thank and terminate]
As part of your day-to-day work responsibilities [or "In your role"], do you regularly interact with customers/clientele or members of the general public?
Yes 1 [continue]
No 2 [thank and terminate]
Don't know/Prefer not to answer 9 [thank and terminate]
Which of the following best describes the industry sector in which you work?
Retail (e.g., grocery stores, pharmacies, hardware) 1 [continue to q6]
Food service (e.g., restaurants, coffee shop, fast food) 2 [continue to q6]
Transportation (e.g., public transit, air/train travel) 3 [skip to q7]
Public safety (e.g., police, firefighter, paramedic) 4 [skip to q7]
Recreational / Fitness (e.g., fitness centers, community
sports centers) 5 [skip to q8]
Community and religious/Faith (e.g., community
centers with programs, housing supports,
churches, mosques, synagogues) 6 [skip to q8]
Financial services (e.g., banks, credit unions) 7 [skip to q9]
Other (please specify) 8
None of the above 9 [thank and terminate]
Don't know/Prefer not to answer 99 [thank and terminate]
[if works in retail/food services] In which type of retail or food services establishment do you work?
Fast food chain/restaurant 1 [aiming for one]
Coffee shop (local or chain) 2 [aiming for two]
Large home improvement store 3 [aiming for one]
Local convenience store 4 [aiming for one]
Specialty store (clothing, footwear, etc.) 5 [aiming for two]
Pharmacy 6 [aiming for one]
Large grocery store 7 [aiming for one]
Small grocery store 8 [aiming for one]
None of the above 9 [thank and terminate]
Don't know/Prefer not to answer 99 [thank and terminate]
[if works in transportation and/or public safety] In which type of transportation and/or public safety establishment do you work?
Public transit (i.e., bus driver, meter ticket seller, etc.) 1 [aiming for four]
Air travel (in person service) 2 [aiming for two]
Train travel (in person service) 3 [aiming for two]
First responder (i.e., police, firefighter, paramedic) 4 [aiming for two]
None of the above 5 [thank and terminate]
Don't know/Prefer not to answer 9 [thank and terminate]
[if works in recreation/fitness/community/religious/faith] In which type of recreational/fitness/community/religious/faith establishment do you work?
Private fitness centre 1 [aiming for two]
Community centre with recreational/fitness programs 2 [aiming for four]
Housing supports 3 [aiming for one]
Church, mosque, synagogue 4 [aiming for three]
None of the above 5 [thank and terminate]
Don't know/Prefer not to answer 9 [thank and terminate]
[if works in financial services] In which type of financial services establishment, do you work?
Bank (i.e., teller, client services) 1 [aiming for three]
Credit union 2 [aiming for three]
Other (i.e., insurance, financial planning, etc.) 3 [aiming for four]
None of the above 4 [thank and terminate]
Don't know/Prefer not to answer 9 [thank and terminate]
In which province or territory do you live?
Atlantic Canada
Newfoundland and Labrador 1
Prince Edward Island 2
Nova Scotia 3
New Brunswick 4
Quebec 5
Ontario 6
West/North
Manitoba 7
Saskatchewan 8
Alberta 9
British Columbia 10
Nunavut 11
Northwest Territories 12
Yukon 13
In which community do you reside?
[to qualify for groups 2, 3, 10, 12, (those who reside in communities with older populations), participant must reside in one of these communities]
Eensure good mix]
Atlantic Canada
Corner Brook, Newfoundland and Labrador 1
Clarenville, Newfoundland and Labrador 2
Gander, Newfoundland and Labrador 3
Stephenville, Newfoundland and Labrador 4
Grand Falls-Windsor, Newfoundland and Labrador 5
Summerside, Prince Edward Island 6
Three Rivers, Prince Edward Island 7
Stratford, Prince Edward Island 8
Cornwall, Prince Edward Island 9
Bridgewater, Nova Scotia 10
Truro, Nova Scotia 11
Kentville, Nova Scotia 12
Yarmouth, Nova Scotia 13
Wolfville, Nova Scotia 14
Shediac, New Brunswick 15
Edmundston, New Brunswick 16
Bathurst, New Brunswick 17
Campbellton, New Brunswick 18
Woodstock, New Brunswick 19
West
Dauphin, Manitoba 35
Selkirk, Manitoba 36
Neepawa, Manitoba 37
Gimli, Manitoba 38
Stonewall, Manitoba 39
Humboldt, Saskatchewan 40
Melfort, Saskatchewan 41
Weyburn, Saskatchewan 42
Swift Current, Saskatchewan 43
Yorkton, Saskatchewan 44
Vegreville, Alberta 45
Stettler, Alberta 46
Innisfail, Alberta 47
Camrose, Alberta 48
Olds, Alberta 49
Westlock, Alberta 50
Sidney, British Columbia 51
Qualicum Beach, British Columbia 52
Oak Bay, British Columbia 53
Parksville, British Columbia 54
White Rock, British Columbia 55
Osoyoos, British Columbia 56
Creston, British Columbia 57
Duncan, British Columbia 58
What gender do you identify with?
[ensure good mix]
Male 1
Female 2
Other (please specify) 3
Prefer not to answer 9
Which of the following categories best describes your total household income; that is, the total income of all persons in your household combined, before taxes? [read list]
[ensure good mix]
Under $20,000 1
$20,000 to under $40,000 2
$40,000 to under $60,000 3
$60,000 to under $80,000 4
$80,000 to under $100,000 5
$100,000 to under $150,000 6
$150,000 or more 7
Don't know/Prefer not to answer 9 [thank and terminate]
What is the last level of education that you have completed?
[ensure good mix]
Some high school or less 1
Completed high school 2
Some college/university 3
Completed college/university 4
Post-graduate studies 5
Don't know/Prefer not to answer 9 [thank and terminate]
What is your racial and/or ethnic background? [select all that apply]
[ensure good mix as best possible]
Black (African, Afro-Caribbean, African-Canadian descent) 1
East Asian (Chinese, Korean, Japanese, Taiwanese descent) 2
Indigenous (First Nations, Inuit, Métis) 3
Latin American (Hispanic descent) 4
Middle Eastern (West Asian or North African descent
(Afghan, Egyptian, Iranian) 5
South Asian (Indian, Pakistani, Sri Lankan, Indo-Caribbean descent) 6
Southeast Asian (Filipino, Vietnamese, Cambodian, Thai descent) 7
White (European descent) 8
Prefer not to answer 9
This research will require participating in a video call online.
Do you have access to a computer, smartphone or tablet with high-speed internet which will allow you to participate in an online discussion group?
Yes [continue]
No [thank and terminate]
Does your computer/smartphone/tablet have a camera that will allow you to be visible to the moderator and other participants as part of an online discussion group?
Yes [continue]
No [thank and terminate]
Do you have a personal email address that is currently active and available to you?
Yes [continue, please record email]
No [thank and terminate]
Have you participated in a discussion or focus group before? A discussion group brings together a few people in order to know their opinion about a given subject.
Yes 1 [max 4 per audience]
No 2 [skip to q22]
Don't know/Prefer not to answer 9 [thank and terminate]
When was the last time you attended a discussion or focus group?
If within the last 6 months 1 [thank and terminate]
If not within the last 6 months 2 [continue]
Don't know/Prefer not to answer 9 [thank and terminate]
How many of these sessions have you attended in the last five years?
If 4 or less 1 [continue]
If 5 or more 2 [thank and terminate]
Don't know/Prefer not to answer 9 [thank and terminate]
INVITATION
Participants in discussion groups are asked to voice their opinions and thoughts. How comfortable are you in voicing your opinions in front of others? Are you…? [read list]
Very comfortable 1 [minimum 4 per group]
Fairly comfortable 2 [continue]
Comfortable 3 [continue]
Not very comfortable 4 [thank and terminate]
Not at all comfortable 5 [thank and terminate]
DK/NR 9 [thank and terminate]
Sometimes participants are asked to read text, review images, or type out answers during the discussion. Is there any reason why you could not participate?
Yes 1 [ask q24]
No 2 [skip to q26]
DK/NR 9 [thank and terminate]
Is there anything we could do to ensure that you can participate?
Yes 1 [ask q25]
No 2 [thank and terminate]
DK/NR 9 [thank and terminate]
What specifically? [open end]
[interviewer to note for potential one-on-one interview]
Based on your responses, it looks like you have the profile we are looking for. I would like to invite you to participate in a small group discussion, called an online focus group, we are conducting at [time], on [date]
As you may know, focus groups are used to gather information on a particular subject matter. The discussion will consist of about 10 people and will be very informal.
It will last up to 90 minutes and you will receive $150 as a thank you for your time. Would you be willing to attend?
Yes 1 [recruit]
No 2 [thank and terminate]
Don't know/Prefer not to answer 9 [thank and terminate]
Privacy questions
Now I have a few questions that relate to privacy, your personal information and the research process. We will need your consent on a few issues that enable us to conduct our research. As I run through these questions, please feel free to ask me any questions you would like clarified.
P1) First, we will be providing a list of interviewees' names and profiles (screener responses shared today) to the interviewer so that they can ensure they are speaking with the right individual. Do we have your permission to do this? I assure you it will be kept strictly confidential.
Yes 1 [go to p2]
No 2 [go to p1a]
We need to provide the names and profiles of interviewees (screener responses shared today) because only the individuals invited are allowed to be interviewed and this information is necessary for verification purposes. Please be assured that this information will be kept strictly confidential. [go to p1a]
P1a) Now that I've explained this, do I have your permission to provide your name and profile to the interviewer?
Yes 1 [go to p2]
No 2 [thank & terminate]
P2) A recording of the interview will be produced for research purposes. The recordings will be used by the research professional to assist in preparing a report on the research findings and creating transcripts (if applicable), and may be used by the Government of Canada for internal reporting purposes. Once the research reports are finalized, all recordings will be destroyed.
Do you agree to be recorded for research and reporting purposes only?
Yes 1 [thank & go to p3]
No 2 [read respondent info below & go to p2a]
It is necessary for the research process for us to record the session as the researchers need this material to complete the report.
P2a) Now that I've explained this, do I have your permission for recording?
Yes 1 [thank & go to p3]
No 2 [thank & terminate]
Invitation:
Wonderful, you qualify to participate in one of our discussion sessions. As I mentioned earlier, the group discussion will take place on [date] at [time] for up to 90 minutes.
Focus group schedule by audience and region
Group #
Date
Audience
Region
Time
1
Monday, April 3, 2023
Retail/Food services
Atlantic Canada (EN)
4:00 pm ET/5:00 pm AT/ 5:30 pm NT
2
Monday, April 3, 2023
Retail/Food services in communities with older populations
Quebec (FR)
6:00 pm ET
3
Monday, April 3, 2023
Transportation/Public safety in communities with older populations
Ontario (EN)
6:00 pm ET
4
Monday, April 3, 2023
Retail/Food services
West/North (EN)
8:00 pm ET/7:00 pm CT/6:00 pm MT/5:00 pm PT
5
Monday, April 3, 2023
Transportation/Public safety
West/North (EN)
8:00 pm ET/7:00 pm CT/6:00 pm MT/5:00 pm PT
6
Tuesday, April 4, 2023
Recreational/Fitness/Community/
Religious/Faith
Atlantic Canada (EN)
4:00 pm ET/5:00 pm AT/5:30 pm NT
7
Tuesday, April 4, 2023
Transportation/Public safety
Atlantic Canada (EN)
4:00 pm ET/5:00 pm AT/5:30 pm NT
8
Tuesday, April 4, 2023
Transportation/Public safety
Québec (FR)
6:00 pm ET
9
Tuesday, April 4, 2023
Retail/Food services
Ontario (EN)
6:00 pm ET
10
Tuesday, April 4, 2023
Recreational/Fitness/Community/
Religious/Faith in communities with older populations
West (EN)
8:00 pm ET/7:00 pm CT/6:00 pm MT/5:00 pm PT
11
Tuesday, April 4, 2023
Financial services
West/North (EN)
8:00 pm ET/7:00 pm CT/6:00 pm MT/5:00 pm PT
12
Wednesday, April 5, 2023
Financial services in communities with older populations
Atlantic Canada (EN)
4:00 pm ET/6:00 pm AT/5:30 pm NT
13
Wednesday, April 5, 2023
Recreational/Fitness/Community/
Religious/Faith
Quebec (FR)
5:00 pm ET
14
Wednesday, April 5, 2023
Financial services
Quebec (FR)
7:00 pm ET
15
Wednesday, April 5, 2023
Recreational/Fitness/Community/
Religious/Faith
Ontario (EN)
6:00 pm ET
16
Wednesday, April 5, 2023
Financial services
Ontario (EN)
8:00 pm ET
Can I please confirm your email address so that we can send you the link to the online discussion group?
As we are only inviting a small number of people, your participation is very important to us. If for some reason you are unable to attend, please call us so that we may get someone to replace you. You can reach us at [insert phone number] at our office. Please ask for [name]. Someone will call you in the days leading up to the discussion to remind you.
So that we can call you to remind you about the interview, send you any information or resources in advance, or contact you should there be any changes, can you please confirm your name and contact information for me?
First name
Last Name
Email
Cell phone number
Other phone number
If the respondent refuses to give his/her first or last name, email or phone number please assure them that this information will be kept strictly confidential in accordance with the privacy law and that it is used strictly to contact them to confirm their attendance and to inform them of any changes to the discussion group. If they still refuse thank and terminate.
Additional privacy information (as needed):
Privacy Notice The personal information you provide to the Public Health Agency of Canada (PHAC) will be used by the Dementia Strategic Fund under section 3 of the Public Health Agency of Canada Act and section 3 of the National Strategy for Alzheimer's Disease and Other Dementias Act. It will be handled in accordance with the Privacy Act.
Why are we collecting your personal information? The personal information you provide will be used to determine your eligibility for focus groups that are being conducted to help understand attitudes, knowledge and experiences related to dementia-inclusive communities in Canada.
We will ask you to provide some basic demographic and employment information including age, gender, racial and ethnic background, level of education, income level, province/territory of residence, your employment status, and the industry that you work in to determine your eligibility. If you are eligible to participate then we will ask you to provide your name, email, and phone number to communicate with you about your attendance and to provide you with payment after you attend the focus group.
How will your information be used?
If you are eligible to participate in the focus group, then the answers you provide to me will be shared with the moderator to verify who you are at the beginning of the focus group. After your information is used for verification and communication purposes then it will be deleted. The information that you have provided during the screening will not be connected to the responses that you provide in the focus group.
If you are not eligible to participate in the focus group, then any information that you have provided will be immediately deleted.
What happens if you don't want to provide your personal information? Participation in this screening is voluntary and there are no consequences for not providing any of the requested personal information, but you will not be eligible to participate in the focus groups.
What are your rights? You have the right to access and request a correction and/or notation to your personal information You also have a right to complain to the Privacy Commissioner of Canada if you feel your personal information has been handled improperly. For more information about these rights, or about how we handle your personal information, please contact the Secretariat at
phacdementiapolicyaspcpolitiquessurlademence@phac-aspc.gc.ca.
For more information: The collection of your personal information is described in Info Source at infosource.gc.ca. Refer to the personal information bank (PIB) Outreach Activities – PSU938.
Appendix C: Discussion guide
Discussion Guide
Introduction
Section time: 10 min / Cumulative time: 10 min
Moderator introduces themselves (including pronouns) her/his/their role, the name of the firm the moderator works for, and the type of firm that employs them (that is, an independent marketing research firm).
Role of moderator: to ask questions, make sure everyone has a chance to express themselves, keep track of the time, assures participants that moderator has no special interest in, or knowledge of, the issues discussed.
Role of participants: speak openly and frankly about opinions, remember that there are no right or wrong answers and no need to agree with each other.
Results are confidential and reported all together/individuals are not identified/participation is voluntary.
The length of the session (1.5 hours).
The presence of any observers, their role and purpose, and the means of observation (observers viewing and listening in remotely).
The presence and purpose of any recording being made of the session.
Confirm participants are comfortable with the platform and some of the specific settings such as: how to mute and unmute themselves; where the hand raise button is; and the chat box.
As mentioned when we invited you to participate in this discussion group, we're conducting research on behalf of the Government of Canada. These groups are being conducted for the Public Health Agency of Canada (PHAC), more specifically, to explore matters related to dementia.
[Moderator will ask participants to introduce themselves.]
Introduction of participants: To get started, let us introduce ourselves.
As you know, my name is Stephanie. I have been in public opinion research for 25 years and have a passion for qualitative research and getting to meet and speak with interesting people like yourselves. / As you know, my name is Doug. I became a researcher 30 years ago and I have come to truly love finding out what people think about all kinds of different topics and issues.
Now let us go around the virtual room. Please tell us what you feel comfortable sharing about yourself including your first name, in which type of establishment you work, what your role is in your workplace, and where you're joining us from, including whether you reside in an urban, suburban, or rural community.
Personal awareness and experience with dementia (Section time: 10 min / Cumulative time: 20 min)
[hands up] How many of you are aware of the term 'dementia'?
[hands up] Does anyone know someone living with or who has lived with dementia?
Can you please tell us what your relationship is/was with that person?
[hands up] Has anyone provided care to a person living with dementia?
Can you please describe your experience (that is, for whom did you provide care, for how long did you/have you provided care, what did you assist with)?
Was this paid or unpaid care?
General understanding and perceptions related to dementia (Section time: 10 min / Cumulative time: 30 min)
[projective activity, chat box] Dementia is…?
Please use the chat box to record your answer. You can send your response to "everyone".
[if participants have difficulties recording their responses in the chat, they will be called upon to provide their response verbally.]
What comes to mind when you think of someone living with dementia? Why do you say that?
How would you describe quality of life for people living with dementia generally? Why?
To what extent do you think people living with dementia can remain active, such as working or staying involved in community activities? Why do you say that?
If saying 'it depends', on what specifically?
What behaviours, signs, or symptoms might make you think that a person may be living with dementia? Why do you say that?
What type of physical or cognitive challenges would you expect a person living with dementia might experience? Why do you say that?
To the best of your knowledge, how would you say people living with dementia are affected by those challenges?
For the purposes of our conversation today, dementia is an umbrella term used to describe a set of symptoms affecting brain function that are caused by neurodegenerative and vascular diseases or injuries. It is characterized by a decline in cognitive abilities. These abilities include: memory; awareness of person, place and time; language; basic math skills; judgment; and planning. Dementia can also affect mood and behaviour.
Interactions with people living with dementia in workplace settings (Section time: 20 min / Cumulative time: 50 min)
In your work/workplace, do you or have you ever interacted with people living with dementia?
If yes, how often and what is the nature of that/those interactions? Why do you say that?
What knowledge or expertise do you think you need to best serve people living with dementia? Why?
Are you aware of any recommendations for how best to interact with people living with dementia? What are those?
Can you please share with us your experience in applying these recommendations?
If none raised spontaneously, probe:
Be patient and give time to respond.
Active listening – for example, repeat back the information to confirm you've understood.
Sit or stand at the same level and make eye contact.
Respect physical space.
Avoid assumptions about competency and capacity.
Avoid talking to people living with dementia like they're children.
Avoid sudden movements.
Speak directly to the person speaking with dementia and not their caregiver.
Stand directly in front of them, do not approach from behind.
Thinking specifically about speaking with people living with dementia, are you aware of any specific communication tips? What are those?
Can you please share with us your experience in applying these tips?
If not raised spontaneously, probe:
Use shorter sentences with one point each.
Choose words that express dignity and respect.
Provide reassurance.
Avoid lots of detailed information.
Find a quiet place to talk and lower the volume around you.
Avoid correcting the person.
Be prepared to repeat information or find other ways to express it that are more easily understood.
Try drawing pictures or pointing to objects.
Pay attention to non-verbal cues such as body language, facial expressions, hand gestures and posture.
What would you do if you encountered someone visiting your workplace as a client or customer who appeared to be searching, wandering, or confused? Why?
Workplace setting measures to support clients living with dementia (Section time: 15 min / Cumulative time: 65 min)
[hands up] To the best of your knowledge, are there any measures related to the physical environment (of your workplace) to specifically accommodate and support clients and customers living with dementia?
If yes, what are they?
If yes, have you used these supports or measures in your client interactions?
Can you please describe your experience?
If not mentioned, were they helpful?
Is there anything else that your workplace could do to make things easier / to better support clients living with dementia? What are those?
If none raised spontaneously, probe:
Accommodations such as longer appointments, information provided in larger text, using pictures, following up multiple times (via phone, email, letter) If none raised spontaneously, probe: no loud music / availability of quiet spaces and areas, well lit, appropriate signage, minimizing obstacles for walking, well-signed bathrooms
Are there any other measures, not specifically about the physical environment, in your workplace to specifically accommodate and support clients and customers living with dementia?
[only if time permits] How about people for people living with disabilities more generally? Are there any measures in place at your work to accommodate and support clients and customers with disabilities?
If yes, what are they?
Training and skills development (Section time: 10 min / Cumulative time: 75 min)
Does your place of work provide employees with education and/or training to assist in recognizing and supporting people who may be living with dementia?
If yes, can you provide examples of the training that you received? In other words, what did you learn? What did you find most helpful? Why?
Have you put this learning into practice? Can you please share with us your experience in applying these practices?
If no, to what extent do you think your workplace should start or expand this type of training? Why?
Is it relevant or important in your workplace? Why do you say that?
To the best of your knowledge, are there any barriers or challenges that could restrict your workplace from becoming more supportive and welcoming of people living with dementia? Please explain.
[hands up] Have you ever heard the term 'dementia-inclusive community'?
To the best of your knowledge, what does it mean?
In a dementia-inclusive community, measures are in place that make it possible for people living with dementia to protect and improve their health and wellbeing, live independently, safely navigate and access local activities, and maintain social networks.
Based on what you know or imagine about such a community, perhaps including from our discussion today, would you describe your neighbourhood where you live (since we are now switching away from workplace settings) as a dementia-inclusive community? Why or why not?
If yes, in what ways is your community dementia-inclusive?
What does it look like or have in place?
How important is it for your community to become more dementia inclusive? Why do you say that?
In what ways does your community need to change to be more inclusive and supportive of people living with dementia?
Are you aware of any resources and organizations in your community that support people living with dementia?
What are they?
What are they doing well? Why?
What could be improved? Why?
Are there any barriers or challenges that could restrict your community from becoming more dementia-inclusive? What are they? Please explain.
Conclusion (Section time: 5 min / Cumulative time: 90 min)
[Moderator to request additional questions are sent via the chat box directly to the moderator and probe any additional areas of interest.]
This concludes what we needed to cover.
Does anybody have any final thoughts or comments to pass along?
Thank you! We really appreciate you taking the time to share your views. Your input is very important.
Appendix D: Quantitative methodology report
Methodology
Earnscliffe's overall approach for this study was to conduct a robust general population online survey (minimum n=5,300) in order to achieve sufficient sample across key audiences and demographics. A detailed discussion of the approach used to complete this research is presented below.
Questionnaire design
The questionnaires for this study were designed collaboratively by Earnscliffe and PHAC. The surveys were offered to respondents in both English and French and completed based on their preferences.
Sample design and selection
The sampling plan for the study was designed by Earnscliffe in collaboration with PHAC, and the sample was drawn by Leger based on Earnscliffe's instructions. The surveys were completed using Leger's opt-in online research panel. Digital fingerprinting was used to help ensure that no respondent took the online survey more than once.
The quantitative research sampling plan involved an online survey of 5,000 Canadian residents across the ten provinces, as well as a telephone survey of an additional 300 Canadians living in the territories (comprised of n=100 in each of Nunavut, Yukon, and Northwest Territories). This general population sampling approach would be supplemented with 40 cases, which were estimated in order to achieve a minimum of 100 online survey completions in each of the target audiences (defined below).
The data collection was extended to a total of n=6,049 in order to achieve the desired sample size for each audience as well as preserve the profile of the general population.
In total, the table below shows the estimated incidence, expected sample size and final sample for each target audience:
Gender
Actual proportion
Expected sample
Final sample
Unweighted incidence
Woman
51.40%
2724
3169
53%
Man
48.60%
2576
2703
46%
Age
Actual proportion
Expected sample
Final sample
Unweighted incidence
18-34
27.30%
1447
1539
25%
35-54
34.10%
1807
2260
37%
55+
38.60%
2046
2250
37%
Region
Actual proportion
Expected sample
Final sample
Unweighted incidence
Atlantic Canada (n=100 per province)
6.80%
400
448
7%
Quebec
23.40%
1170
1771
29%
Ontario
38.30%
1865
1938
32%
Manitoba/Saskatchewan (minimum of n=100 per province)
Recreational/fitness activities/community and religious faith organizations
1.6%
100 (including 80 naturally occurring in the core sample and an oversample of 20)
224
4%
Financial services
2.6%
138
105
2%
Caregivers of people living with dementia
Unpaid caregivers
16.0%
800
1869
31%
Ethnic and cultural minority communities
Black
4.3%
228
222
4%
Hispanic (South American)
1.6%
100 (including 80 naturally occurring in the core sample and an oversample of 20)
186
3%
Southeast Asia
7.1%
376
467
8%
South Asian
5.8%
307
330
5%
2SLGBTQ+
4.0%
212
540
9%
All respondents were Canadian adults aged 18 and older. The profile of respondents is that of the general population.
Data collection
The surveys were conducted in English and in French, based on the respondent's preference, between April 21st and May 24th, 2023.
Weighting
In addition to setting quotas, the final data were weighted to replicate actual population distribution by region, age and gender according to the most recent Census data available. In this case, cell-based weighting was conducted whereby a multiplier is applied each respondent so that the final demographic proportions match that of the desired population.
Nonresponse
The potential for non-response bias exists since certain types of people may be less willing to participate in research.
Quality controls
Prior to launching the survey, Earnscliffe tested the links to ensure programming matched the questionnaires. Leger conducted a pre-test of the surveys, and the data was reviewed by Earnscliffe prior to a full launch of the surveys. Upon completion of the pre-test, Earnscliffe reviewed the data to ensure all skip patterns were working and the questionnaire was easily understood by all respondents.
Reporting
Results with upper-case sub-script in the tables presented under a separate cover indicate that the difference between the demographic groups analysed are significantly higher than results found in other columns in the table. In the text of the report, unless otherwise noted, demographic differences highlighted are statistically significant at the 95% confidence level. The statistical test used to determine the significance of the results was the Z-test.
Results – Final dispositions
Online survey
Unresolved (U)
22202
Email invitations bounce back
46
Email invitations unanswered
22156
In-scope non-responding units (IS)
1324
Qualified respondent break-off
1324
Responding units (R)
5749
Completed surveys disqualified - quota filled
0
Completed surveys disqualified for other reasons
0
Completed surveys
5749
Potential sample (U+IS+R)
29275
Response rate = R / (U + IS + R)
19.6%
Telephone survey
Unresolved (U)
626
No answer
626
In-scope non-responding units (IS)
3021
Non-response from eligible respondents
626
Respondent refusals
2059
Language problem
12
Selected respondent not available (illness, leave of absence, vacation, other)
62
Early break-offs
262
Responding units (R)
300
Completed surveys disqualified - quota filled
0
Completed surveys disqualified for other reasons
0
Completed interviews
300
Potential sample (U+IS+R)
3947
Response rate = R / (U + IS + R)
7.6%
Margin of Error
Respondents for the telephone/videoconference survey were selected from among those who have volunteered to participate/registered to participate in online surveys. Because the sample is based on those who initially self-selected for participation in the panel, no estimates of sampling error can be calculated. The results of such surveys cannot be described as statistically projectable to the target population. The treatment here of the non-probability sample is aligned with the Standards for the Conduct of Government of Canada Public Opinion Research for online surveys.
Demographics
While sampling procedures and data weighting are used to ensure the final sample looks like the population at large, by region, age, and gender, there exist other demographic details that can be used to understand the composition of the sample. Those additional demographic details are illustrated below.
Demographic
Weighted
Unweighted
Age
18-24
10%
8%
25-34
17%
17%
35-44
17%
18%
45-54
16%
19%
55-64
18%
18%
65+
24%
20%
Gender identity
Woman
51%
53%
Man
49%
46%
Other gender identity
1%
1%
Region
Atlantic Canada
7%
7%
Quebec
23%
29%
Ontario
39%
32%
Manitoba/Saskatchewan
6%
5%
Alberta
11%
10%
British Columbia
14%
11%
Territories
0%
5%
Sexual orientation
Heterosexual
87%
87%
Lesbian
1%
1%
Gay
3%
3%
Bisexual
3%
3%
Other
2%
2%
Language
English
71%
66%
French
21%
26%
English and French both equally
2%
3%
Other
6%
5%
Demographic
Weighted
Unweighted
Ethnic or cultural identity
Southeast Asian
9%
8%
South Asian
6%
5%
Black
4%
4%
Indigenous
3%
4%
Hispanic
3%
3%
Another ethnic or cultural identity that is non-Caucasian
1%
1%
None of the above
72%
73%
Indigenous identity (among those who identify as Indigenous)
First Nations
61%
55%
Métis
32%
32%
Inuk
3%
11%
None of the above
3%
3%
Education
High school or less
23%
22%
Registered apprenticeship, College, or CEGEP
30%
31%
University certificate or Bachelor's degree
34%
35%
Post graduate degree
12%
12%
Employment status
Student
6%
5%
Employed
59%
63%
Unemployed
6%
6%
Unable to work
3%
3%
Retired
25%
22%
Household income
Under $40,000
19%
18%
Between $40,000 and $59,999
15%
15%
Between $60,000 and $99,999
26%
26%
$100,000 and above
30%
31%
Demographic
Weighted
Unweighted
Community size
Large urban population centre
54%
50%
Medium urban population centre
20%
21%
Small urban population centre
16%
18%
Rural/remote
8%
9%
Appendix E: Online and telephone questionnaire
Landing page for online interviews
Thank you for agreeing to take part in this survey on dementia. We anticipate that the survey will take approximately 15 minutes to complete. [NEXT]
Introduction page for online interviews
Background information
This research is being conducted by Earnscliffe Strategies, a Canadian public opinion research firm on behalf of the Public Health Agency of Canada.
We are asking you to provide your opinions/expertise which will be used to help understand attitudes, knowledge and experiences related to dementia-inclusive communities in Canada. This information will inform efforts and assist in prioritizing options for investments intended to support healthy aging and quality of life through such communities. This research will also deepen understanding of the infrastructure, physical and social environments, and programs and policies available to support dementia-inclusive communities.
How does the online survey work?
You are being asked to offer your opinions and experiences related to dementia-inclusive communities through an online survey.
We anticipate that the survey will take 15 minutes to complete.
Your participation in the survey is completely voluntary.
Your decision on whether or not to participate will not affect any dealings you may have with the Government of Canada.
Responses from incomplete or abandoned surveys will be deleted.
Once you have submitted your survey, it will not be possible to change individual answers.
What about your personal information?
The personal information you provide to the Public Health Agency of Canada is governed in accordance with the Privacy Act and is being collected under the authority of section 4 of the Department of Health Act in accordance with the Treasury Board Directive on Privacy Practices. We only collect the information we need to conduct the research project.
Purpose of collection: We will not ask you to provide us with any information that could directly identify who you are, such as your name, or full date of birth but we require your personal information such as demographic information, views and opinions to better understand the topic of the research. However, your responses are always combined with the responses of others for analysis and reporting.
How will your information be used: We will never use individual responses. The answers you provide will be aggregated and used in internal reports.
Your rights under the Privacy Act: You have a right to complain to the Privacy Commissioner of Canada if you feel your personal information has been handled improperly. For more information about these rights, or about how we handle your personal information, please contact the Public Health Agency of Canada's Privacy Coordinator at 613-948-1219 or privacy-vie.privee@hc-sc.gc.ca.
For any questions for which you are provided with the opportunity to type your own answers, please do not type in any identifiable personal information.
What happens after the online survey?
The final report written by Earnscliffe Strategies will be available to the public from Library and Archives Canada (http://www.bac-lac.gc.ca/).
If you have any questions about the survey, you may contact Earnscliffe Strategies at info@earnscliffe.ca.
Your help is greatly appreciated, and we look forward to receiving your feedback.
[CONTINUE TO Q1]
Introduction for telephone interviews
Background information
This research is being conducted by Earnscliffe Strategies, a Canadian public opinion research firm on behalf of the Public Health Agency of Canada.
We are asking you to provide your opinions/expertise which will be used to help understand attitudes, knowledge and experiences related to dementia-inclusive communities in Canada.
Your participation in the study is voluntary and completely confidential. All your answers will remain confidential and will be combined with responses from all other respondents. Your personal information is governed by the Privacy Act. Please let me know if you would like additional details on how your personal information will be collected, used and disclosed, or for more information about your privacy rights. We anticipate that the survey will take approximately 22 minutes to complete.
[INTERVIEWER NOTE: If respondent requests more information: Read sections a through d of the "What about your personal information?" provided in the online script.]
May we begin?
[CONTINUE TO Q1]
Section 1: Screening
What was your sex at birth? Sex refers to sex assigned at birth.
Male 1
Female 2
Prefer not to answer [TERMINATE] 9
In what year were you born?
[INSERT YEAR]
Prefer not to answer 9
[IF REFUSE TO PROVIDE YEAR] May we place your age into one of the following general age categories?
Under 18 [TERMINATE] 0
18-24 1
25-34 2
35-44 4
45-54 5
55-64 6
65 or older 8
Prefer not to answer [TERMINATE] 9
Which province or territory do you live in?
Newfoundland and Labrador 1
Nova Scotia 2
Prince Edward Island 3
New Brunswick 4
Quebec 5
Ontario 6
Manitoba 7
Saskatchewan 8
Alberta 9
British Columbia 10
Yukon 11
Nunavut 12
Northwest Territories 13
Prefer not to answer [TERMINATE] 99
Section 2: Dementia experience
Now or in the past 10 years, through paid work or as a volunteer, have you been in a role where you have interacted or may need to interact with people living with dementia? Please select all that apply. [SELECT ALL]
No, I have never had such a role whether at work or as a volunteer 0
Yes, I currently work in such a role 1
I used to work in such a role, but I no longer do 2
Yes, I currently volunteer in such a role 3
I used to volunteer in such a role, but I no longer do 4
Don't know 98
Prefer not to answer 99
IF Q5=1 THRU 4 CODE AS EXPERIENCE INTERACTING WITH PLWD
[IF EXPERIENCE INTERACTING WITH PLWD] How frequently do you (or did you) interact with people living with dementia?
Daily 1
A few times a week 2
Weekly 3
A few times a month 4
Monthly 5
Less often than once a month 6
Don't know 98
Prefer not to answer 99
[IF EXPERIENCE INTERACTING WITH PLWD] Which of the following best describes the sector you are or were in when interacting with people living with dementia?
Health care (e.g. hospitals, clinic, long term care, home care) 1
Retail (e.g., grocery stores, pharmacies, hardware) 2
Food service (e.g., restaurants, fast food) 3
Transportation (e.g., public transit, air and train travel) 4
Public safety (e.g., police, firefighters, paramedics) 5
Recreational / fitness activities (e.g., fitness centers, community sports centers) 6
Community and religious / faith organizations (e.g., community centers with programs, housing supports, churches, mosques, synagogues) 7
Financial services (e.g., banks, credit unions) 8
Federal or provincial client services centres (e.g., Service Canada, Service Ontario, etc…) 9
Cultural organization or institution (e.g., theatre, museum, performing arts centre) 10
Tourism (e.g., visitor centre, guided tours) 11
Other (please specify) 97
Don't know 98
Prefer not to answer 99
Who do you know (if anyone) that is living/has lived with dementia? Select all that apply. [SELECT ALL]
No one 0
Myself 1
My spouse/partner 2
A parent 3
Extended family member 4
A friend 5
Neighbour 6
Colleague at work 7
Don't know 98
Prefer not to answer 99
An unpaid caregiver may do a range of things to care for someone living with dementia (an unpaid caregiver is defined as a person who provides or has provided care and support to a person with dementia without being paid). Have you done any of the following in the last 5 years for a person living with dementia, without getting paid? Select all that apply. [SELECT ALL]
Assisted with financial affairs 1
Assisted with activities of daily living (e.g., cooking, cleaning, bathing or dressing) 2
Assisted with errands such as grocery shopping and errands outside of the home 3
General health care and health monitoring (e.g., overseeing medication usage or
help administering medication, setting up appointments) 4
Other types of unpaid care 5
None of these – no assistance to a person living with dementia 0
Don't know 98
Prefer not to answer 99
IF Q9=1 THRU 5 CODE AS UNPAID CAREGIVER
[IF UNPAID CAREGIVER] In the last five years, have you experienced any of the following while you were with the person living with dementia to whom you provide care? Select all that apply. [SELECT ALL]
Had people talk to me rather than the person living with dementia 1
Encountered people who focused on things the person living with dementia can no longer do instead of the things they can 2
Were unable to go where you needed to or wanted to due to accessibility issues such as accessible transportation and buildings 3
Had difficulty navigating a public space such as a grocery store, bus or train station 4
Had trouble accessing appropriate housing for the person living with dementia 5
None of the above 0
Don't know 98
Prefer not to answer 99
[IF UNPAID CAREGIVER] Which of the following challenges, if any, have you encountered when accessing or using dementia recommendations and advice related to the care you are providing? Select all that apply. [SELECT ALL]
Advice is not in the right language 1
Advice does not consider the cultural context for those to whom I provide care or support 2
Advice is too expensive to obtain 3
Advice is too complicated to understand or communicate 4
Do not trust the source of the advice 5
Other (please specify) 6
I have not encountered any challenges or barriers 0
Don't know 98
Prefer not to answer [TERMINATE] 99
Section 3: Dementia knowledge
On a scale of 1 to 5 where 1 means not at all knowledgeable, 3 means moderately knowledgeable and 5 means very knowledgeable, how knowledgeable would you say you are about dementia?
Not at all knowledgeable (1) 1
2 2
Moderately knowledgeable (3) 3
4 4
Very knowledgeable (5) 55
Don't know 98
Prefer not to answer 99
On a scale of 1 to 5 where 1 means not at all an impact, 3 means a moderate impact and 5 means a very large impact, overall, how much of an impact do you think dementia is having in Canada today?
Not at all an impact (1) 1
2 2
A moderate impact (3) 3
4 4
A very large impact (5) 5
Don't know 98
Prefer not to answer 99
Section 4: Stigma/dementia comfort
To what extent do you agree or disagree with the following statements? [RANDOMIZE]
People should generally retire at 65 because their ability to perform at a high-level declines
People living with dementia generally face a lower quality of life than people without dementia
People living with dementia are sometimes able to continue working for years after the onset of symptoms
People living with dementia can sometimes continue to live in their own homes for years following diagnosis
People living with dementia are sometimes able to continue being active in their communities for years following diagnosis
Older people are more able to contribute to solving today's challenges than younger people
Strongly disagree 1
Disagree 2
Neither 3
Agree 4
Strongly agree 5
Don't know 98
Prefer not to answer 99
On a scale of 1 to 5 where 1 means not comfortable, 3 means moderately and 5 means very comfortable, comfortable would or do you feel interacting with someone living with dementia?
Not comfortable (1) 1
2 2
Moderately (3) 3
4 4
Very comfortable (5) 5
Don't know 98
Prefer not to answer 99
[IF COMFORT>3 AND <98] Why would or do you feel comfortable interacting with someone living with dementia?
Currently know or have known people with dementia 1
Generally confident in dealing with most situations 2
Have information on supporting people with dementia 3
Other 4
Don't know 98
Prefer not to answer 99
[IF COMFORT<3] Why would or do you feel uncomfortable interacting with someone living with dementia?
Not sure how to talk to or support/help the person 1
Worried about or unsure of how the person will behave/react 2
Don't have enough information about dementia 3
I have never known anyone with dementia 4
Other 5
Don't know 98
Prefer not to answer 99
When it comes to communicating with a person living with dementia, which of the following tips do you think are recommended? Please select all that apply. [SELECT ALL]
Non-verbal encouragement (such as making eye contact and nodding) should be avoided 1
Physical contact like handshakes is encouraged 2
Provide plenty of information 3
Don't know 98
Prefer not to answer 99
Section 5: Dementia-inclusive communities
How would you rate your community as a place that supports healthy aging including making it possible for older people to remain engaged in community life?
Very poor 1
Poor 2
Neither good nor poor 3
Good 4
Very good 5
Don't know 98
Prefer not to answer 99
[FOR ONLINE: SHOW ON THE SAME PAGE AS QUESTION ABOVE] Why do you give your community that rating (for how well it supports healthy aging including community engagement for older people)?
OPEN END
Don't know 98
Prefer not to answer 99
Have you heard of the concept of dementia-inclusive communities?
Yes 1
No 2
Don't know 98
Prefer not to answer 99
Dementia-inclusive communities allow people with dementia to:
optimise their health and wellbeing for as long as possible in familiar environments and with familiar routines;
live as independently as possible and continue to be part of their community;
be understood and given support;
safely find their way around;
continue to access familiar local facilities, such as banks, shops, cafes, post office and cinema; and
maintain or expand their social contacts and networks.
On a scale of 1 to 5 where 1 means not at all a priority, 3 means a moderate priority and 5 means a very high priority, what level of priority rating would you assign to having your community become more dementia-inclusive in these ways?
Not at all a priority (1) 1
2 2
Moderate priority (3) 3
4 4
Very high priority (5) 5
Don't know 98
Prefer not to answer 99
Why did you rate the priority for community to be more dementia-inclusive this way? (OPEN ENDED)
Do you know if your community has a guide or plan in place to be more dementia-inclusive?
Yes, I know my community does have a guide or plan in place to be more dementia-inclusive 1
Yes, I know my community does not have a guide or plan in place to be more dementia-inclusive 2
Don't know 98
Prefer not to answer 99
What measures or activities, if any, do you think a dementia-inclusive community might provide? [OPEN-END]
Don't know 98
Prefer not to answer
99
From the following list, please indicate which, if any, of the following measures your community has in place that contribute to making a community more dementia-inclusive? [SELECT ALL. RANDOMIZE.]
Well-signed crosswalks with advance crossing for pedestrians and / or audio signals 1
Wide sidewalks and pathways with no or very few obstructions 2
Easy to recognize public transit signs such as bus stops and subway entrance 3
Well-maintained sidewalks and pathways 5
Ample outdoor seating 6
Well-lit sidewalks and public outdoor spaces 7
Easy to recognize public washrooms 8
Don't know 98
Prefer not to answer [TERMINATE] 99
Thinking of activities designed specifically to welcome and include people living with dementia in your community, to the best of your knowledge, which, if any, of the following does your community provide? [SELECT ALL. RANDOMIZE.]
Community centre activities 1
Cultural activities such as participating in dance sessions and visiting museums 2
Peer support groups 3
Intergenerational programs 4
Don't know 98
Prefer not to answer 99
Section 6: Workplace / Volunteer Organization
[IF EXPERIENCE INTERACTING WITH PLWD] Earlier, you indicated that you either work or worked or volunteer or volunteered in a role that involves interaction with people living with dementia. The next few questions about that role or those roles. Do or did staff / volunteers at that or those organizations receive training on how to interact with people living with dementia? [SELECT ALL]
No 0
[ONLY IF CURRENTLY WORK IN ROLE] Yes, where I currently work 1
[ONLY IF PREVIOUSLY WORKED IN ROLE] Yes, where I used to work 2
[ONLY IF CURRENTLY VOLUNTEER IN ROLE] Yes, where I currently volunteer 3
[ONLY IF PREVIOUSLY VOLUNTEER IN ROLE] Yes, where I used to volunteer 4Don't know 98
Prefer not to answer 99
[IF YES TO ANY] Have you personally received training on how to interact with people living with dementia?
Yes 1
No 2
Don't know 98
Prefer not to answer 99
[IF YES, RECEIVED TRAINING] How long ago?
Within the past year 1
1 to 5 years ago 2
More than 5 years ago 3
Don't know 98
Prefer not to answer 99
[IF YES, RECEIVED TRAINING] What was the focus or purpose of the training? [SELECT ALL]
Communication and interaction tips 1
How to assist someone who seems confused or lost 2
General knowledge about dementia, including what signs or symptoms may be present 3
Other (Please specify) 5
Don't know 98
Prefer not to answer [TERMINATE] 99
[IF CURRENT OR PAST INTERACTION AT WORK] To what extent do you agree or disagree with the following statement about the place you work or worked in which you have had interaction with people living with dementia?
That organization [IF CURRENT INTERACTION: does / IF PAST INTERACTION: did] enough to provide training for staff and volunteers on how to appropriately interact with clients or customers who are living with dementia in a supportive, respectful and effective way.
Strongly disagree 1
Disagree 2
Neither 3
Agree 4
Strongly agree 5
Don't know 98
Prefer not to answer 99
[IF CURRENT OR PAST INTERACTION AS VOLUNTEER] To what extent do you agree or disagree with the following statement about the place you volunteer or volunteered in which you have had interaction with people living with dementia?
That organization [IF CURRENT INTERACTION: does / IF PAST INTERACTION: did] enough to provide training for staff and volunteers on how to appropriately interact with clients or customers who are living with dementia in a supportive, respectful and effective way.
Strongly disagree 1
Disagree 2
Neither 3
Agree 4
Strongly agree 5
Don't know 98
Prefer not to answer 99
[IF EXPERIENCE INTERACTING WITH PLWD] Dementia is an umbrella term used to describe a set of symptoms affecting brain function that are caused by neurodegenerative and vascular diseases or injuries. It is characterized by a decline in cognitive abilities. These abilities include: memory; awareness of person, place, and time; language, basic math skills; judgement; and planning. Dementia can also affect mood and behaviour.
Are you aware of whether that organization or those organizations where you have had interaction with people living with dementia [IF CURRENT INTERACTION: has/have / IF PAST INTERACTION: had] any measures or policies specifically to ensure positive and helpful interactions with people living with dementia? [SELECT ALL]
No 0
[ONLY IF CURRENTLY WORK IN ROLE] Yes, where I currently work such measures are in place 1
[ONLY IF PREVIOUSLY WORKED IN ROLE] Yes, where I used to work such measures were in place 2
[ONLY IF CURRENTLY VOLUNTEER IN ROLE] Yes, where I currently volunteer such measures are in place 3
[ONLY IF PREVIOUSLY VOLUNTEER IN ROLE] Yes, where I used to volunteer such measures were in place
Don't know 98
Prefer not to answer 99
[IF CURRENT OR PAST INTERACTION AT WORK / VOLUNTEER] What issues, if any, have you ever noticed clients or customers experiencing that might be related to symptoms of dementia? Please select all that apply. [SELECT ALL]
I [IF CURRENT INTERACTION: do / IF PAST INTERACTION: did]not interact directly with clients or customers 0
Mobility difficulties, such as navigation 1
Confusion, such as seeming lost or unsure of surroundings 2
Communication issues, such as having difficulty finding words 3
Bumping into objects and barriers (spatial awareness) 4
Problems in paying for services, such as remembering pin numbers 5
Other (Please specify) 7
None 97
Don't know 98
Prefer not to answer 99
[IF CURRENT OR PAST INTERACTION AT WORK][IF CURRENT INTERACTION: does / IF PAST INTERACTION: did] your organization take any steps to make online interactions more accessible for those with cognitive impairment (such as dementia)?
Yes 1
No 2
Don't know 98
Prefer not to answer 99
[IF YES] What are those measures? [SELECT ALL. RANDOMIZE. ANCHOR OTHER.]
Including contact information 1
Chat or call options 2
Shorter text 3
Plain backgrounds to avoid distraction 4
Printable content and forms 5
Subtitles or transcripts and / or video or audio content 6
Other 77
Don't know 98
Prefer not to answer 99
Section 7: Demographics
The last few questions are strictly for statistical purposes. All of your answers are completely confidential.
What language do you speak most often at home?
English 1
French 2
English and French both equally 3
Other 4
Prefer not to answer 9
Do you consider yourself to be any of the following? Please select all that apply. [SELECT ALL]
Indigenous, that is, First nations, Métis or Inuit 1
Hispanic 2
Black 3
South Asian, such as Pakistani, Indian, Sri Lankan, etc. 4
Southeast Asian such as Chinese, Vietnamese, Korean, etc. 5
A member of another visible minority or racialized community that is non-Caucasian (Please specify) 6
None of the above 98
Prefer not to answer 99
IF Q39=1 CODE AS INDIGENOUS
IF Q39=2 CODE AS HISPANIC
IF Q39=3 CODE AS BLACK
IF Q39=4 CODE AS SOUTH ASIAN
IF Q39=5 CODE AS SOUTHEAST ASIAN
RESPONDENTS CAN QUALIFY FOR MULTIPLE CATEGORIES
[IF IDENTIFYING AS INDIGENOUS] Which of the following best describes you? Are you a First Nations person, Métis, or Inuk? [SELECT ALL]
First Nations 1
Métis 2
Inuk 3
None of the above 7
Prefer not to answer 9
[IF IDENTIFYING AS FIRST NATIONS] Do you live on a reserve or First Nation community for at least 6 months of the year?
Yes 1
No 2
Prefer not to answer 9
What is the highest level of schooling that you have completed?
Less than high school diploma or equivalent 1
High school diploma or equivalent 2
Registered apprenticeship or other trades certificate or diploma 3
College, CEGEP or other non-university certificate or diploma 4
University certificate or diploma below bachelor's level 5
Bachelor's degree 6
Post graduate degree above bachelor's level 7
Prefer not to answer 9
What is your current employment status?
Student 1
Self-employed 2
Employed (full-time) 3
Employed (part-time) 4
Unemployed (looking for work) 5
Unemployed (not currently looking for work) 6
Unable to work 7
Retired 8
Prefer not to answer 9
Which of the following categories best describes your total household income? That is, the total income of all persons in your household combined, before taxes.
Under $20,000 1
Between $20,000 and $39,999 2
Between $40,000 to just under $59,999 3
Between $60,000 to just under $79,999 4
Between $80,000 to just under $99,999 5
Between $100,000 to just under $149,999 6
$150,000 and above 7
Don't know/Prefer not to answer 9
Which of the following best describes the place where you live now?
Large urban population centre, that is, it has a population 100,000 or greater 1
Medium urban population centre, that is, it has a population of 30,000 to 99,999 2
Small urban population centre, that is, it has a population of 1,000 to 29,999 3
Rural area, that is, it has a population of less than 1,000 4
Remote area, that is you are isolated from other communities 5
Prefer not to answer 9
What is your gender? This refers to the gender that you identify with which may be different from sex assigned at birth and may be different from what is indicated on legal documents.
Man 1
Woman 2
Other gender identity 3
Prefer not to answer 9
What is your sexual orientation?
Heterosexual 1
Lesbian 2
Gay 3
Bisexual 4
Other 5
Prefer not to answer 9
IF (Q46<9 AND DOES NOT EQUAL Q1) OR (IF Q47>1 and Q47<9), CODE AS 2SLGBTQ+
What are the first three digits of your postal code?
[INSERT FIRST THREE DIGITS OF POSTAL CODE. FORMAT A1A]
Prefer not to answer 9
[PRE-TEST ONLY ADD QUESTIONS A THRU J]
Did you find any aspect of this survey difficult to understand? Y/N
[IF A=YES] If so, please describe what you found difficult to understand.
Did you find the way of the any of the questions in this survey were asked made it impossible for you to provide your answer? Y/N
[IF C=YES] If so, please describe the problem with how the question was asked.
Did you experience any difficulties with the language? Y/N
[IF E=YES] If so, please describe what difficulties you had with the language.
Did you find any terms confusing? Y/N
[IF G=YES] If so, please describe what terms you found confusing.
Did you encounter any other issues during the course of this survey that you would like us to be aware of? Y/N
[IF I=YES] If so, what are they?
This concludes the survey. Thank you for your participation!
Footnotes
Footnote 1
Labour force characteristics by industry, annual (x 1,000) https://www150.statcan.gc.ca/t1/tbl1/en/tv.action?pid=1410002301#tables