Ce rapport est aussi disponible en français.
For more information on this report, please email:
info@pwgsc-tpsgc.gc.ca
EKOS RESEARCH ASSOCIATES
Over the past decade the media landscape in Canada has undergone enormous changes. The emergence of new technologies, more offshore media platforms, shifting immigration demographics and First Nations groups reconnecting with their linguistic roots, are some of the changes we have seen. During this time, some media industries have benefitted greatly from these shifting consumer tastes, while others have faced challenges in retaining core audiences.
Communications are central to the Government of Canada’s work and essential for informing the public of what it is doing for their benefit. The government communicates with the public in both official languages, to inform Canadians of policies, programs, services and initiatives, and of Canadians’ rights and responsibilities under the law. Shifts in how Canadians prefer to receive information have led us to look at how we communicate with Canadians in the best manner possible.
To better understand media usage by linguistic minorities we surveyed Canadians who live where the majority official language of their community is not the language they speak at home. An official minority language community (OLMC) is a community of individuals who speak English within the province of Quebec, and French in the rest of Canada. For parts of the survey, we did not exclude media usage of other minority languages, such as ethnic and Indigenous languages, to ensure we had a clear picture of the minority linguistic preferences of various media in Canada rather than just official language minorities. This public opinion research, commissioned by Public Services and Procurement Canada (PSPC), explores the ability of Canadians, including those living in OLMCs, to receive government communications in the official language of their choice. Information was gathered on the media usage habits of the target population (adult Canadians, including OLMCs and other minority language media users). The results of this study will support Government of Canada institutions in the strategic development of advertising campaigns for which they are responsible to better target their audiences and the appropriate media outlets.
The four target populations surveyed were:
The 10 to 15 minute telephone survey was completed with 2,873 Canadians 18 years of age or older. The sample comprised of 1,233 language majority respondents (511 Francophones living in Quebec and 722 Anglophones living in the rest of Canada). The language majority sample was based on randomly selected households across the country using a Random Digit Dial (RDD) method of sampling households which is a probabilistic method. The margin of error associated with this language majority sample is 2.8 per cent overall Footnote 1. It also includes 1,640 language minority respondents, including 461 Anglophones living in 73 selected Quebec census subdivisions (CSDs), and 1,179 Francophones living in 70 other selected CSDs across Canada. The language minority sample was constructed through the selection of random phone numbers with postal codes located in selected dissemination areas within communities where language minority was most concentrated.
The Internet was by far the most popular medium for all groups; 88 per cent indicate they have used it in the past month, followed fairly closely by radio (81 per cent) and television (79 per cent). Other media are less used: six in ten read community print newspapers and just over half (53 per cent) read daily print newspapers, with magazines bringing up the rear as an information source (45 per cent).
When it comes to seeking information about government programs and services, the primary source is the Internet, followed by television, radio and talking to acquaintances. Four in ten respondents suggested that Service Canada centres and daily newspapers were preferred sources for government information. Community print newspapers, 1-800-O-Canada and magazines were the least preferred information sources.
Respondents of all linguistic backgrounds report similar use of the Internet, radio and community print newspapers. Nevertheless, official language minority Anglophones are somewhat less likely to have watched television, or read daily print newspapers or magazines.
Among Internet users, websites rank as the most popular digital medium (92 per cent), followed at a distance by social media (77 per cent). Further down the list, half read daily online newspapers, and just over four in ten (43 per cent) stream television through the Internet. Fewer still listen to Internet radio broadcasts (26 per cent) or read community online newspapers (23 per cent). When seeking information about government programs and services digitally, government websites are the primary source of information, followed by social media, and daily online newspapers.
Across digital media, respondents of all linguistic backgrounds have similar patterns of use. Nevertheless, OLMCs outside of Quebec are noticeably less likely to have watched television streaming through the Internet than OLMCs within Quebec.
Among those people who reside within a majority language community and access information in another language, the preferences are similar. Internet and television are the primary sources for minority language information, followed by radio and magazines. Minority language daily print newspapers (22 per cent), or community print newspapers (22 per cent) both were the least preferred source of information.
One-third of minority language Internet users watch online television streaming (35 per cent), visit websites (33 per cent), use social media (30 per cent), or read daily online newspapers (29 per cent). One-quarter listen to online radio (27 per cent) or read community online newspapers (25 per cent).
Canadians expect to receive information about government programs and services primarily through Internet (84 per cent), in particular Government of Canada websites (75 per cent of Internet users), followed by people they know (63 per cent) and television (62 per cent). Service Canada centres, and daily newspapers form a second tier of preferred sources for government information, according to about half of respondents. Fewer Canadians use community print newspapers, magazines and 1-800-O-Canada to access government information.
In terms of key differences, OLMCs in Quebec are less likely than Francophones within or OLMCs outside Quebec to watch television (54 per cent), read daily (33 per cent) or community print (31 per cent) or read magazines (15 per cent) to get news about Government of Canada programs and services. While OLMCs outside of Quebec are more likely than Anglophones to rely on community print newspapers (40 per cent), this represents the sixth most popular source for Government of Canada information.
Canadians seek information about government programs and services primarily through Internet (74 per cent) and television (70 per cent), followed by mail issued by the Government of Canada (65 per cent) then radio (63 per cent).
Asked within the context of the most relied on source for first receiving new information about Government of Canada programs or services, half of all language groups said they expect to receive this information through a combination of news coverage and advertising. One-third expect to receive this information through news coverage alone, and very few anticipate getting the information through advertising alone.
The vast majority of Canadians are satisfied with the various means through which the Government of Canada has sought to inform citizens about its programs and services. One in five (18 per cent) expressed a high level of satisfaction with the Government of Canada’s communication efforts, and another six in ten (62 per cent) said they are moderately satisfied. One in ten (11 per cent) expressed limited satisfaction and just five per cent said they are "not at all" satisfied.
Results suggest that the availability of OLMC newspapers is consistent across both language groups. Consumption habits of OLMCs within and outside Quebec are virtually identical. There is, however, a notable disparity in terms of access to OLMC radio; seven in ten minority Francophones (70 per cent) report access to OLMC radio in their area, compared to just half of minority Anglophones (49 per cent).
Although Canadians use a wide array of media to keep themselves informed, the Internet (namely websites), and television are the primary sources used.
Media sources more likely to be accessed in a minority language (i.e., other official minority language or ethnic or Indigenous language) are Internet and television, followed by online television. Print newspapers are the least likely to be accessed in a minority language.
OLMCs outside Quebec routinely access media in a minority language, particularly through the Internet. By contrast, OLMCs living in Quebec are much less likely to access media in a minority language on a monthly basis. When asked to explain why they accessed minority language media, both said they use these media primarily to follow local news and events.
Canadians get their information about government programs primarily through the Internet, particularly government websites, as well as through acquaintances, television, and radio. In fact, so few people selected community newspapers, or radio as a preferred source that no reliable conclusions can be drawn. The vast majority of Canadians looked for information about government services at least once in the past year, particularly related to taxes, passports, health, and pensions.
Most Canadians are generally satisfied with the ways in which the Government of Canada communicates information about its programs. Satisfaction levels are slightly higher among Francophones. Among the relatively small minority who are less satisfied, many attributed this to issues with the programs themselves, rather than with the government’s communication efforts. Lack of internet access is also a reason for limited satisfaction, primarily among majority Anglophones (rather than among language minority respondents).
Among official minority language residents not accessing language minority community media sources, most say that they prefer other sources or lack the time or interest. Few say that they lack access to these sources.
The total expenditure for the POR project is $196,574.01 (including HST).
To obtain more information on this study, please e-mail info@pwgsc-tpsgc.gc.ca.
This certification is to be submitted with the final report submitted to the Project Authority.
I hereby certify as Senior Officer of EKOS Research Associates Inc. that the deliverables fully comply with the Government of Canada political neutrality requirements outlined in Treasury Board’s Policy on Communications and Federal Identity and Procedures for Planning and Contracting Public Opinion Research.
Specifically, the deliverables do not include information on electoral voting intentions, political party preferences, standings with the electorate, or ratings of the performance of a political party or its leaders.
Signed by: Susan Galley (Vice President)
To better understand media usage by both Canadians and minority language Canadians, particularly as it relates to seeking information about Government of Canada programs and services, Public Services and Procurement Canada (PSPC) commissioned this public opinion research. It explores the ability of Canadians to receive important government communications, and gauge their satisfaction with the Government of Canada’s efforts to communicate with them. The results of this study will support Government of Canada institutions in the strategic development of advertising campaigns for which they are responsible to better target their audiences and the appropriate media outlets.
The four target populations studied were:
The specific objectives of the research were to understand:
Following the orientation meeting, EKOS reviewed an initial draft of the questionnaire provided by PSPC. The questionnaire underwent several iterations of changes based on internal consultation and discussions between PSPC and EKOS. Once finalized, PSPC translated the final questionnaire into French.
The questionnaire was intended as a 10-minute interview with language majority Canadians and 15-minute interview with language minority Canadians. Testing was conducted over two nights to examine clarity of questions and response categories, accuracy of branching logic and length of the interview. In total, the questionnaire was tested with 28 completed cases, including 20 with language majority respondents (10 in English and 10 in French). Another eight were completed with language minority respondents in order to test questions intended for only this respondent group. A script programmed for the automated response system was used in the testing to pre-screen for language minority respondents.
Testing was conducted by experienced, bilingual interviewers who were asked to provide feedback about flow, clarity and wording, etc. based on their experiences with the test. The testing was also monitored by the project manager, who was responsible for discussing the need for potential changes with the client. Results from this test necessitated a number of changes to the questionnaire, largely related to skip logic and increased clarity/recall among respondents. The average interview length was 14 minutes for the language majority cases and 17 minutes for the language minority cases, necessitating some cuts to the questionnaire. Once finalized, the average length of the interview was 12 minutes for language majority and 14 minutes for language minority respondents. The final questionnaire is provided in Appendix A.
The survey was completed with 2,873 Canadians 18 years of age or older. This includes 1,233 language majority respondents and 1,640 language minority respondents. The language majority sample was based on randomly selected households across the country. Phone numbers were determined using a Random Digit Dial (RDD) method of sampling households, whereby listed and unlisted phone numbers in Canada were called and the first person reached in the household was sampled. The language minority sample was constructed through the selection of random phone numbers with postal codes located in specifically selected dissemination areas within communities where language minority was most concentrated.
More specifically, in the language majority sample, the 1,233 interviews were completed with Francophones (511) living in Quebec, or Anglophones (722) living outside of Quebec in a probability–based sample. The margin of error associated with the sample is 2.8 per cent overall (3.7 per cent among Francophone in Quebec and 4.3 per cent among Anglophones outside Quebec) Footnote 1.
The landline sample was augmented with cell phone sample, with a target of obtaining 20 per cent of interviews with cell phone only (CPO) residents. CPO households were confirmed at the time of the survey, and quotas monitored during data collection. This sample was drawn from Probit, our online-hybrid panel of Canadians. Probit is a probability based sample assembled using a random digit dial (RDD) process for sampling from a blended land-line cell-phone frame, which provides full coverage of Canadians with telephone access. The distribution of the recruitment process is meant to mirror the actual population in Canada (as defined by Statistics Canada). As such, our 100,000 member panel (with nearly 20,000 cell phone only members) can be considered representative of the general public in Canada (meaning that the incidence of a given target population within our panel very closely resembles the public at large) and margins of error can be applied. All households/individuals in the Probit panel are contacted by telephone and the nature of the panel is explained in greater detail (as are our privacy policies) and demographic information is collected. At this time the online/off-line, as well as landline/cell phone status is ascertained in order to determine the method of completing surveys (i.e., online, or telephone). This variable of ‘type of telephone service’ (cell phone only, landline only or both) collected at the time of screening is used to determine CPO sample.
Among the 1,640 interviews completed with language minority households, 461 were completed with Anglophones living in selected Quebec census subdivisions (CSDs), and 1,179 with Francophones in other selected CSDs across Canada. These households were sampled across 143 CSDs (73 in Quebec and 70 outside of Quebec). CSDs were selected within three strata of language incidence in the CSD (under five per cent, five to 20 per cent and 20 or more per cent). CSDs were selected on the basis of having a high concentration of language minority in at least one dissemination area within the CSD. That is, CSDs where language minority speakers are more evenly distributed among dissemination areas were not selected. Instead, CSDs where there are stronger geographic concentrations of the language minority in specific neighbourhoods were selected to represent the CSD. This method was used to increase the efficiency of finding in-scope households and respondents in the language minority sample. The list of CSDs selected with the number of completed interviews per CSD can be found at the end of this report.
Since language minority residents living in CSDs where the language minority incidence is very low (defined here as CSDs where the language minority is found among fewer than 5 per cent of households) may be fundamentally different, we collected 156 cases from these CSDs to allow for comparison of the views and experiences of these residents with language minority residents in communities where the language is found in higher concentrations. The sample was stratified, however, to balance the need for sufficient cases in the low incidence communities with the need for efficiency in the collection of the survey. Considerably higher proportions of the sample were therefore collected in the other two incidence strata; where the language minority is found among five to 20 per cent of households, and among 20 per cent or more of households. Overall, the largest deviation in the sample collected, relative to the population, is in a much higher proportion of respondents living in high concentration language minority communities, and much fewer living in the low concentration language minority communities. The sample was subsequently weighted in the treatment of the data, based on the typical concentrations of language minority households according to the latest Census figures available for the population.
For language minority cases sampled in dissemination areas where the expected incidence is less than 20 per cent of the population, screening was done through an automated Interactive Voice Recorder (IVR) system. That is, a computerized dialling system was used with a pre-recorded script to ask household members if they satisfied the study criteria ("Of Canada’s two official languages, English and French, which one do you use most often at home? Press 1 for English, 2 for French Footnote 2". This was followed up with "someone from our research team will contact you".) This system dials thousands of numbers each evening. Cases of individuals who were considered eligible to participate in the survey as a language minority respondent were then contacted by the survey team. Each respondent referred by the IVR pre-screening, was then re-screened by a bilingual interviewer, using the same screening questions. Qualified and willing respondents were then interviewed. The IVR dialling system was used to identify in-scope households and sample was submitted to the interviewing team on a nightly basis, for follow-up in completing the language minority sample.
Appendix B provides a breakdown of the target number of cases completed among Anglophones and Francophones in the different language majority and minority strata of the sample. In the case of language minority sample strata, the table also provides the average incidence of finding in-scope cases in the selected communities (and selected dissemination areas within each).
While it was possible to include cell phone sample in an effort to include cell phone only respondents in the language majority sample, this was only possible in a limited way in the language minority sample, given the need to sample within very specific dissemination areas (block clusters) of selected CSDs. Cell sample was added at the end of collection of the language minority sample in some well-defined communities in an effort to augment the representation of those under 35 years of age.
| Region | Quebec | Rest of Canada | Total |
|---|---|---|---|
| Under 5% incidence | |||
| % of population | 8% | 46% Footnote 3 | n/a |
| Language incidence | 2% | 2% | n/a |
| Normal sample | 37 | 541 | 578 |
| Stratified sample | 52 | 104 | 156 |
| Number of sampled CSDs | 31 | 20 | 51 |
| 5% to 20% incidence | |||
| % of population | 17% | 30% | n/a |
| Language incidence | 10% | 13% | n/a |
| Normal sample | 79 | 365 | 444 |
| Stratified sample | 118 | 362 | 480 |
| Number of sampled CSDs | 19 | 19 | 38 |
| 20% to 49% incidence | |||
| % of population | 76% | 23% | n/a |
| Language incidence | 27% | 32% | n/a |
| Normal sample | 348 | 271 | 562 |
| Stratified sample | 291 | 713 | 1004 |
| Number of sampled CSDs | 23 | 31 | 54 |
| Total | |||
| Overall Stratified sample | 461 | 1179 | 1640 |
| Number of sampled CSDs | 73 Footnote 4 | 70 Footnote 5 | 143 |
The survey was administered by telephone, using a team of trained, bilingual interviewers. Calling was concentrated largely during evening and weekend hours. Appointments were made at the convenience of the respondent where they were not available at the time of contact to complete the interview. The collection for this portion of the sample spanned March 3 through June 22, 2017 Footnote 6, collecting a sample of 2,873 completed interviews (1,233 with language majority respondents and 1,640 with language minority respondents).
Each landline household entered into the initial sample was attempted up to 11 times before retiring the telephone number, although those in CPO households were attempted up to six times. Attempts were spread over the data collection period, with no calls occurring after 9pm in the respondent’s time zone. CPO respondents were asked if they were safe and willing to participate on their cellphones, confirming that they do not have a landline.
In order to ensure a high response rate a lottery draw was offered among language minority respondents sampled from communities outside of Quebec (one of three prizes of $250). In a small number of cases where the representation of those under 35 years of age needed to be augmented in both the language majority and minority samples, an individual incentive of $15 was offered.
The details of call outcomes of phone numbers attempted can be found below. The response rate was 9.2% in the language majority (i.e., national) sample, and 15.5% and 20.2% among language minorities in Quebec and the rest of Canada respectively. On average, the IVR contacted sampled households an average of twice (with a maximum of three calls placed to any one number). The final response rates for the survey are based on an accepted industry standard calculation (see Marketing Research and Intelligence Association or MRIA). Details are provided in Appendix C.
| Target Group | Minority outside Quebec | Minority in Quebec | Majority |
|---|---|---|---|
| Total | 66,686 | 18,842 | 35,247 |
| Invalid | 15,347 | 3,593 | 10,459 |
| Functional | 51,339 | 15,249 | 24,788 |
| Responding | 10,385 | 2,363 | 2,284 |
| Completes | 1,179 | 461 | 1,233 |
| Response Rate | 20.2% | 15.5% | 9.2% |
Following the completion of the survey, the various data sets were merged and data cleaned. The questionnaire included several questions with open end components, generating a large number of comments/open responses that required coding. Coding schemes were developed on the basis of a review of about 25 per cent of responses.
The survey data were weighted to population targets for age, gender and region for language majority cases. Language minority cases were weighted separately, for Francophones living outside of Quebec, and Anglophones in Quebec. In each of these cases, the data were weighted by age, gender and the three community strata of incidence of language minority.
The key areas included in the banner tables were language majority/minority, for Anglophones and for Francophones (4 segments), as well as results according to the three incidence strata of language minority (i.e., under 5 per cent, 5 to 20 per cent and over 20 per cent). Results are also arrayed for language minority respondents by demographic segments (e.g., region, age, gender, education, income). Results are also provided for an overall picture of “Canada”, including all language majority respondents and five per cent of language minority respondents. A data set was also prepared for the client in SPSS.
In terms of possible response bias, the sample of Canadians (n=1,337 Footnote 7) over represents those with post-secondary education, including 33 per cent with a university level of education compared with 23 per cent in the population, according to 2011 Census population figures. In terms of age cohorts, there is an over representation of Canadians who are 55 or older (55 per cent compared with 38 per cent in the population, according to 2016 population data), and an under representation of those under 35 (14 per cent compared with 27 per cent in the population). Geographically, given the sample design of collecting nearly equal proportions of Quebecers versus other Canadians, it is therefore not surprising that there is an under representation across the other regions, most notably in Ontario (27 per cent compared with 37 per cent of the population according to 2016 Census data). The proportions of the sample are aligned with population proportions in terms of gender.
In the sample of official language minority respondents there is an under representation of residents living in Quebec (28 per cent compared with 58 per cent in the population), and an under representation in western provinces. This resulted from the sample design focusing largely on communities with five per cent or more of the population represented by official language minorities. There is an under representation of those under 45 (23 per cent compared with 45 per cent in the population) and over representation of those 65 or older (39 per cent compared with 19 per cent in the population). This was partially a result of the extensive focus on smaller communities where larger concentrations of official language minorities reside, which also tend to feature older populations. There is also a slight under representation of men (39 per cent compared with 48 in the population).
This chapter focuses on the media habits of Canadians in general, regardless of which of the two official languages they use most at home. The analysis is based on a nationally representative sample of 1,337 Canadians aged 18 and over, including the language majority sample (n=1,233) as well as a portion of the minority cases collected among language minority respondents, reflective of the national proportion of the population (n=104). Where significant, the differences between age groups and community settings (i.e., urban versus rural) are highlighted in the current and subsequent chapters.
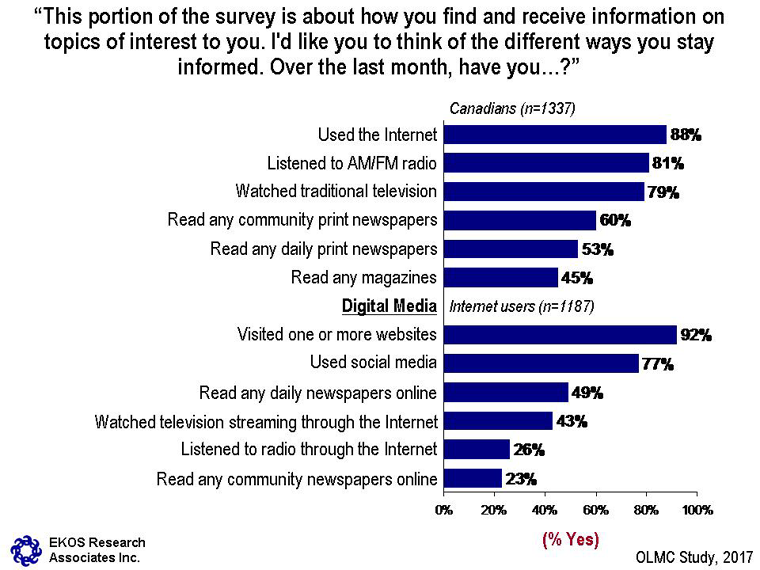
Respondents were first asked to identify the various ways they stay informed: the Internet ranked as the most popular information vehicle for obtaining information, with almost nine in ten Canadians (88 per cent) indicating they have used it in the past month (see Chart 1: Means of Staying Informed). In close second, eight in ten selected radio or television (81 per cent and 79 per cent, respectively) in terms of information sources. In a third tier of information choices, six in ten (60 per cent) indicated that they read community print newspapers, and just over half (53 per cent) read daily print newspapers. Forty-five per cent said they read magazines.
Among Internet users, websites rank as by far the most popular digital medium, with nine in ten respondents (92 per cent) indicating that they have visited one or more websites in the past month. Three-quarters (77 per cent) said they use social media to stay informed. As with print, half read daily online newspapers (49 per cent), and just over four in ten (43 per cent) reported that they stream television through the Internet, forming a third tier of information choices. Considerably fewer; just one in four, listen to Internet radio broadcasts (26 per cent) or read community online newspapers (23 per cent).
This horizontal bar graph is titled "Means of Staying Informed." It shows two sections of the breakdown of answers to the question, "This portion of the survey is about how you find and receive information on topics of interest to you. I'd like you to think of the different ways you stay informed. Over the last month, have you…?"
First section: The 1,337 respondents (Canadians) answered as follows (% yes):
Second Section (Digital Media): The 1,187 respondents (Internet users) answered as follows (% yes):
"Ekos Research associates Inc." and "OLMC Study, 2017"
The likelihood of using television, print newspapers (either daily or community), and magazines increases with age. For instance, 93 per cent of those who are 65 and older have watched television in the past month, compared to 69 per cent of those under 35 years of age. Use of digital media, meanwhile, declines consistently with age. For instance, 95 per cent of those under the age of 35 have used social media in the past month, compared to just 48 per cent of those 65 and older.
Residents of rural areas are more likely to report that they read community print newspapers. Those who reside in an urban setting, meanwhile, are consistently more likely to access digital media than their rural counterparts. For example, 79 per cent of those who live in urban areas have used social media in the past month, compared to 63 per cent of residents of rural communities.
Respondents were presented with a list of media they indicated using in the previous month and were asked to rate the frequency with which they accessed each one in a minority language, that is, a language other than the official language they use most often to access media (minority languages include the two official languages plus ethnic and Indigenous languages). As expected, the large majority of people using these sources for information (66 to 78 per cent) always do so in the official language of their choice (see Chart 2: Language of Access). As with overall popularity of the top-tiered mediums, television and Internet are more likely to have been used to obtain information in a language other than respondents’ official language of choice. Results indicate that one-third of Canadians watch television (33 per cent) or access the Internet (31 per cent) in another language some, most or all of the time. For example, 13 per cent of those indicating they have watched television said that they have done so in another language some of the time. Another 20 per cent said that they have watched television in a minority language most or all of the time. The proportions are similar for accessing the Internet in a minority language some of the time (nine per cent), or most or all of the time (22 per cent).
Fewer access radio (25 per cent), magazines (24 per cent), daily print newspapers (22 per cent), or community print newspapers (22 per cent) in a minority language, although between seven and nine per cent of those using each of these mediums said that they did so in another language some of the time. Fifteen to 16 per cent accessed these in another language most or all of the time.
On average, digital media are somewhat more likely to be accessed in a minority language. One-third of Internet users who watch online television streaming (35 per cent), visit websites (33 per cent), use social media (30 per cent), or read daily online newspapers (29 per cent) said that they do so in another language some, most or all of the time. One-quarter listen to online radio (27 per cent) or read community online newspapers (25 per cent) in a minority language at least some of the time. This breaks down to 10 to 16 per cent accessing these media in a minority language some of the time, and 15 to 21 per cent saying they use these to get information in another language most or all of the time.
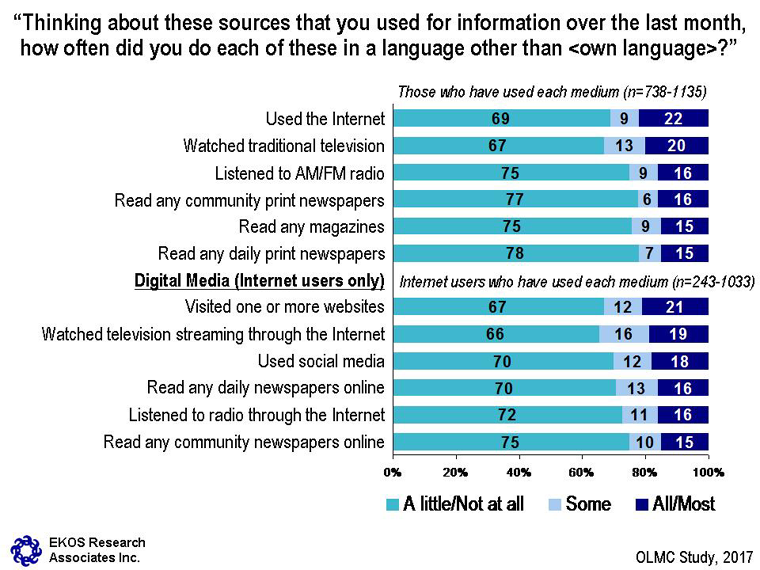
This figure is titled "Language of Access." It shows two sections of six horizontal stacked bar graphs each. All 12 graphs show the breakdown of answers to the question, "Thinking about these sources that you used for information over the last month, how often did you do each of these in a language other than <own language>?"
First section: The first stacked bar graph deals with respondent’s degree of use with the statement, "Used the Internet." The 738-1,135 respondents who have used each medium answered as follows:
The second stacked bar graph deals with respondent’s degree of use with the statement, "Watched traditional television." The 738-1,135 respondents who have used each medium answered as follows:
The third stacked bar graph deals with respondent’s degree of use with the statement, "Listened to AM/FM radio." The 738-1,135 respondents who have used each medium answered as follows:
The fourth stacked bar graph deals with respondent’s degree of use with the statement, "Read any community print newspapers." The 738-1,135 respondents who have used each medium answered as follows:
The fifth stacked bar graph deals with respondent’s degree of use with the statement, "Read any magazines." The 738-1,135 respondents who have used each medium answered as follows:
The sixth stacked bar graph deals with respondent’s degree of use with the statement, "Read any daily print newspapers." The 738-1,135 respondents who have used each medium answered as follows:
Second Section (Digital Media: Internet users only): The first stacked bar graph deals with respondent’s degree of use with the statement, "Visited one or more websites." The 243-1,033 Internet users who have used each medium answered as follows:
The second stacked bar graph deals with respondent’s degree of use with the statement, "Watched television streaming through the Internet." The 243-1,033 Internet users who have used each medium answered as follows:
The third stacked bar graph deals with respondent’s degree of use with the statement, "Used social media." The 243-1,033 Internet users who have used each medium answered as follows:
The fourth stacked bar graph deals with respondent’s degree of use with the statement, "Read any daily newspapers online." The 243-1,033 Internet users who have used each medium answered as follows:
The fifth stacked bar graph deals with respondent’s degree of use with the statement, "Listened to radio through the Internet." The 243-1,033 Internet users who have used each medium answered as follows:
The sixth stacked bar graph deals with respondent’s degree of use with the statement, "Read any community newspapers online." The 243-1,033 Internet users who have used each medium answered as follows:
"Ekos Research associates Inc." and "OLMC Study, 2017"
Compared to older Canadians, those under the age of 45 are more likely to use the Internet and watch traditional television in a minority language. Similarly, those under the age of 45 are consistently more likely to access digital media in a minority language than those ages 45 and over. For example, between 49 and 52 per cent of those under the age of 45 have accessed websites in a minority language, compared to 30 to 39 per cent of those ages 45 and over.
The likelihood of accessing media sources in a minority language does not vary significantly by community setting (e.g., urban versus rural).
Respondents were asked to identify the sources they rely on specifically for information about Government of Canada programs and services (see Chart 3: Sources of Information about GoC Services).
When it comes to digital media, Government of Canada websites rank as the most popular means for accessing information, with three-quarters of Internet users (75 per cent) indicating that they use these sites. Much farther down the list in the case of information about Government of Canada programs and services, four in ten (41 per cent) use social media, and one in three (34 per cent) rely on daily online newspapers. Fewer still depend on television streaming (20 per cent), Internet radio (18 per cent), or community online newspapers (18 per cent).
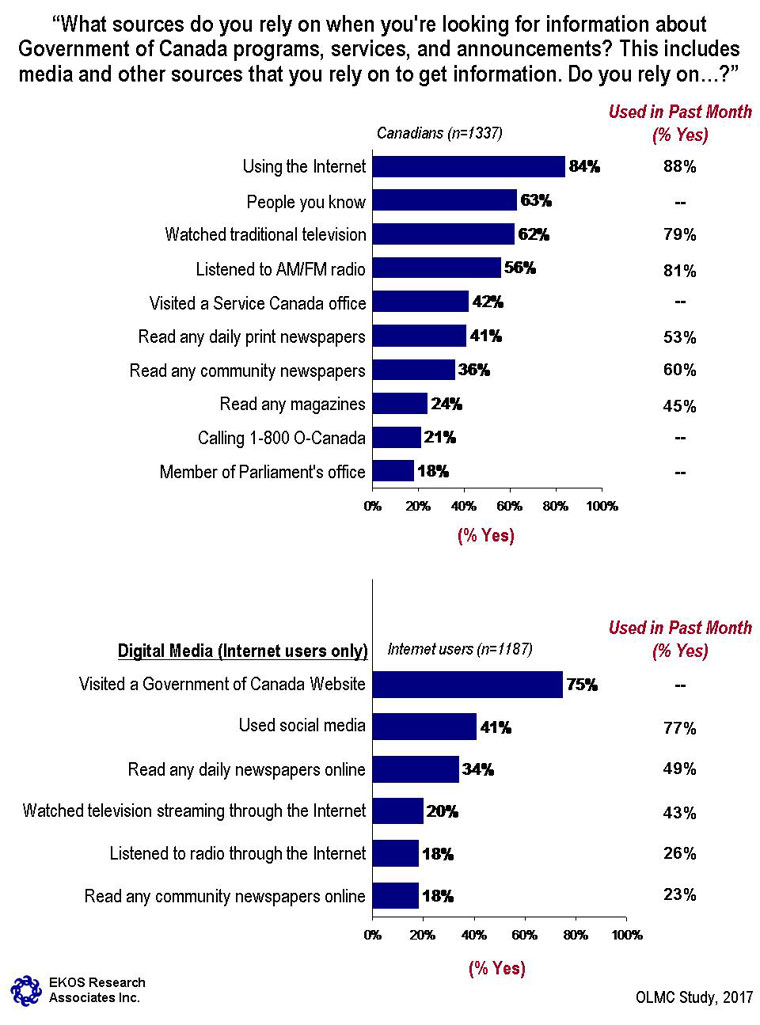
This horizontal bar graph is titled "Sources of Information About Government of Canada Services." It shows two sections of the breakdown of answers to the question, "What sources do you rely on when you're looking for information about Government of Canada programs, services, and announcements? This includes media and other sources that you rely on to get information. Do you rely on…?"
First section: The 1,337 respondents (Canadians) answered as follows (% yes):
Second Section (Digital Media): The 1,187 respondents (Internet users only) answered as follows (% yes):
"Ekos Research associates Inc." and "OLMC Study, 2017"
The likelihood of relying on television increases with age (76 per cent among seniors declining to 54 to 56 per cent among those under 45). Seniors (i.e., those ages 65 and over) are more likely to read print newspapers (both daily and community) and magazines, while they are notably less likely to access the necessary information via the Internet. Reliance on acquaintances diminishes with age.
Use of digital media declines consistently with age. For instance, 56 per cent of those under the age of 35 have used social media to obtain information about government services, compared to just 25 per cent of those ages 65 and over.
Compared to their urban counterparts, those who reside in a rural setting are more likely to read daily print newspapers (47 per cent versus 40 per cent among urban residents) and community print newspapers (48 per cent versus 34 per cent among urban dwellers) for information about Government of Canada services. Urban Canadians, meanwhile, are more likely to use the Internet (85 per cent versus 75 per cent among rural residents). Turning to digital media, residents of urban areas are more likely than rural dwellers to use daily online newspapers (35 per cent compared with 25 per cent in rural areas).
Respondents were asked to select the sources of information through which they would expect to first receive information from the Government of Canada (see Chart 4: Primary Source for Information about New Government of Canada Service or Program):
Turning to digital media, about seven in ten Internet users would expect to first receive this information through the Internet (74 per cent) or a Government of Canada website (67 per cent). Roughly four in ten expect to be informed through social media (44 per cent) or daily online newspapers (38 per cent). The less used media included television streaming (22 per cent), community online newspapers (21 per cent), or Internet radio (19 per cent).
When respondents were restricted to a single, most relied on source, one in five respondents selected traditional television (22 per cent) or the Internet (20 per cent) as their most expected source for first receiving government information. This is followed by 15 per cent expecting to first receive this information from a Government of Canada website. Still further down the list, one in ten pointed to Government of Canada mail (10 per cent), radio (10 per cent), or print newspapers (nine per cent) as their most expected source for information.
The relatively small number of respondents who selected radio as their top source (n=114) were asked whether this is through regular AM/FM radio or a community station. Nine in ten (91 per cent) indicated AM/FM radio as the expected source, while one in ten (nine per cent) expect community stations to be the first source for this information. Similarly, the small number of respondents who pointed to print newspapers (n=133) as the most expected source were asked more specifically if this is through daily print newspapers or community print newspapers. Nine in ten (88 per cent) said that they first expect to receive this information through daily print newspapers, while one in ten (12 per cent) said that community print newspapers are the primary expected source for new information from government.
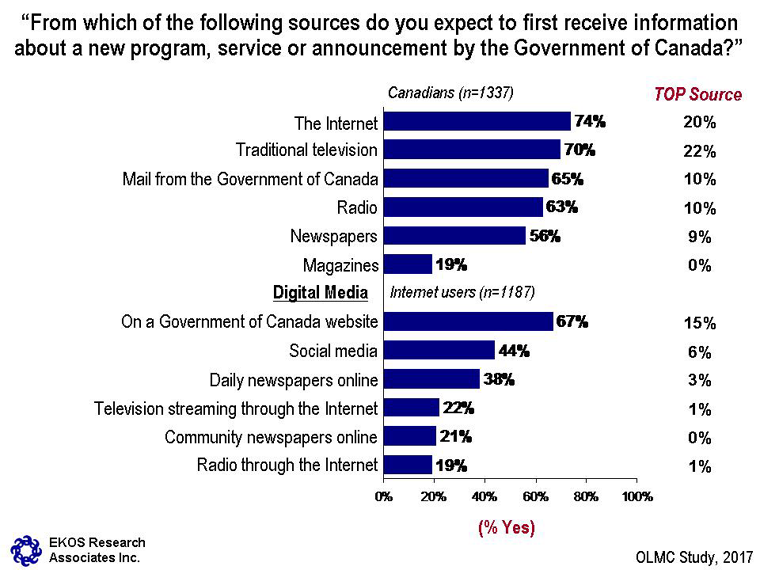
This horizontal bar graph is titled "Primary Source for Information About New Government of Canada Service or Program." It shows two sections of the breakdown of answers to the question, "From which of the following sources do you expect to first receive information about a new program, service or announcement by the Government of Canada?"
First section: The 1,337 respondents (Canadians) answered as follows (% yes):
Second Section (Digital Media): The 1,187 respondents (Internet users) answered as follows (% yes):
"Ekos Research associates Inc." and "OLMC Study, 2017"
Compared to other age groups, seniors (i.e., those ages 65 and over) are more likely to expect to first receive information about government programs and services through traditional television (78 per cent, compared to 66 to 71 per cent among other age cohorts) and magazines (28 per cent, versus 14 to 21 per cent). Young people (under the age of 35) are less likely to depend on newspapers (45 per cent, compared to 56 to 62 per cent among those who are older).
The likelihood of expecting to hear about government programs and services through digital media consistently declines with age. For example, 60 per cent of Canadians under the age of 35 would anticipate first receiving this information through social media, compared to just 21 per cent of those who are 65 and over.
Results generally do not vary by community setting, although urban somewhat more than rural residents are likely to expect their information from the Internet or daily online newspapers.
Those who selected a ‘top source’ in terms of where they first expect to hear about Government of Canada services were asked whether they expected to receive this information in the form of news or advertising. Half of respondents (52 per cent) said that they expect to hear this information through a combination of news coverage and advertising (see Chart 5: Expected Format of Government Information). One-third (35 per cent) anticipate hearing about these services primarily through news coverage. Only six per cent expect to hear about them mainly through advertising.
Results further reveal that regardless of the medium primarily relied on by the respondent, the majority of Canadians anticipate hearing about these services through a combination of news and advertising Footnote 8. Nevertheless, four in ten users of print newspapers (42 per cent), traditional television (40 per cent), radio (40 per cent), and daily online newspapers (37 per cent) expect this information to take the form of news coverage (see Chart 6: Expected Format by Anticipated Medium). This figure drops to three in ten among those who selected the Internet (33 per cent), social media (30 per cent), or a Government of Canada website (28 per cent). Among those who rely primarily on mail, just one in five (22 per cent) expect to receive their information exclusively through news coverage, mostly expecting to see a combination of news and advertising.
Since so few people selected community newspapers, magazines, online television or radio as preferred sources for getting information about Government of Canada programs and services (n=10 to 18 respondents), no reliable conclusions can be drawn about their expectation for finding this information through news, advertising or both. These sources are simply not typically seen as primary sources for first hearing Government of Canada information.
Among those who selected mail from the Government of Canada as their top source, one in five (19 per cent) anticipate receiving information on government services through advertising. Among users of other media, very few (seven per cent or less) expect to receive this information primarily through advertising.
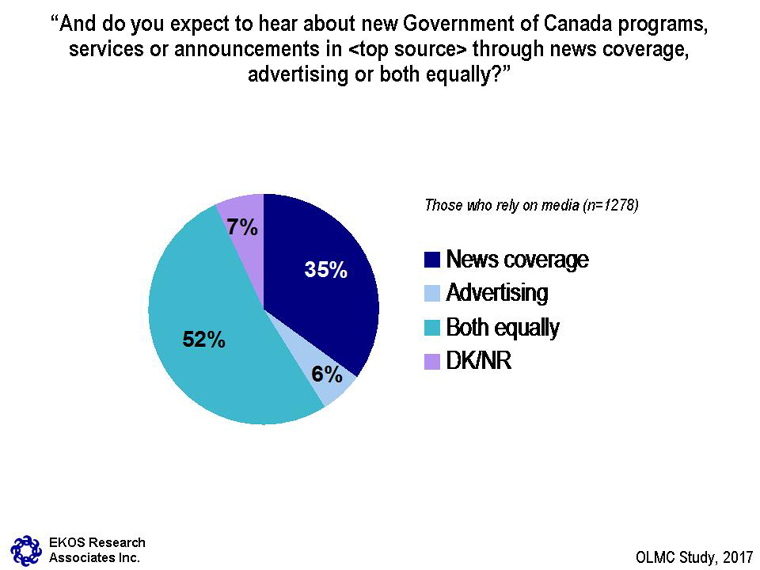
This pie graph is titled "Expected Format of Government Information." It shows the breakdown of answers to the question, "And do you expect to hear about new Government of Canada programs, services or announcements in <top source> through news coverage, advertising or both equally?" The 1,278 respondents who rely on media answered as follows:
"Ekos Research associates Inc." and "OLMC Study, 2017"
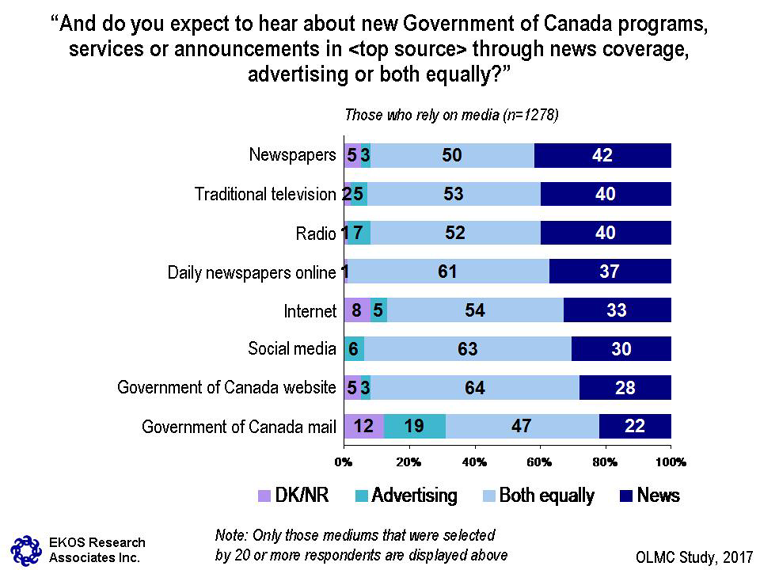
This figure is titled "Expected Format by Anticipated Medium." It shows eight horizontal stacked bar graphs. All eight graphs show the breakdown of answers to the question, "And do you expect to hear about new Government of Canada programs, services or announcements in <top source> through news coverage, advertising or both equally?"
The first stacked bar graph deals with respondent’s answer to the statement, "Newspapers." The 1,278 respondents who rely on media answered as follows:
The second stacked bar graph deals with respondent’s answer to the statement, "Traditional television." The 1,278 respondents who rely on media answered as follows:
The third stacked bar graph deals with respondent’s answer to the statement, "Radio." The 1,278 respondents who rely on media answered as follows:
The fourth stacked bar graph deals with respondent’s answer to the statement, "Daily newspapers online." The 1,278 respondents who rely on media answered as follows:
The fifth stacked bar graph deals with respondent’s answer to the statement, "Internet." The 1,278 respondents who rely on media answered as follows:
The sixth stacked bar graph deals with respondent’s answer to the statement, "Social media." The 1,278 respondents who rely on media answered as follows:
The seventh stacked bar graph deals with respondent’s answer to the statement, "Government of Canada website." The 1,278 respondents who rely on media answered as follows:
The eighth stacked bar graph deals with respondent’s answer to the statement, "Government of Canada mail." The 1,278 respondents who rely on media answered as follows:
Note: Only those mediums that were selected by 20 or more respondents are displayed above
"Ekos Research associates Inc." and "OLMC Study, 2017"
The vast majority of Canadians have looked for information about a Government of Canada program or service in the past year (see Chart 7: Incidence of Searching for Information). In fact, only one in seven (15 per cent) say they did not search for information from the Government of Canada in the past year. Almost four in ten (37 per cent) looked for information two to five times. Another one in five undertook six to ten searches (19 per cent) and the same proportion searched more than 10 times (19 per cent).
Of those respondents who have searched for information in the past year, fully three-quarters (77 per cent) sought information about taxes (see Chart 8: Incidence of Searching for Information). About half looked for information regarding passports (50 per cent), health (46 per cent), or pensions (46 per cent). Further down the list, about one in four (28 per cent) inquired about employment insurance. Other relatively common searches include information to help businesses (16 per cent) and programs for Indigenous people (10 per cent).
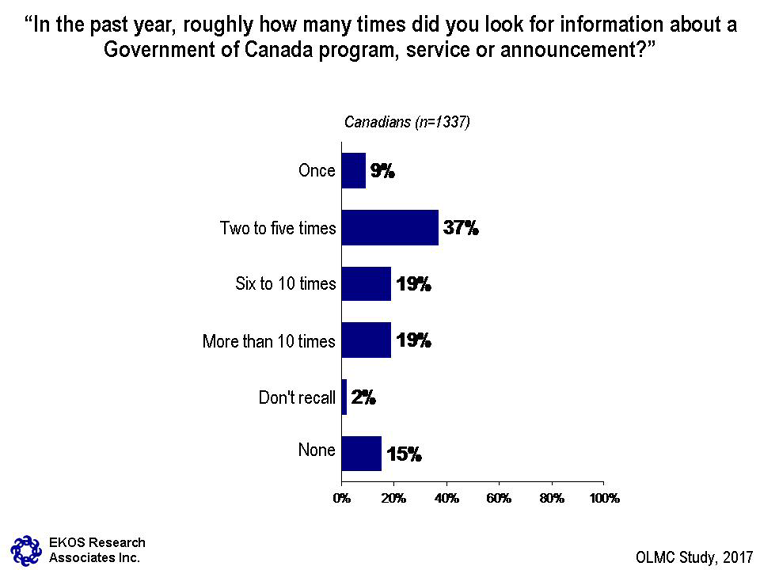
This horizontal bar graph is titled "Incidence of Searching for Information." It shows the breakdown of answers to the question, "In the past year, roughly how many times did you look for information about a Government of Canada program, service or announcement?" The 1,337 respondents (Canadians) answered as follows:
"Ekos Research associates Inc." and "OLMC Study, 2017"
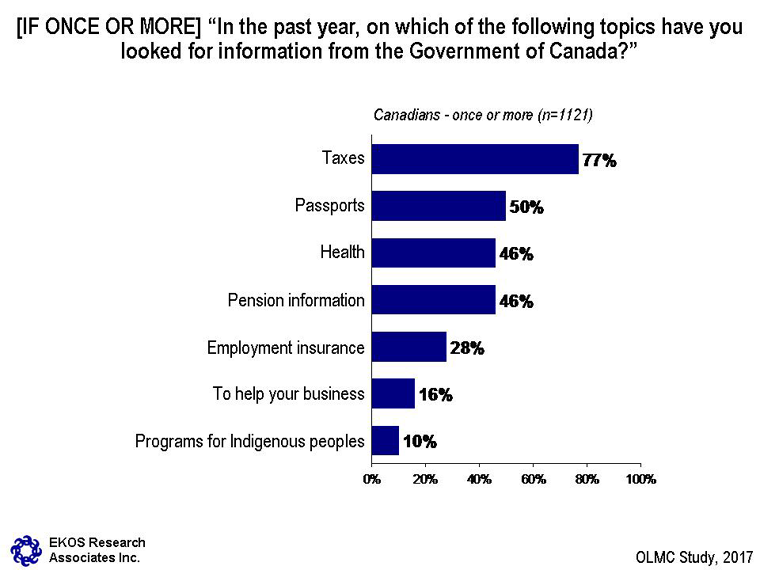
This horizontal bar graph is titled "Incidence of Searching for Information." It shows the breakdown of answers to the question, "[IF ONCE OR MORE] In the past year, on which of the following topics have you looked for information from the Government of Canada?" The 1,121 respondents (Canadians) answered as follows:
"Ekos Research associates Inc." and "OLMC Study, 2017"
Young adults (i.e., those under the age of 35) are more likely to have searched for information about a Government of Canada program or service in the past year. Fully 50 per cent of these respondents have searched for this information six or more times, compared to 38 per cent on average. In contrast, seniors (i.e., those ages 65 and over) are the least likely to have searched this frequently (21 per cent say they have searched for information six or more times in the past year).
Among those who have searched for information about government services at least once in the past year, those 55 and over are considerably more likely to have sought information about pensions (66 to 67 per cent, compared to 33 to 40 per cent among other age groups). In contrast, those under the age of 55 are more likely to have searched for information about passports (53 to 58 per cent, compared to 38 to 42 per cent among other age groups).The likelihood of searching for information about employment insurance decreases with age (from 38 per cent among those under the age of 35 to nine per cent among those ages 65 and over). Seniors are the least likely to have searched for information about taxes (69 per cent, compared to 77 per cent on average) and information to help with their business (six per cent, compared to 16 per cent on average).
Among those who had searched for information at least once in the past year, rural residents are more likely to have sought information to help them with their businesses (24 per cent, compared to 14 per cent of respondents who live in urban areas).
The vast majority of Canadians are satisfied with the various means through which the Government of Canada has sought to inform citizens about its programs and services (see Chart 9: Satisfaction with Government Information). One in five (18 per cent) reported a high level of satisfaction with the Government of Canada’s communication efforts, while six in ten (62 per cent) said they are moderately satisfied. One in ten (11 per cent) expressed limited satisfaction and only just five per cent said they are not at all satisfied.
Among respondents who expressed limited satisfaction with how the Government of Canada communicates information about its programs, many attributed this to generally not hearing much about government programs and policies (see Chart 10: Reasons for Dissatisfaction with Government Information). For instance, one-quarter (24 per cent) said they generally do not often hear about government programs, policies and services, and another quarter said that government communications are not transparent or purposely lacking in details (23 per cent). Fourteen per cent generally expressed negative points of view about government. Fewer than ten per cent said that they lacked access to digital sources or generally preferred sources not used or that they find government information difficult to find or access (i.e., takes effort to find what they are looking for).
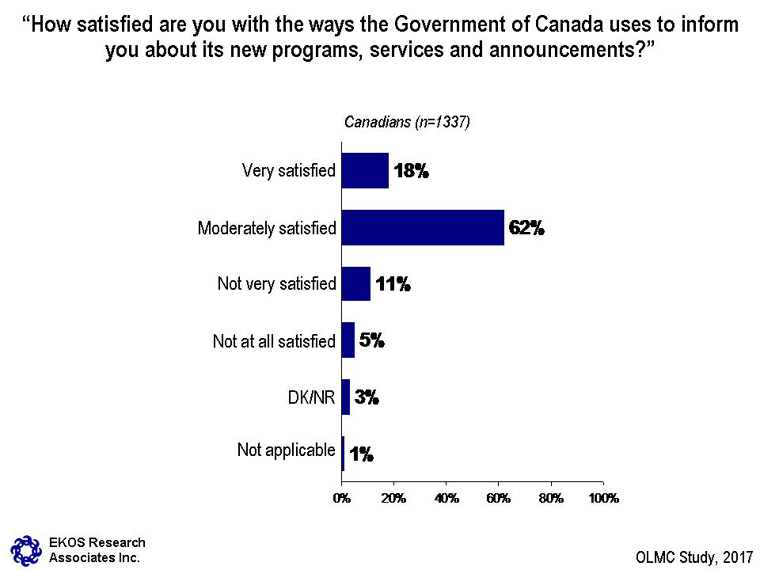
This horizontal bar graph is titled "Satisfaction with Government Information." It shows the breakdown of answers to the question, "How satisfied are you with the ways the Government of Canada uses to inform you about its new programs, services and announcements?" The 1,337 respondents (Canadians) answered as follows:
"Ekos Research associates Inc." and "OLMC Study, 2017"
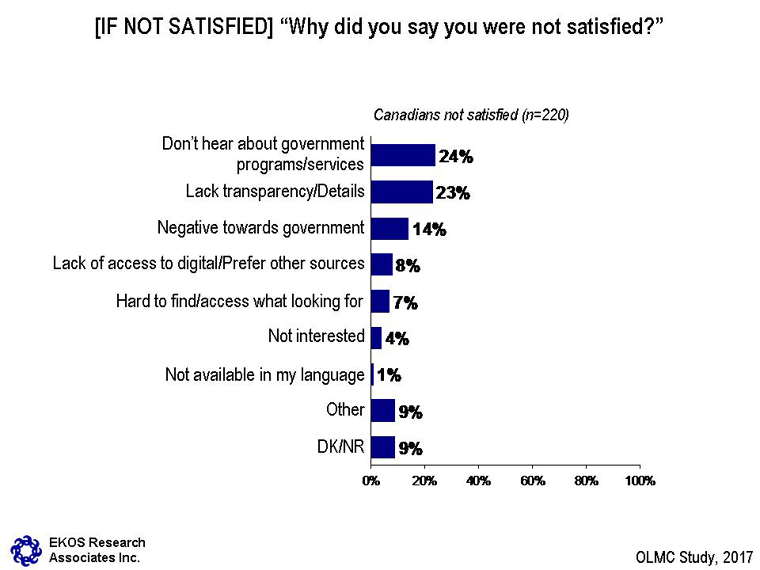
This horizontal bar graph is titled "Reasons for Dissatisfaction with Government Information." It shows the breakdown of answers to the question, "[IF NOT SATISFIED] Why did you say you were not satisfied?" The 120 respondents (Canadians who are not satisfied) answered as follows:
"Ekos Research associates Inc." and "OLMC Study, 2017"
This chapter presents the results in the same issue areas, but with a focus on comparing preferences and strategies of language minority (both official language and ethnocultural minorities) versus language majority Anglophones and Francophones. Analysis points primarily to similarities between language minority and majority residents, followed by any significant differences.
Respondents across all four target groups report similar usage of Internet, radio, and community print newspapers (for instance, the percentage of Canadians who read community print newspapers ranges from 53 per cent among minority Anglophones to 61 per cent among majority Anglophones) (see Table 3: Means of Staying Informed). Compared with other language groups, minority Anglophones residing in Quebec are consistently less likely to have watched television (69 per cent), listened to the radio (75 per cent), or read a daily print newspaper (44 per cent) or magazine (36 per cent). Reading community print newspapers is roughly similar across the four segments, if marginally lower among Anglophone minorities in Quebec (53 per cent). It represents over half (58 per cent), however of Francophone minorities, along with 55 per cent of Francophone majorities, and 61 per cent of Anglophone majorities.
Across digital media, similar proportions of Canadians in each of the four language segments have gone to websites, used social media, read daily online newspapers, listened to online radio, and read community online newspapers for information. For example, the percentage of Canadians who listen to online radio ranges from 23 per cent among majority Francophones living in Quebec to 28 per cent among minority Anglophones living in Quebec. Similarly, 21 and 23 per cent of Anglophone and Francophone minorities, respectively, said they have used online community newspapers for information, along with 24 and 20 per cent of Anglophone and Francophone majorities. Francophone respondents in general, and minority Francophones in particular, are noticeably less likely to have watched television streaming through the Internet (40 and 26 per cent, respectively), compared with their Anglophone counterparts.
| Sample population | Anglophones: Majority (RoC) (n=722) |
Anglophones: Minority (QC) (n=461) |
Francophones: Majority (QC) (n=511) |
Francophones: Minority (RoC) (n=1,179) |
|---|---|---|---|---|
| Used the Internet | 89% | 89% | 88% | 88% |
| Listened to AM/FM radio | 80% | 75% | 83% | 79% |
| Watched traditional television | 77% | 69% | 89% | 78% |
| Read any neighbourhood or community print newspapers (i.e., non-daily) | 61% | 53% | 55% | 58% |
| Read any daily print newspapers | 54% | 44% | 52% | 53% |
| Read any magazines | 47% | 36% | 41% | 41% |
| Other digital: | (n=649) | (n=411) | (n=447) | (n=989) |
| Visited one or more websites | 93% | 92% | 89% | 92% |
| Used Social media (e.g., Facebook, YouTube, LinkedIn) | 78% | 75% | 76% | 74% |
| Read any daily newspapers online | 48% | 54% | 51% | 50% |
| Watched television streaming through the Internet | 48% | 51% | 26% | 40% |
| Listened to radio through the Internet | 27% | 28% | 23% | 26% |
| Read any neighbourhood or community newspapers (i.e., non-daily) online |
24% | 21% | 20% | 23% |
Survey results suggest that minority Francophones are consistently several times more likely to use any of the media tested (both digital and otherwise) in a minority language "most" or "all" of the time, compared with other segments (see Table 4: Extent Sources Are Accessed in Minority Language). For instance, 70 per cent of minority Francophones living outside Quebec use social media in a language other than French all or most of the time, compared to just 30 per cent of majority Francophones in Quebec, and 13 to 15 per cent of all Anglophones who say they access social media most or all of the time in a language other than English. Similarly, minority Anglophones in Quebec are also consistently more likely to have accessed these media in a language other than English at least "some" of the time (19 per cent) compared with other Anglophones (11 per cent).
Lastly, majority Francophones and majority Anglophones have similar usage habits when it comes to community newspapers (both online and print). On each of the other media tested, however, majority Francophones are consistently more likely to have accessed it in a minority language, particularly when it comes to the Internet, websites, and online television streaming. For example, 65 per cent of majority Francophones access online television streaming in another language at least some of the time, compared to 28 per cent of majority Anglophones.
| Sample population Footnote 9 | Anglophones: Majority (RoC) |
Anglophones: Minority (QC) |
Francophones: Majority (QC) |
Francophones: Minority (RoC) |
|---|---|---|---|---|
| Used the Internet | 16% | 15% | 41% | 74% |
| Listened to AM/FM radio | 13% | 12% | 22% | 67% |
| Watched traditional television | 15% | 14% | 29% | 64% |
| Read any neighbourhood or community print newspapers (i.e., non-daily) | 15% | 13% | 10% | 51% |
| Read any daily print newspapers | 13% | 17% | 14% | 60% |
| Read any magazines | 13% | 12% | 17% | 59% |
| Other digital: | n/a | n/a | n/a | n/a |
| Visited one or more websites | 14% | 13% | 39% | 77% |
| Used Social media (e.g., Facebook, YouTube, LinkedIn) | 13% | 15% | 30% | 70% |
| Read any daily newspapers online | 12% | 17% | 26% | 65% |
| Watched television streaming through the Internet | 14% | 13% | 41% | 70% |
| Listened to radio through the Internet | 12% | 10% | 33% | 55% |
| Read any neighbourhood or community newspapers (i.e., non-daily) online | 14% | 9% | 10% | 53% |
| Sample population | Anglophones: Majority (RoC) |
Anglophones: Minority (QC) |
Francophones: Majority (QC) |
Francophones: Minority (RoC) |
|---|---|---|---|---|
| Used the Internet | 6% | 26% | 17% | 15% |
| Listened to AM/FM radio | 6% | 26% | 12% | 17% |
| Watched traditional television | 10% | 22% | 19% | 19% |
| Read any neighbourhood or community print newspapers (i.e., non-daily) | 4% | 25% | 8% | 17% |
| Read any daily print newspapers | 5% | 21% | 12% | 17% |
| Read any magazines | 6% | 20% | 19% | 18% |
| Other digital: | n/a | n/a | n/a | n/a |
| Visited one or more websites | 9% | 30% | 20% | 12% |
| Used Social media (e.g., Facebook, YouTube, LinkedIn) | 11% | 19% | 15% | 14% |
| Read any daily newspapers online | 11% | 25% | 16% | 18% |
| Watched television streaming through the Internet | 14% | 22% | 24% | 13% |
| Listened to radio through the Internet | 8% | 22% | 17% | 20% |
| Read any neighbourhood or community newspapers (i.e., non-daily) online | 9% | 23% | 10% | 16% |
Those residents of language minority communities where the official minority language is rare (i.e., fewer than five per cent of the population speak it) are much more likely to say they use each of the sources, with the exception of community online newspapers, and most or even all of the time in a minority language. Similarly, those living in communities where the official minority language is spoken by 20 to 49 per cent of the community population are much more likely to say they never or rarely access information in a minority language.
Language minority residents living in rural communities are much more likely than urban dwellers to say they access television, radio, community newspapers (print and online), and even the Internet in general, in a language other than their own at least some of the time.
As discussed previously, Canadians seek information about Government of Canada programs and services primarily through Internet, followed by conversations with acquaintances, television, and radio. Service Canada centres and daily newspapers are less used sources for government information, according to about half of respondents. Fewer Canadians use community print newspapers, magazines, 1-800-O-Canada and their local Members of Parliament to access information about government programs, services, and announcements.
In terms of key differences between the segments, minority Anglophones living in Quebec are less likely to watch television (54 per cent), read daily (33 per cent) or community print (31 per cent) newspapers, or read magazines (15 per cent) to get news about Government of Canada programs and services, compared with language majority residents or Francophone minority residents living in the rest of Canada (i.e., the other three segments) (see Table 6: Sources of Information about Government of Canada Services). Francophone minorities living outside Quebec, on the other hand, are more likely than other segments to rely on community print newspapers (40 per cent), although this is only the eight most popular source overall for Government of Canada information.
With regard to digital media, similar patterns exist across the linguistic segments. All respondents are generally equal in their likelihood of relying on government websites, social media, and daily online newspapers. Television streaming and Internet radio are also seen as preferred sources among equal proportions of Francophones and Anglophones majorities, although the reliance is marginally greater among Anglophone minorities (27 per cent preferring to stream television and 23 per cent preferring online radio for government information). Francophones minorities living outside of Quebec, however, are noticeably more likely to depend on community online newspapers (27 per cent), compared with Anglophones or majority Francophones living in Quebec, although community newspapers still only rank eighth out of the media tested among minority Francophones.
| Sample population | Anglophones: Majority (RoC) (n=722) |
Anglophones: Minority (QC) (n=461) |
Francophones: Majority (QC) (n=511) |
Francophones: Minority (RoC) (n=1,179) |
|---|---|---|---|---|
| Using the Internet | 85% | 88% | 82% | 86% |
| People you know | 63% | 62% | 63% | 68% |
| Listened to AM/FM radio | 57% | 52% | 53% | 53% |
| Watched traditional television | 60% | 54% | 72% | 65% |
| Service Canada office | 40% | 40% | 48% | 50% |
| Read any daily print newspapers | 40% | 33% | 45% | 50% |
| Read any neighbourhood or community print newspapers (i.e., non-daily) | 35% | 31% | 37% | 40% |
| Read any magazines | 25% | 15% | 23% | 24% |
| Calling 1-800 O-Canada | 19% | 27% | 27% | 31% |
| Member of Parliament's office | 18% | 16% | 17% | 21% |
| Other digital: | (n=649) | (n=411) | (n=447) | (n=989) |
| Visiting a Government of Canada website | 74% | 81% | 78% | 80% |
| Used Social media (e.g., Facebook, YouTube, LinkedIn) | 44% | 42% | 33% | 40% |
| Read any daily newspapers online | 34% | 34% | 35% | 37% |
| Watched television streaming through the Internet | 21% | 27% | 15% | 21% |
| Listened to radio through the Internet | 18% | 23% | 17% | 16% |
| Read any neighbourhood or community newspapers (i.e., non-daily) online | 18% | 18% | 17% | 27% |
Looking at traditional media, respondents of all language backgrounds express similar expectations in terms of receiving information through the Internet, radio, or magazines (see Table 7: Sources of Information about Government of Canada Programs and Services). Anglophones: both majorities and minorities—are more likely to anticipate receiving information from Government of Canada issued mail, compared with their respective Francophone counterparts, whereas Francophone Quebecers are more likely to select traditional television. Minority Francophones living outside of Quebec are more likely to rely on print newspapers than minority Anglophones in Quebec.
| Sample population | Anglophones: Majority (RoC) (n=722) |
Anglophones: Minority (QC) (n=461) |
Francophones: Majority (QC) (n=511) |
Francophones: Minority (RoC) (n=1,179) |
|---|---|---|---|---|
| The Internet | 73% | 82% | 81% | 77% |
| Mail from the Government of Canada | 67% | 72% | 58% | 62% |
| Traditional television | 67% | 60% | 80% | 70% |
| Radio | 64% | 54% | 60% | 61% |
| Newspapers Footnote 10 | 55% | 52% | 59% | 61% |
| Magazines | 19% | 16% | 20% | 21% |
| Other digital: | (n=649) | (n=411) | (n=447) | (n=989) |
| On a Government of Canada website | 64% | 71% | 77% | 78% |
| Social media (e.g., Facebook, YouTube, LinkedIn) | 46% | 47% | 40% | 42% |
| Daily newspapers online | 35% | 44% | 47% | 44% |
| Television streaming through the Internet | 23% | 27% | 21% | 25% |
| Neighbourhood or community newspapers (i.e., non-daily) online | 21% | 20% | 22% | 27% |
| Radio through the Internet | 19% | 21% | 19% | 20% |
Turning to digital media, all groups are equally likely to identify social media, television streaming, and Internet radio as a primary source of information about Government of Canada programs and services. Francophones: both minorities and majorities—are more likely than Anglophones to cite Government of Canada websites as a key source of information. Minority Francophones living outside of Quebec are slightly more likely to point to community online newspapers than the other three language segments, whereas majority Anglophones are less likely to select daily online newspapers.
Results suggest that Canadians from all language groups share similar expectations when it comes to the format of the information they receive regarding government programs, services, and announcements (see Table 8: Expected Format of Information about Government Services).
| Sample population | Anglophones: Majority (RoC) (n=691) |
Anglophones: Minority (QC) (n=452) |
Francophones: Majority (QC) (n=493) |
Francophones: Minority (RoC) (n=1,145) |
|---|---|---|---|---|
| News coverage | 37% | 33% | 32% | 31% |
| Advertising | 5% | 6% | 10% | 5% |
| Both equally | 52% | 55% | 51% | 58% |
| Don't know/No response | 6% | 7% | 8% | 6% |
Results highlight that all Anglophones are slightly less satisfied with the federal government’s communication efforts compared with Francophones. Fully 85 to 87 per cent of Francophones say they are very or at least moderately satisfied with the manner in which the Government of Canada keeps its citizens informed, compared to 78 to 80 per cent of Anglophones (see Table 9: Satisfaction with Government Information). In contrast, just eight to 11 per cent of Francophones expressed limited satisfaction, compared to 18 to 19 per cent of Anglophones. This level of satisfaction, however, is statistically no lower or higher among Anglophone minority residents than it is among other Anglophones.
In terms of reasons for being limited satisfaction with government information, the relatively small sample sizes preclude any meaningful analysis regarding differences across the four language segments (see Table 10: Reasons for Dissatisfaction with Government Information).
| Sample population | Anglophones: Majority (RoC) (n=722) |
Anglophones: Minority (QC) (n=461) |
Francophones: Majority (QC) (n=511) |
Francophones: Minority (RoC) (n=1,179) |
|---|---|---|---|---|
| Very satisfied | 17% | 19% | 20% | 23% |
| Moderately satisfied | 61% | 61% | 65% | 64% |
| Not very satisfied | 12% | 14% | 9% | 5% |
| Not at all satisfied | 7% | 4% | 2% | 3% |
| Don't know/No response | 2% | 2% | 3% | 4% |
| Not applicable | 1% | 0% | 1% | 1% |
| Sample population | Anglophones: Majority (RoC) (n=146) |
Anglophones: Minority (QC) (n=76) |
Francophones: Majority (QC) (n=57) |
Francophones: Minority (RoC) (n=128) |
|---|---|---|---|---|
| Do not hear about government programs/policies | 22% | 25% | 35% | 32% |
| Not transparent/Lack details | 25% | 17% | 22% | 16% |
| Generally unhappy with government | 15% | 12% | 8% | 8% |
| Lack of access to digital/Prefer other sources | 8% | 2% | 2% | 6% |
| Hard to find/access | 5% | 14% | 14% | 6% |
| Not interested | 4% | 12% | 3% | 1% |
| Other | 10% | 10% | 7% | 10% |
| Don't know/No response | 10% | 3% | 9% | 12% |
This chapter focuses on results of official language minority respondents regarding availability of media in their own language, and strategies they employ to obtain information.
Among Anglophone minorities living in Quebec, eight in ten (79 per cent reported that they look for Government of Canada information in English. Another 18 per cent look for it in both languages equally and only three per cent look for it in French only. Among Francophone minorities living in the rest of Canada, however, the story is quite different. In this case, the largest proportion looks for Government of Canada information in both French and English equally (46 per cent). Three in ten (29 per cent) look for it in French, but nearly one in four (23 per cent) look for it in English.
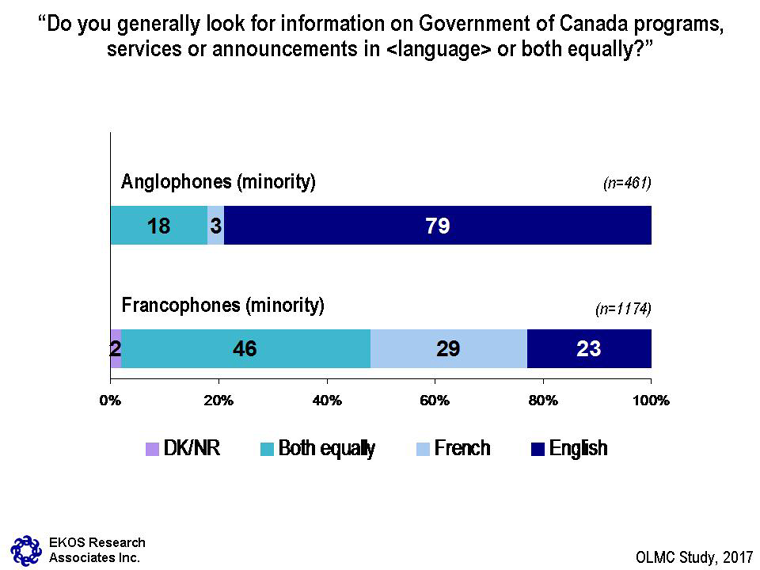
This figure is titled "Language of Government of Canada Information." It shows two horizontal stacked bar graphs. All two graphs show the breakdown of answers to the question, "Do you generally look for information on Government of Canada programs, services or announcements in <language> or both equally?"
The first stacked bar graph deals with the language of access for Government of Canada information for the "Anglophones." The 461 respondents answered as follows:
The second stacked bar graph deals with the language of access for Government of Canada information for the "Francophones." The 1,174 respondents answered as follows:
"Ekos Research associates Inc." and "OLMC Study, 2017"
Because very few Anglophone minorities said they look for Government of Canada information in French, there are not sufficient respondents answering the question about why they do this to support meaningful analysis. Among the 23 per cent of Francophone minorities in the sample who said they look for information in English, however, six in ten (61 per cent) said that this is because it is easier to understand. One in four (26 per cent) said this is the language they prefer to use and the same proportion said that it is the language used by most residents in the community (24 per cent). Very few said that they cannot find French information, or that it is insufficient or poorly translated.
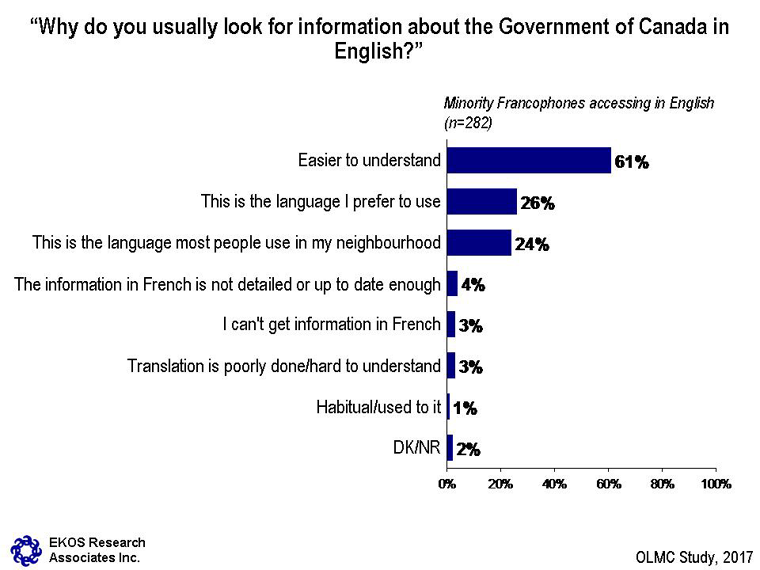
This horizontal bar graph is titled "Reason for Accessing Information in Other Official Language." It shows the breakdown of answers to the question, "Why do you usually look for information about the Government of Canada in English?" The 282 respondents (Francophones accessing in English) answered as follows:
"Ekos Research associates Inc." and "OLMC Study, 2017"
Not surprisingly, minority Francophones living in communities with a higher proportion of French-language residents (five per cent or more) are much less likely to say that English is the language most used by residents in the community (10 to 12 per cent, compared to 42 per cent of those who live in communities where Francophones make up less than five per cent of the population). Instead, they are more likely to attribute their use of English-language media to personal preference (40 to 42 per cent versus eight per cent).
Official minority-language respondents were first asked if they had access to community newspapers in their respective languages. Results suggest that the availability of official language—minority newspapers is relatively consistent for both Anglophones and Francophones, with roughly two in three reporting that one exists and one in four saying they do not have this type of publication in their community (see Chart 13: Availability of Official Language Minority Newspapers). Between six and 13 per cent are unsure.
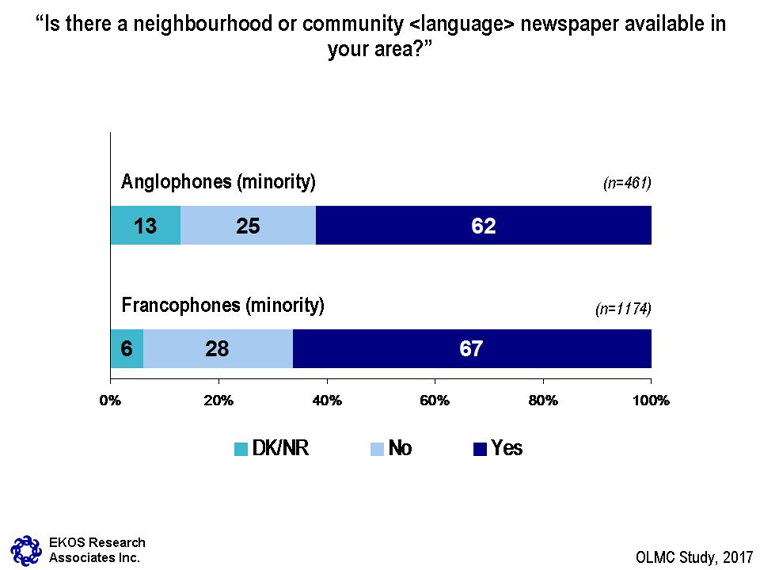
This figure is titled "Availability of Official Language—Minority Newspapers." It shows two horizontal stacked bar graphs. All two graphs show the breakdown of answers to the question, "Is there a neighbourhood or community <language> newspaper available in your area?"
The first stacked bar graph deals with the availability of official language—minority newspapers for the "Anglophones (minority)." The 461 respondents answered as follows:
The second stacked bar graph deals with the availability of official language—minority newspapers for the "Francophones (minority)." The 1,174 respondents answered as follows:
"Ekos Research associates Inc." and "OLMC Study, 2017"
Naturally those living in communities with a higher proportion of official minority language residents (e.g., 20 per cent of more) are considerably more likely to say they have an official language—minority community newspaper (70 per cent), although even among residents of communities where the official minority language represents five per cent or fewer of the residents, 60 per cent of respondents said they have an official minority-language community newspaper.
Those respondents indicating access to an official language—minority community newspaper were asked to rate the frequency with which they read these newspapers. Results suggest that the newspaper usage habits of official minority-language Anglophones and Francophones are virtually identical (see Chart 14: Use of Official Language—Minority Newspapers: Anglophones and Chart 15: Use of Official Language—Minority Newspapers: Francophones). In each case, three in four respondents read the official language—minority community newspaper at least once a month. Another one in three read some of the editions on a monthly basis. Only one in five read every edition.
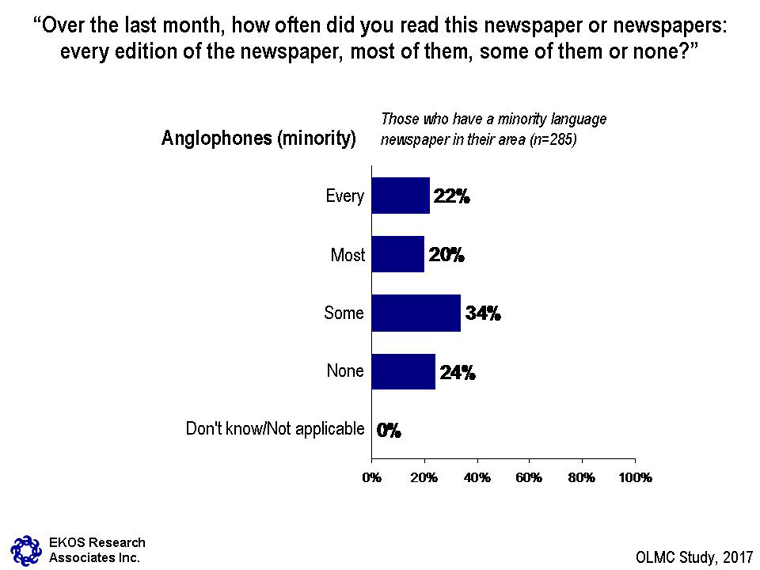
This horizontal bar graph is titled "Use of Official Language—Minority Newspapers: Anglophones." It shows the breakdown of answers to the question, "Over the last month, how often did you read this newspaper or newspapers: every edition of the newspaper, most of them, some of them or none?" The 285 respondents (Anglophones: minority) who answered they have a minority language newspaper in their area answered as follows:
"Ekos Research associates Inc." and "OLMC Study, 2017"
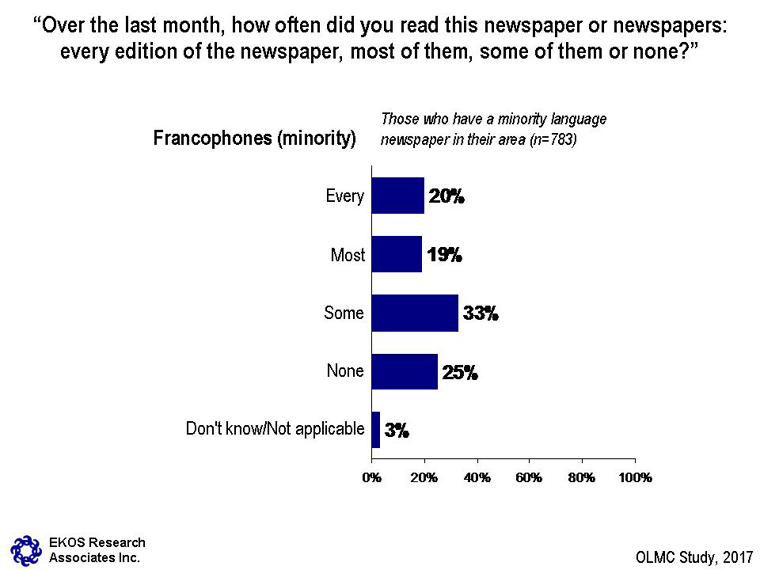
This horizontal bar graph is titled "Use of Official Language—Minority Newspapers: Francophones." It shows the breakdown of answers to the question, "Over the last month, how often did you read this newspaper or newspapers: every edition of the newspaper, most of them, some of them or none?" The 783 respondents (Francophones: minority) who answered they have a minority language newspaper in their area answered as follows:
"Ekos Research associates Inc." and "OLMC Study, 2017"
Older official minority-language residents are the most likely to say that they read most or all of the publications (53 per cent compared with only 18 per cent of those under 35).
Official minority-language respondents were then asked about the local availability of official language—minority community radio. In this case, results point to a notable disparity between language segments. Fully seven in ten official minority language Francophones living outside of Quebec (70 per cent) report access to official language—minority radio in their community (see Chart 16: Availability of Official Language—Minority Radio). In contrast, just half of minority Anglophones living in Quebec (49 per cent) say there is an official language—minority radio station in their area.
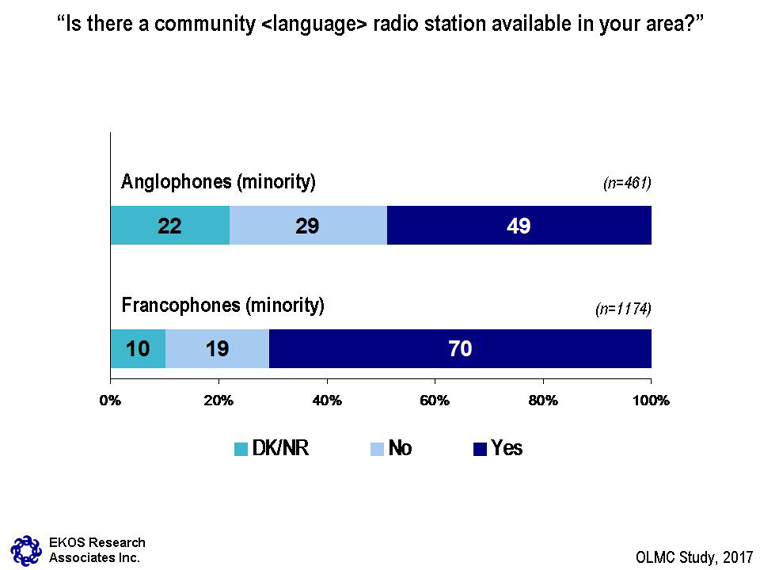
This figure is titled "Availability of Official Language—Minority Radio." It shows two horizontal stacked bar graphs. All two graphs show the breakdown of answers to the question, "Is there a community <language> radio station available in your area?"
The first stacked bar graph deals with the availability of official language—minority radio for the "Anglophones (minority)." The 461 respondents answered as follows:
The second stacked bar graph deals with the availability of official language minority radio for the "Francophones (minority)." The 1,174 respondents answered as follows:
"Ekos Research associates Inc." and "OLMC Study, 2017"
Those respondents indicating access to official language minority radio were asked to estimate the number of hours that they listen to these stations in a typical day. Results suggest that, compared to official minority-language Francophones, minority Anglophones make slightly greater use of official language—minority radio, only 22 per cent saying they do not listen at all and 19 per cent saying they listen for more than two hours each day (see Chart 17: Consumption of Official Language—Minority Radio: Anglophones and Chart 18: Consumption of Official Language—Minority Radio: Francophones). Among Francophones, one in three do not listen at all and only 12 per cent tune in, in excess of two hours each day.
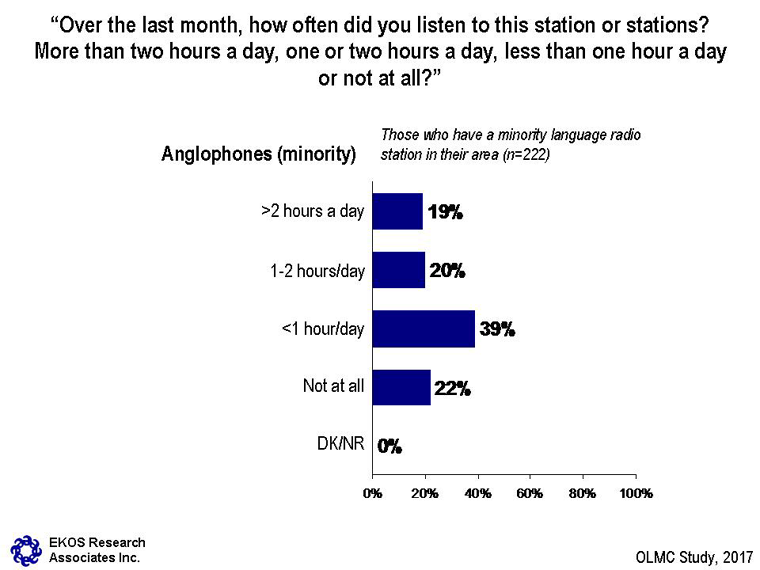
This horizontal bar graph is titled "Consumption of Official Language—Minority Radio: Anglophones." It shows the breakdown of answers to the question, "Over the last month, how often did you listen to this station or stations? More than two hours a day, one or two hours a day, less than one hour a day or not at all?" The 222 respondents (Anglophones: minority) who answered they have a minority language radio in their area answered as follows:
"Ekos Research associates Inc." and "OLMC Study, 2017"
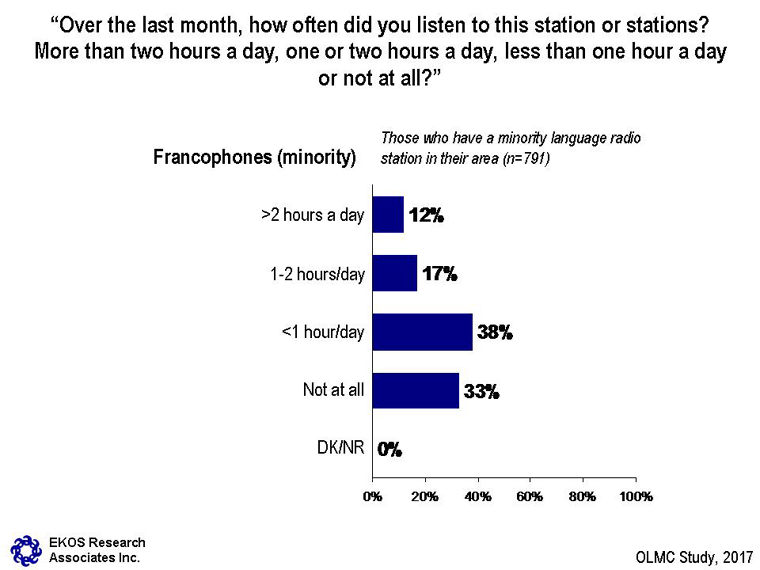
This horizontal bar graph is titled "Consumption of Official Language Minority Radio: Francophones." It shows the breakdown of answers to the question, "Over the last month, how often did you listen to this station or stations? More than two hours a day, one or two hours a day, less than one hour a day or not at all?" The 791 respondents (Francophones: minority) who answered they have a minority language radio in their area answered as follows:
"Ekos Research associates Inc." and "OLMC Study, 2017"
Official minority-language residents who are 65 or older report the greatest daily use of official language—minority radio stations (45 per cent reporting at least one hour her day of listening).
Those official minority-language respondents who access official language—minority community media – either newspapers on radio – were asked to explain why they choose to use these media sources, with limited differences expressed between the two language segments. Two-thirds of minority Anglophones (67 per cent) and minority Francophones (68 per cent) said they use these media to follow local events and news (see Chart 19: Reasons for Using Official Language—Minority Community Media – Anglophones and Chart 20: Reasons for Using Official Language—Minority Community Media – Francophones). Other respondents said that minority-language community media are easier to find, that they are a superior source of information, they are more credible than other forms of media, they provide interesting subject matter, or that they are the only media source available in my official language.
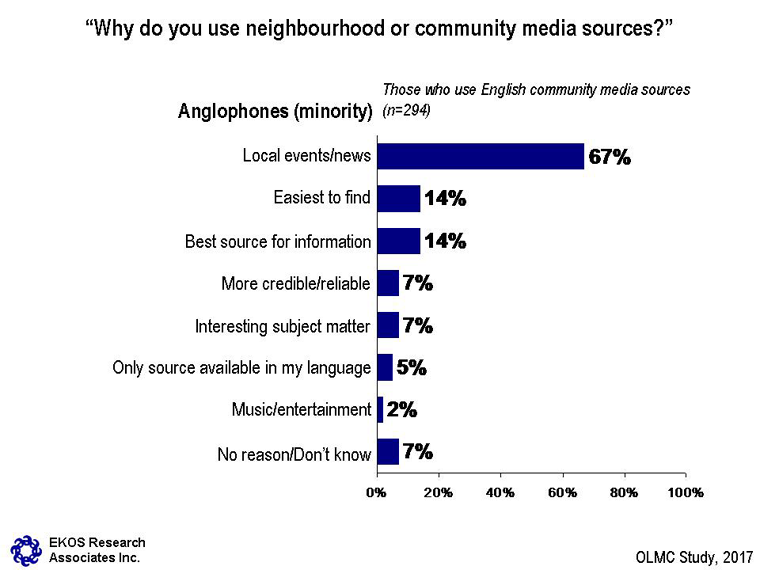
This horizontal bar graph is titled "Reasons for Using Official Language—Minority Community Media: Anglophones." It shows the breakdown of answers to the question, "Why do you use neighbourhood or community media sources?" The 294 respondents (Anglophones: minority) who use English community media sources answered as follows:
"Ekos Research associates Inc." and "OLMC Study, 2017"
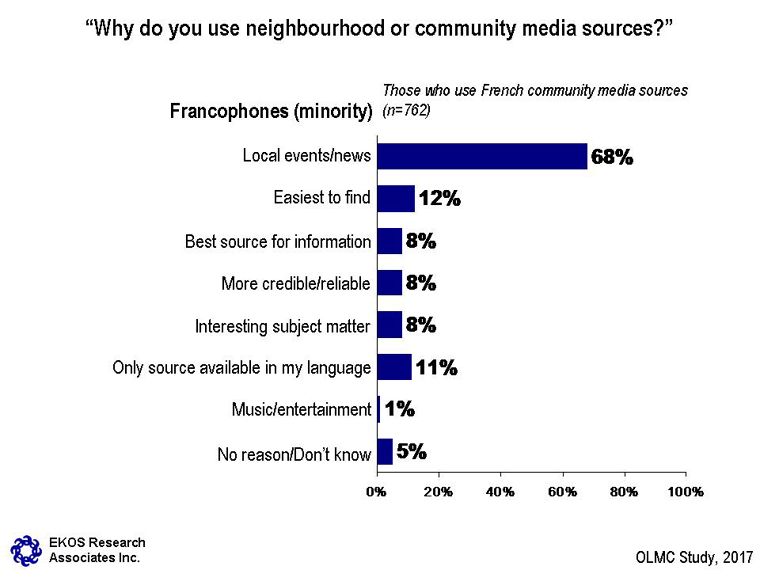
This horizontal bar graph is titled "Reasons for Using Official Language Minority Community Media: Francophones." It shows the breakdown of answers to the question, "Why do you use neighbourhood or community media sources?" The 762 respondents (Francophones: minority) who answered they use French community media sources answered as follows:
"Ekos Research associates Inc." and "OLMC Study, 2017"
Those official minority-language respondents who do not access official minority-language community media in either form were asked to elaborate on why this is the case. Minority Anglophones and minority Francophones offered differing lines of reasoning for not using these media, however, the evidence from Anglophones is based on relatively few cases (n=72) (see Chart 21: Reasons for Not Using Official Language—Minority Community Media: Anglophones and Chart 22: Reasons for Not Using Official Language—Minority Community Media: Francophones). Of the relatively small number of minority Anglophones, almost half (47 per cent) indicated that they simply prefer other sources. Other common reasons include lack of interest or time (31 per cent) and that it was not available or they did not have easy access to it (8 per cent). Another small segment said they consider sources other than community media to be better for Government of Canada information (7 per cent). Six in ten minority Francophones do not use official minority-language community media because of a lack of interest (35 per cent) or they prefer other sources (26 per cent). Another 11 per cent said they consider other sources better for Government of Canada information.
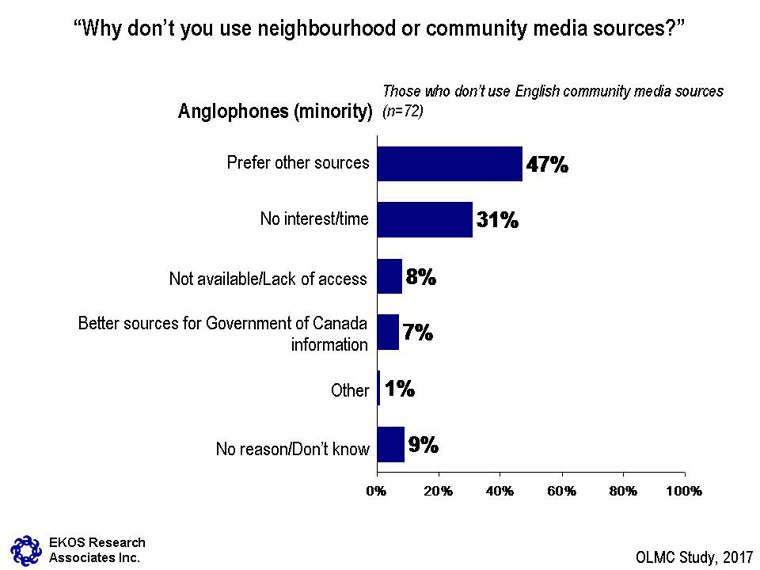
This horizontal bar graph is titled "Reasons for Not Using Official Language—Minority Community Media: Anglophones." It shows the breakdown of answers to the question, "Why don’t you use neighbourhood or community media sources?" The 72 respondents (Anglophones: minority) who don’t use English community media sources answered as follows:
"Ekos Research associates Inc." and "OLMC Study, 2017"
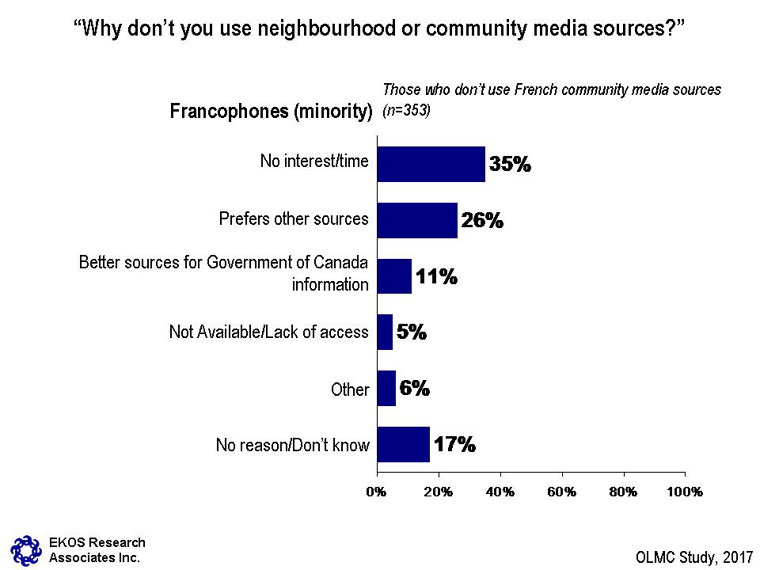
This horizontal bar graph is titled "Reasons for Not Using Official Language—Minority Community Media: Francophones." It shows the breakdown of answers to the question, "Why don’t you use neighbourhood or community media sources?" The 353 respondents (Francophones: minority) who answered they don’t use French community media sources answered as follows:
"Ekos Research associates Inc." and "OLMC Study, 2017"
Younger minority-language respondents (under 35) are the most likely to say that they are not interested in and/or have no time for official language—minority community media. Those who are 35 to 44 are more likely than other age cohorts to say they lack access to official language—minority media in their community.
Hello/Bonjour (pause), the Government of Canada is conducting a research survey on how Canadians stay informed. Le gouvernement du Canada est en train de mener un sondage sur la façon que les Canadiens demeurent informer. Would you prefer that I continue in English or French? Préférez-vous continuer en français ou en anglais?
NOTE: If at this point the respondent prefers to respond in French then the interviewer must be able to either proceed with the interview in French.
My name is ![]() of EKOS Research, the company hired to do the survey. The survey takes about 15 minutes to complete.
of EKOS Research, the company hired to do the survey. The survey takes about 15 minutes to complete.
It is registered with the Marketing Research and Intelligence Association. Your participation is voluntary and completely confidential. Your answers will remain anonymous.
May I continue?
Have I reached you on a cellular phone or a traditional telephone line?
Are you in a safe place to answer a survey?
Are you driving a vehicle or operating equipment at this time?
Are you 18 years of age or older?
At home, do you have a traditional telephone line other than a cell phone?
In which province or territory do you live?
This call may be recorded for quality control or training purposes.
This portion of the survey is about how you find and receive information on topics of interest to you.
REPEAT SCALE AS NECESSARY: Would you say all of the time (6), most of time (7), some of the time (8), a little (9), not at all (10), or don’t know/no response (99)
This next section of the survey focuses on how you look for information from the Government of Canada on its programs, services and announcements.
NOTE: Every few items read "do you rely on … as a source for information about Government of Canada programs, services and announcements".
The next section of the survey focuses on the sources that you rely on most to receive information from the Government of Canada about new programs, services and announcements.
Open response: 1
These last few questions are for statistical purposes and will be kept confidential. Your identity will always remain anonymous.
| Francophones in Rest of Canada | Anglophones in Quebec | ||
|---|---|---|---|
| Community (CSD) | # of Interviews | Community (CSD) | # of Interviews |
| Chatham-Kent, ON | 9 | Beloeil | 1 |
| Edmonton, AB | 6 | Boucherville | 2 |
| Kingston, ON | 2 | Chandler | 4 |
| Quinte West, ON | 2 | Chibougamau | 1 |
| Saint John, NB | 3 | Coaticook | 1 |
| Winnipeg, MB | 60 | Farnham | 1 |
| Kings, Subd. A., NS | 2 | Malartic | 2 |
| Douglas, NB | 1 | Mascouche | 1 |
| Peterborough, ON | 1 | Mirabel | 1 |
| Oshawa, ON | 1 | Mont-Saint-Hilaire | 2 |
| Port Colborne, ON | 2 | Prévost | 2 |
| Toronto, ON | 6 | Québec (ville) | 5 |
| Tecumseh, ON | 1 | Rouyn-Noranda | 1 |
| Windsor, ON | 2 | Saint-Colomban | 1 |
| Thunder Bay, ON | 1 | Saint-Damien-de-Buckland | 1 |
| Beaumont, AB | 1 | Saint-Denis-de-Brompton | 1 |
| Wood Buffalo, AB | 1 | Saint-Donat | 1 |
| Victoria, BC | 1 | Saint-Hippolyte | 3 |
| Abbotsford, BC | 1 | Saint-Isidore | 1 |
| Orangeville, ON | 1 | Saint-Jean-sur-Richelieu | 1 |
| Total | 104 | Saint-Jérôme | 1 |
| n/a | n/a | Saint-Joseph-du-Lac | 2 |
| n/a | n/a | Saint-Léandre | 1 |
| n/a | n/a | Saint-Philippe | 3 |
| n/a | n/a | Saint-Thérèse | 1 |
| n/a | n/a | Sainte-Barbe | 1 |
| n/a | n/a | Salaberry-de-Valleyfield | 2 |
| n/a | n/a | Sept-Îles | 1 |
| n/a | n/a | Terrebonne | 4 |
| n/a | n/a | Trois-Rivières | 1 |
| n/a | n/a | Val-d'Or | 2 |
| n/a | n/a | Total | 52 |
| Francophones in Rest of Canada | Anglophones in Quebec | ||
|---|---|---|---|
| Community (CSD) | # of Interviews | Community (CSD) | # of Interviews |
| Antigonish, Subd. B, NS (Pomquet) | 4 | Boisbriand | 4 |
| Blind River, ON | 13 | Deux-Montagnes | 3 |
| Elliot Lake, ON | 9 | Gaspé | 2 |
| Essa, ON | 10 | Gatineau | 17 |
| Kirkland Lake, ON | 2 | Longueuil | 42 |
| La Broquiere, MB | 45 | Port-Daniel-Gascons | 2 |
| Lakeshore, ON | 18 | Cantley | 3 |
| North Bay, ON | 29 | Saint-Lambert | 4 |
| Northern Sunrise County, AB | 2 | Saint-Mathieu | 1 |
| Oromocto, NB | 8 | Sainte-Catherine | 1 |
| Ottawa, ON | 140 | Sherbrooke | 29 |
| Riverview, ON | 1 | Val-des-Monts | 3 |
| South Stormont, ON | 3 | Waterloo | 1 |
| St. Paul County No. 19, AB | 1 | Piedmont | 1 |
| Taché, MB | 39 | Val-des-Lacs | 1 |
| Timiskaming, Unorganized, West Part, ON | 2 | Shefford | 1 |
| Tiny, ON | 3 | Delson | 1 |
| Wawa, ON | 11 | Léry | 1 |
| Welland, ON | 22 | Brossard | 1 |
| Total | 362 | Total | 118 |
| Francophones in Rest of Canada | Anglophones in Quebec | ||
|---|---|---|---|
| Community (CSD) | # of Interviews | Community (CSD) | # of Interviews |
| Footnote * Alfred and Plantagenet, ON | 2 | Brossard | 4 |
| Argyle, NS | 59 | La Pêche | 21 |
| Bathurst, NB | 57 | Laval | 42 |
| Footnote * Campbellton, NB | 1 | Montréal | 181 |
| Footnote * Caraquet, NB | 3 | Percé | 2 |
| Footnote * Casselman, ON | 1 | Pontiac | 6 |
| Cochrane, ON | 44 | Saint-Lazare | 7 |
| Chapleau, NB | 1 | Footnote ** Bonne-Espérance | 1 |
| Footnote * Dieppe, NB | 1 | Footnote ** Côte-Saint-Luc | 3 |
| Footnote * Edmundston, NB | 6 | Footnote ** Montréal-Ouest | 1 |
| Footnote * Grand Falls / Grand Sault, NB | 1 | Footnote ** Dollard-des-Ormeaux | 3 |
| Footnote * Clarence-Rockland, ON | 5 | Footnote ** Kirkland | 1 |
| Greater Sudbury, ON | 145 | Footnote ** Pointe-Claire | 2 |
| Footnote * Hardwicke, NB | 1 | Footnote ** Dorval | 1 |
| Footnote * Hawkesbury, ON | 1 | Footnote ** Beaconsfield | 2 |
| Footnote * Hearst, ON | 1 | Ayer's Cliff | 1 |
| Inverness, Subd. A, NS (Chéticamp) | 9 | Potton | 1 |
| Footnote * Memramcook, NB | 1 | Sutton | 1 |
| Moncton, NB | 56 | Godmanchester | 2 |
| Footnote * Moonbeam, ON | 1 | Havelock | 1 |
| North Glengarry, ON | 112 | Châteauguay | 5 |
| Footnote * Petit-Rocher, NB | 1 | Vaudreuil-Dorion | 2 |
| Russell, ON | 102 | Footnote ** Westmount | 1 |
| Footnote * Saint-Leonard, NB | 1 | Total | 291 |
| Footnote * Saint-Quentin, NB | 1 | n/a | n/a |
| Footnote * Shippagan, NB | 1 | n/a | n/a |
| South Glengarry, ON | 11 | n/a | n/a |
| St-Pierre-Jolys, MB | 1 | n/a | n/a |
| Footnote * The Nation, ON | 1 | n/a | n/a |
| Timmins, ON | 82 | n/a | n/a |
| Footnote * West Nipissing, ON | 1 | n/a | n/a |
| Missing | 3 | n/a | n/a |
| Total | 713 | n/a | n/a |
Following are details of the calculated response rate for the 3 language segments.
| Call Disposition Table | Majority Sample | Anglophone Minority | Francophone Minority |
|---|---|---|---|
| n/a | 10,459 | 3,593 | 15,347 |
| Blocked by Bell | 240 | 116 | 674 |
| Business/Fax /Modem | 288 | 111 | 596 |
| Duplicate Number | 25 | 2 | 19 |
| Not in Service | 9,906 | 3,364 | 14,058 |
| Call Disposition Table | Majority Sample | Anglophone Minority | Francophone Minority |
|---|---|---|---|
| n/a | 16,139 | 10,476 | 32,069 |
| Tentative time for re-contact (callback: Specific time/date, answering machine) | 10,366 | 8,254 | 19,654 |
| No answer (callback in 12 hrs) | 5,773 | 2,222 | 12,415 |
| Call Disposition Table | Majority Sample | Anglophone Minority | Francophone Minority |
|---|---|---|---|
| n/a | 6,365 | 2,410 | 8,885 |
| Qualified respondent break-off | 27 | 6 | 24 |
| Refusal | 6,138 | 2,177 | 8,536 |
| Language Disqualify (non-official language) | 200 | 227 | 325 |
| Call Disposition Table | Majority Sample | Anglophone Minority | Francophone Minority |
|---|---|---|---|
| n/a | 2,284 | 2,363 | 10,385 |
| Complete | 1,233 | 461 | 1,178 |
| Ineligible (age, permanent resident, minority language) | 190 | 1,653 | 8,343 |
| Quota Filled (region, gender, age) | 861 | 249 | 863 |
| Call Disposition Table | Majority Sample | Anglophone Minority | Francophone Minority |
|---|---|---|---|
| MRIA Empirical method D/(B+C+D) | 9.2% | 15.5% | 20.2% |