This report summarizes results from a survey of 3,040 Canadians.
Cette publication est aussi disponible en français sous le titre : Points de vue de Canadiens sur les services de maintien de l'ordre de la GRC.
This publication may be reproduced for non-commercial purposes only. Prior written permission must be obtained from the RCMP. For more information on this report, please contact the RCMP at: SurveyCentreRCMP-CentresondageGRC@rcmp-grc.gc.ca
Catalogue number: PS64-154/2019E-PDF
International Standard Book Number (ISBN): 978-0-660-28038-7
Related publications (registration number: POR 064-18):
Catalogue Number: PS64-154/2019F-PDF (Final Report, French
The RCMP has been conducting surveys of the Canadian public since 2003 to assess Canadians' opinions on quality of service, professionalism, sensitivity, community involvement, visibility, value of partnerships, and communication. Most of the previous editions of the survey were conducted by telephone. However, due to the challenges and costs associated with telephone surveys, in the 2017-18 fiscal year, the RCMP conducted the survey using an online/telephone methodology with the same representativeness used in the previous (telephone only) samples.
The current research, for the 2018-19 fiscal year, also involved an online/telephone methodology. A total of 3,040 Canadians were surveyed. As in previous surveys, the sample was drawn from across Canada and was weighted more heavily toward areas policed by the RCMP. The sample was stratified to ensure roughly equal representation from five regions (North, British Columbia, Prairies, Central, and Atlantic). We surveyed roughly 500 residents in the North, and about 600 in each of the other four regions.
As mentioned, the current survey was conducted primarily online (using our probability Based online panel, Probit); however, to help with tracking previous survey results (which were conducted by telephone), and to ensure we could collect information from the North (which has a very limited number of panellists), we also conducted interviews by telephone. We completed 1,324 telephone interviews, and 1,716 cases were collected online.
Survey Findings
Outlined below are key findings from this study. The remainder of this report describes survey results in more detail.
Attitudes to the RCMP
Survey findings reveal that fully 94 per cent of Canadians assign a high degree of importance to the RCMP's contribution to keeping Canadians safe, and three-quarters express satisfaction with the RCMP's performance in this area.
Looking at more specific aspects of the RCMP, survey findings reveal that clear majorities agree that the RCMP demonstrates professionalism in its work, demonstrates respect and integrity, that RCMP personnel are honest and demonstrate compassion, and that the organization is accountable.
Survey results also reveal that fully 95 per cent of Canadians feel that the RCMP is a recognized symbol of Canada. Moreover, eight in ten are satisfied with the RCMP's efforts to provide services in both official languages, while slightly fewer agree that the RCMP prioritizes quality service, and express trust and confidence in the RCMP. Tracking reveals the proportion of Canadians who agree that the RCMP prioritizes providing services in both official languages has increased seven points over the past year.
While Canadians have a high degree of confidence in the RCMP in general, they award lower marks when it comes to the calibre of its leadership. Respondents also make little distinction between the different levels of leadership; just over half rated the RCMP's local leaders as effective while roughly the same proportion offered a positive appraisal of its national leaders. Tracking reveals that confidence in the RCMP's national leadership is up 9 points over the past year, and confidence in local leadership is up three points.
The RCMP receives mixed reviews when it comes to issues related to innovation and transparency. Fewer than half of respondents agree that the RCMP is a forward-looking and innovative organisation. About four in ten are satisfied with the level of information that the RCMP provides about its work, and one-third expressed dissatisfaction in this area. Respondents were sharply divided on whether the RCMP could be considered an open and transparent organization – four in ten agree with this assessment, while virtually the same proportion disagree. However, tracking reveals an 11-point increase in the proportion of Canadians who see the RCMP as an open and transparent organization.
The RCMP scores moderately well on broader indicators related to sensitivity. Two-thirds of respondents agree that the RCMP is welcoming and inclusive of people from varying backgrounds. Six in ten believe that the RCMP is representative of the diverse communities it serves, that it is helping to build a fair and inclusive Canada, and that it is sensitive to the needs of Canada's various cultures and groups. When the scope of the questions is narrowed to focus on specific groups, however, the RCMP elicits less favourable reviews. Half of respondents agree that the RCMP is respectful to the cultural needs of Indigenous people, while the same proportion believes that the RCMP treats women fairly. Slightly fewer say the RCMP is sensitive to needs of the LGBTQ2S community. Tracking reveals a six-point increase in agreement that the RCMP treats women fairly, and a four-point increase in agreement that the RCMP is helping to build an inclusive and fair Canada over the past year.
Looking at visibility and community engagement issues, a clear majority of respondents say that RCMP personnel are responsive to the needs of their communities. The other issues examined reveal more mixed views. About half believe that the RCMP maintains a social media presence, and that RCMP personnel have a visible presence in their community. About four in ten say that RCMP personnel are involved in their community's activities, and one-third disagree with this idea. It is important to note, however, that the seemingly high levels of disagreement on some of these indicators are driven by the high rates of disagreement in provinces that have their own provincial police forces. Tracking reveals a 7-point increase in agreement that the RCMP maintains a social media presence.
Canadians hold generally positive views of the RCMP in terms of responsiveness. More than six in ten agree that the RCMP provides effective, co-ordinated responses to calls for service, that it keeps up with current and emerging threats, and that the organization has a motivated workforce. More than half feel that the RCMP investigates public complaints appropriately. Tracking reveals relatively consistent results in terms of satisfaction with the RCMP's responsiveness over the past few years.
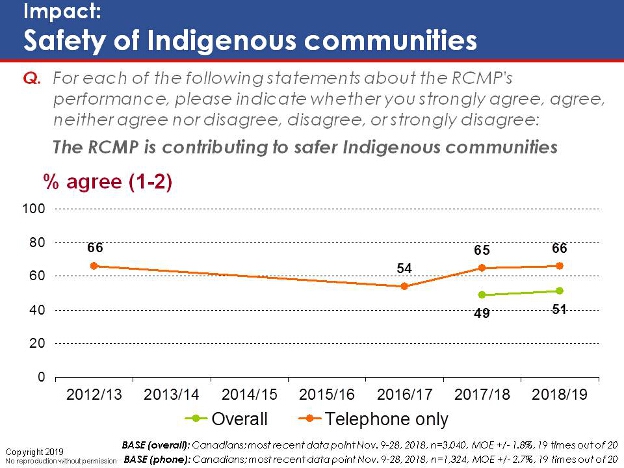
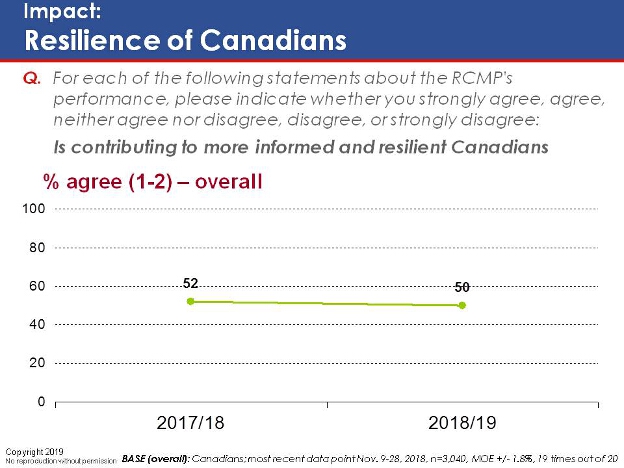
Results also reveal generally positive impressions of the impact of the RCMP on Canadians, although findings also suggest room for improvement in terms of the RCMP's contributions at the community level. Eight in ten are confident that the RCMP can conduct major crime investigations, while three-quarters agree that the RCMP effectively responds to national security threats. About seven in ten say the RCMP diminishes the threat of organized crime, effectively handles threats to passenger aircraft, and provides an adequate response to border threats. About six in ten believed the RCMP is effective in mitigating the impact of serious crime, reducing the distribution of illegal drugs, countering radicalization to violence, responding to cybercrime threats, lessening the impact of economic crime, and addressing youth crime. However, just half are satisfied with the RCMP's efforts in fostering safer Indigenous communities, or its contribution to making Canadians more informed and resilient. These results have largely remained stable over the past year, although longer-term tracking reveals a steady, nine-point erosion in the perceived effectiveness of the RCMP's efforts to combat serious crime since 2012/13.
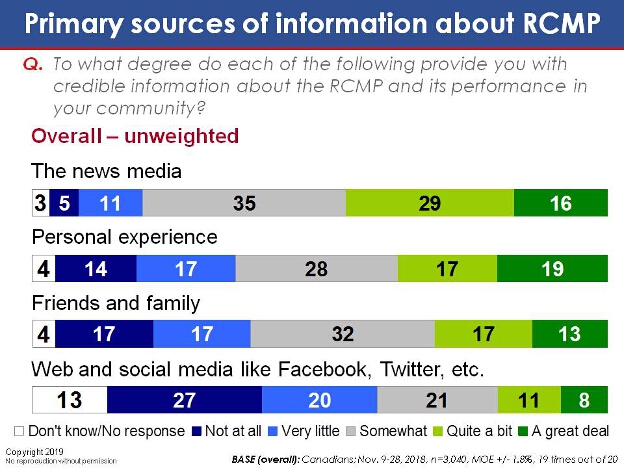
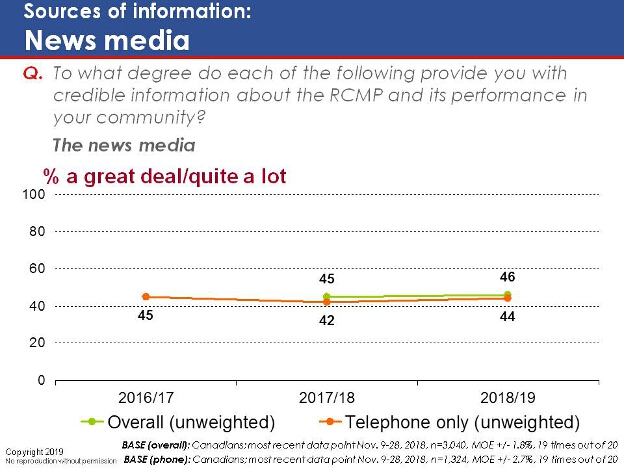
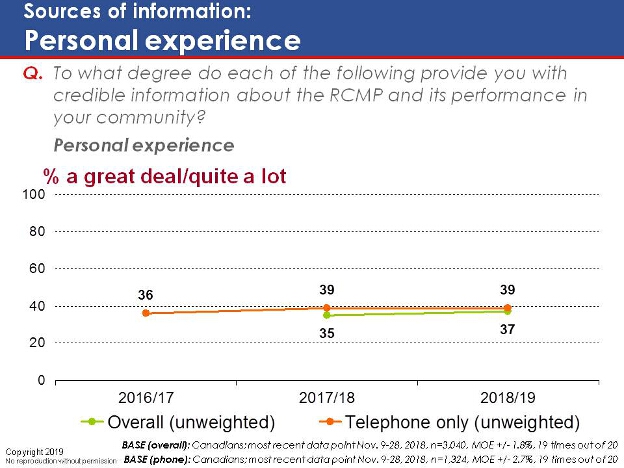
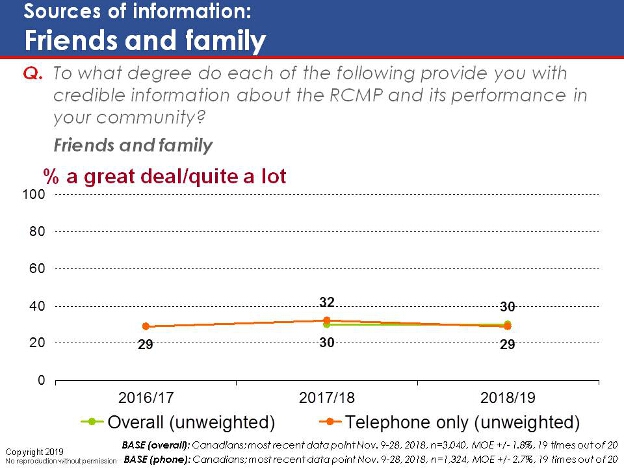
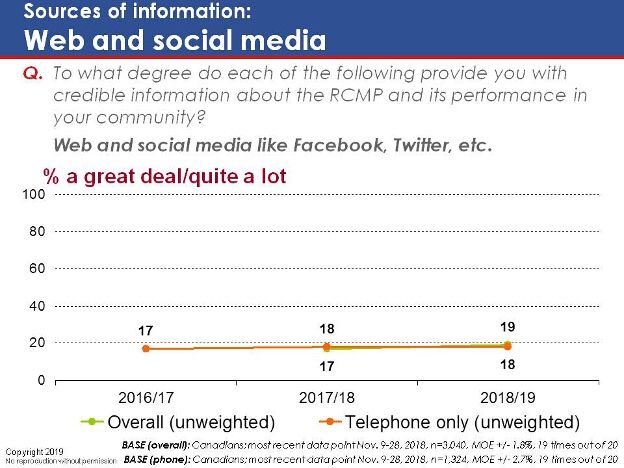
Primary Sources of Information about RCMP
Turning to communication with the RCMP, respondents were asked to what degree each of a range of sources provided them with credible information about the RCMP and its performance in their community. Forty-five per cent selected the news media as their credible source to obtain information about the RCMP, while about four in ten selected their own personal experience as a source to obtain credible information. Three in ten see their friends and family as a reliable source, while just one in five turn to social media to obtain information about the RCMP. Tracking reveals that the perceived credibility of these sources has remained stable over the past few years.
Contact with the RCMP
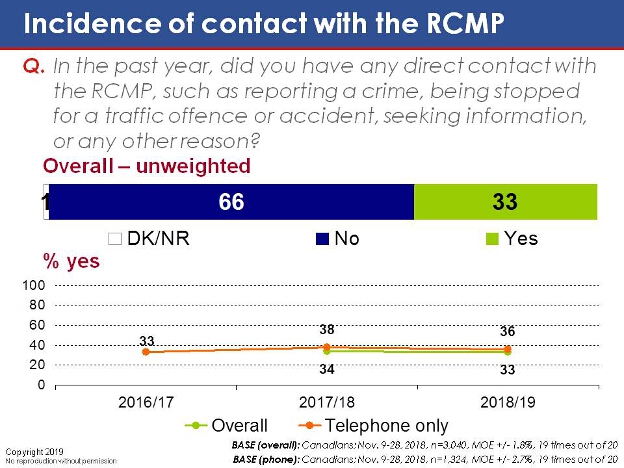
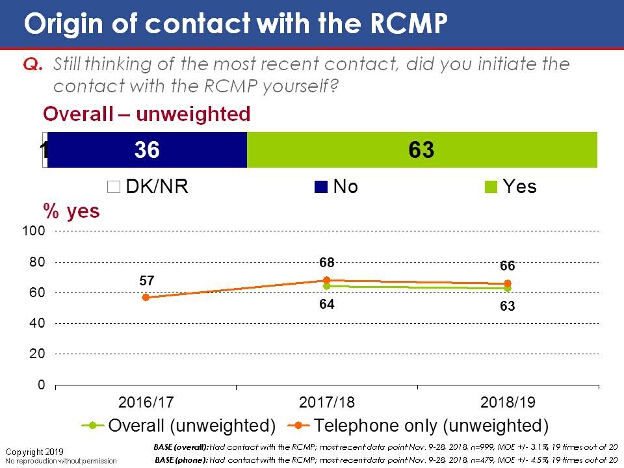
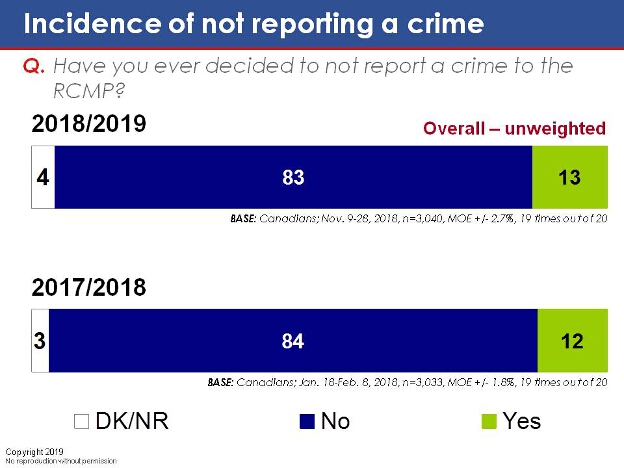
Respondents were asked if they have had any direct contact with the RCMP in the past year. One-third (33 per cent) indicated yes, while the majority (66 per cent) said no.
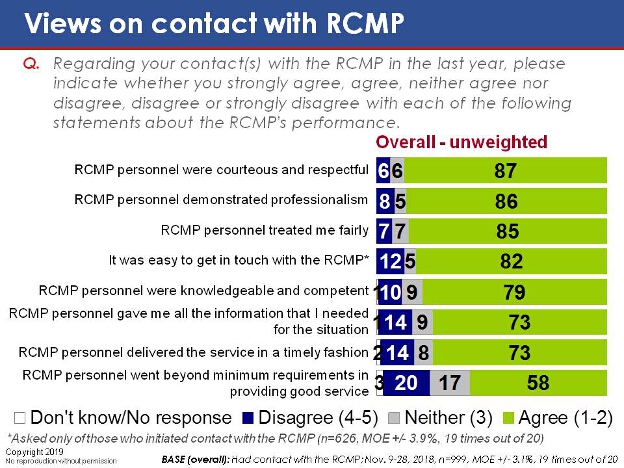
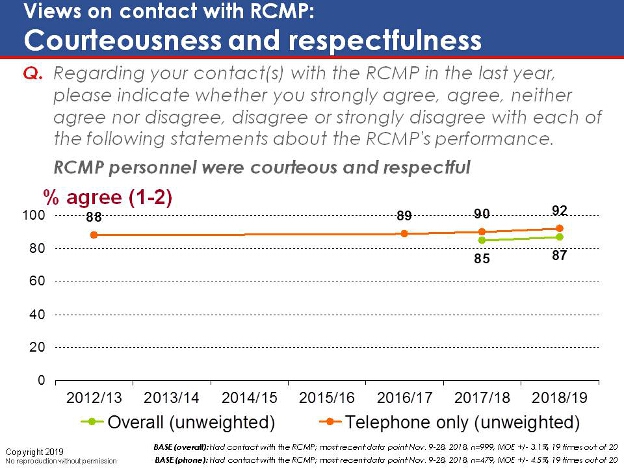
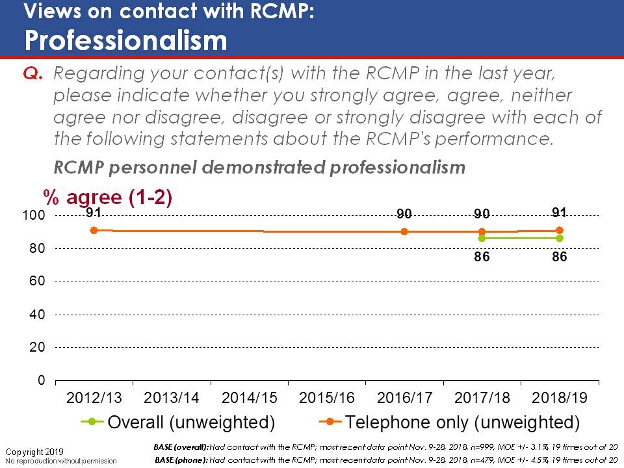
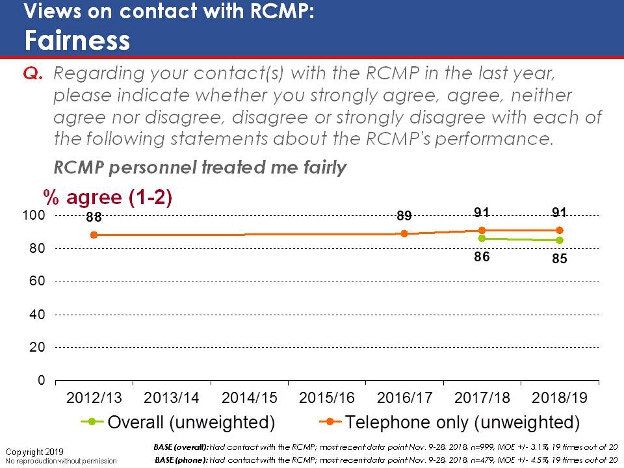
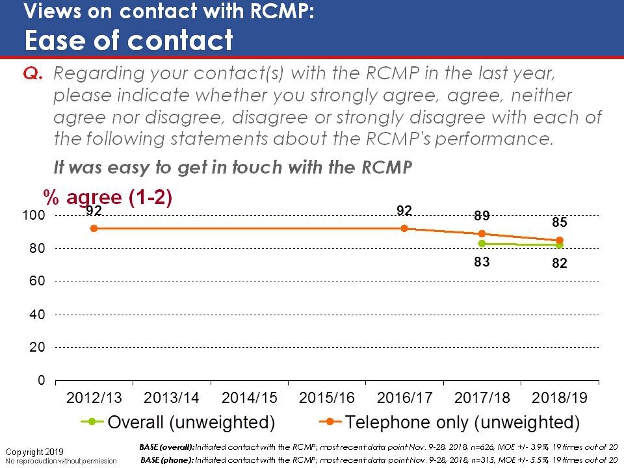
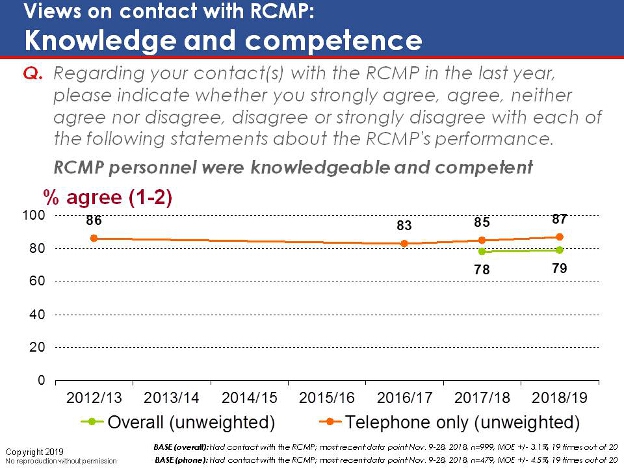
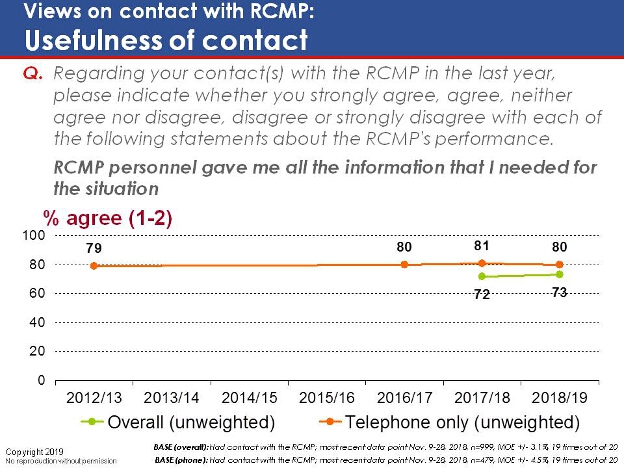
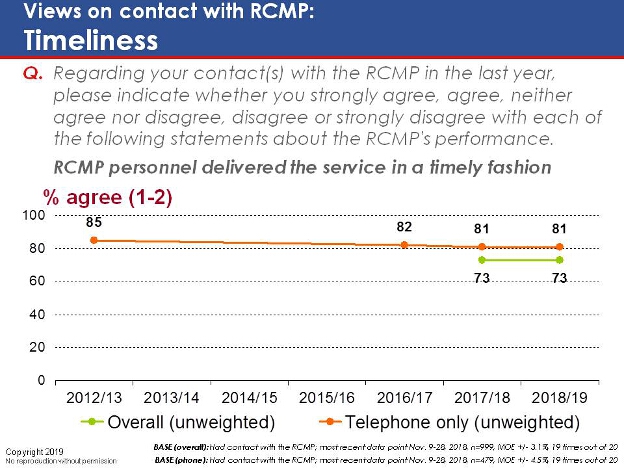
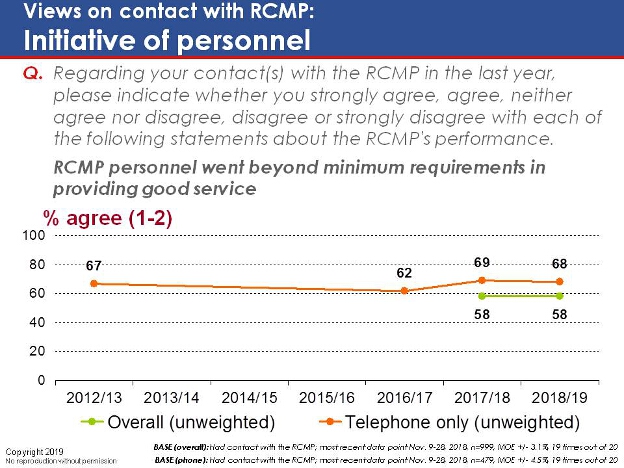
Those who indicated they had contact with the RCMP in the past year were then asked for their views on RCMP performance during this contact. Results are generally positive with more than eight in ten agreeing that RCMP personnel were courteous and respectful, demonstrated professionalism, treated them fairly, and that it was easy to get in touch with the RCMP. Similarly, more than seven in ten feel that RCMP personnel were knowledgeable and competent, provided all the information needed, and delivered the service in a timely fashion. Results are more mixed in terms of the RCMP going beyond minimum requirements in providing good service: 58 per cent feel the RCMP went beyond minimum service requirements, and 20 per cent disagreed with this idea. Tracking reveals that these results have remained largely stable over the past few years, although ease of contact with the RCMP is down 7 points since 2012/13.
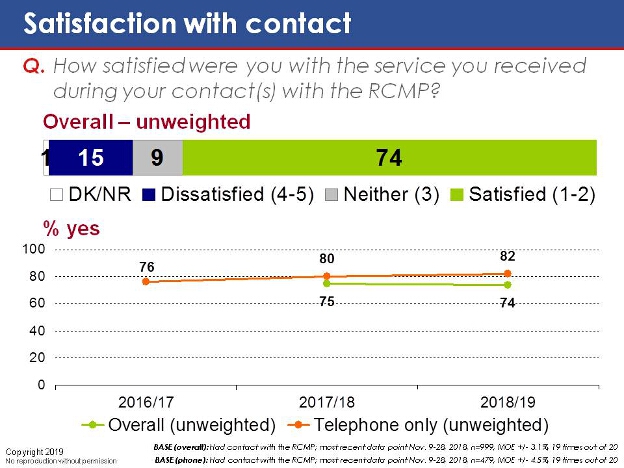
Those who indicated they had contact with the RCMP in the past year were also asked to rate their overall satisfaction with the service received from the RCMP. Three in four expressed satisfaction, and only 15 per cent are dissatisfied. Tracking suggests that satisfaction has increased 6 points since 2016/17.
Conclusions
Overall, attitudes towards the RCMP are generally positive and stable. The vast majority of Canadians are satisfied with the RCMP's contribution to public safety and nearly all Canadians recognize the importance of its work. The RCMP also scores well in terms of upholding its core principles, particularly professionalism, integrity, respect, and honesty. The RCMP consistently enjoys its highest levels of support from seniors, those with high school education, and those who reside in Northern and Atlantic Canada.
Nevertheless, results reveal some areas for improvement. Canadians hold mixed views when it comes to issues surrounding transparency and accountability. There are some doubts as to whether the RCMP provides Canadians with sufficient information regarding its work, and Canadians are evenly split on whether the organization could be considered transparent.
Another area of potential concern is sensitivity. While the RCMP does quite well on the broader indicators surrounding inclusiveness and diversity, public attitudes worsen when the scope of the question is narrowed to focus on specific groups, namely Indigenous people, women, and the LGBTQ2S community. Of particular concern are the consistently poor ratings awarded by the LGBTQ2S community; on virtually every indicator, LGBTQ2S consistently provide significantly less favourable ratings than other Canadians.
Results also reveal that one-third of Canadians have had contact with the RCMP in the past year. A clear majority expressed satisfaction with the service received, and RCMP personnel score quite well across the performance indicators examined, e.g. courteousness, competence, timeliness.
1. Background and Methodology
1.1 Background and Objectives
The Strategic Policy and Planning Directorate of the RCMP is responsible for the development and implementation of an internal performance measurement system and for the overall results reporting to the federal government. In an evidence-Based environment, the RCMP requires sound metrics from the general public to assess performance and set targets for improved performance.
The RCMP has been conducting surveys of the Canadian public since 2003 to assess public opinions on quality of service, professionalism, sensitivity, community involvement, visibility, value of partnerships, and communication.
Most of the previous editions of this survey were conducted by telephone. However, due to the challenges and costs associated with telephone surveys, in the 2017-18 fiscal year, the RCMP started to conduct the survey using an online/telephone methodology with the same representativeness used in the previous (telephone only) samples.
1.2 Methodology
The current research also involved conducting an online/telephone survey. A total of 3,040 Canadians were surveyed in October and November 2018. As in previous surveys, the sample was drawn from across Canada and was weighted more heavily toward areas policed by the RCMP. The sample was stratified to ensure roughly equal representation from five regions (North, British Columbia, Prairies, Central, and Atlantic). We surveyed roughly 500 residents in the North, and about 600 in each of the other four regions.
The survey was conducted primarily online using our probability Based online panel, Probit; however, to help with tracking previous survey results (which were conducted by telephone), and to ensure we could collect information from the North (which has a very limited number of panellists), we also conducted interviews by telephone. Below we provide more detail on the methodology associated with both the online and telephone components of the research.
Probit Panel (Online Sample)
We used our probability Based online panel, Probit, for the online completions. Probit is an online research panel that has been designed by Ekos to provide statistically representative data. Our panel offers complete coverage of the Canadian population (Internet, phone, cell phone), random recruitment (participants are recruited randomly, they do not opt themselves into our panel), and equal probability sampling. All respondents to our panel are recruited by telephone using random digit dialling, and their demographic information is confirmed by live interviewers.
The distribution of the recruitment process for our panel mirrors the actual population in Canada (as defined by Statistics Canada). As such, our panel can be considered representative of the general public (survey results from our online panel support confidence intervals and margin of error estimates, which is unique in Canada). The overall panel size is roughly 90,000 Canadian households. Random stratified samples are drawn from the panel dataBase for individual research assignments.
Telephone Sample
Ekos relies on Survey Sample for the sample requirements of our telephone surveys. The software uses the most up to date directories as they become available and is updated quarterly. It samples by Random Digit Dial (RDD) methodology and checks its samples against published phone lists to divide the sample into "Directory Listed" (DL) and "Directory Not Listed" (DNL) RDD components. The flexibility of this software allows one to sample within specific regions or cities. One can sample according to population representativeness or stipulate stratification parameters, as required. Once the sample is determined for a specific survey, the numbers are imported into our Computer Assisted Telephone Interview (CATI) system and quotas are set for individual characteristics.
We completed 1,324 telephone interviews, and 1,716 cases were collected online. Results were weighted by region, gender, and age to ensure that the sample is representative of the Canadian population 18 years of age and older Outlined below is the sample breakdown and margin of error (MOE) across mode and province/territory (please note the sample sizes and margins of error by province/territory are for overall results).
Margin of Error by Mode
Mode
Sample size
Margin of error (+/−, 19 times out of 20)
Overall (phone and online)
n=3,040
1.8%
Telephone only
n=1,324
2.7%
Margin of Error by Province/Territory
Province/Territory
Sample size
Margin of error +/−, 19 times out of 20)
British Columbia
n=610
4.0%
Alberta
n=292
5.7%
Saskatchewan
n=160
7.8%
Manitoba
n=155
7.9%
Ontario
n=340
5.3%
Quebec
n=294
5.7%
New Brunswick
n=193
7.1%
Nova Scotia
n=232
6.4%
Prince Edward Island
n=83
10.8%
Newfoundland
n=132
8.6%
Yukon
n=174
7.5%
Northwest Territories
n=170
7.5%
Nunavut
n=166
7.6%
Response Rate
The telephone response rate for this survey was 10.8 per cent. The response rate is calculated by dividing the in-scope responding (1,802) by the total (functional) sample (16,758) – see table below.
Response Rate
Description
Result
Total
Total Numbers Attempted
23,752
Invalid numbers
6,994
Blocked
223
Business
377
Duplicate
11
Invalid
6,383
Unresolved (U)
9,253
No answer
0
Callbacks
9,253
In-scope - Not responding (IS)
5,703
Household refusal
0
Respondent refusal
5,703
Selected respondent not available
0
Qualified respondent break-off
0
In-scope - Responding (R)
1,802
Language problem
364
Quota filled
40
Other disqualify
74
Completed interviews
1,324
Total (U + IS + R)
16,758
Response Rate (R divided by Total)
10.8%
The online response rate for this survey was 14.6 per cent. The online response rate is calculated as follows: a total of 11,803 email invitations were sent out, and 78 bounced back, for a total of 11,725 valid emails. A total of 1,716 cases were completed, so dividing 1,716 by 11,725 results in a response rate of 14.6 per cent.
Note to the Reader
The current survey was conducted using what was referred to in the RCMP's 2017-18 survey of the public as a "hybrid" methodology (online and telephone). Going forward, this methodology will be referred to as the overall results. Overall results are tracked to the 2017-18 survey, which also used an online and telephone methodology, however given that previous surveys (before the 2017-18 fiscal year) were conducted solely by telephone, only telephone results are tracked for earlier years.
It should be noted that online results tend to be generally less positive than telephone results - this is due to a mode effect (social desirability bias) that is exhibited in all telephone/online surveys. Social desirability bias occurs when individuals provide different responses in the presence of an interviewer to appear in a more favourable light.
Schonlau et al. (2004)[1] studied mode effects between online and telephone surveys. This study found evidence of social desirability bias among telephone respondents for sensitive questions. In particular, this study found that telephone respondents were far more likely to rate their health as "excellent" as opposed to merely "very good".
Greene et al. (2008)[2] conducted a meta-analysis of four health related studies that contrasted the results of online and telephone studies. All of these studies revealed evidence of social desirability bias among telephone respondents.
Given the subject matter in the survey (views on a national symbol of Canada - the RCMP), it appears that telephone respondents did not want to be as critical of the RCMP as those who completed the survey through a self-administered, online survey (with no interviewer involved).
Please also note that most of the questions in this survey asked respondents to respond using five-point scales (e.g., where one means strongly disagree, five means strongly agree, and the midpoint, three, means neither disagree nor agree). Responses of one to two and four to five are aggregated when discussing the findings in this report.
2. Attitudes toward the RCMP
Please note that, throughout this report, overall results refer to findings from both the telephone and online interviews (n=3,040). Overall results are tracked to the 2017-18 fiscal year survey (which also used an online and telephone methodology), however given that previous surveys (before the 2017-18 fiscal year) were conducted solely by telephone, only telephone results are tracked for earlier years. Also please note that throughout the report any discussion of tracking is referring to telephone tracking only, unless otherwise specified.
2.1 Importance of RCMP's Contribution to Public Safety
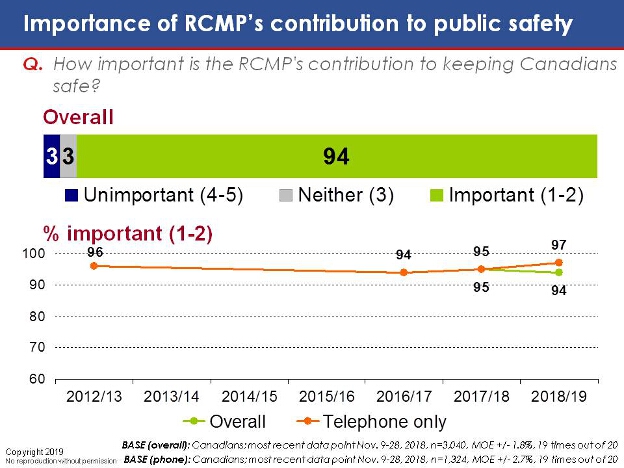
Survey findings reveal that Canadians place a great deal of importance on the RCMP's contribution to public safety. More than nine in ten respondents (94 per cent) assigned a high degree of importance to the RCMP's contribution in keeping Canadians safe, and just three per cent said the RCMP's role in ensuring public safety is of little or no importance.
Tracking suggests that these results are largely unchanged over the past year, and are consistent since 2012/13.
Importance of RCMP's contribution to public safetyImportance of RCMP's contribution to public safety - Text version
This chart has one horizontal stacked bar showing the overall results Based on a five-point scale where 4-5 means unimportant, 3 means neither, and 1-2 means important. Below is a line graph showing the percentage for the category "Important (1-2)" by years for the overall and the telephone only results.
Respondents were asked: "How important is the RCMP's contribution to keeping Canadians safe?"
Respondents selected:
"Overall": Unimportant (3 per cent); neither (3 per cent); and important (94 per cent);
% important "Overall": 2017/18 (95 per cent); and 2018/19 (94 per cent);
% important "Telephone only": 2012/13 (96 per cent); 2016/17 (94 per cent); 2017/18 (95 per cent); and 2018/19 (97 per cent).
Base (overall): Canadians; most recent data point November 9-28, 2018, n=3,040, margin of error: +/− 1.8%, 19 times out of 20
Base (phone): Canadians; most recent data point November 9-28, 2018, n=1,324, margin of error: +/− 2.7%, 19 times out of 20
2.2 Satisfaction with RCMP's Contribution to Public Safety
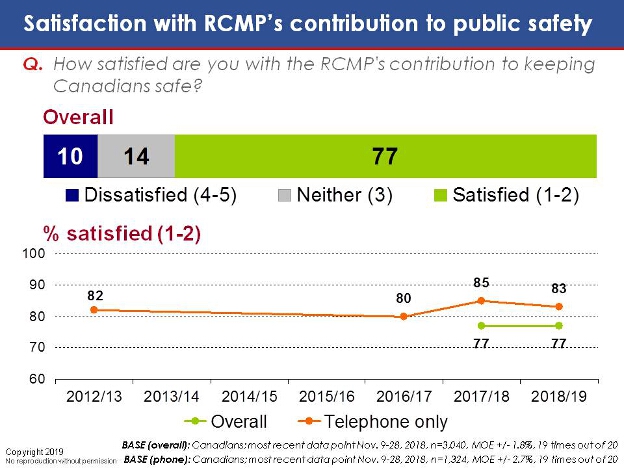
Results further reveal that three-quarters of Canadians (77 per cent) are satisfied with how the RCMP fulfills its role in maintaining public safety, and only one in ten (10 per cent) are dissatisfied. One in seven (14 per cent) are neither satisfied nor dissatisfied.
Tracking reveals that satisfaction with the RCMP's contribution to public safety has remained largely stable over the past few years.
Satisfaction rises progressively with age (from 72 per cent among those under the age of 35 to 84 per cent among those ages 65 and over).
Satisfaction with RCMP's contribution topublic safetySatisfaction with RCMP's contribution topublic safety - Text version
This chart has one horizontal stacked bar showing the overall results Based on a five-point scale where 4-5 means dissatisfied, 3 means neither, and 1-2 means satisfied. Below is a line graph showing the percentage for the category "Satisfied (1-2)" by years for the overall and the telephone only results.
Respondents were asked: "How satisfied are you with the RCMP's contribution to keeping Canadians safe?"
Respondents selected:
"Overall": Dissatisfied (10 per cent); neither (14 per cent); and satisfied (77 per cent);
% satisfied "Overall": 2017/18 (77 per cent); and 2018/19 (77 per cent);
% satisfied "Telephone only": 2012/13 (82 per cent); 2016/17 (80 per cent); 2017/18 (85 per cent); and 2018/19 (83 per cent).
Base (overall): Canadians; most recent data point November 9-28, 2018, n=3,040, margin of error: +/− 1.8%, 19 times out of 20
Base (phone): Canadians; most recent data point November 9-28, 2018, n=1,324, margin of error: +/− 2.7%, 19 times out of 20
2.3 Impact on Sense of Safety
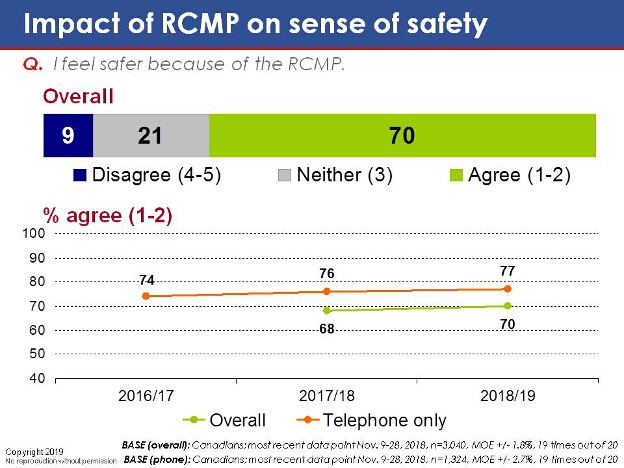
Results also reveal that the RCMP has a highly positive impact on the public's personal sense of safety. Seven in ten respondents (70 per cent) agree that they feel safer because of the RCMP, and just one in ten (nine per cent) disagree with this notion.
Tracking suggests that these results have remained largely unchanged over the past few years.
Agreement rises with age (from 61 per cent among those under the age of 35 to 80 per cent among those ages 65 and over).
Agreement is highest among those who live in Atlantic Canada (90 per cent and 80 per cent, respectively, compared to 70 per cent nationally).
Agreement is noticeably lower among members of the LGBT2QS community (54 per cent, compared to 70 per cent on average).
Impact of RCMP on sense of safetyImpact of RCMP on sense of safety - Text version
This chart has one horizontal stacked bar showing the overall results Based on a five-point scale where 4-5 means disagree, 3 means neither, and 1-2 means agree. Below is a line graph showing the percentage for the category "Agree (1-2)" by years for the overall and the telephone only results.
Respondents were asked: "I feel safer because of the RCMP."
Respondents selected:
"Overall": Disagree (9 per cent); neither (21 per cent); and agree (70 per cent);
% agree "Overall": 2017/18 (68 per cent); and 2018/19 (70 per cent);
% agree "Telephone only": 2016/17 (74 per cent); 2017/18 (76 per cent); and 2018/19 (77 per cent).
Base (overall): Canadians; most recent data point November 9-28, 2018, n=3,040, margin of error: +/− 1.8%, 19 times out of 20
Base (phone): Canadians; most recent data point November 9-28, 2018, n=1,324, margin of error: +/− 2.7%, 19 times out of 20
2.4 Core Values of the RCMP
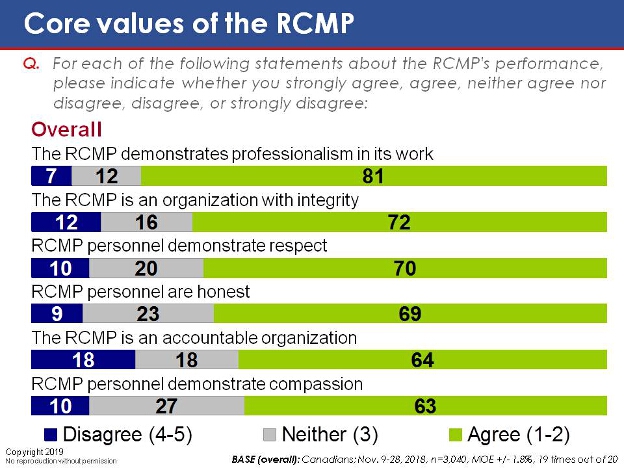
Respondents were presented with a series of statements regarding the six core values of the RCMP (professionalism, integrity, respect, honesty, accountability, and compassion), and asked for their views on the RCMP's performance in each of these areas. The results reveal generally positive impressions of the RCMP.
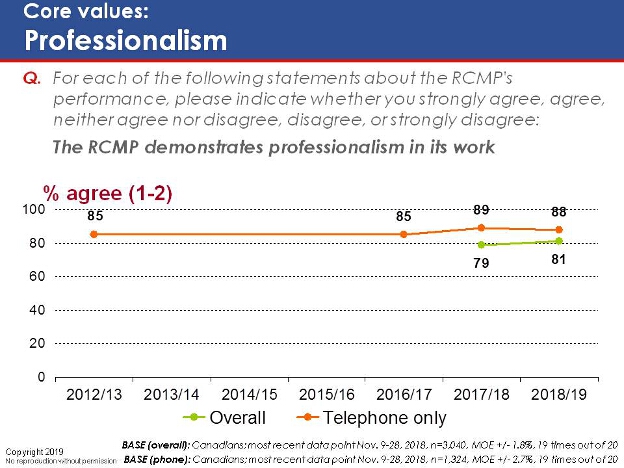
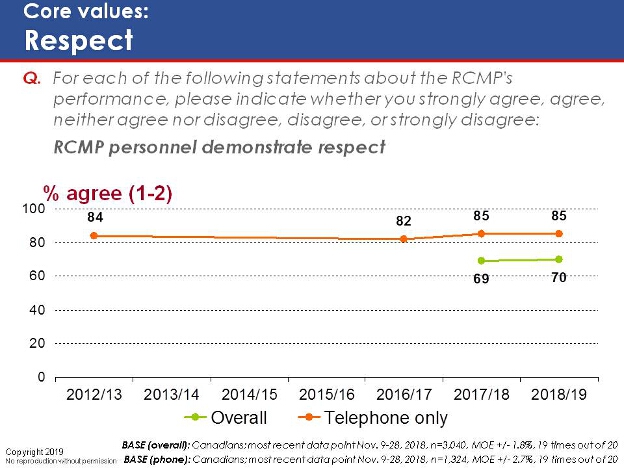
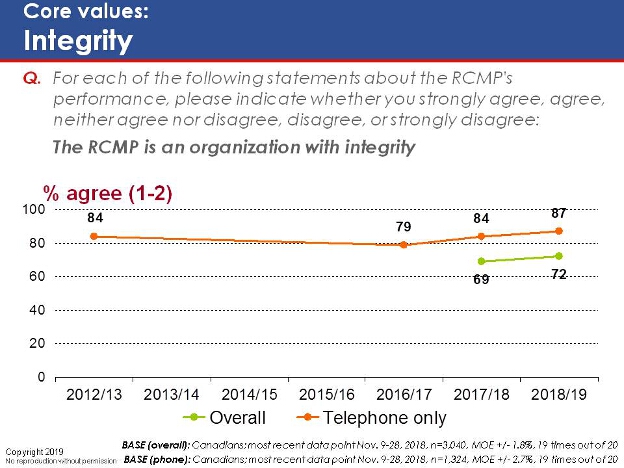
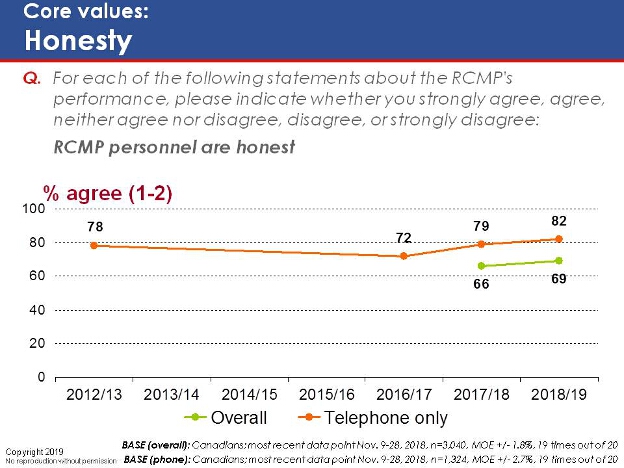
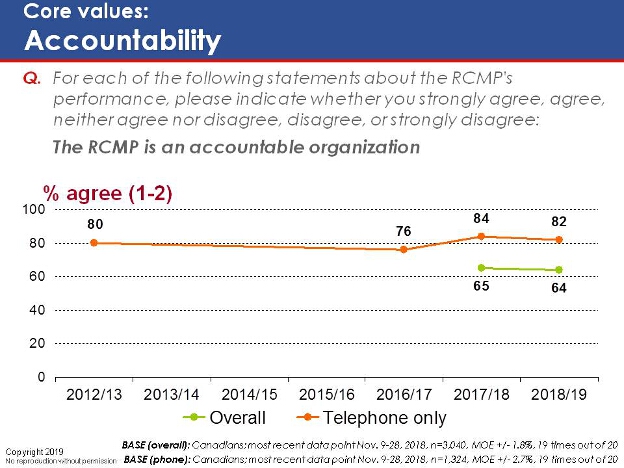
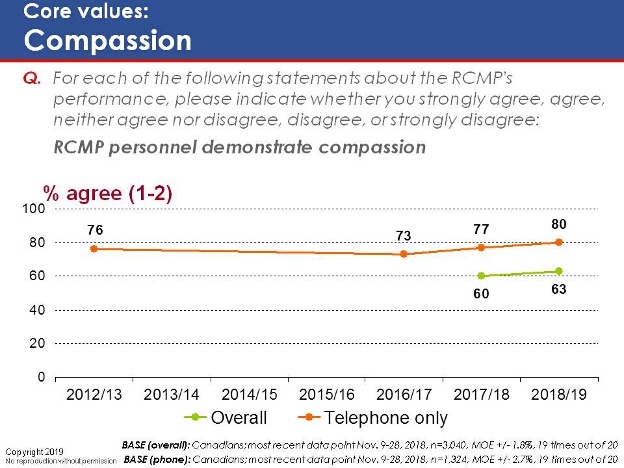
Eight in ten (81 per cent) agree that the RCMP demonstrates professionalism in its work. Seven in ten say the RCMP demonstrates respect (72 per cent), integrity (70 per cent), and honesty (69 per cent). Just over six in ten believe that the organization itself is accountable (64 per cent) and that RCMP personnel demonstrate compassion (63 per cent). Relatively few respondents (between seven and 18 per cent) disagree with any of these ideas.
Tracking reveals that these results are largely on par with those found last year.
Agreement with each of these statements rises progressively with age. For instance, 59 per cent of those of those under the age of 35 agreed that the RCMP is an accountable organization, a figure that rises to 74 per cent among those ages 65 and over.
Those with a high school education are consistently more likely to assign positive ratings to the RCMP. For example, 73 per cent described the RCMP as accountable, compared to 63 per cent of college graduates and 59 per cent of respondents with a university degree.
Those who identify as LGBTQ2S are consistently less likely to provide a positive appraisal of the RCMP. For instance, 57 per cent say the RCMP demonstrates professionalism, compared to 81 per cent on average. Visible minorities and Indigenous respondents are also less likely to perceive the RCMP as honest (56 per cent and 59 per cent, respectively, compared to 69 per cent on average).
Core values of the RCMPCore values of the RCMP - Text version
This chart has six horizontal stacked bars showing the overall results Based on a five-point scale where 4-5 means disagree, 3 means neither, and 1-2 means agree.
Respondents were asked: "For each of the following statements about the RCMP's performance, please indicate whether you strongly agree, agree, neither agree nor disagree, disagree, or strongly disagree."
Respondents selected:
"The RCMP demonstrates professionalism in its work": disagree (7 per cent); neither (12 per cent); and agree (81 per cent);
"The RCMP is an organization with integrity": disagree (12 per cent); neither (16 per cent); and agree (72 per cent);
"RCMP personnel demonstrate respect": disagree (10 per cent); neither (20 per cent); and agree (70 per cent);
"RCMP personnel are honest": disagree (9 per cent); neither (23 per cent); and agree (69 per cent);
"The RCMP is an accountable organization": disagree (18 per cent); neither (18 per cent); and agree (64 per cent);
"RCMP personnel demonstrate compassion": disagree (10 per cent); neither (27 per cent); and agree (63 per cent).
Base (overall): Canadians; November 9-28, 2018, n=3,040, margin of error: +/− 1.8%, 19 times out of 20
Core values: ProfessionalismCore values: Professionalism - Text version
This chart is a line graph showing the percentage for the category "Agree (1-2)" by years for the overall and the telephone only results.
Respondents were asked: "For each of the following statements about the RCMP's performance, please indicate whether you strongly agree, agree, neither agree nor disagree, disagree, or strongly disagree: The RCMP demonstrates professionalism in its work."
Respondents selected:
% agree "Overall": 2017/18 (79 per cent); and 2018/19 (81 per cent);
% agree "Telephone only": 2012/13 (85 per cent); 2016/17 (85 per cent); 2017/18 (89 per cent); and 2018/19 (88 per cent).
Base (overall): Canadians; most recent data point November 9-28, 2018, n=3,040, margin of error: +/− 1.8%, 19 times out of 20
Base (phone): Canadians; most recent data point November 9-28, 2018, n=1,324, margin of error: +/− 2.7%, 19 times out of 20
Core values: RespectCore values: Respect - Text version
This chart is a line graph showing the percentage for the category "Agree (1-2)" by years for the overall and the telephone only results.
Respondents were asked: "For each of the following statements about the RCMP's performance, please indicate whether you strongly agree, agree, neither agree nor disagree, disagree, or strongly disagree: RCMP personnel demonstrate respect."
Respondents selected:
% agree "Overall": 2017/18 (69 per cent); and 2018/19 (70 per cent);
% agree "Telephone only": 2012/13 (84 per cent); 2016/17 (82 per cent); 2017/18 (85 per cent); and 2018/19 (85 per cent).
Base (overall): Canadians; most recent data point November 9-28, 2018, n=3,040, margin of error: +/− 1.8%, 19 times out of 20
Base (phone): Canadians; most recent data point November 9-28, 2018, n=1,324, margin of error: +/− 2.7%, 19 times out of 20
Core values: IntegrityCore values: Integrity - Text version
This chart is a line graph showing the percentage for the category "Agree (1-2)" by years for the overall and the telephone only results.
Respondents were asked: "For each of the following statements about the RCMP's performance, please indicate whether you strongly agree, agree, neither agree nor disagree, disagree, or strongly disagree: The RCMP is an organization with integrity."
Respondents selected:
% agree "Overall": 2017/18 (69 per cent); and 2018/19 (72 per cent);
% agree "Telephone only": 2012/13 (84 per cent); 2016/17 (79 per cent); 2017/18 (84 per cent); and 2018/19 (87 per cent).
Base (overall): Canadians; most recent data point November 9-28, 2018, n=3,040, margin of error: +/− 1.8%, 19 times out of 20
Base (phone): Canadians; most recent data point November 9-28, 2018, n=1,324, margin of error: +/− 2.7%, 19 times out of 20
Core values: HonestyCore values: Honesty - Text version
This chart is a line graph showing the percentage for the category "Agree (1-2)" by years for the overall and the telephone only results.
Respondents were asked: "For each of the following statements about the RCMP's performance, please indicate whether you strongly agree, agree, neither agree nor disagree, disagree, or strongly disagree: RCMP personnel are honest."
Respondents selected:
% agree "Overall": 2017/18 (66 per cent); and 2018/19 (69 per cent);
% agree "Telephone only": 2012/13 (78 per cent); 2016/17 (72 per cent); 2017/18 (79 per cent); and 2018/19 (82 per cent).
Base (overall): Canadians; most recent data point November 9-28, 2018, n=3,040, margin of error: +/− 1.8%, 19 times out of 20
Base (phone): Canadians; most recent data point November 9-28, 2018, n=1,324, margin of error: +/− 2.7%, 19 times out of 20
Core values: AccountabilityCore values: Accountability - Text version
This chart is a line graph showing the percentage for the category "Agree (1-2)" by years for the overall and the telephone only results.
Respondents were asked: "For each of the following statements about the RCMP's performance, please indicate whether you strongly agree, agree, neither agree nor disagree, disagree, or strongly disagree: The RCMP is an accountable organization."
Respondents selected:
% agree "Overall": 2017/18 (65 per cent); and 2018/19 (64 per cent);
% agree "Telephone only": 2012/13 (80 per cent); 2016/17 (76 per cent); 2017/18 (84 per cent); and 2018/19 (82 per cent).
Base (overall): Canadians; most recent data point November 9-28, 2018, n=3,040, margin of error: +/− 1.8%, 19 times out of 20
Base (phone): Canadians; most recent data point November 9-28, 2018, n=1,324, margin of error: +/− 2.7%, 19 times out of 20
Core values: CompassionCore values: Compassion - Text version
This chart is a line graph showing the percentage for the category "Agree (1-2)" by years for the overall and the telephone only results.
Respondents were asked: "For each of the following statements about the RCMP's performance, please indicate whether you strongly agree, agree, neither agree nor disagree, disagree, or strongly disagree: RCMP personnel demonstrate compassion."
Respondents selected:
% agree "Overall": 2017/18 (60 per cent); and 2018/19 (63 per cent);
% agree "Telephone only": 2012/13 (76 per cent); 2016/17 (73 per cent); 2017/18 (77 per cent); and 2018/19 (80 per cent).
Base (overall): Canadians; most recent data point November 9-28, 2018, n=3,040, margin of error: +/− 1.8%, 19 times out of 20
Base (phone): Canadians; most recent data point November 9-28, 2018, n=1,324, margin of error: +/− 2.7%, 19 times out of 20
2.5 Views of the RCMP (General)
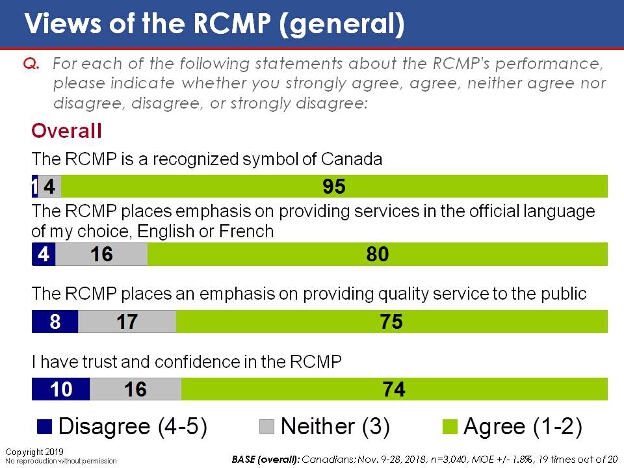
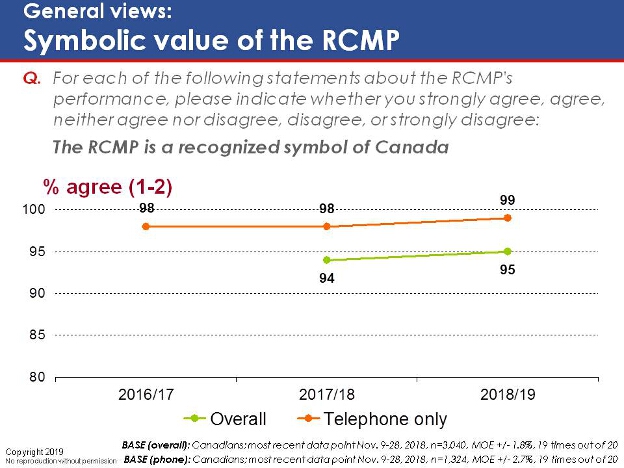
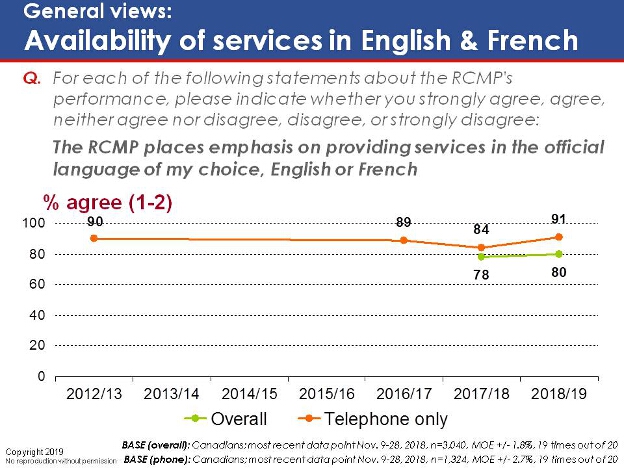
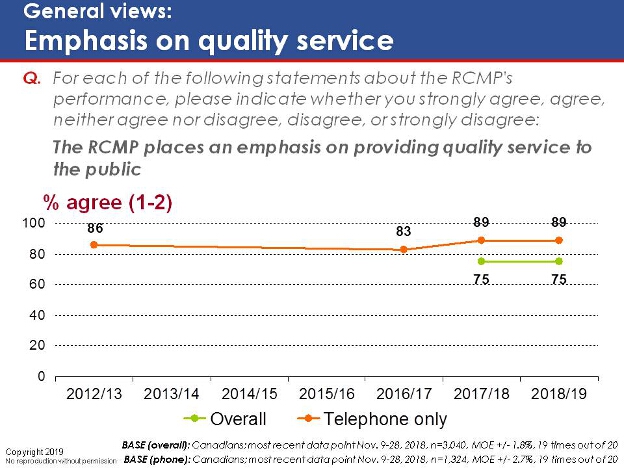
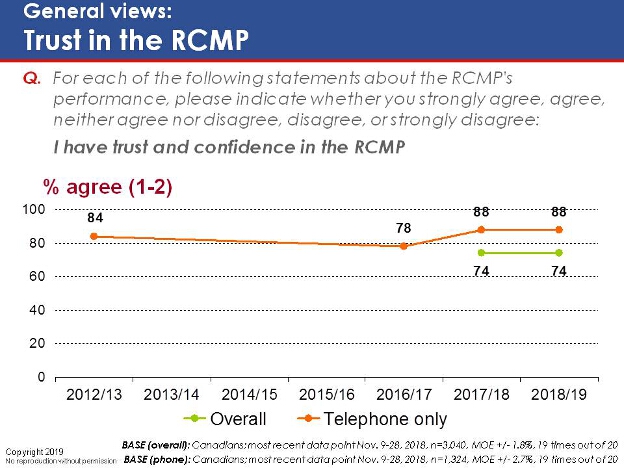
Respondents were presented with four general statements about the RCMP and asked to rate the extent to which they agreed or disagreed with each one. Once again, results suggest positive overall impressions of the RCMP. More than nine in ten (95 per cent) agree that the RCMP is a recognized symbol of Canada. Eight in ten (80 per cent) are satisfied with the RCMP's efforts to provide services in both official languages. More than seven in ten agree that the RCMP prioritizes quality service (75 per cent), and expressed trust and confidence in the RCMP (74 per cent).
Tracking reveals a 7-point rise in the proportion of Canadians who agree that the RCMP prioritizes providing services in both official languages over the past year. Other findings have remained largely stable over the past year.
Belief that the RCMP places emphasis on providing quality service rises with age (from 70 per cent among those under the age of 35 to 83 per cent among those ages 65 and over). Those ages 65 and over are also more likely to express trust and confidence in the RCMP (83 per cent, compared to 66 per cent among those under the age of 35).
Those in the LGBTQ2S community are less likely to say the RCMP places emphasis on providing bilingual services (52 per cent, compared to 80 per cent on average), provides quality service (52 per cent versus 75 per cent), or maintains their trust and confidence (54 per cent versus 74 per cent).
Views of the RCMP (general)Views of the RCMP (general) - Text version
This chart has four horizontal stacked bars showing the overall results Based on a five-point scale where 4-5 means disagree, 3 means neither, and 1-2 means agree.
Respondents were asked: "For each of the following statements about the RCMP's performance, please indicate whether you strongly agree, agree, neither agree nor disagree, disagree, or strongly disagree."
Respondents selected:
"The RCMP is a recognized symbol of Canada": disagree (1 per cent); neither (4 per cent); and agree (95 per cent);
"The RCMP places emphasis on providing services in the official language of my choice, English or French": disagree (4 per cent); neither (16 per cent); and agree (80 per cent);
"The RCMP places an emphasis on providing quality service to the public": disagree (8 per cent); neither (17 per cent); and agree (75 per cent);
"I have trust and confidence in the RCMP": disagree (10 per cent); neither (16 per cent); and agree (74 per cent).
Base (overall): Canadians; November 9-28, 2018, n=3,040, margin of error: +/− 1.8%, 19 times out of 20
General views: Symbolic value of the RCMPGeneral views: Symbolic value of the RCMP - Text version
This chart is a line graph showing the percentage for the category "Agree (1-2)" by years for the overall and the telephone only results.
Respondents were asked: "For each of the following statements about the RCMP's performance, please indicate whether you strongly agree, agree, neither agree nor disagree, disagree, or strongly disagree: The RCMP is a recognized symbol of Canada."
Respondents selected:
% agree "Overall": 2017/18 (94 per cent); and 2018/19 (95 per cent);
% agree "Telephone only": 2016/17 (98 per cent); 2017/18 (98 per cent); and 2018/19 (99 per cent).
Base (overall): Canadians; most recent data point November 9-28, 2018, n=3,040, margin of error: +/− 1.8%, 19 times out of 20
Base (phone): Canadians; most recent data point November 9-28, 2018, n=1,324, margin of error: +/− 2.7%, 19 times out of 20
General views: Availability of services in English and FrenchGeneral views: Availability of services in English and French - Text version
This chart is a line graph showing the percentage for the category "Agree (1-2)" by years for the overall and the telephone only results.
Respondents were asked: "For each of the following statements about the RCMP's performance, please indicate whether you strongly agree, agree, neither agree nor disagree, disagree, or strongly disagree: The RCMP places emphasis on providing services in the official language of my choice, English or French."
Respondents selected:
% agree "Overall": 2017/18 (78 per cent); and 2018/19 (80 per cent);
% agree "Telephone only": 2012/13 (90 per cent); 2016/17 (89 per cent); 2017/18 (84 per cent); and 2018/19 (91 per cent).
Base (overall): Canadians; most recent data point November 9-28, 2018, n=3,040, margin of error: +/− 1.8%, 19 times out of 20
Base (phone): Canadians; most recent data point November 9-28, 2018, n=1,324, margin of error: +/− 2.7%, 19 times out of 20
General views: Emphasis on quality serviceGeneral views: Emphasis on quality service - Text version
This chart is a line graph showing the percentage for the category "Agree (1-2)" by years for the overall and the telephone only results.
Respondents were asked: "For each of the following statements about the RCMP's performance, please indicate whether you strongly agree, agree, neither agree nor disagree, disagree, or strongly disagree: The RCMP places an emphasis on providing quality service to the public."
Respondents selected:
% agree "Overall": 2017/18 (75 per cent); and 2018/19 (75 per cent);
% agree "Telephone only": 2012/13 (86 per cent); 2016/17 (83 per cent); 2017/18 (89 per cent); and 2018/19 (89 per cent).
Base (overall): Canadians; most recent data point November 9-28, 2018, n=3,040, margin of error: +/− 1.8%, 19 times out of 20
Base (phone): Canadians; most recent data point November 9-28, 2018, n=1,324, margin of error: +/− 2.7%, 19 times out of 20
General views: Trust in the RCMPGeneral views: Trust in the RCMP - Text version
This chart is a line graph showing the percentage for the category "Agree (1-2)" by years for the overall and the telephone only results.
Respondents were asked: "For each of the following statements about the RCMP's performance, please indicate whether you strongly agree, agree, neither agree nor disagree, disagree, or strongly disagree: I have trust and confidence in the RCMP."
Respondents selected:
% agree "Overall": 2017/18 (74 per cent); and 2018/19 (74 per cent);
% agree "Telephone only": 2012/13 (84 per cent); 2016/17 (78 per cent); 2017/18 (88 per cent); and 2018/19 (88 per cent).
Base (overall): Canadians; most recent data point November 9-28, 2018, n=3,040, margin of error: +/− 1.8%, 19 times out of 20
Base (phone): Canadians; most recent data point November 9-28, 2018, n=1,324, margin of error: +/− 2.7%, 19 times out of 20
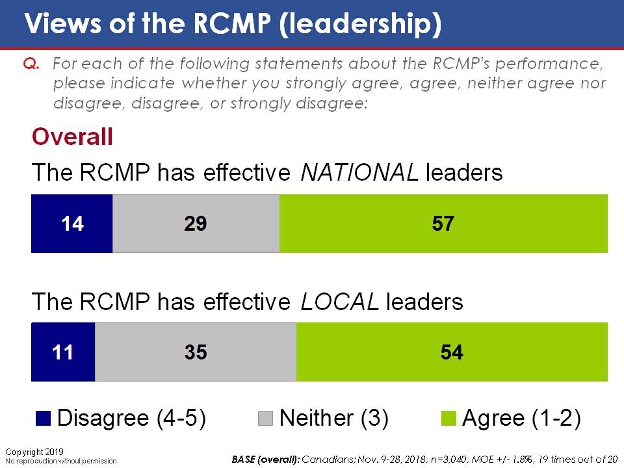
2.6 Views of the RCMP (Leadership)
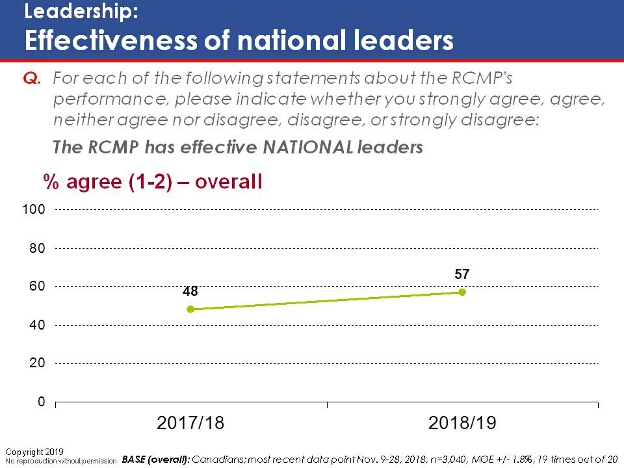
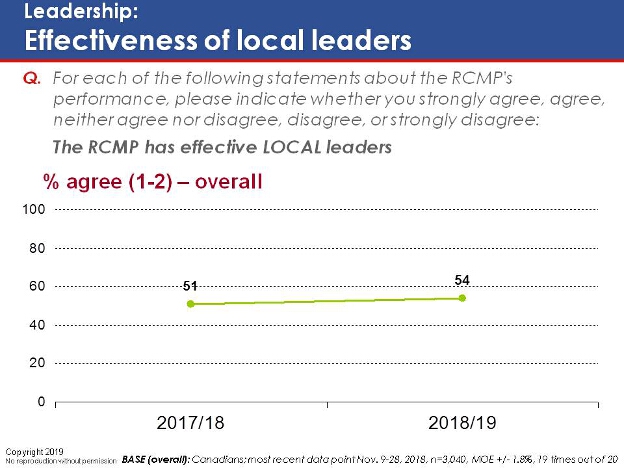
While Canadians have a high degree of confidence in the RCMP in general, they award lower marks when it comes to the calibre of its leadership. Respondents also made little distinction between the different levels of leadership; 57 per cent rated the RCMP's national leaders as effective (compared to 14 per cent who disagreed) while roughly the same proportion (54 per cent) offered a positive appraisal of its national leaders (versus 11 per cent who disagreed).
Tracking (overall) results reveals that confidence in the RCMP's national leadership is up 9 points over the past year, and confidence in local leadership is up three points (please note these questions have only been asked in the last two waves of surveying).
Those ages 65 and over are more likely to express confidence in both the RCMP's national leaders (67 per cent, compared to 57 per cent on average) and its local leaders (67 per cent versus 54 per cent).
Those with a high school education are more likely to assign favourable ratings to RCMP's leadership at both the national level (66 per cent, compared to 57 per cent on average) and the local level (65 per cent versus 54 per cent).
Residents of Atlantic Canada are more likely to rate the RCMP's local leaders as effective (64 per cent, compared to 54 per cent at the national level).
Those who identify as LGBTQ2S place comparatively less faith in both national leaders (43 per cent, compared to 57 per cent on average) and local leaders (32 per cent versus 54 per cent). In contrast, those with disabilities place a greater degree of confidence in the RCMP's national leadership (68 per cent, compared to 57 per cent on average), while Indigenous respondents have more confidence in its local leadership (68 per cent versus 54 per cent).
Views of the RCMP (leadership)Views of the RCMP (leadership) - Text version
This chart has two horizontal stacked bars showing the overall results Based on a five-point scale where 4-5 means disagree, 3 means neither, and 1-2 means agree.
Respondents were asked: "For each of the following statements about the RCMP's performance, please indicate whether you strongly agree, agree, neither agree nor disagree, disagree, or strongly disagree."
Respondents selected:
"The RCMP has effective national leaders": disagree (14 per cent); neither (29 per cent); and agree (57 per cent);
"The RCMP has effective local leaders": disagree (11 per cent); neither (35 per cent); and agree (54 per cent).
Base (overall): Canadians; November 9-28, 2018, n=3,040, margin of error: +/− 1.8%, 19 times out of 20
Leadership: Effectiveness of natioal leadersLeadership: Effectiveness of natioal leaders - Text version
This chart is a line graph showing the percentage for the category "Agree (1-2)" by years for the overall results.
Respondents were asked: "For each of the following statements about the RCMP's performance, please indicate whether you strongly agree, agree, neither agree nor disagree, disagree, or strongly disagree: The RCMP has effective national leaders."
Respondents selected:
% agree "Overall": 2017/18 (48 per cent); and 2018/19 (57 per cent).
Base (overall): Canadians; most recent data point November 9-28, 2018, n=3,040, margin of error: +/− 1.8%, 19 times out of 20
Leadership: Effectiveness of local leadersLeadership: Effectiveness of local leaders - Text version
This chart is a line graph showing the percentage for the category "Agree (1-2)" by years for the overall results.
Respondents were asked: "For each of the following statements about the RCMP's performance, please indicate whether you strongly agree, agree, neither agree nor disagree, disagree, or strongly disagree: The RCMP has effective LOCAL leaders."
Respondents selected:
% agree "Overall": 2017/18 (51 per cent); and 2018/19 (54 per cent).
Base (overall): Canadians; most recent data point November 9-28, 2018, n=3,040, margin of error: +/− 1.8%, 19 times out of 20
2.7 Relationship with RCMP
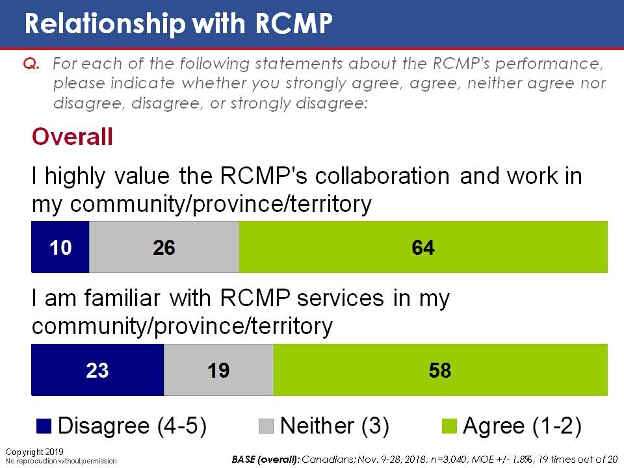
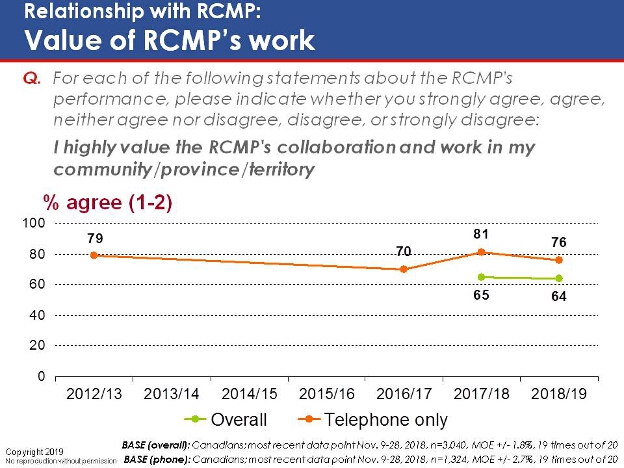
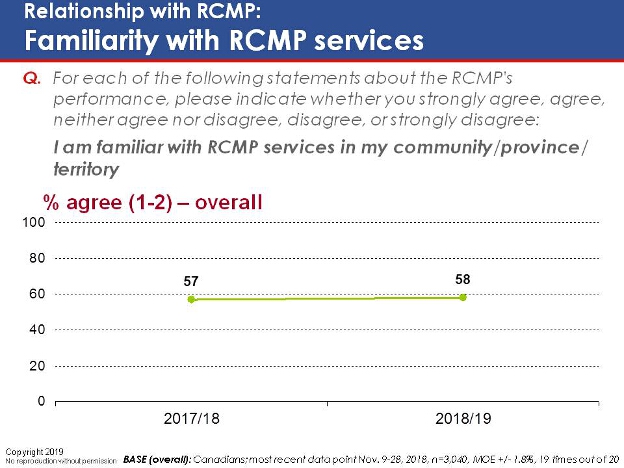
Looking at Canadians' relationship with the RCMP, six in ten respondents (58 per cent) say they are familiar with RCMP services in their area, while one in four (23 per cent) indicated they are not. In addition, about two-thirds (64 per cent) say they value the RCMP's local work, and only 10 per cent disagree with this idea.
Tracking results reveals that the proportion of respondents who say they value the RCMP's work has declined five points over the past year.
The value placed on the RCMP's local work rises progressively with age (from 58 per cent among those under the age of 35 to 75 per cent among those ages 65 and over). Those ages 65 and over have the highest levels of self-rated familiarity with local RCMP services (67 per cent, compared to 58 per cent on average).
Those with high school education are more likely to say they are familiar with the RCMP's local services (68 per cent, compared to 58 per cent on average) and are more likely to place value on these services (73 per cent versus 64 per cent).
Perhaps not surprisingly, those who reside in provinces with their own police forces, i.e. Ontario and Quebec, and who consequently have the least exposure to the RCMP are both less familiar with the RCMP services available in their area (46 per cent, compared to 58 per cent nationally) and less likely to value these services (57 per cent versus 64 per cent nationally).
Those who identify as LGBTQ2S are comparatively less familiar with RCMP services (45 per cent, compared to 58 per cent on average) and, perhaps consequently, are less likely to value them (47 per cent versus 64 per cent).
Relationship with RCMPRelationship with RCMP - Text version
This chart has two horizontal stacked bars showing the overall results Based on a five-point scale where 4-5 means disagree, 3 means neither, and 1-2 means agree.
Respondents were asked: "For each of the following statements about the RCMP's performance, please indicate whether you strongly agree, agree, neither agree nor disagree, disagree, or strongly disagree."
Respondents selected:
"I highly value the RCMP's collaboration and work in my community/province/territory": disagree (10 per cent); neither (26 per cent); and agree (64 per cent);
"I am familiar with RCMP services in my community/province/territory": disagree (23 per cent); neither (19 per cent); and agree (58 per cent).
Base (overall): Canadians; November 9-28, 2018, n=3,040, margin of error: +/− 1.8%, 19 times out of 20
Relationship with RCMP: Value of RCMP's workRelationship with RCMP: Value of RCMP's work - Text version
This chart is a line graph showing the percentage for the category "Agree (1-2)" by years for the overall and the telephone only results.
Respondents were asked: "For each of the following statements about the RCMP's performance, please indicate whether you strongly agree, agree, neither agree nor disagree, disagree, or strongly disagree: I highly value the RCMP's collaboration and work in my community/province/territory."
Respondents selected:
% agree "Overall": 2017/18 (65 per cent); and 2018/19 (64 per cent);
% agree "Telephone only": 2012/13 (79 per cent); 2016/17 (70 per cent); 2017/18 (81 per cent); and 2018/19 (76 per cent).
Base (overall): Canadians; most recent data point November 9-28, 2018, n=3,040, margin of error: +/− 1.8%, 19 times out of 20
Base (phone): Canadians; most recent data point November 9-28, 2018, n=1,324, margin of error: +/− 2.7%, 19 times out of 20
Relationship with RCMP: Familiarity with RCMP servicesRelationship with RCMP: Familiarity with RCMP services - Text version
This chart is a line graph showing the percentage for the category "Agree (1-2)" by years for the overall results.
Respondents were asked: "For each of the following statements about the RCMP's performance, please indicate whether you strongly agree, agree, neither agree nor disagree, disagree, or strongly disagree: I am familiar with RCMP services in my community/province/ territory."
Respondents selected:
% agree "Overall": 2017/18 (57 per cent); and 2018/19 (58 per cent).
Base (overall): Canadians; most recent data point November 9-28, 2018, n=3,040, margin of error: +/− 1.8%, 19 times out of 20
2.8 Views of the RCMP (Transparency)
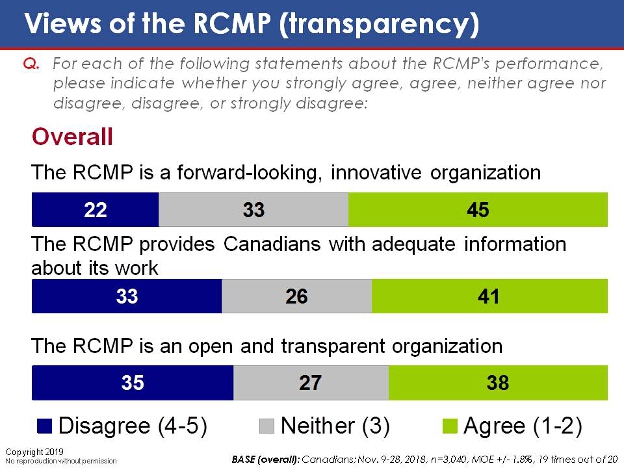
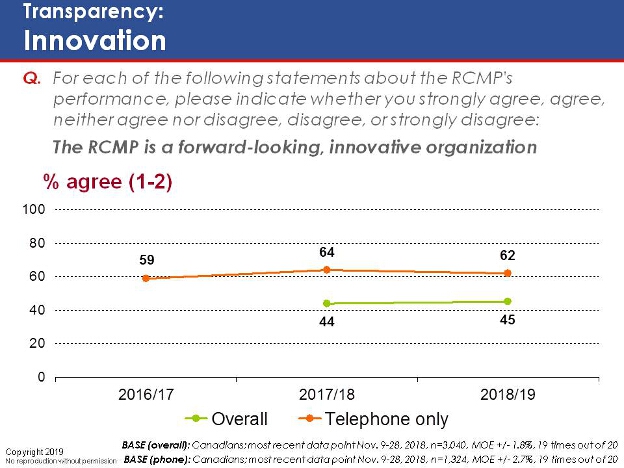
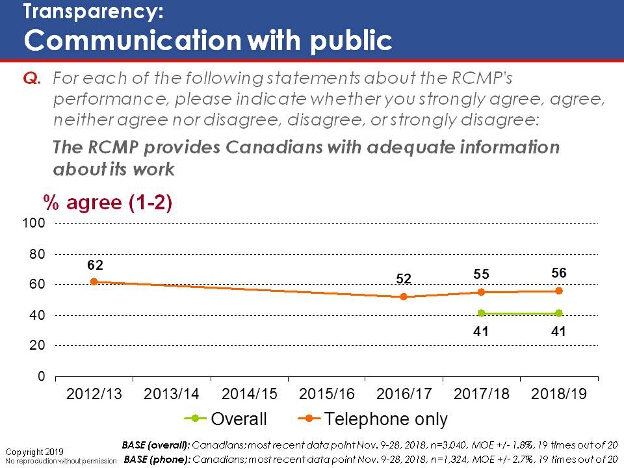
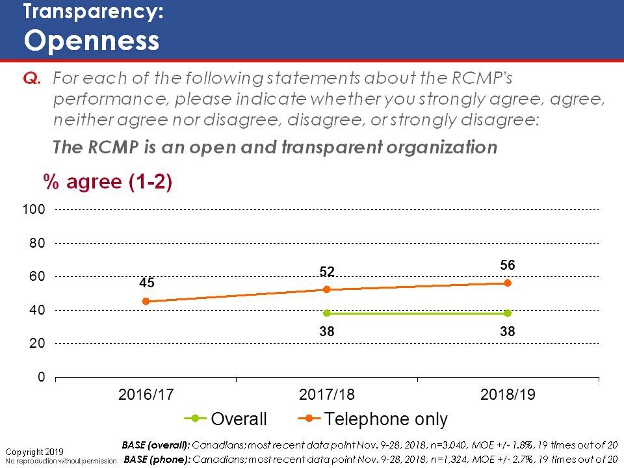
The RCMP receives mixed reviews when it comes to issues related to innovation and transparency. Fewer than half of respondents (45 per cent) agree that the RCMP is a forward-looking and innovative organisation, (compared to one in five [22 per cent] who disagree). About four in ten (41 per cent) are satisfied with the level of information that the RCMP provides about its work, and one-third (33 per cent) expressed dissatisfaction in this area. Respondents were sharply divided on whether the RCMP could be considered an open and transparent organization – four in ten (38 per cent) agree with this assessment, while virtually the same proportion (35 per cent) disagree (although it is possible that Canadians may see the RCMP as appropriately not transparent, given the type of information they hold - e.g., criminal records, witness addresses, information before the courts, investigative techniques, etc.).
Tracking reveals an 11-point increase in the proportion of Canadians who see the RCMP as an open and transparent organization since 2016/17. Other indicators have remained stable over the past year.
Those ages 65 and over are more apt to agree that the RCMP constitutes and open and transparent organization (46 per cent, compared to 38 per cent on average).
Those with a high school education are consistently more likely to express favourable views of the RCMP in terms of its transparency. For example, 52 per cent of these respondents deem the RCMP an open and transparent organization, compared to 34 per cent of college and university graduates.
Regionally, those who reside in Atlantic Canada are more likely to believe the RCMP is a transparent organization: 45 per cent of Atlantic Canadians say the RCMP is open and transparent, compared to 38 per cent nationally. Those who reside in Ontario and Quebec are least likely to say that the RCMP provides adequate information about its work (37 per cent, compared to between 45 per cent and 72 per cent elsewhere).
Those in the LGBTQ2S community consistently give the RCMP poorer marks on issues related to transparency. For example, 28 per cent believe the RCMP to be forward-thinking, compared to 45 per cent on average.
Views of the RCMP (transparency)Views of the RCMP (transparency) - Text version
This chart has three horizontal stacked bars showing the overall results Based on a five-point scale where 4-5 means disagree, 3 means neither, and 1-2 means agree.
Respondents were asked: "For each of the following statements about the RCMP's performance, please indicate whether you strongly agree, agree, neither agree nor disagree, disagree, or strongly disagree."
Respondents selected:
"The RCMP is a forward-looking, innovative organization": disagree (22 per cent); neither (33 per cent); and agree (45 per cent);
"The RCMP provides Canadians with adequate information about its work": disagree (33 per cent); neither (26 per cent); and agree (41 per cent);
"The RCMP is an open and transparent organization": disagree (35 per cent); neither (27 per cent); and agree (38 per cent).
Base (overall): Canadians; November 9-28, 2018, n=3,040, margin of error: +/− 1.8%, 19 times out of 20
Transparency: InnovationTransparency: Innovation - Text version
This chart is a line graph showing the percentage for the category "Agree (1-2)" by years for the overall and the telephone only results.
Respondents were asked: "For each of the following statements about the RCMP's performance, please indicate whether you strongly agree, agree, neither agree nor disagree, disagree, or strongly disagree: The RCMP is a forward-looking, innovative organization."
Respondents selected:
% agree "Overall": 2017/18 (44 per cent); and 2018/19 (45 per cent);
% agree "Telephone only": 2016/17 (59 per cent); 2017/18 (64 per cent); and 2018/19 (62 per cent).
Base (overall): Canadians; most recent data point November 9-28, 2018, n=3,040, margin of error: +/− 1.8%, 19 times out of 20
Base (phone): Canadians; most recent data point November 9-28, 2018, n=1,324, margin of error: +/− 2.7%, 19 times out of 20
Transparency: Communication with publicTransparency: Communication with public - Text version
This chart is a line graph showing the percentage for the category "Agree (1-2)" by years for the overall and the telephone only results.
Respondents were asked: "For each of the following statements about the RCMP's performance, please indicate whether you strongly agree, agree, neither agree nor disagree, disagree, or strongly disagree: The RCMP provides Canadians with adequate information about its work."
Respondents selected:
% agree "Overall": 2017/18 (41 per cent); and 2018/19 (41 per cent);
% agree "Telephone only": 2012/13 (62 per cent); 2016/17 (52 per cent); 2017/18 (55 per cent); and 2018/19 (56 per cent).
Base (overall): Canadians; most recent data point November 9-28, 2018, n=3,040, margin of error: +/− 1.8%, 19 times out of 20
Base (phone): Canadians; most recent data point November 9-28, 2018, n=1,324, margin of error: +/− 2.7%, 19 times out of 20
Transparency: OpennessTransparency: Openness - Text version
This chart is a line graph showing the percentage for the category "Agree (1-2)" by years for the overall and the telephone only results.
Respondents were asked: "For each of the following statements about the RCMP's performance, please indicate whether you strongly agree, agree, neither agree nor disagree, disagree, or strongly disagree: The RCMP is an open and transparent organization."
Respondents selected:
% agree "Overall": 2017/18 (38 per cent); and 2018/19 (38 per cent);
% agree "Telephone only": 2016/17 (45 per cent); 2017/18 (52 per cent); and 2018/19 (56 per cent).
Base (overall): Canadians; most recent data point November 9-28, 2018, n=3,040, margin of error: +/− 1.8%, 19 times out of 20
Base (phone): Canadians; most recent data point November 9-28, 2018, n=1,324, margin of error: +/− 2.7%, 19 times out of 20
2.9 Views of the RCMP (Sensitivity)
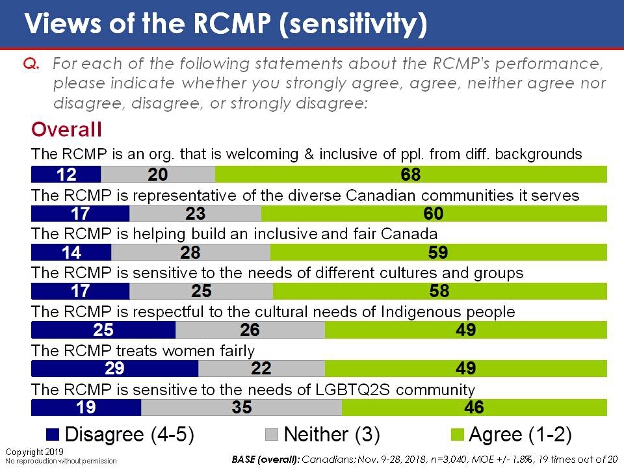
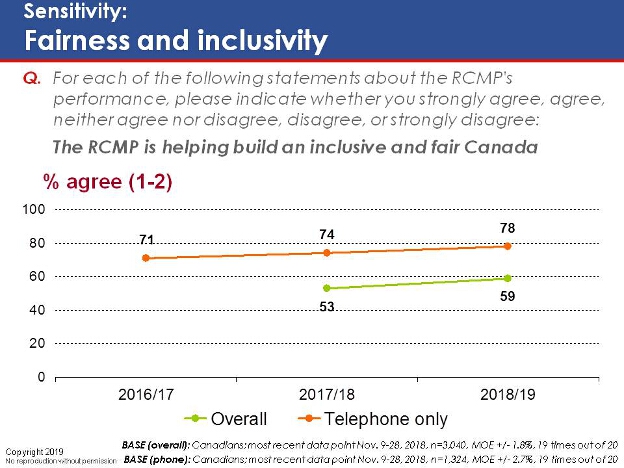
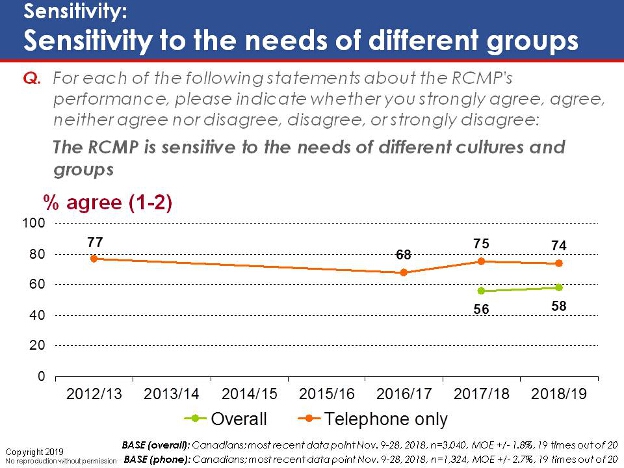
The RCMP scores moderately well on broader indicators related to sensitivity. Two-thirds of respondents (68 per cent) agree that the RCMP is welcoming and inclusive of people from varying backgrounds. Six in ten believe that the RCMP is representative of the diverse communities it serves (60 per cent), that it is helping to build a fair and inclusive Canada (59 per cent), and that it is sensitive to the needs of Canada's various cultures and groups (58 per cent).
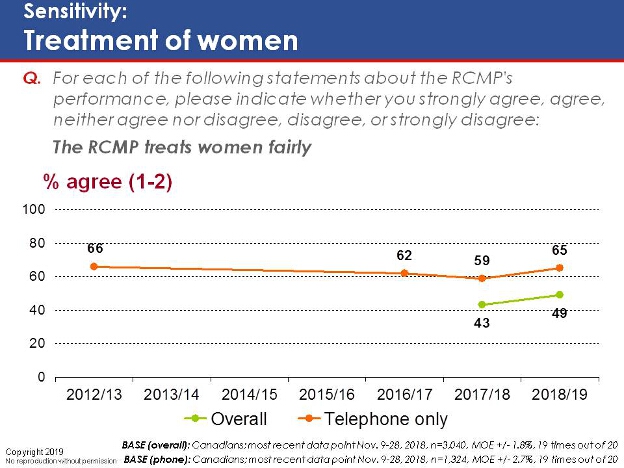
When the scope of the questions is narrowed to focus on specific groups, however, the RCMP elicits less favourable reviews. Half of respondents (49 per cent) agree that the RCMP is respectful to the cultural needs of Indigenous people (compared to 25 per cent who disagree), while the same proportion (49 per cent) believe that the RCMP treats women fairly (compared to 29 per cent who disagree). Slightly fewer (46 per cent) say the RCMP is sensitive to needs of the LGBTQ2S community and 19 per cent disagree, while the remaining 35 per cent neither agree nor disagree, suggesting a fair degree of uncertainty on the matter.
Tracking reveals a six-point increase in agreement that the RCMP treats women fairly, and a four-point increase in agreement that the RCMP is helping to build an inclusive and fair Canada over the past year.
Those ages 65 and over are more likely to offer a positive appraisal of the RCMP when it comes to the broader indicators of sensitivity. For example, 75 per cent of these respondents believe the RCMP welcomes people from different backgrounds, compared to 68 per cent on average. Those under the age of 35 are more likely to say the RCMP treats women fairly (57 per cent, compared to 49 per cent on average).
Agreement with these statements consistently declines with educational attainment. For example, 76 per cent of high school graduates feel the RCMP is welcomes those of different backgrounds, compared to 63 per cent of university graduates.
LGBTQ2S respondents are significantly less likely to agree with these statements. Of particular note, just 29 per cent agree that the RCMP is sensitive to the needs of the LCBTQ2S community, compared to 46 per cent on average. Indigenous respondents are more likely to disagree that the RCMP is respectful to their cultural needs (35 per cent, compared to 25 per cent on average).
Views of the RCMP (sensitivity)Views of the RCMP (sensitivity) - Text version
This chart has seven horizontal stacked bars showing the overall results Based on a five-point scale where 4-5 means disagree, 3 means neither, and 1-2 means agree.
Respondents were asked: "For each of the following statements about the RCMP's performance, please indicate whether you strongly agree, agree, neither agree nor disagree, disagree, or strongly disagree."
Respondents selected:
"The RCMP is an org. that is welcoming & inclusive of ppl. from diff. backgrounds": disagree (12 per cent); neither (20 per cent); and agree (68 per cent);
"The RCMP is representative of the diverse Canadian communities it serves": disagree (17 per cent); neither (23 per cent); and agree (60 per cent);
"The RCMP is helping build an inclusive and fair Canada": disagree (14 per cent); neither (28 per cent); and agree (59 per cent);
"The RCMP is sensitive to the needs of different cultures and groups": disagree (17 per cent); neither (25 per cent); and agree (58 per cent);
"The RCMP is respectful to the cultural needs of Indigenous people": disagree (25 per cent); neither (26 per cent); and agree (49 per cent);
"The RCMP treats women fairly": disagree (29 per cent); neither (22 per cent); and agree (49 per cent);
"The RCMP is sensitive to the needs of LGBTQ2S community": disagree (19 per cent); neither (35 per cent); and agree (46 per cent).
Base (overall): Canadians; November 9-28, 2018, n=3,040, margin of error: +/− 1.8%, 19 times out of 20
Sensitivity: Fairness and inclusivitySensitivity: Fairness and inclusivity - Text version
This chart is a line graph showing the percentage for the category "Agree (1-2)" by years for the overall and the telephone only results.
Respondents were asked: "For each of the following statements about the RCMP's performance, please indicate whether you strongly agree, agree, neither agree nor disagree, disagree, or strongly disagree: The RCMP is helping build an inclusive and fair Canada."
Respondents selected:
% agree "Overall": 2017/18 (53 per cent); and 2018/19 (59 per cent);
% agree "Telephone only": 2016/17 (71 per cent); 2017/18 (74 per cent); and 2018/19 (78 per cent).
Base (overall): Canadians; most recent data point November 9-28, 2018, n=3,040, margin of error: +/− 1.8%, 19 times out of 20
Base (phone): Canadians; most recent data point November 9-28, 2018, n=1,324, margin of error: +/− 2.7%, 19 times out of 20
Sensitivity: Sensitivity to the needs of different groupsSensitivity: Sensitivity to the needs of different groups - Text version
This chart is a line graph showing the percentage for the category "Agree (1-2)" by years for the overall and the telephone only results.
Respondents were asked: "For each of the following statements about the RCMP's performance, please indicate whether you strongly agree, agree, neither agree nor disagree, disagree, or strongly disagree: The RCMP is sensitive to the needs of different cultures and groups."
Respondents selected:
% agree "Overall": 2017/18 (56 per cent); and 2018/19 (58 per cent);
% agree "Telephone only": 2012/13 (77 per cent); 2016/17 (68 per cent); 2017/18 (75 per cent); and 2018/19 (74 per cent).
Base (overall): Canadians; most recent data point November 9-28, 2018, n=3,040, margin of error: +/− 1.8%, 19 times out of 20
Base (phone): Canadians; most recent data point November 9-28, 2018, n=1,324, margin of error: +/− 2.7%, 19 times out of 20
Sensitivity: Treatment of womenSensitivity: Treatment of women - Text version
This chart is a line graph showing the percentage for the category "Agree (1-2)" by years for the overall and the telephone only results.
Respondents were asked: "For each of the following statements about the RCMP's performance, please indicate whether you strongly agree, agree, neither agree nor disagree, disagree, or strongly disagree: The RCMP treats women fairly."
Respondents selected:
% agree "Overall": 2017/18 (43 per cent); and 2018/19 (49 per cent);
% agree "Telephone only": 2012/13 (66 per cent); 2016/17 (62 per cent); 2017/18 (59 per cent); and 2018/19 (65 per cent).
Base (overall): Canadians; most recent data point November 9-28, 2018, n=3,040, margin of error: +/− 1.8%, 19 times out of 20
Base (phone): Canadians; most recent data point November 9-28, 2018, n=1,324, margin of error: +/− 2.7%, 19 times out of 20
2.10 Views of the RCMP (Community Engagement)
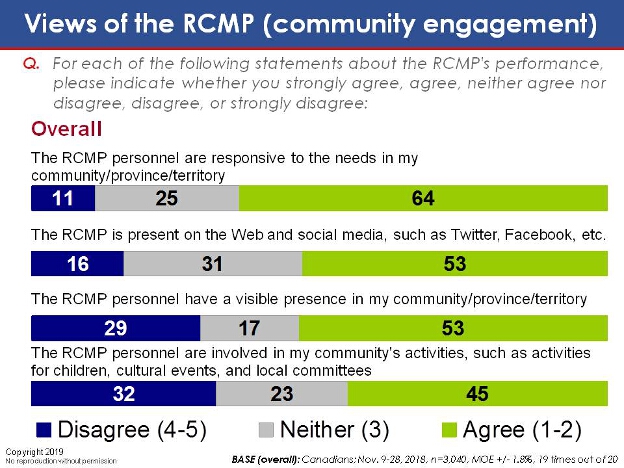
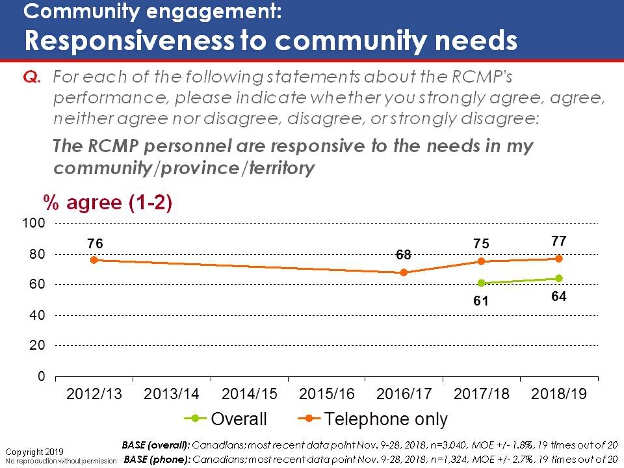
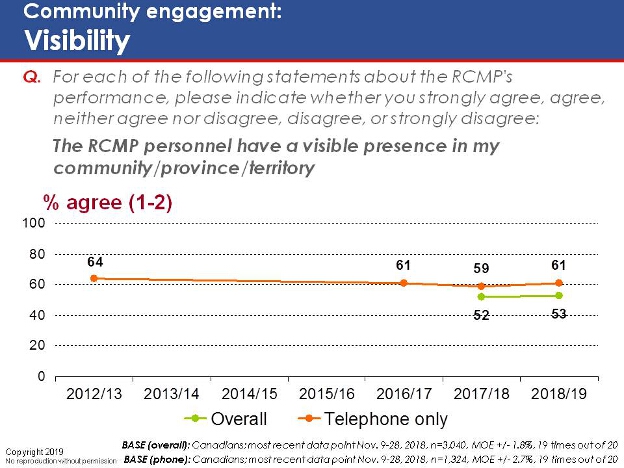
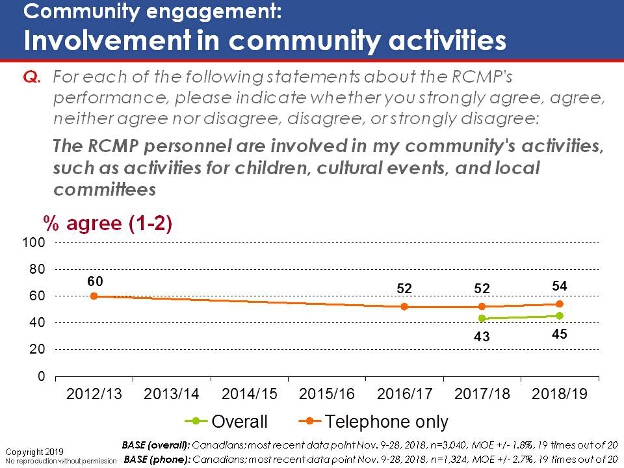
Looking at visibility and community engagement issues, a clear majority of respondents (64 per cent) say that RCMP personnel are responsive to the needs of their communities, and just 11 per cent disagreed. The other issues examined reveal more mixed views. About half believe that the RCMP maintains a social media presence (53 per cent, compared to 16 per cent who disagree) or that RCMP personnel have a visible presence in their community (53 per cent, compared to 30 per cent who disagree). Just over four in ten (45 per cent) say that RCMP personnel are involved in their community's activities, and one-third (32 per cent) disagree with this idea.
It is important to note, however, that the seemingly high levels of disagreement on some of these indicators are driven by the high rates of disagreement in provinces that have their own provincial police forces. For example, 45 per cent of respondents in Ontario and Quebec disagree that the RCMP are involved in local activities, while this figure does not exceed 16 per cent in any other region.
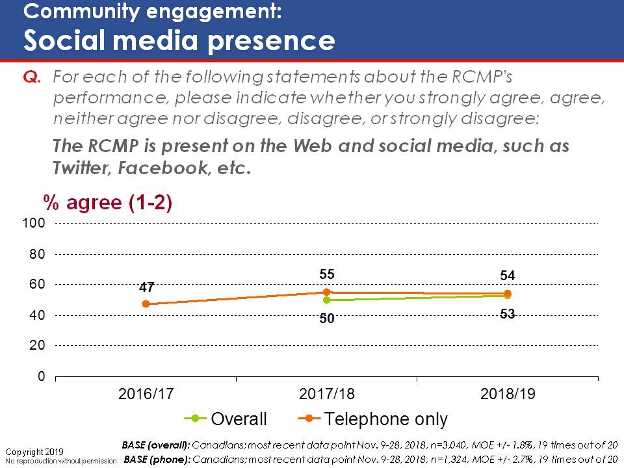
Tracking reveals a 7-point increase in agreement that the RCMP maintains a social media presence.
Those under the age of 35 are more apt to say that the RCMP maintains an active social media presence (60 per cent, compared to 53 per cent nationally). Those ages 65 and over are more likely to agree with each of the other statements tested.
Those with a high school education consistently offered a more positive appraisal of the RCMP's community engagement efforts. For example, 71 per cent believe that RCMP personnel are responsive to their communities' needs, compared to 64 per cent on average.
Perhaps not surprisingly, residents of Ontario and Quebec – provinces that are serviced primarily by their own police forces rather than the RCMP – are consistently the least likely to offer positive feedback regarding the RCMP's community engagement. For example, just 30 per cent agree that the RCMP is involved in their communities, compared to 45 per cent nationally. Northerners are more likely to say the RCMP takes an active role in their community (85 per cent, compared to 45 per cent nationally). Atlantic Canadians are more likely to recall the RCMP's social media presence (66 per cent, compared to 53 per cent nationally).
Those in the LGBTQ2S community are consistently less likely to agree with any of these statements.
Views of the RCMP (community engagement)Views of the RCMP (community engagement) - Text version
This chart has four horizontal stacked bars showing the overall results Based on a five-point scale where 4-5 means disagree, 3 means neither, and 1-2 means agree.
Respondents were asked: "For each of the following statements about the RCMP's performance, please indicate whether you strongly agree, agree, neither agree nor disagree, disagree, or strongly disagree."
Respondents selected:
"The RCMP personnel are responsive to the needs in my community/province/territory": disagree (11 per cent); neither (25 per cent); and agree (64 per cent);
"The RCMP is present on the Web and social media, such as Twitter, Facebook, etc.": disagree (16 per cent); neither (31 per cent); and agree (53 per cent);
"The RCMP personnel have a visible presence in my community/province/territory": disagree (29 per cent); neither (17 per cent); and agree (53 per cent);
"The RCMP personnel are involved in my community's activities, such as activities for children, cultural events, and local committees": disagree (32 per cent); neither (23 per cent); and agree (45 per cent).
Base (overall): Canadians; November 9-28, 2018, n=3,040, margin of error: +/− 1.8%, 19 times out of 20
Community engagement: Responsiveness to community needsCommunity engagement: Responsiveness to community needs - Text version
This chart is a line graph showing the percentage for the category "Agree (1-2)" by years for the overall and the telephone only results.
Respondents were asked: "For each of the following statements about the RCMP's performance, please indicate whether you strongly agree, agree, neither agree nor disagree, disagree, or strongly disagree: The RCMP personnel are responsive to the needs in my community/province/territory."
Respondents selected:
% agree "Overall": 2017/18 (61 per cent); and 2018/19 (64 per cent);
% agree "Telephone only": 2012/13 (76 per cent); 2016/17 (68 per cent); 2017/18 (75 per cent); and 2018/19 (77 per cent).
Base (overall): Canadians; most recent data point November 9-28, 2018, n=3,040, margin of error: +/− 1.8%, 19 times out of 20
Base (phone): Canadians; most recent data point November 9-28, 2018, n=1,324, margin of error: +/− 2.7%, 19 times out of 20
Community engagement: Social media presenceCommunity engagement: Social media presence - Text version
This chart is a line graph showing the percentage for the category "Agree (1-2)" by years for the overall and the telephone only results.
Respondents were asked: "For each of the following statements about the RCMP's performance, please indicate whether you strongly agree, agree, neither agree nor disagree, disagree, or strongly disagree: The RCMP is present on the Web and social media, such as Twitter, Facebook, etc.."
Respondents selected:
% agree "Overall": 2017/18 (50 per cent); and 2018/19 (53 per cent);
% agree "Telephone only": 2016/17 (47 per cent); 2017/18 (55 per cent); and 2018/19 (54 per cent).
Base (overall): Canadians; most recent data point November 9-28, 2018, n=3,040, margin of error: +/− 1.8%, 19 times out of 20
Base (phone): Canadians; most recent data point November 9-28, 2018, n=1,324, margin of error: +/− 2.7%, 19 times out of 20
Community engagement: VisibilityCommunity engagement: Visibility - Text version
This chart is a line graph showing the percentage for the category "Agree (1-2)" by years for the overall and the telephone only results.
Respondents were asked: "For each of the following statements about the RCMP's performance, please indicate whether you strongly agree, agree, neither agree nor disagree, disagree, or strongly disagree: The RCMP personnel have a visible presence in my community/province/territory."
Respondents selected:
% agree "Overall": 2017/18 (52 per cent); and 2018/19 (53 per cent);
% agree "Telephone only": 2012/13 (64 per cent); 2016/17 (61 per cent); 2017/18 (59 per cent); and 2018/19 (61 per cent).
Base (overall): Canadians; most recent data point November 9-28, 2018, n=3,040, margin of error: +/− 1.8%, 19 times out of 20
Base (phone): Canadians; most recent data point November 9-28, 2018, n=1,324, margin of error: +/− 2.7%, 19 times out of 20
Community engagement: Involvement in community activitiesCommunity engagement: Involvement in community activities - Text version
This chart is a line graph showing the percentage for the category "Agree (1-2)" by years for the overall and the telephone only results.
Respondents were asked: "For each of the following statements about the RCMP's performance, please indicate whether you strongly agree, agree, neither agree nor disagree, disagree, or strongly disagree: The RCMP personnel are involved in my community's activities, such as activities for children, cultural events, and local committees."
Respondents selected:
% agree "Overall": 2017/18 (43 per cent); and 2018/19 (45 per cent);
% agree "Telephone only": 2012/13 (60 per cent); 2016/17 (52 per cent); 2017/18 (52 per cent); and 2018/19 (54 per cent).
Base (overall): Canadians; most recent data point November 9-28, 2018, n=3,040, margin of error: +/− 1.8%, 19 times out of 20
Base (phone): Canadians; most recent data point November 9-28, 2018, n=1,324, margin of error: +/− 2.7%, 19 times out of 20
2.11 Views of the RCMP (Responsiveness)
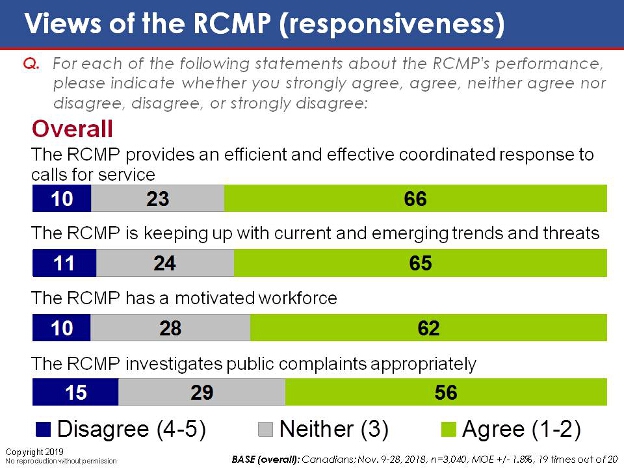
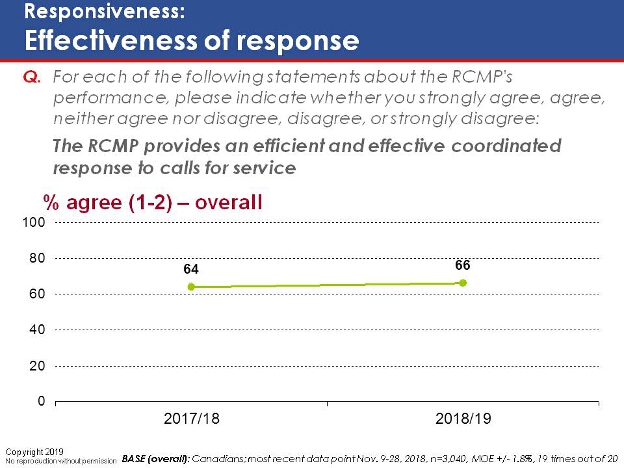
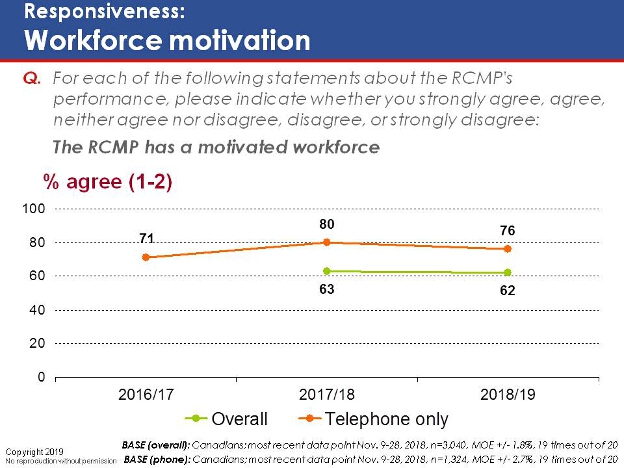
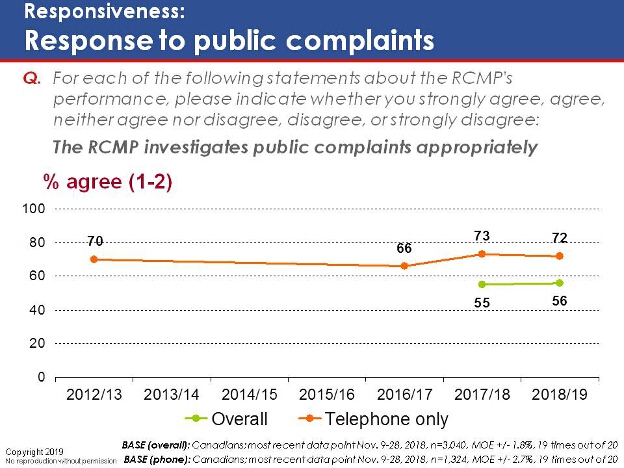
Turning to views on responsiveness, results reveal that Canadians hold generally positive views of the RCMP on these issues. More than six in ten agree that the RCMP provides effective, co-ordinated responses to calls for service (66 per cent), that it keeps up with current and emerging threats (65 per cent), and that the organization has a motivated workforce (62 per cent). More than half (56 per cent) feel that the RCMP investigates public complaints appropriately. Fewer than one in five disagree with any of these statements.
Tracking reveals relatively consistent results in satisfaction with the RCMP's responsiveness over the past few years.
Those with high school education, those ages 65 and over, and Atlantic Canadians are consistently more likely to agree with these statements. For example, 71 per cent of high school graduates, 70 per cent of those ages 65 and over, and 68 per cent of Atlantic Canadians agrees that the RCMP has a motivated workforce (compared to 62 per cent on average).
Those in the LGBTQ2S community consistently rate the RCMP more poorly in terms of its effectiveness. For example, 44 per cent would characterize RCMP personnel as motivated, compared to 62 per cent on average. Members of visible minorities are less likely to agree that the RCMP provides an appropriate response to public complaints (45 per cent, compared to 56 per cent on average).
Views of the RCMP (responsiveness)Views of the RCMP (responsiveness) - Text version
This chart has four horizontal stacked bars showing the overall results Based on a five-point scale where 4-5 means disagree, 3 means neither, and 1-2 means agree.
Respondents were asked: "For each of the following statements about the RCMP's performance, please indicate whether you strongly agree, agree, neither agree nor disagree, disagree, or strongly disagree."
Respondents selected:
"The RCMP provides an efficient and effective coordinated response to calls for service": disagree (10 per cent); neither (23 per cent); and agree (66 per cent);
"The RCMP is keeping up with current and emerging trends and threats": disagree (11 per cent); neither (24 per cent); and agree (65 per cent);
"The RCMP has a motivated workforce": disagree (10 per cent); neither (28 per cent); and agree (62 per cent);
"The RCMP investigates public complaints appropriately": disagree (15 per cent); neither (29 per cent); and agree (56 per cent).
Base (overall): Canadians; November 9-28, 2018, n=3,040, margin of error: +/− 1.8%, 19 times out of 20
Responsiveness: Effectiveness of responseResponsiveness: Effectiveness of response - Text version
This chart is a line graph showing the percentage for the category "Agree (1-2)" by years for the overall results.
Respondents were asked: "For each of the following statements about the RCMP's performance, please indicate whether you strongly agree, agree, neither agree nor disagree, disagree, or strongly disagree: The RCMP provides an efficient and effective coordinated response to calls for service."
Respondents selected:
% agree "Overall": 2017/18 (64 per cent); and 2018/19 (66 per cent).
Base (overall): Canadians; most recent data point November 9-28, 2018, n=3,040, margin of error: +/− 1.8%, 19 times out of 20
Responsiveness: Workforce motivationResponsiveness: Workforce motivation - Text version
This chart is a line graph showing the percentage for the category "Agree (1-2)" by years for the overall and the telephone only results.
Respondents were asked: "For each of the following statements about the RCMP's performance, please indicate whether you strongly agree, agree, neither agree nor disagree, disagree, or strongly disagree: The RCMP has a motivated workforce."
Respondents selected:
% agree "Overall": 2017/18 (63 per cent); and 2018/19 (62 per cent);
% agree "Telephone only": 2016/17 (71 per cent); 2017/18 (80 per cent); and 2018/19 (76 per cent).
Base (overall): Canadians; most recent data point November 9-28, 2018, n=3,040, margin of error: +/− 1.8%, 19 times out of 20
Base (phone): Canadians; most recent data point November 9-28, 2018, n=1,324, margin of error: +/− 2.7%, 19 times out of 20
Responsiveness: Response to public complaintsResponsiveness: Response to public complaints - Text version
This chart is a line graph showing the percentage for the category "Agree (1-2)" by years for the overall and the telephone only results.
Respondents were asked: "For each of the following statements about the RCMP's performance, please indicate whether you strongly agree, agree, neither agree nor disagree, disagree, or strongly disagree: The RCMP investigates public complaints appropriately."
Respondents selected:
% agree "Overall": 2017/18 (55 per cent); and 2018/19 (56 per cent);
% agree "Telephone only": 2012/13 (70 per cent); 2016/17 (66 per cent); 2017/18 (73 per cent); and 2018/19 (72 per cent).
Base (overall): Canadians; most recent data point November 9-28, 2018, n=3,040, margin of error: +/− 1.8%, 19 times out of 20
Base (phone): Canadians; most recent data point November 9-28, 2018, n=1,324, margin of error: +/− 2.7%, 19 times out of 20
2.12 Impact of the RCMP
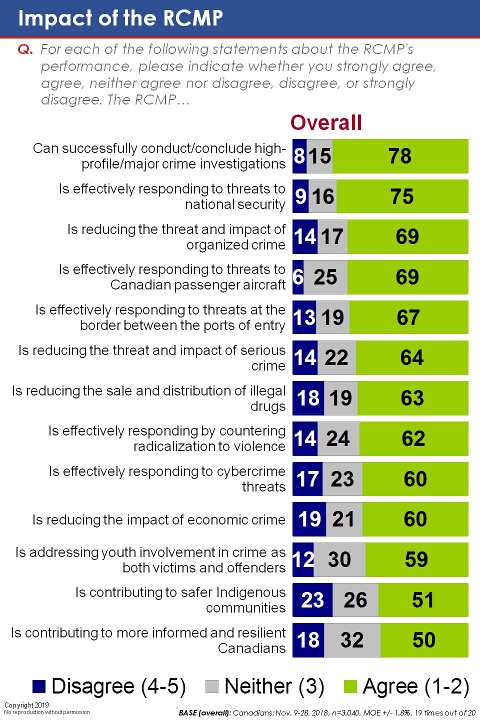
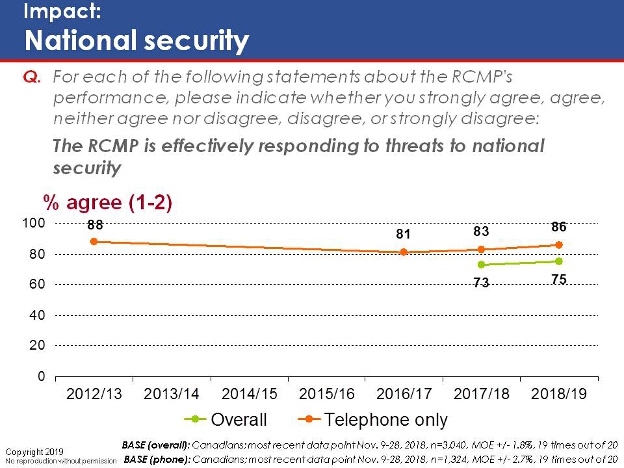
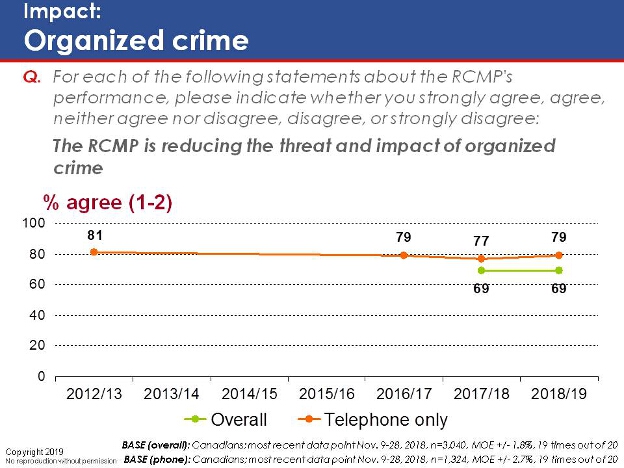
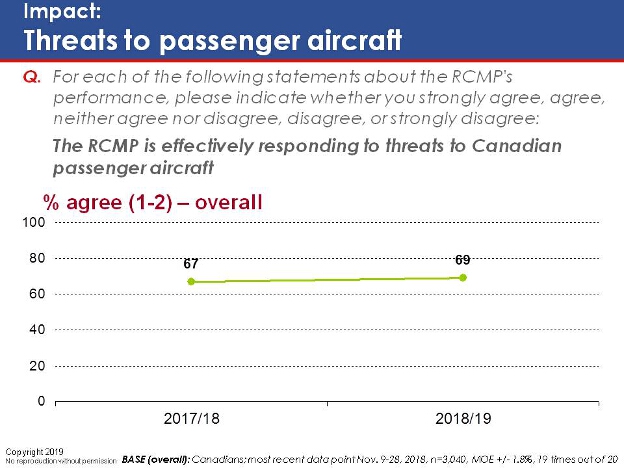
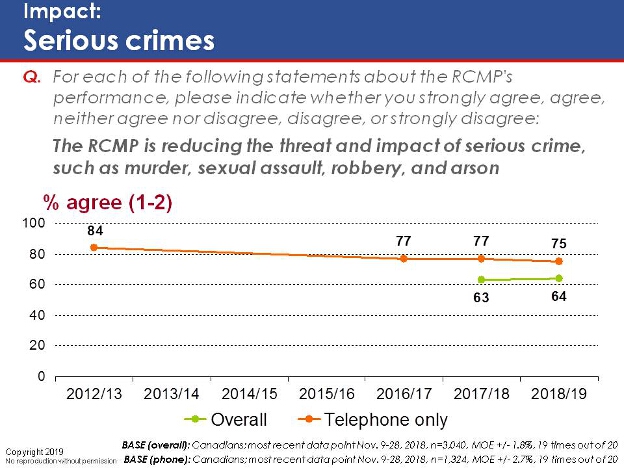
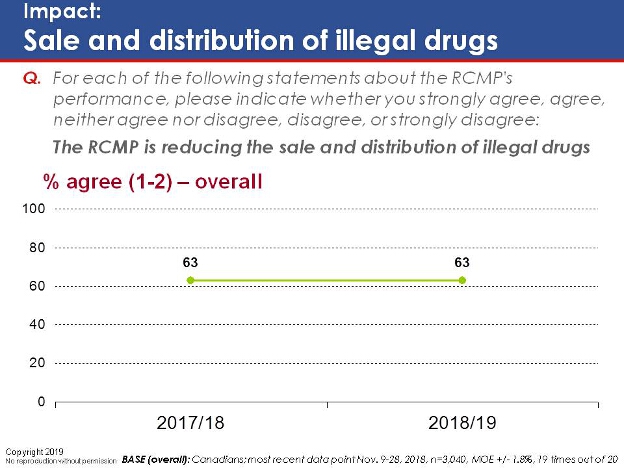
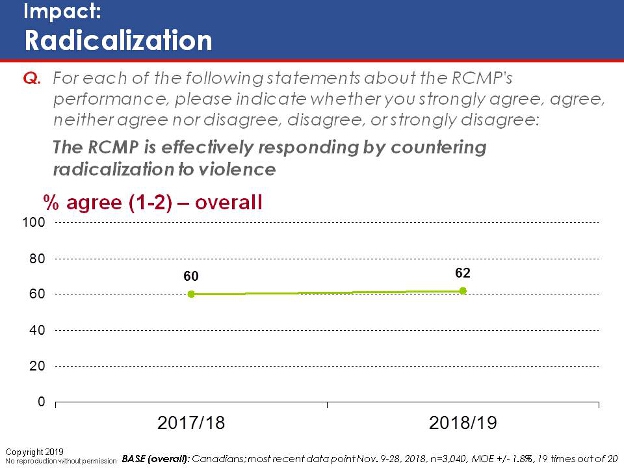
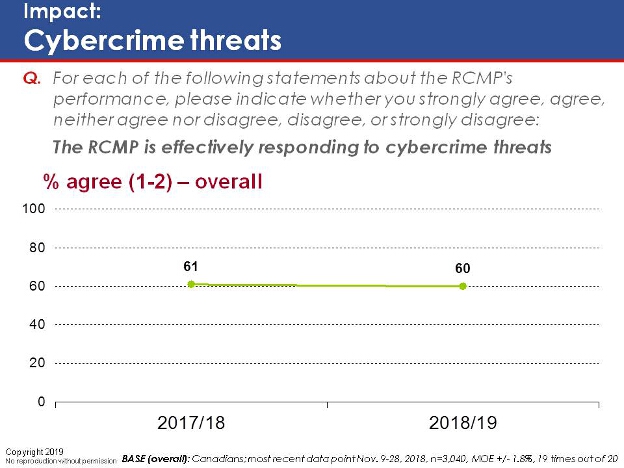
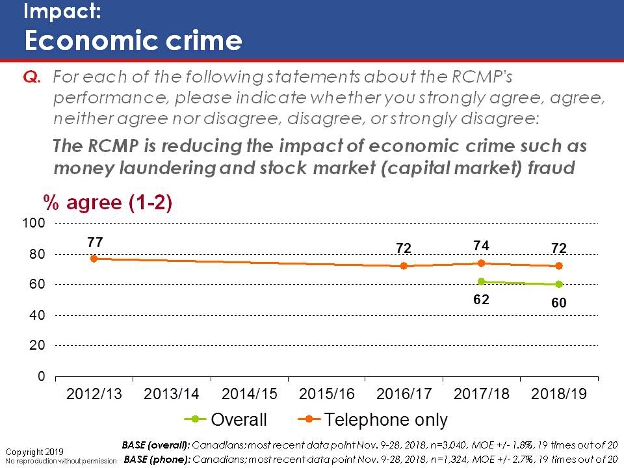
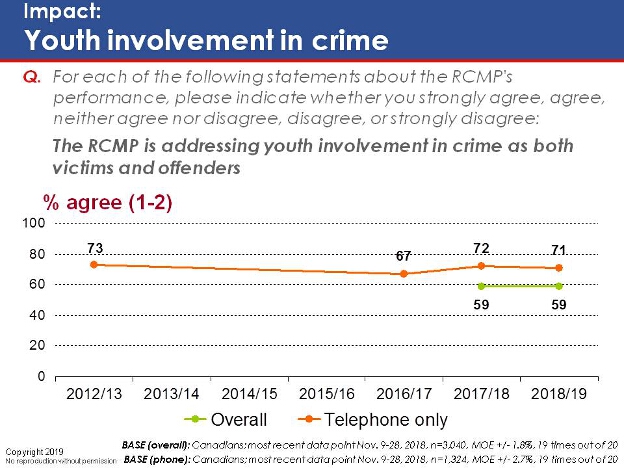
Results also reveal generally positive impressions of the impact of the RCMP on Canadians, although findings also suggest room for improvement in terms of the RCMP's contributions at the community level. Eight in ten (78 per cent) are confident that the RCMP can conduct major crime investigations, while three-quarters (75 per cent) agree that the RCMP effectively responds to national security threats. About seven in ten say the RCMP diminishes the threat of organized crime (69 per cent), effectively handles threats to passenger aircraft (69 per cent), and provides an adequate response to border threats (67 per cent). About six in ten believed the RCMP is effective in mitigating the impact of serious crime (64 per cent), reducing the distribution of illegal drugs (63 per cent), countering radicalization to violence (62 per cent), responding to cybercrime threats (60 per cent), lessening the impact of economic crime (60 per cent), and addressing youth crime (59 per cent). However, just half are satisfied with the RCMP's efforts in fostering safer Indigenous communities (51 per cent) or its contribution to making Canadians more informed and resilient (50 per cent).
Overall results have largely remained stable over the past year. However, longer-term tracking reveals a nine-point erosion in the perceived effectiveness of the RCMP's efforts to combat serious crime since 2012/13.
Those aged 65 and over are consistently more likely to express a positive opinion of the impact of the RCMP's services. For example, 59 per cent agree that the RCMP is effective in safeguarding Indigenous communities, compared to 51 per cent on average.
On most of the indicators tested, those with a high school education are more likely to provide a positive assessment of the RCMP. For example, 61 per cent agree that the RCMP contributes to safer Indigenous communities, compared to 45 per cent on average.
Those who live in Atlantic Canada are more apt to say the RCMP can conduct large-scale investigations and that it makes significant contributions to reducing the sale of illegal drugs, combating youth crime, ensuring the safety of indigenous communities, and fostering an informed and resilient civilian population.
Members of the LGBTQ2S community are consistently less likely to agree with these statements. For instance, just 23 per cent believe the organization is contributing to safer Indigenous communities, compared to 51 per cent on average. Those with disabilities are more likely to say the RCMP is effective in its efforts to combat organized crime (79 per cent, compared to 69 per cent on average), serious crime (75 per cent versus 64 per cent), and radicalization (72 per cent versus 62 per cent).
Impact of the RCMPImpact of the RCMP - Text version
This chart has thirteen horizontal stacked bars showing the overall results Based on a five-point scale where 4-5 means disagree, 3 means neither, and 1-2 means agree.
Respondents were asked: "For each of the following statements about the RCMP's performance, please indicate whether you strongly agree, agree, neither agree nor disagree, disagree, or strongly disagree."
Respondents selected:
"Can successfully conduct/conclude high-profile/major crime investigations": disagree (8 per cent); neither (15 per cent); and agree (78 per cent);
"Is effectively responding to threats to national security": disagree (9 per cent); neither (16 per cent); and agree (75 per cent);
"Is reducing the threat and impact of organized crime": disagree (14 per cent); neither (17 per cent); and agree (69 per cent);
"Is effectively responding to threats to Canadian passenger aircraft": disagree (6 per cent); neither (25 per cent); and agree (69 per cent);
"Is effectively responding to threats at the border between the ports of entry": disagree (13 per cent); neither (19 per cent); and agree (67 per cent);
"Is reducing the threat and impact of serious crime": disagree (14 per cent); neither (22 per cent); and agree (64 per cent);
"Is reducing the sale and distribution of illegal drugs": disagree (18 per cent); neither (19 per cent); and agree (63 per cent);
"Is effectively responding by countering radicalization to violence": disagree (14 per cent); neither (24 per cent); and agree (62 per cent);
"Is effectively responding to cybercrime threats": disagree (17 per cent); neither (23 per cent); and agree (60 per cent);
"Is reducing the impact of economic crime": disagree (19 per cent); neither (21 per cent); and agree (60 per cent);
"Is addressing youth involvement in crime as both victims and offenders": disagree (12 per cent); neither (30 per cent); and agree (59 per cent);
"Is contributing to safer Indigenous communities": disagree (23 per cent); neither (26 per cent); and agree (51 per cent);
"Is contributing to more informed and resilient Canadians": disagree (18 per cent); neither (32 per cent); and agree (50 per cent).
Base (overall): Canadians; November 9-28, 2018, n=3,040, margin of error: +/− 1.8%, 19 times out of 20
Impact: National securityImpact: National security - Text version
This chart is a line graph showing the percentage for the category "Agree (1-2)" by years for the overall and the telephone only results.
Respondents were asked: "For each of the following statements about the RCMP's performance, please indicate whether you strongly agree, agree, neither agree nor disagree, disagree, or strongly disagree: The RCMP is effectively responding to threats to national security."
Respondents selected:
% agree "Overall": 2017/18 (73 per cent); and 2018/19 (75 per cent);
% agree "Telephone only": 2012/13 (88 per cent); 2016/17 (81 per cent); 2017/18 (83 per cent); and 2018/19 (86 per cent).
Base (overall): Canadians; most recent data point November 9-28, 2018, n=3,040, margin of error: +/− 1.8%, 19 times out of 20
Base (phone): Canadians; most recent data point November 9-28, 2018, n=1,324, margin of error: +/− 2.7%, 19 times out of 20
Impact: Organized crimeImpact: Organized crime - Text version
This chart is a line graph showing the percentage for the category "Agree (1-2)" by years for the overall and the telephone only results.
Respondents were asked: "For each of the following statements about the RCMP's performance, please indicate whether you strongly agree, agree, neither agree nor disagree, disagree, or strongly disagree: The RCMP is reducing the threat and impact of organized crime."
Respondents selected:
% agree "Overall": 2017/18 (69 per cent); and 2018/19 (69 per cent);
% agree "Telephone only": 2012/13 (81 per cent); 2016/17 (79 per cent); 2017/18 (77 per cent); and 2018/19 (79 per cent).
Base (overall): Canadians; most recent data point November 9-28, 2018, n=3,040, margin of error: +/− 1.8%, 19 times out of 20
Base (phone): Canadians; most recent data point November 9-28, 2018, n=1,324, margin of error: +/− 2.7%, 19 times out of 20
Impact: Threats to passenger aircraftImpact: Threats to passenger aircraft - Text version
This chart is a line graph showing the percentage for the category "Agree (1-2)" by years for the overall results.
Respondents were asked: "For each of the following statements about the RCMP's performance, please indicate whether you strongly agree, agree, neither agree nor disagree, disagree, or strongly disagree: The RCMP is effectively responding to threats to Canadian passenger aircraft."
Respondents selected:
% agree "Overall": 2017/18 (67 per cent); and 2018/19 (69 per cent).
Base (overall): Canadians; most recent data point November 9-28, 2018, n=3,040, margin of error: +/− 1.8%, 19 times out of 20
Impact: Serious crimesImpact: Serious crimes - Text version
This chart is a line graph showing the percentage for the category "Agree (1-2)" by years for the overall and the telephone only results.
Respondents were asked: "For each of the following statements about the RCMP's performance, please indicate whether you strongly agree, agree, neither agree nor disagree, disagree, or strongly disagree: The RCMP is reducing the threat and impact of serious crime, such as murder, sexual assault, robbery, and arson."
Respondents selected:
% agree "Overall": 2017/18 (63 per cent); and 2018/19 (64 per cent);
% agree "Telephone only": 2012/13 (84 per cent); 2016/17 (77 per cent); 2017/18 (77 per cent); and 2018/19 (75 per cent).
Base (overall): Canadians; most recent data point November 9-28, 2018, n=3,040, margin of error: +/− 1.8%, 19 times out of 20
Base (phone): Canadians; most recent data point November 9-28, 2018, n=1,324, margin of error: +/− 2.7%, 19 times out of 20
Impact: Sale and distribution of illegal drugsImpact: Sale and distribution of illegal drugs - Text version
This chart is a line graph showing the percentage for the category "Agree (1-2)" by years for the overall results.
Respondents were asked: "For each of the following statements about the RCMP's performance, please indicate whether you strongly agree, agree, neither agree nor disagree, disagree, or strongly disagree: The RCMP is reducing the sale and distribution of illegal drugs."
Respondents selected:
% agree "Overall": 2017/18 (63 per cent); and 2018/19 (63 per cent).
Base (overall): Canadians; most recent data point November 9-28, 2018, n=3,040, margin of error: +/− 1.8%, 19 times out of 20
Impact: RadicalizationImpact: Radicalization - Text version
This chart is a line graph showing the percentage for the category "Agree (1-2)" by years for the overall results.
Respondents were asked: "For each of the following statements about the RCMP's performance, please indicate whether you strongly agree, agree, neither agree nor disagree, disagree, or strongly disagree: The RCMP is effectively responding by countering radicalization to violence."
Respondents selected:
% agree "Overall": 2017/18 (60 per cent); and 2018/19 (62 per cent).
Base (overall): Canadians; most recent data point November 9-28, 2018, n=3,040, margin of error: +/− 1.8%, 19 times out of 20
Impact: Cybercrime threatsImpact: Cybercrime threats - Text version
This chart is a line graph showing the percentage for the category "Agree (1-2)" by years for the overall results.
Respondents were asked: "For each of the following statements about the RCMP's performance, please indicate whether you strongly agree, agree, neither agree nor disagree, disagree, or strongly disagree: The RCMP is effectively responding to cybercrime threats."
Respondents selected:
% agree "Overall": 2017/18 (61 per cent); and 2018/19 (60 per cent).
Base (overall): Canadians; most recent data point November 9-28, 2018, n=3,040, margin of error: +/− 1.8%, 19 times out of 20
Impact: Economic crimeImpact: Economic crime - Text version
This chart is a line graph showing the percentage for the category "Agree (1-2)" by years for the overall and the telephone only results.
Respondents were asked: "For each of the following statements about the RCMP's performance, please indicate whether you strongly agree, agree, neither agree nor disagree, disagree, or strongly disagree: The RCMP is reducing the impact of economic crime such as money laundering and stock market (capital market) fraud."
Respondents selected:
% agree "Overall": 2017/18 (62 per cent); and 2018/19 (60 per cent);
% agree "Telephone only": 2012/13 (77 per cent); 2016/17 (72 per cent); 2017/18 (74 per cent); and 2018/19 (72 per cent).
Base (overall): Canadians; most recent data point November 9-28, 2018, n=3,040, margin of error: +/− 1.8%, 19 times out of 20
Base (phone): Canadians; most recent data point November 9-28, 2018, n=1,324, margin of error: +/− 2.7%, 19 times out of 20
Impact: Youth involvement in crimeImpact: Youth involvement in crime - Text version
This chart is a line graph showing the percentage for the category "Agree (1-2)" by years for the overall and the telephone only results.
Respondents were asked: "For each of the following statements about the RCMP's performance, please indicate whether you strongly agree, agree, neither agree nor disagree, disagree, or strongly disagree: The RCMP is addressing youth involvement in crime as both victims and offenders."
Respondents selected:
% agree "Overall": 2017/18 (59 per cent); and 2018/19 (59 per cent);
% agree "Telephone only": 2012/13 (73 per cent); 2016/17 (67 per cent); 2017/18 (72 per cent); and 2018/19 (71 per cent).
Base (overall): Canadians; most recent data point November 9-28, 2018, n=3,040, margin of error: +/− 1.8%, 19 times out of 20
Base (phone): Canadians; most recent data point November 9-28, 2018, n=1,324, margin of error: +/− 2.7%, 19 times out of 20
Impact: Safety of Indigenous communititesImpact: Safety of Indigenous communitites - Text version
This chart is a line graph showing the percentage for the category "Agree (1-2)" by years for the overall and the telephone only results.
Respondents were asked: "For each of the following statements about the RCMP's performance, please indicate whether you strongly agree, agree, neither agree nor disagree, disagree, or strongly disagree: The RCMP is contributing to safer Indigenous communities."
Respondents selected:
% agree "Overall": 2017/18 (49 per cent); and 2018/19 (51 per cent);
% agree "Telephone only": 2012/13 (66 per cent); 2016/17 (54 per cent); 2017/18 (65 per cent); and 2018/19 (66 per cent).
Base (overall): Canadians; most recent data point November 9-28, 2018, n=3,040, margin of error: +/− 1.8%, 19 times out of 20
Base (phone): Canadians; most recent data point November 9-28, 2018, n=1,324, margin of error: +/− 2.7%, 19 times out of 20
Impact: Resilience of CanadiansImpact: Resilience of Canadians - Text version
This chart is a line graph showing the percentage for the category "Agree (1-2)" by years for the overall results.
Respondents were asked: "For each of the following statements about the RCMP's performance, please indicate whether you strongly agree, agree, neither agree nor disagree, disagree, or strongly disagree: Is contributing to more informed and resilient Canadians."
Respondents selected:
% agree "Overall": 2017/18 (52 per cent); and 2018/19 (50 per cent).
Base (overall): Canadians; most recent data point November 9-28, 2018, n=3,040, margin of error: +/− 1.8%, 19 times out of 20
2.13 Awareness of RCMP's International Activities
Results suggest broad awareness of the RCMP's international undertakings. Seven in ten (70 per cent) say they are aware that the RCMP participates in activities such as peacekeeping and training foreign police, and only one in six (17 per cent) said they were not aware that the RCMP engages in these activities. These results are consistent with those found in 2016/17.
Awareness of the RCMP's international engagements rises progressively with age (from 57 per cent among those under the age of 35 to 84 per cent of those ages 65 and over) and declines with educational attainment (from 76 per cent among high school educated to 65 per cent among university graduates).
Awareness is higher in Atlantic Canada (79 per cent, compared to 70 per cent on average).
LGBTQ2S respondents and those with a disability are less familiar with these activities (54 per cent in each case, compared to 70 per cent on average).
Awareness of RCMP's international activitiesAwareness of RCMP's international activities - Text version
This chart has one horizontal stacked bar showing the overall results Based on a five-point scale where 4-5 means disagree, 3 means neither, and 1-2 means agree. Below is a line graph showing the percentage for the category "agree (1-2)" by years for the overall and the telephone only results.
Respondents were asked: "For each of the following statements about the RCMP's performance, please indicate whether you strongly agree, agree, neither agree nor disagree, disagree, or strongly disagree: I am aware that the RCMP participates in a variety of international activities, such as peacekeeping missions and offering training to foreign police."
Respondents selected:
"Overall": Disagree (17 per cent); neither (14 per cent); and agree (70 per cent);
% agree "Overall": 2017/18 (71 per cent); and 2018/19 (70 per cent);
% agree "Telephone only": 2016/17 (73 per cent); 2017/18 (77 per cent); and 2018/19 (75 per cent).
Base (overall): Canadians; most recent data point November 9-28, 2018, n=3,040, margin of error: +/− 1.8%, 19 times out of 20
Base (phone): Canadians; most recent data point November 9-28, 2018, n=1,324, margin of error: +/− 2.7%, 19 times out of 20
3. Primary Sources of Information About RCMP
3.1 Primary Sources of Information About RCMP
Turning to communication with the RCMP, respondents were asked to what degree each of a range of sources provided them with credible information about the RCMP and its performance in their community. Forty-five per cent selected the news media as their credible source to obtain information about the RCMP, while about four in ten (36 per cent) selected their own personal experience as a source to obtain credible information. Three in ten (30 per cent) see their friends and family as a reliable source, while just one in five (19 per cent) turn to social media to obtain accurate information about the RCMP.
Tracking overall results reveals that the perceived credibility of these sources have remained stable over the past few years.
Personal experience is seen as the most common source to obtain credible information about the RCMP by residents of the North (51 per cent). Those in Central Canada are consistently less likely to say these sources provide them with useful information.
Those ages 18-34 are more likely to turn to friends and family (40 per cent, compared to 30 per cent on average) and social media (34 per cent versus 19 per cent) to obtain credible information about the RCMP.
Primary sources of information about RCMPPrimary sources of information about RCMP - Text version
This chart has four horizontal stacked bars showing the overall results (unweighted) Based on a scale showing: don't know/no response, not at all, very little, somewhat, quite a bit, and a great deal.
Respondents were asked: "To what degree do each of the following provide you with credible information about the RCMP and its performance in your community."
Respondents selected:
"The news media": don't know/no response (3 per cent); not at all (5 per cent); very little (11 per cent); somewhat (35 per cent); quite a bit (29 per cent); and a great deal (16 per cent);
"Personal experience": don't know/no response (4 per cent); not at all (14 per cent); very little (17 per cent); somewhat (28 per cent); quite a bit (17 per cent); and a great deal (19 per cent);
"Friends and family": don't know/no response (4 per cent); not at all (17 per cent); very little (17 per cent); somewhat (32 per cent); quite a bit (17 per cent); and a great deal (13 per cent);
"Web and social media like Facebook, Twitter, etc.": don't know/no response (13 per cent); not at all (27 per cent); very little (20 per cent); somewhat (21 per cent); quite a bit (11 per cent); and a great deal (8 per cent).
Base (overall): Canadians; November 9-28, 2018, n=3,040, margin of error: +/− 1.8%, 19 times out of 20
Sources of information: News mediaSources of information: News media - Text version
This chart is a line graph showing the percentage for the category "A great deal/quite a lot" by years for the overall (unweighted) and the telephone only (unweighted) results.
Respondents were asked: "To what degree do each of the following provide you with credible information about the RCMP and its performance in your community? The news media."
Respondents selected:
% a great deal/quite a lot "Overall": 2017/18 (45 per cent); and 2018/19 (46 per cent);
% a great deal/quite a lot "Telephone only": 2016/17 (45 per cent); 2017/18 (42 per cent); and 2018/19 (44 per cent).
Base (overall): Canadians; most recent data point November 9-28, 2018, n=3,040, margin of error: +/− 1.8%, 19 times out of 20
Base (phone): Canadians; most recent data point November 9-28, 2018, n=1,324, margin of error: +/− 2.7%, 19 times out of 20
Sources of information: Personal experienceSources of information: Personal experience - Text version
This chart is a line graph showing the percentage for the category "A great deal/quite a lot" by years for the overall (unweighted) and the telephone only (unweighted) results.
Respondents were asked: "To what degree do each of the following provide you with credible information about the RCMP and its performance in your community? Personal experience."
Respondents selected:
% a great deal/quite a lot "Overall": 2017/18 (35 per cent); and 2018/19 (37 per cent);
% a great deal/quite a lot "Telephone only": 2016/17 (36 per cent); 2017/18 (39 per cent); and 2018/19 (39 per cent).
Base (overall): Canadians; most recent data point November 9-28, 2018, n=3,040, margin of error: +/− 1.8%, 19 times out of 20
Base (phone): Canadians; most recent data point November 9-28, 2018, n=1,324, margin of error: +/− 2.7%, 19 times out of 20
Sources of information: Friends and familySources of information: Friends and family - Text version
This chart is a line graph showing the percentage for the category "A great deal/quite a lot" by years for the overall (unweighted) and the telephone only (unweighted) results.
Respondents were asked: "To what degree do each of the following provide you with credible information about the RCMP and its performance in your community? Friends and family."
Respondents selected:
% a great deal/quite a lot "Overall": 2017/18 (30 per cent); and 2018/19 (29 per cent);
% a great deal/quite a lot "Telephone only": 2016/17 (29 per cent); 2017/18 (32 per cent); and 2018/19 (30 per cent).
Base (overall): Canadians; most recent data point November 9-28, 2018, n=3,040, margin of error: +/− 1.8%, 19 times out of 20
Base (phone): Canadians; most recent data point November 9-28, 2018, n=1,324, margin of error: +/− 2.7%, 19 times out of 20
Sources of information: Web and social mediaSources of information: Web and social media - Text version
This chart is a line graph showing the percentage for the category "A great deal/quite a lot" by years for the overall (unweighted) and the telephone only (unweighted) results.
Respondents were asked: "To what degree do each of the following provide you with credible information about the RCMP and its performance in your community? Web and social media like Facebook, Twitter, etc."
Respondents selected:
% a great deal/quite a lot "Overall": 2017/18 (17 per cent); and 2018/19 (18 per cent);
% a great deal/quite a lot "Telephone only": 2016/17 (17 per cent); 2017/18 (18 per cent); and 2018/19 (19 per cent).
Base (overall): Canadians; most recent data point November 9-28, 2018, n=3,040, margin of error: +/− 1.8%, 19 times out of 20
Base (phone): Canadians; most recent data point November 9-28, 2018, n=1,324, margin of error: +/− 2.7%, 19 times out of 20
3.2 Social Media Following
Results suggest that just one in eight Canadians (13 per cent) follow the RCMP on social media outlets such as Facebook or Twitter, while 86 per cent do not.
The likelihood of following the RCMP declines with age (from 21 per cent among those ages 18-34 to six per cent among those ages 65 and over).
Social media followingSocial media following - Text version
The chart is a pie representing the overall results (unweighted) and is divided into three slices: yes, no and don't know/no response.
Respondents were asked: "Do you follow the RCMP on social media, i.e., Facebook, Twitter?"
Respondents selected:
"Yes" (13 per cent);
"No" (86 per cent); and
Don't know/no response (1 per cent).
Base (overall): Canadians; most recent data point November 9-28, 2018, n=3,040, margin of error: +/− 1.8%, 19 times out of 20
4. Contact with the RCMP
4.1 Incidence of Contact with the RCMP
Respondents were asked if they have had any direct contact with the RCMP in the past year. One-third (33 per cent) indicated yes, while the majority (66 per cent) said no.
Tracking reveals that these results have remained largely stable over the past few years.
Regionally, residents of British Columbia residents (42 per cent) are more likely to have dealt with the RCMP, while those in Central Canada are far less likely to report contact (10 per cent).
Indigenous respondents are more likely to have had direct contact with the RCMP (49 per cent, compared to 33 per cent on average).
Incidence of contact with the RCMPIncidence of contact with the RCMP - Text version
This chart has one horizontal stacked bar showing the overall results (unweighted) for don’t know/no response; no and yes. Below is a line graph showing the percentage for the category "yes" by years for the overall and the telephone only results.
Respondents were asked: "In the past year, did you have any direct contact with the RCMP, such as reporting a crime, being stopped for a traffic offence or accident, seeking information, or any other reason?"
Respondents selected:
"Overall": Don’t know/no response (1 per cent); no (66 per cent); and yes (33 per cent);
% yes "Overall": 2017/18 (34 per cent); and 2018/19 (33 per cent);
% yes "Telephone only": 2016/17 (33 per cent); 2017/18 (38 per cent); and 2018/19 (36 per cent).
Base (overall): Canadians; most recent data point November 9-28, 2018, n=3,040, margin of error: +/− 1.8%, 19 times out of 20
Base (phone): Canadians; most recent data point November 9-28, 2018, n=1,324, margin of error: +/− 2.7%, 19 times out of 20
4.2 Nature of Contact with RCMP
Those who indicated they have had contact with the RCMP in the past year were asked the reason for their most recent contact. Responses varied, with one in five indicating their contact involved a traffic offence or an accident (20 per cent) or a criminal matter (18 per cent). One in ten said the contact involved a complaint (11 per cent) or a crime prevention activity (11 per cent.)
Tracking reveals an increase among those who contacted the RCMP for a criminal matter, and a decrease among those who contacted the RCMP for a traffic offence or accident since 2016/17.
Nature of contact with RCMPNature of contact with RCMP - Text version
This chart has five double horizontal bars with a bar representing 2018/19 and a bar representing 2017/18 for overall results (unweighted).
Respondents were asked: "[If Yes] What was the reason for your most recent contact with the RCMP?"
"For a traffic offence or an accident": In 2018/19 (20 per cent); 2017/18 (20 per cent);
"For a criminal matter": In 2018/19 (18 per cent); 2017/18 (16 per cent);
"For a complaint": In 2018/19 (11 per cent); 2017/18 (11 per cent);
"For a crime prevention activity": In 2018/19 (11 per cent); 2017/18 (12 per cent);
"For another reason": In 2018/19 (38 per cent); 2017/18 (40 per cent).
Base (overall): Had contact with the RCMP; November 9-28, 2018, n=999, margin of error: +/− 3.1%, 19 times out of 20
Tracking nature of contact with RCMPTracking nature of contact with RCMP - Text version
This chart has six triple horizontal bars with a bar representing 2016/2017, a bar representing 2017/18 and a bar representing 2018/19 for telephone only results (unweighted).
Respondents were asked: "[IF YES] What was the reason for your most recent contact with the RCMP?"
"For a criminal matter": In 2018/19 (20 per cent); 2017/18 (16 per cent); 2016/17 (16 per cent);
"For a traffic offence or an accident": In 2018/19 (16 per cent); 2017/18 (17 per cent); 2016/17 (25 per cent);
"For a crime prevention activity": In 2018/19 (12 per cent); 2017/18 (13 per cent); 2016/17 (13 per cent);
"For a complaint": In 2018/19 (10 per cent); 2017/18 (12 per cent); 2016/17 (10 per cent);
"For another reason": In 2018/19 (39 per cent); 2017/18 (43 per cent); 2016/17 (34 per cent);
"Don't know/No response": In 2018/19 (1 per cent); 2017/18 (0 per cent). 2016/17 (2 per cent);
Base (overall): Had contact with the RCMP; most recent data point November 9-28, 2018, n=999, margin of error: +/− 3.1%, 19 times out of 20
4.3 Origin of Contact with the RCMP
Those who indicated they had contact with the RCMP in the past year were also asked if they initiated the contact. Most (63 per cent) indicate that they did initiate the contact, while about one in three (36 per cent) did not.
Tracking reveals that the proportion who initiated contact with the RCMP has increased 9 points since 2016/2017.
Origin of Contact with the RCMPOrigin of Contact with the RCMP - Text version
This chart has one horizontal stacked bar showing the overall results (unweighted) for don't know/no response; no and yes. Below is a line graph showing the percentage for the category "yes" by years for the overall (unweighted) and the telephone only (unweighted) results.
Respondents were asked: "Still thinking of the most recent contact, did you initiate the contact with the RCMP yourself?"
Respondents selected:
"Overall": Don't know/no response (1 per cent); no (36 per cent); and yes (63 per cent);
% yes "Overall": 2017/18 (64 per cent); and 2018/19 (63 per cent);
% yes "Telephone only": 2016/17 (57 per cent); 2017/18 (68 per cent); and 2018/19 (66 per cent).
Base (overall): Had contact with the RCMP; most recent data point November 9-28, 2018, n=999, margin of error: +/− 3.1%, 19 times out of 20
Base (phone): Had contact with the RCMP; most recent data point November 9-28, 2018, n=479, margin of error: +/− 4.5%, 19 times out of 20
4.4 Views on contact with RCMP
Those who indicated they had contact with the RCMP in the past year were then asked for their views on RCMP performance during this contact. Results are generally positive with more than eight in ten agreeing that RCMP personnel were courteous and respectful (87 per cent), demonstrated professionalism (86 per cent), treated them fairly (85 per cent), and that it was easy to get in touch with the RCMP (82 per cent). Similarly, more than seven in ten feel that RCMP personnel were knowledgeable and competent (79 per cent), provided all the information needed (73 per cent), and delivered the service in a timely fashion (73 per cent). Results are more mixed in terms of the RCMP going beyond minimum requirements in providing good service: 58 per cent feel the RCMP went beyond minimum service requirements, and 20 per cent disagreed with this idea.
Tracking reveals that these results have remained largely stable over the past few years, although ease of contact with the RCMP is down 7 points since 2012/13.
Views on contact with RCMPViews on contact with RCMP - Text version
This chart has eight horizontal stacked bars showing the overall results (unweighted) Based on a scale showing: don't know/no response; disagree (4-5), neither (3), and agree (1-2).
Respondents were asked: "Regarding your contact(s) with the RCMP in the last year, please indicate whether you strongly agree, agree, neither agree nor disagree, disagree or strongly disagree with each of the following statements about the RCMP's performance."
Respondents selected:
"RCMP personnel were courteous and respectful": don't know/no response (0 per cent); disagree (6 per cent), neither (6 per cent); and agree (87 per cent);
"RCMP personnel demonstrated professionalism": don't know/no response (0 per cent); disagree (8 per cent), neither (5 per cent); and agree (86 per cent);
"RCMP personnel treated me fairly": don't know/no response (0 per cent); disagree (7 per cent), neither (7 per cent); and agree (85 per cent);
"It was easy to get in touch with the RCMP*": don't know/no response (0 per cent); disagree (12 per cent), neither (5 per cent); and agree (82 per cent);
"RCMP personnel were knowledgeable and competent": don't know/no response (1 per cent); disagree (10 per cent), neither (9 per cent); and agree (79 per cent);
"RCMP personnel gave me all the information that I needed for the situation": don't know/no response (1 per cent); disagree (14 per cent), neither (9 per cent); and agree (73 per cent);
"RCMP personnel delivered the service in a timely fashion": don't know/no response (2 per cent); disagree (14 per cent), neither (8 per cent); and agree (73 per cent);
"RCMP personnel went beyond minimum requirements in providing good service": don't know/no response (3 per cent); disagree (20 per cent), neither (17 per cent); and agree (58 per cent).
*Asked only of those who initiated contact with the RCMP (n=626, margin of error: +/− 3.9%, 19 times out of 20)
Base (overall): Had contact with the RCMP; November 9-28, 2018, n=999, margin of error: +/− 3.1%, 19 times out of 20
Views on contact with RCMP: Courteousness and respectfulnessViews on contact with RCMP: Courteousness and respectfulness - Text version
This chart is a line graph showing the percentage for the category "Agree (1-2)" by years for the overall (unweighted) and telephone only (unweighted) results.
Respondents were asked: "Regarding your contact(s) with the RCMP in the last year, please indicate whether you strongly agree, agree, neither agree nor disagree, disagree or strongly disagree with each of the following statements about the RCMP's performance: RCMP personnel were courteous and respectful."
Respondents selected:
% agree "Overall": 2017/18 (85 per cent); and 2018/19 (87 per cent).
% agree "Telephone only": 2012/13 (88 per cent); 2016/17 (89 per cent); 2017/18 (90 per cent); and 2018/19 (92 per cent).
Base (overall): Had contact with the RCMP; most recent data point November 9-28, 2018, n=999, margin of error: +/− 3.1%, 19 times out of 20
Base (phone): Had contact with the RCMP; most recent data point November 9-28, 2018, n=479, margin of error: +/− 4.5%, 19 times out of 20
Views on contact with RCMP: ProfessionalismViews on contact with RCMP: Professionalism - Text version
This chart is a line graph showing the percentage for the category "Agree (1-2)" by years for the overall (unweighted) and telephone only (unweighted) results.
Respondents were asked: "Regarding your contact(s) with the RCMP in the last year, please indicate whether you strongly agree, agree, neither agree nor disagree, disagree or strongly disagree with each of the following statements about the RCMP's performance: RCMP personnel demonstrated professionalism."
Respondents selected:
% agree "Overall": 2017/18 (86 per cent); and 2018/19 (86 per cent).
% agree "Telephone only": 2012/13 (91 per cent); 2016/17 (90 per cent); 2017/18 (90 per cent); and 2018/19 (91 per cent).
Base (overall): Had contact with the RCMP; most recent data point November 9-28, 2018, n=999, margin of error: +/− 3.1%, 19 times out of 20
Base (phone): Had contact with the RCMP; most recent data point November 9-28, 2018, n=479, margin of error: +/− 4.5%, 19 times out of 20
Views on contact with RCMP: FairnessViews on contact with RCMP: Fairness - Text version
This chart is a line graph showing the percentage for the category "Agree (1-2)" by years for the overall (unweighted) and telephone only (unweighted) results.
Respondents were asked: "Regarding your contact(s) with the RCMP in the last year, please indicate whether you strongly agree, agree, neither agree nor disagree, disagree or strongly disagree with each of the following statements about the RCMP's performance: RCMP personnel treated me fairly."
Respondents selected:
% agree "Overall": 2017/18 (86 per cent); and 2018/19 (85 per cent).
% agree "Telephone only": 2012/13 (88 per cent); 2016/17 (89 per cent); 2017/18 (91 per cent); and 2018/19 (91 per cent).
Base (overall): Had contact with the RCMP; most recent data point November 9-28, 2018, n=999, margin of error: +/− 3.1%, 19 times out of 20
Base (phone): Had contact with the RCMP; most recent data point November 9-28, 2018, n=479, margin of error: +/− 4.5%, 19 times out of 20
Views on contact with RCMP: Ease of contactViews on contact with RCMP: Ease of contact - Text version
This chart is a line graph showing the percentage for the category "Agree (1-2)" by years for the overall (unweighted) and telephone only (unweighted) results.
Respondents were asked: "Regarding your contact(s) with the RCMP in the last year, please indicate whether you strongly agree, agree, neither agree nor disagree, disagree or strongly disagree with each of the following statements about the RCMP's performance: It was easy to get in touch with the RCMP."
Respondents selected:
% agree "Overall": 2017/18 (83 per cent); and 2018/19 (82 per cent).
% agree "Telephone only": 2012/13 (92 per cent); 2016/17 (92 per cent); 2017/18 (89 per cent); and 2018/19 (85 per cent).
Base (overall): Had contact with the RCMP; most recent data point November 9-28, 2018, n=999, margin of error: +/− 3.1%, 19 times out of 20
Base (phone): Had contact with the RCMP; most recent data point November 9-28, 2018, n=479, margin of error: +/− 4.5%, 19 times out of 20
Views on contact with RCMP: Knowledge and competenceViews on contact with RCMP: Knowledge and competence - Text version
This chart is a line graph showing the percentage for the category "Agree (1-2)" by years for the overall (unweighted) and telephone only (unweighted) results.
Respondents were asked: "Regarding your contact(s) with the RCMP in the last year, please indicate whether you strongly agree, agree, neither agree nor disagree, disagree or strongly disagree with each of the following statements about the RCMP's performance: RCMP personnel were knowledgeable and competent."
Respondents selected:
% agree "Overall": 2017/18 (78 per cent); and 2018/19 (79 per cent).
% agree "Telephone only": 2012/13 (86 per cent); 2016/17 (83 per cent); 2017/18 (85 per cent); and 2018/19 (87 per cent).
Base (overall): Had contact with the RCMP; most recent data point November 9-28, 2018, n=999, margin of error: +/− 3.1%, 19 times out of 20
Base (phone): Had contact with the RCMP; most recent data point November 9-28, 2018, n=479, margin of error: +/− 4.5%, 19 times out of 20
Views on contact with RCMP: Usefulness of contactViews on contact with RCMP: Usefulness of contact - Text version
This chart is a line graph showing the percentage for the category "Agree (1-2)" by years for the overall (unweighted) and telephone only (unweighted) results.
Respondents were asked: "Regarding your contact(s) with the RCMP in the last year, please indicate whether you strongly agree, agree, neither agree nor disagree, disagree or strongly disagree with each of the following statements about the RCMP's performance: RCMP personnel gave me all the information that I needed for the situation."
Respondents selected:
% agree "Overall": 2017/18 (72 per cent); and 2018/19 (73 per cent).
% agree "Telephone only": 2012/13 (79 per cent); 2016/17 (80 per cent); 2017/18 (81 per cent); and 2018/19 (80 per cent).
Base (overall): Had contact with the RCMP; most recent data point November 9-28, 2018, n=999, margin of error: +/− 3.1%, 19 times out of 20
Base (phone): Had contact with the RCMP; most recent data point November 9-28, 2018, n=479, margin of error: +/− 4.5%, 19 times out of 20
Views on contact with RCMP: TimelinessViews on contact with RCMP: Timeliness - Text version
This chart is a line graph showing the percentage for the category "Agree (1-2)" by years for the overall (unweighted) and telephone only (unweighted) results.
Respondents were asked: "Regarding your contact(s) with the RCMP in the last year, please indicate whether you strongly agree, agree, neither agree nor disagree, disagree or strongly disagree with each of the following statements about the RCMP's performance: RCMP personnel delivered the service in a timely fashion."
Respondents selected:
% agree "Overall": 2017/18 (73 per cent); and 2018/19 (73 per cent).
% agree "Telephone only": 2012/13 (85 per cent); 2016/17 (82 per cent); 2017/18 (81 per cent); and 2018/19 (81 per cent).
Base (overall): Had contact with the RCMP; most recent data point November 9-28, 2018, n=999, margin of error: +/− 3.1%, 19 times out of 20
Base (phone): Had contact with the RCMP; most recent data point November 9-28, 2018, n=479, margin of error: +/− 4.5%, 19 times out of 20
Views on contact with RCMP: Initiative of personnelViews on contact with RCMP: Initiative of personnel - Text version
This chart is a line graph showing the percentage for the category "Agree (1-2)" by years for the overall (unweighted) and telephone only (unweighted) results.
Respondents were asked: "Regarding your contact(s) with the RCMP in the last year, please indicate whether you strongly agree, agree, neither agree nor disagree, disagree or strongly disagree with each of the following statements about the RCMP's performance: RCMP personnel went beyond minimum requirements in providing good service."
Respondents selected:
% agree "Overall": 2017/18 (58 per cent); and 2018/19 (58 per cent).
% agree "Telephone only": 2012/13 (67 per cent); 2016/17 (62 per cent); 2017/18 (69 per cent); and 2018/19 (68 per cent).
Base (overall): Had contact with the RCMP; most recent data point November 9-28, 2018, n=999, margin of error: +/− 3.1%, 19 times out of 20
Base (phone): Had contact with the RCMP; most recent data point November 9-28, 2018, n=479, margin of error: +/− 4.5%, 19 times out of 20
4.5 Satisfaction with Contact with RCMP
Those who indicated they had contact with the RCMP in the past year were also asked to rate their overall satisfaction with the service received from the RCMP. Three in four (74 per cent) expressed satisfaction, and only 15 per cent are dissatisfied.
Tracking suggests that satisfaction has increased 6 points since 2016/17.
Satisfaction with contactSatisfaction with contact - Text version
This chart has one horizontal stacked bar showing the overall results (unweighted) for don't know/no response; dissatisfied (4-5); neither (3); and satisfied (1-2). Below is a line graph showing the percentage for the category "yes" by years for the overall (unweighted) and the telephone only (unweighted) results.
Respondents were asked: "How satisfied were you with the service you received during your contact(s) with the RCMP?"
Respondents selected:
"Overall": Don't know/no response (1 per cent); dissatisfied (15 per cent); neither (9 per cent); and satisfied (74 per cent);
% yes "Overall": 2017/18 (75 per cent); and 2018/19 (74 per cent);
% yes "Telephone only": 2016/17 (76 per cent); 2017/18 (80 per cent); and 2018/19 (82 per cent).
Base (overall): Had contact with the RCMP; most recent data point November 9-28, 2018, n=999, margin of error: +/− 3.1%, 19 times out of 20
Base (phone): Had contact with the RCMP; most recent data point November 9-28, 2018, n=479, margin of error: +/− 4.5%, 19 times out of 20
5. Unreported Crimes
5.1 Incidence of not Reporting a Crime
Survey results reveal that one in eight Canadians (13 per cent) have, at some point, decided to not report a crime to the RCMP.
Tracking overall results suggest that the incidence of unreported crimes is largely unchanged over the past year.
Given that the RCMP is not their primary police force in their region, it is not surprising that those in Central Canada are the least likely to indicate they failed to report a crime to the RCMP (four per cent, compared to 13 per cent nationally).
Indigenous respondents and members of the LGBTQ2S community are more likely to say they allowed a crime to go unreported (24 per cent and 23 per cent, respectively, compared to 13 per cent on average).
Incidence of not reporting a crimeIncidence of not reporting a crime - Text version
This chart has two horizontal stacked bars showing the overall results (unweighted) for don't know/no response, no, and yes for the years 2018/2019 and 2017/2018.
Respondents were asked: "Have you ever decided to not report a crime to the RCMP?"
% "Overall 2018/2019": DK/NR (4 per cent); no (83 per cent); and yes (13 per cent)
Base: Canadians; November 9-28, 2018, n=3,040, margin of error: +/− 2.7%, 19 times out of 20
% "Overall 2017/2018": DK/NR (3 per cent); no (84 per cent); and yes (12 per cent).
Base: Canadians; January 18-February 8, 2018, n=3,033, margin of error: +/− 1.8%, 19 times out of 20
5.2 Reasons for not Reporting a Crime
Among those who did not report a crime, the main reason is a belief that the police would or could not help them (49 per cent), followed distantly by a belief that the crime was not important enough to report (18 per cent).
Tracking overall results reveals a 16-point increase in the proportion of respondents who attribute their reluctance to report a crime to a belief that the police could not help.
Reasons for not reporting a crimeReasons for not reporting a crime - Text version
This chart has five double horizontal bars with a bar representing 2017/18 and a bar representing 2018/19 for overall results (unweighted).
Respondents were asked: "[IF YES] What was the main reason?"
"Police would or could not help": In 2018/19 (49 per cent); 2017/18 (33 per cent);
"Not important enough to report": In 2018/19 (18 per cent); 2017/18 (24 per cent);
"Dealt with in another way/personal matter": In 2018/19 (9 per cent); 2017/18 (13 per cent);
"Fear of reprisal": In 2018/19 (11 per cent); 2017/18 (11 per cent);
"Other": In 2018/19 (13 per cent); 2017/18 (19 per cent).
Base (overall): Chose not to report a crime; most recent data point November 9-28, 2018, n=407, margin of error: +/− 4.9%, 19 times out of 20
5.3 Nature of Crime not Reported
Results also reveal that half of these respondents feel the unreported crime was a minor offence (48 per cent), although four in ten indicated it was a serious personal (22 per cent) or serious property (17 per cent) offence.
Tracking overall results suggests that these findings have remained largely unchanged over the past year.
Women are more apt to describe their unreported crime as a serious personal offence (30 per cent, compared to 16 per cent of men).
Nature of crime not reportedNature of crime not reported - Text version
This chart has four double horizontal bars with a bar representing 2018/19 and a bar representing 2017/18 for overall results (unweighted).
Respondents were asked: "[IF YES] What type of crime was it?"
"Serious personal": In 2018/19 (22 per cent); 2017/18 (20 per cent);
"Serious property": In 2018/19 (17 per cent); 2017/18 (15 per cent);
"Minor offence": In 2018/19 (48 per cent); 2017/18 (51 per cent);
"Don't know/No response": In 2018/19 (13 per cent); 2017/18 (13 per cent).
Base (overall): Chose not to report a crime; most recent data point November 9-28, 2018, n=407, margin of error: +/− 4.9%, 19 times out of 20
Appendix A: Questionnaire
Introduction
We are conducting a study on behalf of the Royal Canadian Mounted Police (RCMP) to determine satisfaction with specific aspects of the RCMP's performance. Please be assured that we are not selling or soliciting anything. The survey is voluntary and your responses will be kept entirely confidential and anonymous.
The survey should take about 15 minutes to complete.
You can call the RCMP contact, Dr. James Lea, at 613-843-6143 to verify that the survey is legitimate.
Q1
How important is the RCMP's contribution to keeping Canadians safe?
Very important: 1
Somewhat important: 2
Neither important nor unimportant: 3
Somewhat unimportant: 4
Not at all important: 5
Don't know: 99 X
Q2
How satisfied are you with the RCMP's contribution to keeping Canadians safe?
Very satisfied: 1
Somewhat satisfied: 2
Neither satisfied nor dissatisfied: 3
Somewhat dissatisfied: 4
Very dissatisfied: 5
Don't know: 99 X
Q3
I feel safer because of the RCMP.
Strongly agree: 1
Agree: 2
Neither agree nor disagree: 3
Disagree: 4
Strongly disagree: 5
Don't know: 99 X
Q4
Is the RCMP your local policing service?
Yes: 1
No: 2
Partially: 3
Don't know: 99 X
PQ5
For each of the following statements about the RCMP's performance, please indicate whether you strongly agree, agree, neither agree nor disagree, disagree, or strongly disagree.
General
Q5A
The RCMP demonstrates professionalism in its work.
Strongly agree: 1
Agree: 2
Neither agree nor disagree: 3
Disagree: 4
Strongly disagree: 5
Don't know/ No response: 99 XS
Q5B
The RCMP is an organization with integrity.
Strongly agree: 1
Agree: 2
Neither agree nor disagree: 3
Disagree: 4
Strongly disagree: 5
Don't know/ No response: 99 XS
Q5C
RCMP personnel are honest.
Strongly agree: 1
Agree: 2
Neither agree nor disagree: 3
Disagree: 4
Strongly disagree: 5
Don't know/ No response: 99 XS
Q5D
RCMP personnel demonstrate compassion.
Strongly agree: 1
Agree: 2
Neither agree nor disagree: 3
Disagree: 4
Strongly disagree: 5
Don't know/ No response: 99 XS
Q5E
The RCMP is an accountable organization.
Strongly agree: 1
Agree: 2
Neither agree nor disagree: 3
Disagree: 4
Strongly disagree: 5
Don't know/ No response: 99 XS
Q5F
RCMP personnel demonstrate respect.
Strongly agree: 1
Agree: 2
Neither agree nor disagree: 3
Disagree: 4
Strongly disagree: 5
Don't know/ No response: 99 XS
Q5G
The RCMP places an emphasis on providing quality service to the public.
Strongly agree: 1
Agree: 2
Neither agree nor disagree: 3
Disagree: 4
Strongly disagree: 5
Don't know/ No response: 99 XS
Q5H
The RCMP is an organization that is welcoming and inclusive of people from different backgrounds.
Strongly agree: 1
Agree: 2
Neither agree nor disagree: 3
Disagree: 4
Strongly disagree: 5
Don't know/ No response: 99 XS
Q5I
The RCMP places emphasis on providing services in the official language of my choice, English or French.
Strongly agree: 1
Agree: 2
Neither agree nor disagree: 3
Disagree: 4
Strongly disagree: 5
Don't know/ No response: 99 XS
Q5J
The RCMP is a recognized symbol of Canada.
Strongly agree: 1
Agree: 2
Neither agree nor disagree: 3
Disagree: 4
Strongly disagree: 5
Don't know/ No response: 99 XS
Q5K
I have trust and confidence in the RCMP.
Strongly agree: 1
Agree: 2
Neither agree nor disagree: 3
Disagree: 4
Strongly disagree: 5
Don't know/ No response: 99 XS
PQ5L - Relationship with the RCMP
RELQ5K
The RCMP has effective local leaders.
Strongly agree: 1
Agree: 2
Neither agree nor disagree: 3
Disagree: 4
Strongly disagree: 5
Don't know/ No response: 99 XS
RELQ5L
The RCMP has effective national leaders.
Strongly agree: 1
Agree: 2
Neither agree nor disagree: 3
Disagree: 4
Strongly disagree: 5
Don't know/ No response: 99 XS
RELQ5M
I highly value the RCMP's collaboration and work in my community/province/territory.
Strongly agree: 1
Agree: 2
Neither agree nor disagree: 3
Disagree: 4
Strongly disagree: 5
Don't know/ No response: 99 XS
RELQ5N
I am familiar with RCMP services in my community/province/territory.
Strongly agree: 1
Agree: 2
Neither agree nor disagree: 3
Disagree: 4
Strongly disagree: 5
Don't know/ No response: 99 XS
RELQ5O
The RCMP provides Canadians with adequate information about its work.
Strongly agree: 1
Agree: 2
Neither agree nor disagree: 3
Disagree: 4
Strongly disagree: 5
Don't know/ No response: 99 XS
RELQ5P
The RCMP is an open and transparent organization.
Strongly agree: 1
Agree: 2
Neither agree nor disagree: 3
Disagree: 4
Strongly disagree: 5
Don't know/ No response: 99 XS
RELQ5Q
The RCMP is representative of the diverse Canadian communities it serves.
Strongly agree: 1
Agree: 2
Neither agree nor disagree: 3
Disagree: 4
Strongly disagree: 5
Don't know/ No response: 99 XS
RELQ5R
The RCMP is a forward-looking, innovative organization.
Strongly agree: 1
Agree: 2
Neither agree nor disagree: 3
Disagree: 4
Strongly disagree: 5
Don't know/ No response: 99 XS
PQ5T - Sensitivity
SENQ5S
The RCMP is sensitive to the needs of different cultures and groups.
Strongly agree: 1
Agree: 2
Neither agree nor disagree: 3
Disagree: 4
Strongly disagree: 5
Don't know/ No response: 99 XS
SENQ5T
The RCMP is respectful to the cultural needs of Indigenous people.
Strongly agree: 1
Agree: 2
Neither agree nor disagree: 3
Disagree: 4
Strongly disagree: 5
Don't know/ No response: 99 XS
SENQ5U
The RCMP treats women fairly.
Strongly agree: 1
Agree: 2
Neither agree nor disagree: 3
Disagree: 4
Strongly disagree: 5
Don't know/ No response: 99 XS
SENQ5V
The RCMP is sensitive to the needs of LGBTQ2S community.
Strongly agree: 1
Agree: 2
Neither agree nor disagree: 3
Disagree: 4
Strongly disagree: 5
Don't know/ No response: 99 XS
SENQ5W
The RCMP is helping build an inclusive and fair Canada.
Strongly agree: 1
Agree: 2
Neither agree nor disagree: 3
Disagree: 4
Strongly disagree: 5
Don't know/ No response: 99 XS
PQ5X - Responsiveness
RESQ5X
The RCMP personnel are responsive to the needs of my community/province/territory.
Strongly agree: 1
Agree: 2
Neither agree nor disagree: 3
Disagree: 4
Strongly disagree: 5
Don't know/ No response: 99 XS
RESQ5Y
The RCMP personnel have a visible presence in my community/province/territory.
Strongly agree: 1
Agree: 2
Neither agree nor disagree: 3
Disagree: 4
Strongly disagree: 5
Don't know/ No response: 99 XS
RESQ5Z
The RCMP personnel are involved in my community's activities, such as activities for children, cultural events, and local committees.
Strongly agree: 1
Agree: 2
Neither agree nor disagree: 3
Disagree: 4
Strongly disagree: 5
Don't know/ No response: 99 XS
RESQ5AA
The RCMP is present on the Web and social media, such as Twitter, Facebook, etc.
Strongly agree: 1
Agree: 2
Neither agree nor disagree: 3
Disagree: 4
Strongly disagree: 5
Don't know/ No response: 99 XS
RESQ5BB
The RCMP has a motivated workforce.
Strongly agree: 1
Agree: 2
Neither agree nor disagree: 3
Disagree: 4
Strongly disagree: 5
Don't know/ No response: 99 XS
RESQ5CC
The RCMP provides an efficient and effective coordinated response to calls for service.
Strongly agree: 1
Agree: 2
Neither agree nor disagree: 3
Disagree: 4
Strongly disagree: 5
Don't know/ No response: 99 XS
PQ5DD - Priorities of the RCMP
PRIQ5DD
The RCMP is addressing youth involvement in crime as both victims and offenders.
Strongly agree: 1
Agree: 2
Neither agree nor disagree: 3
Disagree: 4
Strongly disagree: 5
Don't know/ No response: 99 XS
PRIQ5EE
The RCMP is reducing the threat and impact of organized crime.
Strongly agree: 1
Agree: 2
Neither agree nor disagree: 3
Disagree: 4
Strongly disagree: 5
Don't know/ No response: 99 XS
PRIQ5FF
The RCMP is reducing the threat and impact of serious crime, such as murder, sexual assault, robbery, and arson.
Strongly agree: 1
Agree: 2
Neither agree nor disagree: 3
Disagree: 4
Strongly disagree: 5
Don't know/ No response: 99 XS
PRIQ5GG
The RCMP can successfully conduct and conclude high profile or major crime investigations.
Strongly agree: 1
Agree: 2
Neither agree nor disagree: 3
Disagree: 4
Strongly disagree: 5
Don't know/ No response: 99 XS
PRIQ5HH
The RCMP is effectively responding to threats to national security.
Strongly agree: 1
Agree: 2
Neither agree nor disagree: 3
Disagree: 4
Strongly disagree: 5
Don't know/ No response: 99 XS
PRIQ5II
The RCMP is effectively responding by countering radicalization to violence.
Strongly agree: 1
Agree: 2
Neither agree nor disagree: 3
Disagree: 4
Strongly disagree: 5
Don't know/ No response: 99 XS
PRIQ5JJ
The RCMP is effectively responding to threats to Canadian passenger aircraft.
Strongly agree: 1
Agree: 2
Neither agree nor disagree: 3
Disagree: 4
Strongly disagree: 5
Don't know/ No response: 99 XS
PRIQ5KK
The RCMP is contributing to safer Indigenous communities.
Strongly agree: 1
Agree: 2
Neither agree nor disagree: 3
Disagree: 4
Strongly disagree: 5
Don't know/ No response: 99 XS
PRIQ5LL
The RCMP is contributing to more informed and resilient Canadians.
Strongly agree: 1
Agree: 2
Neither agree nor disagree: 3
Disagree: 4
Strongly disagree: 5
Don't know/ No response: 99 XS
PRIQ5MM
The RCMP is reducing the impact of economic crime, such as money laundering and stock market (capital market) fraud.
Strongly agree: 1
Agree: 2
Neither agree nor disagree: 3
Disagree: 4
Strongly disagree: 5
Don't know/ No response: 99 XS
PRIQ5NN
The RCMP is effectively responding to cybercrime threats.
Strongly agree: 1
Agree: 2
Neither agree nor disagree: 3
Disagree: 4
Strongly disagree: 5
Don't know/ No response: 99 XS
PRIQ5OO
The RCMP is reducing the sale and distribution of illegal drugs.
Strongly agree: 1
Agree: 2
Neither agree nor disagree: 3
Disagree: 4
Strongly disagree: 5
Don't know/ No response: 99 XS
PRIQ5PP
The RCMP investigates public complaints appropriately.
Strongly agree: 1
Agree: 2
Neither agree nor disagree: 3
Disagree: 4
Strongly disagree: 5
Don't know/ No response: 99 XS
PRIQ5QQ
The RCMP is effectively responding to threats at the border between the ports of entry.
Strongly agree: 1
Agree: 2
Neither agree nor disagree: 3
Disagree: 4
Strongly disagree: 5
Don't know/ No response: 99 XS
PRIQ5RR
The RCMP is keeping up with current and emerging trends and threats.
Strongly agree: 1
Agree: 2
Neither agree nor disagree: 3
Disagree: 4
Strongly disagree: 5
Don't know/ No response: 99 XS
PRIQ5SS
I am aware that the RCMP participates in a variety of international activities, such as peacekeeping missions and offering training to foreign police.
Strongly agree: 1
Agree: 2
Neither agree nor disagree: 3
Disagree: 4
Strongly disagree: 5
Don't know/ No response: 99 XS
PQ6
To what degree do each of the following provide you with credible information about the RCMP and its performance in your community?
Q6A
Personal experience
A great deal: 1
Quite a bit: 2
Somewhat: 3
Very little: 4
Not at all: 5
Don't know/ No response: 99 XS
Q6B
The news media
A great deal: 1
Quite a bit: 2
Somewhat: 3
Very little: 4
Not at all: 5
Q6C
Web and social media like Facebook, Twitter, etc.
A great deal: 1
Quite a bit: 2
Somewhat: 3
Very little: 4
Not at all: 5
Q6D
Friends and Family
A great deal: 1
Quite a bit: 2
Somewhat: 3
Very little: 4
Not at all: 5
Q7
Do you follow the RCMP on social media, i.e. Facebook, Twitter?
Yes: 1
No: 2
Don't know: 99 X
Q8
In the past year, did you have any direct contact with the RCMP, such as reporting a crime, being stopped for a traffic offence or accident, seeking information, or any other reason?
What was the reason for your most recent contact with the RCMP?
For a criminal matter: 1
For a traffic offence or an accident: 2
For a complaint: 3
For a natural disaster, e.g. flood, wildfire: 4
For a crime prevention activity, project, or program: 5
For another reason: 6
Don't know: 99 X
Q10
Still thinking of the most recent contact, did you initiate the contact with the RCMP yourself?
Yes: 1
No: 2
Don't know: 99 X
PQ11
Regarding your contact(s) with the RCMP in the last year, please indicate whether you strongly agree, agree, neither agree nor disagree, disagree or strongly disagree with each of the following statements about the RCMP's performance.
If a statement does not apply, select "Not applicable".
Q11A
If… Q10 = 1
It was easy to get in touch with the RCMP.
Strongly agree: 1
Agree: 2
Neither agree nor disagree: 3
Disagree: 4
Strongly disagree: 5
Not applicable: 98 XS
Don't know: 99 XS
Q11B
RCMP personnel treated me fairly.
Strongly agree: 1
Agree: 2
Neither agree nor disagree: 3
Disagree: 4
Strongly disagree: 5
Not applicable: 98 XS
Don't know: 99 XS
Q11C
RCMP personnel demonstrated professionalism.
Strongly agree: 1
Agree: 2
Neither agree nor disagree: 3
Disagree: 4
Strongly disagree: 5
Not applicable: 98 XS
Don't know: 99 XS
Q11D
RCMP personnel were courteous and respectful.
Strongly agree: 1
Agree: 2
Neither agree nor disagree: 3
Disagree: 4
Strongly disagree: 5
Not applicable: 98 XS
Don't know: 99 XS
Q11E
RCMP personnel were knowledgeable and competent.
Strongly agree: 1
Agree: 2
Neither agree nor disagree: 3
Disagree: 4
Strongly disagree: 5
Not applicable: 98 XS
Don't know: 99 XS
Q11F
RCMP personnel delivered the service in a timely fashion.
Strongly agree: 1
Agree: 2
Neither agree nor disagree: 3
Disagree: 4
Strongly disagree: 5
Not applicable: 98 XS
Don't know: 99 XS
Q11G
RCMP personnel went beyond minimum requirements in providing good service.
Strongly agree: 1
Agree: 2
Neither agree nor disagree: 3
Disagree: 4
Strongly disagree: 5
Not applicable: 98 XS
Don't know: 99 XS
Q11H
RCMP personnel gave me all the information that I needed for the situation.
Strongly agree: 1
Agree: 2
Neither agree nor disagree: 3
Disagree: 4
Strongly disagree: 5
Not applicable: 98 XS
Don't know: 99 XS
Q12
How satisfied were you with the service you received during your contact(s) with the RCMP?
Very satisfied: 1
Somewhat satisfied: 2
Neither satisfied nor dissatisfied: 3
Somewhat dissatisfied: 4
Very dissatisfied: 5
Don't know: 99 X
Q13
Have you ever decided to not report a crime to the RCMP?