This report summarizes results from a survey of 2,988 Canadians.
Cette publication est aussi disponible en français sous le titre : Sondage d'opinion des citoyens sur les services de police de la GRC.
This publication may be reproduced for non-commercial purposes only. Prior written permission must be obtained from the RCMP. For more information on this report, please contact the RCMP at: SurveyCentreRCMP-CentresondageGRC@rcmp-grc.gc.ca
Catalogue number: PS64-154/2020E-PDF
International Standard Book Number (ISBN): 978-0-660-28038-7
Related publications (registration number: POR 056-19):
The RCMP has been conducting surveys of the Canadian public since 2003 to assess Canadians' opinions on quality of service, professionalism, sensitivity, community involvement, visibility, value of partnerships, and communication. Most of the previous editions of the survey were conducted by telephone. However, due to the challenges and costs associated with telephone surveys, in the 2017/18 fiscal year, the RCMP started to conduct this annual survey using an online/telephone methodology with the same representativeness used in the previous (telephone only) samples.
The current research, for the 2019/20 fiscal year, also involved an online/telephone methodology. A total of 2,988 Canadians were surveyed. As in previous surveys, the sample was drawn from across Canada and was weighted more heavily toward areas policed by the RCMP. The sample was stratified to ensure roughly equal representation from five regions (North, British Columbia, Prairies, Central, and Atlantic). We surveyed roughly 500 residents in the North, and about 600 in each of the other four regions.
As mentioned, the current survey was conducted primarily online (using our probability based online panel, Probit); however, to help with tracking previous survey results (which were conducted by telephone), and to ensure we could collect information from the North (which has a very limited number of panellists), we also conducted interviews by telephone. We completed 1,317 telephone interviews, and 1,671 cases were collected online.
Survey Findings
Outlined below are key findings from this study. The remainder of this report describes survey results in more detail.
Attitudes to the RCMP
Canadians place a great deal of importance on the RCMP's contribution to public safety; roughly nine in ten respondents (93 per cent) assign a high degree of importance to the RCMP's role in keeping Canadians safe, and seven in ten (72 per cent) are satisfied with how the RCMP fulfills its role in maintaining public safety.
Results reveal generally positive impressions of how the RCMP adheres to its core values. Three-quarters (75 per cent) agree that the RCMP demonstrates professionalism in its work, while seven in ten say the RCMP operates with integrity (69 per cent). Six in ten believe the RCMP is an accountable organization (63 per cent) and that its personnel are honest (62 per cent), objective (61 per cent), respectful (61 per cent), and compassionate (60 per cent).
Results further reveal positive overall impressions of the RCMP. More than nine in ten (95 per cent) agree that the RCMP is a recognized symbol of Canada. Three-quarters (74 per cent) are satisfied with the RCMP's efforts to provide services in both official languages. Seven in ten agree that the RCMP prioritizes quality service (71 per cent), and express trust and confidence in the RCMP (69 per cent). However, results suggest the public perceive gaps in the RCMP's service offerings: just half (50 per cent) say the RCMP provides the same quality of service to all citizens.
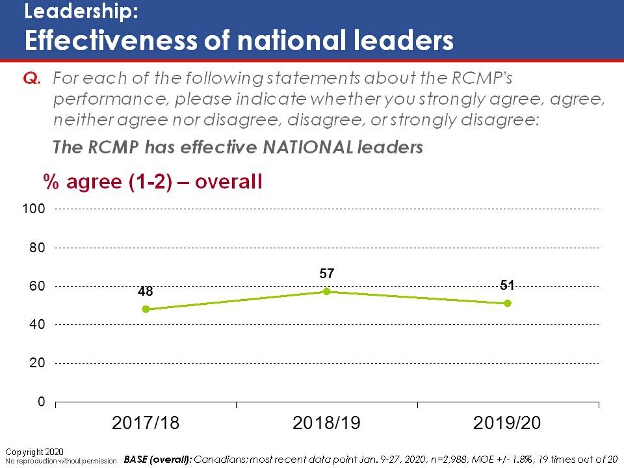
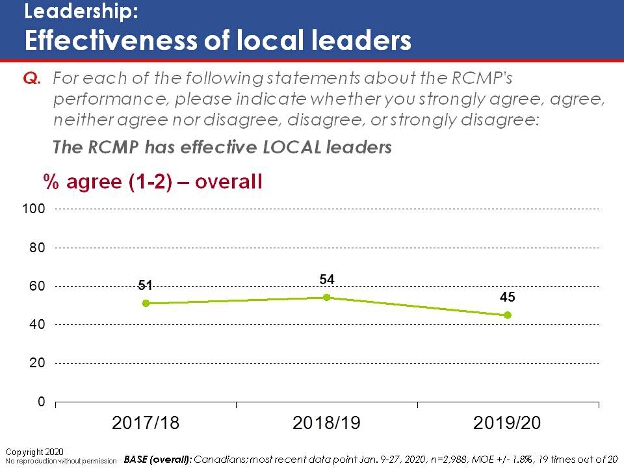
While Canadians have a high degree of confidence in the RCMP in general, they award lower marks when it comes to the calibre of its leadership. Just 51 per cent rate the RCMP's national leaders as effective, and slightly fewer (45 per cent) offer a positive appraisal of its local leaders. Tracking suggests a modest erosion in the public's confidence in RCMP leadership.
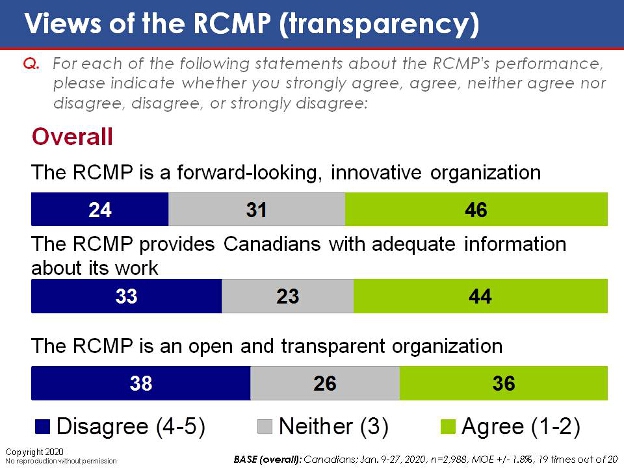
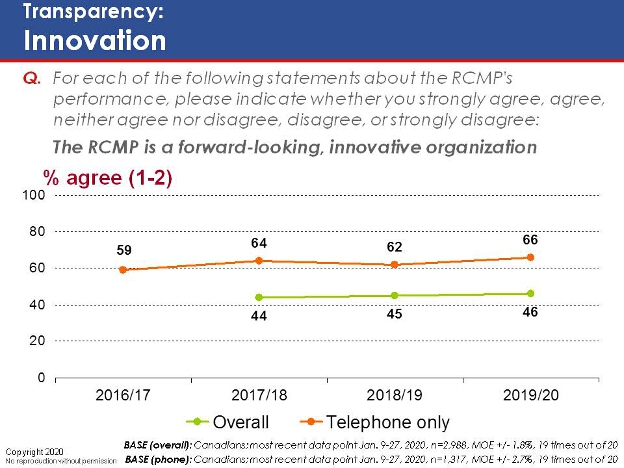
The RCMP receives mixed reviews when it comes to issues related to innovation and transparency. Fewer than half of respondents (46 per cent) agree that the RCMP is forward-looking and innovative, while a similar proportion (44 per cent) are satisfied with the level of information that the RCMP provides about its work. Respondents are sharply divided on whether the RCMP could be considered an open and transparent organization – 36 per cent agree with this assessment, while virtually the same proportion (38 per cent) disagree (although it is possible that Canadians may see the RCMP as appropriately not transparent, given the type of information they hold – e.g., criminal records, witness addresses, information before the courts, investigative techniques, etc.).
Turning to indicators related to sensitivity, more than half of respondents believe that the RCMP is representative of the diverse communities it serves (56 per cent) and that it is sensitive to the needs of Canada's various cultures and groups (52 per cent). When the scope of the questions is narrowed to focus on specific groups, however, the RCMP elicits less favourable reviews. Fewer than half of respondents agree that the RCMP treats women fairly (47 per cent, compared to 31 per cent who disagree), that it is respectful to the cultural needs of Indigenous people (45 per cent versus 33 per cent), or that it is sensitive to the needs of the LGBTQ2 community (43 per cent versus 22 per cent).
Results suggest that the RCMP maintains a largely positive relationship with the public. The vast majority of respondents (87 per cent) say they would help the RCMP if asked, while eight in ten (79 per cent) believe they have a moral obligation to follow police orders. Seven in ten (72 per cent) say they generally support the RCMP's actions. Roughly six in ten agree that the RCMP is dealing with things that matter to their community (58 per cent) and would encourage friends and family to consider the RCMP as a career path (56 per cent).
Canadians also hold generally positive views of the RCMP's responsiveness; about six in ten agree that the RCMP keeps up with current and emerging threats (63 per cent) and that it is quick to respond to calls for assistance (58 per cent).
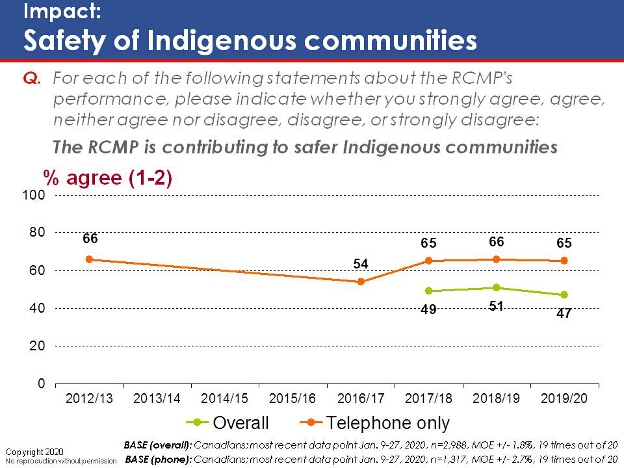
Results further reveal generally positive impressions of the impact of the RCMP on Canadians, although findings also suggest room for improvement in some areas, particularly when it comes to how the RCMP handles Indigenous matters. Three-quarters (76 per cent) express confidence in the RCMP's ability to respond to national security threats effectively. About seven in ten agree the RCMP effectively handles threats to passenger aircraft (69 per cent), diminishes the threat of organized crime (69 per cent), resolves crimes where violence is involved (67 per cent), and provides an adequate response to border threats (65 per cent). About six in ten believe the RCMP is effective in countering radicalization to violence (62 per cent), mitigating the impact of serious crime (62 per cent), reducing the distribution of illegal drugs (61 per cent), responding to cybercrime threats (60 per cent), and addressing youth crime (57 per cent). Slightly fewer agree that the RCMP is successfully lessening the impact of economic crime (55 per cent) and improving traffic safety (55 per cent). However, just half of respondents are satisfied with the RCMP's contribution to making Canadians more informed and resilient (50 per cent), its attempts to combat online scams (49 per cent), and its efforts in fostering safer Indigenous communities (47 per cent). Only four in ten (43 per cent) say the RCMP is advancing reconciliation with Canada's Indigenous peoples.
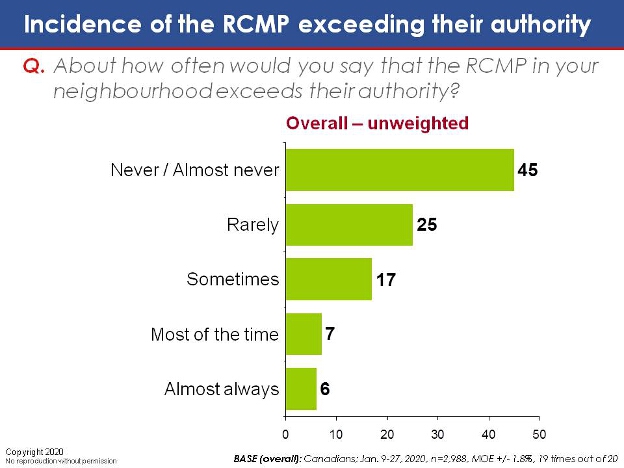
Most Canadians believe the RCMP generally acts within their authority, although a significant minority believe the organization exceeds their jurisdiction at times. Seven in ten (70 per cent) say the RCMP seldom exceeds its authority (including 45 per cent who say 'never' or 'almost never'). One in six (17 per cent), however, feel the RCMP sometimes oversteps its boundaries, and one in eight (13 per cent) believe the RCMP often or always oversteps its jurisdiction.
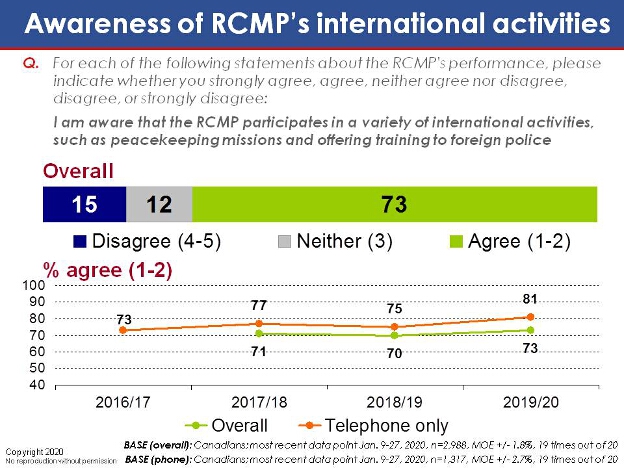
Finally, results suggest broad awareness of the RCMP's international undertakings. Three-quarters (73 per cent) say they are aware that the RCMP participates in international activities such as peacekeeping and training foreign police, and only one in seven (15 per cent) say they are not aware that the RCMP engages in these activities. Longer-term tracking suggests a steady rise in the public's familiarity with the RCMP's presence on the international stage.
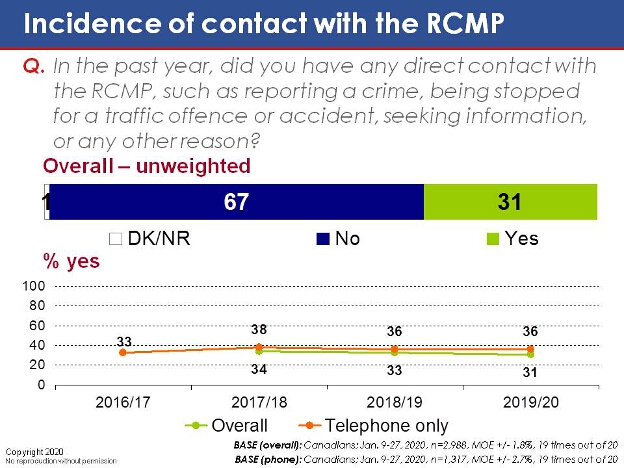
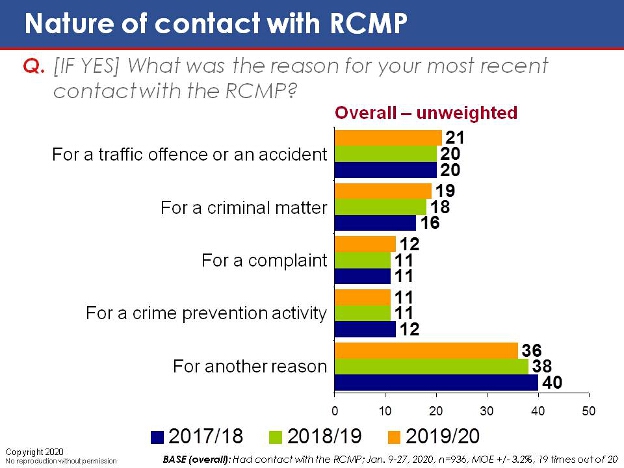
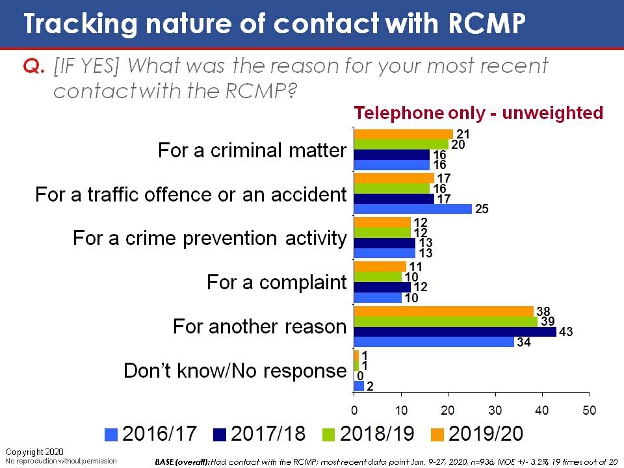
Three in ten respondents (31 per cent) indicate they have had contact with the RCMP in the past year. Of those who have, one in five indicate their contact involved a traffic offence or an accident (21 per cent) or a criminal matter (19 per cent).
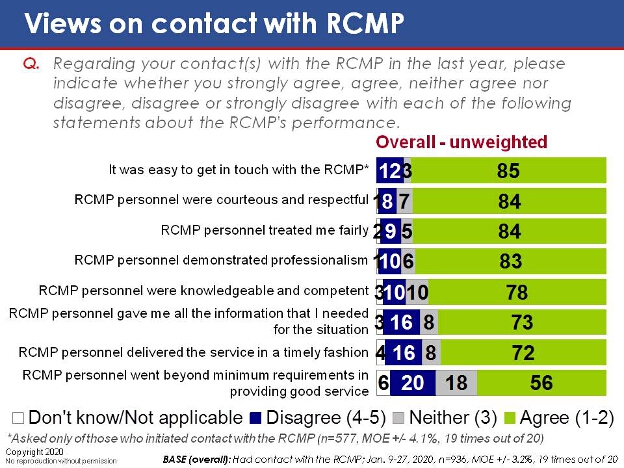
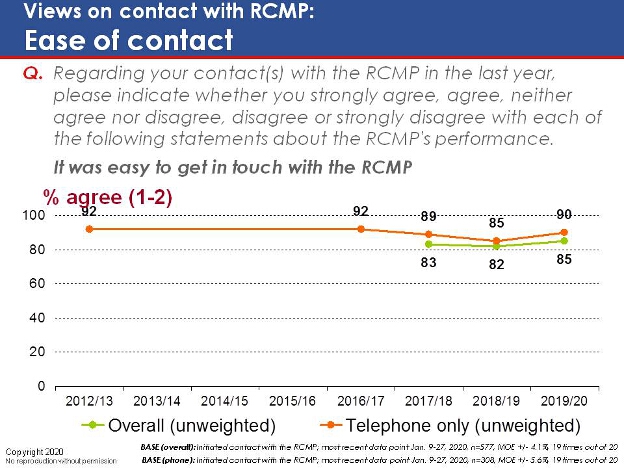
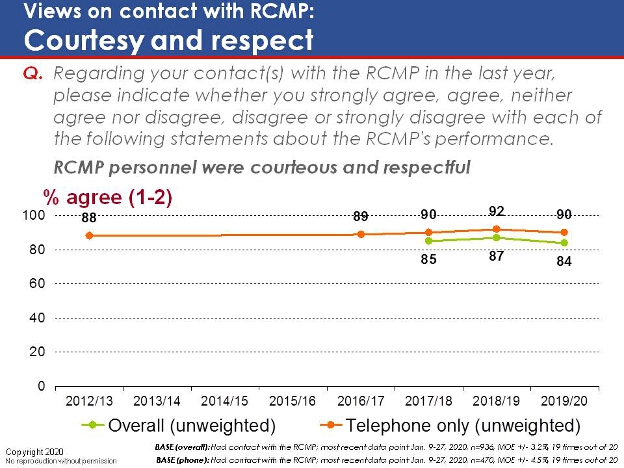
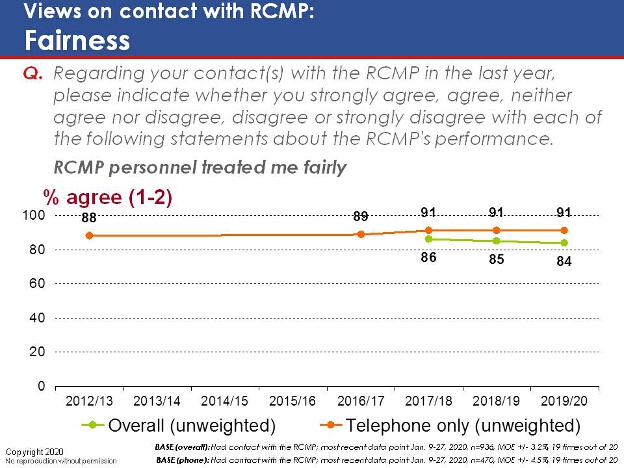
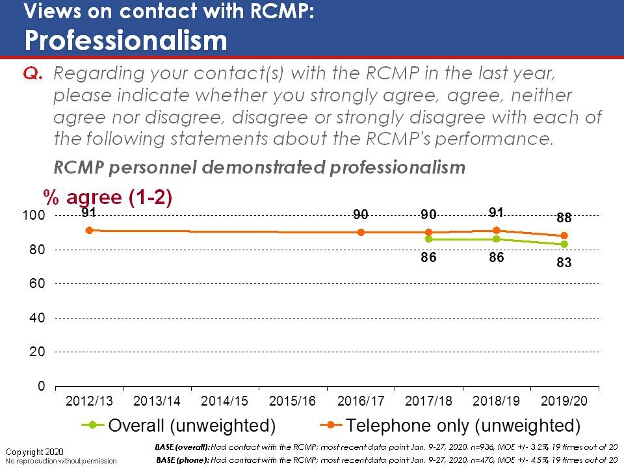
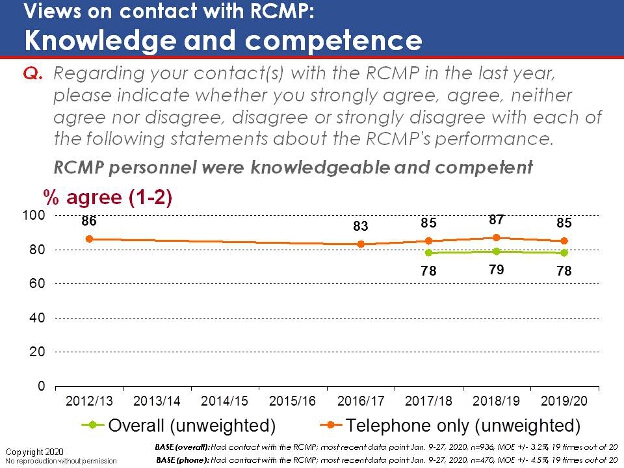
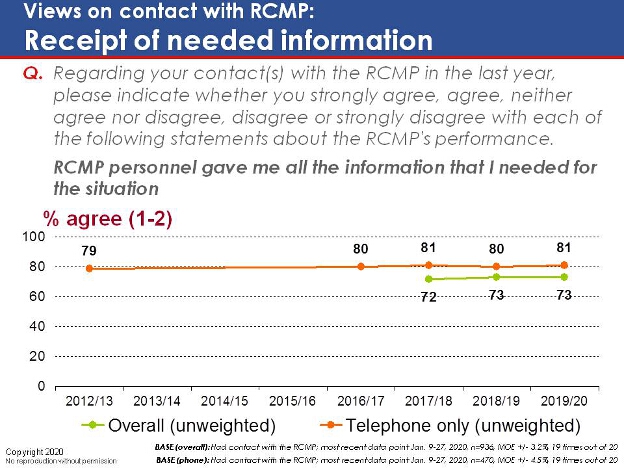
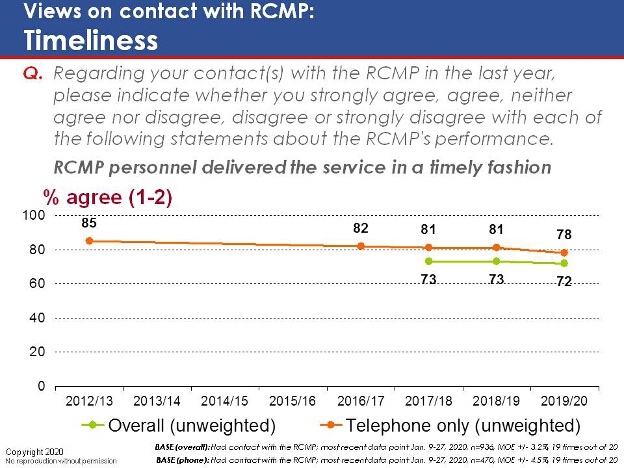
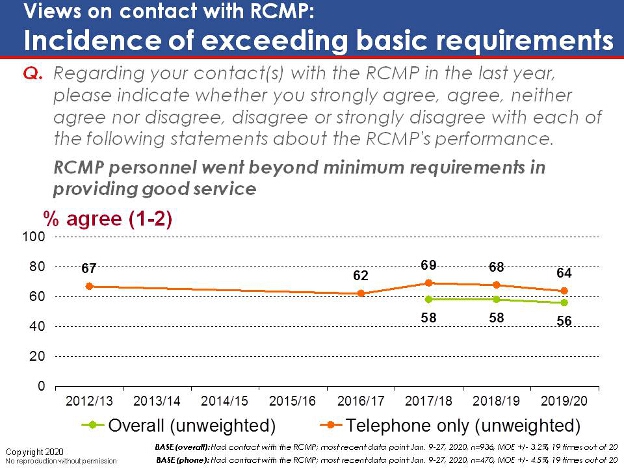
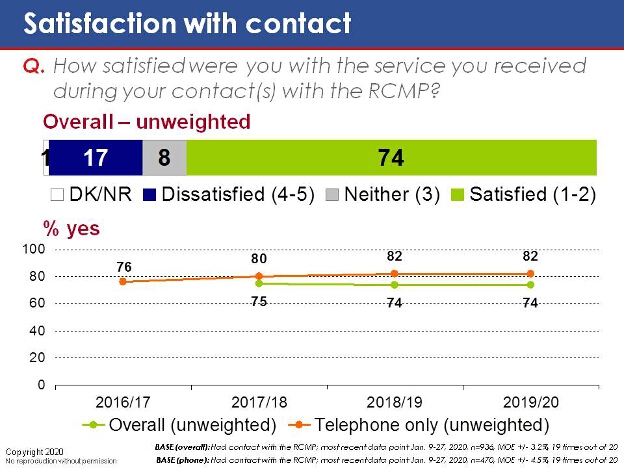
Of those who had had contact with the RCMP, more than eight in ten (85 per cent) agree that it was easy to get in touch with the RCMP, while similar proportions say RCMP personnel were courteous and respectful (84 per cent), treated them fairly (84 per cent), and demonstrated professionalism (83 per cent). Roughly three-quarters feel that RCMP personnel were knowledgeable and competent (78 per cent), provided all the information needed (73 per cent), and delivered the service in a timely fashion (72 per cent). However, just 56 per cent feel the RCMP went beyond minimum service requirements.
Overall, three-quarters of those who had contact with the RCMP (74 per cent) express satisfaction with their encounter.
Conclusions
Overall, attitudes towards the RCMP are generally positive and stable. The vast majority of Canadians are satisfied with the RCMP's contribution to public safety and nearly all Canadians recognize the importance of its work. The RCMP also scores well in terms of upholding its core principles, particularly professionalism and integrity. The organization consistently enjoys its highest levels of support from seniors and those with high school education.
Nevertheless, results reveal some areas for improvement. Canadians hold mixed views when it comes to issues surrounding transparency and accountability. There are some doubts as to whether the RCMP provides Canadians with sufficient information regarding its work, and Canadians are evenly split on whether the organization could be considered transparent. The RCMP also receives mixed scores in terms of the quality of its leadership, and tracking suggests a modest erosion in the public's confidence in this area.
Another area of potential concern is sensitivity. While the RCMP does quite well on the broader indicators surrounding inclusiveness and diversity, public attitudes worsen when the scope of the question is narrowed to focus on specific groups, namely Indigenous people, women, and the LGBTQ2 community. Of particular concern are the consistently poor ratings awarded by the LGBTQ2 community; on virtually every indicator, those who identify as LGBTQ2 provide significantly less favourable ratings than other Canadians.
Results also reveal that one-third of Canadians have had contact with the RCMP in the past year. A clear majority express satisfaction with the service received, and RCMP personnel score quite well across the performance indicators examined (e.g. courteousness, fairness, and professionalism).
1. Background and Methodology
1.1 Background and Objectives
The Organizational Priorities and Strategy Management unit of the RCMP is responsible for the development and implementation of an internal performance measurement system and for the overall results reporting to the federal government. In an evidence-based environment, the RCMP requires sound metrics from the general public to assess performance and set targets for improved performance.
The RCMP has been conducting surveys of the Canadian public since 2003 to assess public opinions on quality of service, professionalism, sensitivity, community involvement, visibility, value of partnerships, and communication.
Most of the previous editions of this survey were conducted by telephone. However, due to the challenges and costs associated with telephone surveys, and to reach a broader audience, in the 2017/18 fiscal year, the RCMP started to conduct the survey using an online/telephone methodology with the same representativeness used in the previous (telephone only) samples.
1.2 Methodology
The current research also involved conducting an online/telephone survey. A total of 2,988 Canadians were surveyed in January 2020. As in previous surveys, the sample was drawn from across Canada and was weighted more heavily toward areas policed by the RCMP. The sample was stratified to ensure roughly equal representation from five regions (North, British Columbia, Prairies, Central, and Atlantic). We surveyed roughly 500 residents in the North, and about 600 in each of the other four regions.
The survey was conducted primarily online using our probability based online panel, Probit; however, to help with tracking previous survey results (which were conducted by telephone), and to ensure we could collect information from the North (which has a very limited number of panellists), we also conducted interviews by telephone. Below we provide more detail on the methodology associated with both the online and telephone components of the research.
Probit Panel (Online Sample)
We used our probability-based online panel, Probit, for the online completions. Probit is an online research panel that has been designed by Ekos to provide statistically representative data. Our panel offers complete coverage of the Canadian population (Internet, phone, cell phone), random recruitment (participants are recruited randomly, they do not opt themselves into our panel), and equal probability sampling. All respondents to our panel are recruited by telephone using random digit dialling, and their demographic information is confirmed by live interviewers.
The distribution of the recruitment process for our panel mirrors the actual population in Canada (as defined by Statistics Canada). As such, our panel can be considered representative of the general public (survey results from our online panel support confidence intervals and margin of error estimates, which is unique in Canada). The overall panel size is roughly 90,000 Canadian households. Random stratified samples are drawn from the panel database for individual research assignments.
Telephone Sample
Ekos relies on Survey Sample for the sample requirements of our telephone surveys. The software uses the most up-to-date directories as they become available and is updated quarterly. It samples by Random Digit Dial (RDD) methodology and checks its samples against published phone lists to divide the sample into "Directory Listed" (DL) and "Directory Not Listed" (DNL) RDD components. The flexibility of this software allows one to sample within specific regions or cities. One can sample according to population representativeness or stipulate stratification parameters, as required. Once the sample is determined for a specific survey, the numbers are imported into our Computer Assisted Telephone Interview (CATI) system and quotas are set for individual characteristics.
We completed 1,317 telephone interviews, and 1,671 cases were collected online. Results were weighted by region, gender, and age to ensure that the sample is representative of the Canadian population 18 years of age and older. Outlined below is the sample breakdown and margin of error (MOE) across mode and province/territory (please note the sample sizes and margins of error by province/territory are for overall results).
Margin of Error by Mode
Mode
Online
Phone
Total
Margin of error (+/−, 19 times out of 20)
Overall (phone and online)
n=1,671
n=1,317
n=2,988
1.8%
Telephone only
–
n=1,317
n=1,317
2.7%
Margin of Error by Province/Territory
Province/Territory
Online
Phone
Total
Margin of error (+/−, 19 times out of 20)
British Columbia
n=414
n=200
n=614
4.0%
Alberta
n=255
n=68
n=323
5.5%
Saskatchewan
n=95
n=71
n=166
7.6%
Manitoba
n=88
n=65
n=153
7.9%
Ontario
n=230
n=100
n=330
5.4%
Quebec
n=184
n=100
n=284
5.8%
New Brunswick
n=110
n=52
n=162
7.7%
Nova Scotia
n=171
n=51
n=222
6.6%
Prince Edward Island
n=35
n=50
n=85
10.6%
Newfoundland
n=83
n=50
n=133
8.5%
Yukon
–
n=176
n=176
7.4%
Northwest Territories
–
n=165
n=165
7.6%
Nunavut
–
n=169
n=169
7.5%
Response Rate
The telephone response rate for this survey was 9.8 per cent. The response rate is calculated by dividing the in-scope responding (1,772) by the total (functional) sample (18,011) – see table below.
Response Rate
Description
Result
Total
Total Numbers Attempted
25,538
Invalid numbers
7,527
Blocked
149
Business
463
Duplicate
17
Invalid
6,898
Unresolved (U)
11,773
No answer
0
Callbacks
11,773
In-scope - Not responding (IS)
4,466
Household refusal
0
Respondent refusal
4,466
Selected respondent not available
0
Qualified respondent break-off
0
In-scope - Responding (R)
1,772
Language problem
349
Quota filled
48
Other disqualify
58
Completed interviews
1,317
Total (U + IS + R)
18,011
Response Rate (R divided by Total)
9.8%
The online response rate for this survey was 10.9 per cent. The online response rate is calculated as follows: a total of 15,418 email invitations were sent out, and 113 bounced back, for a total of 15,305 valid emails. A total of 1,671 cases were completed, so dividing 1,671 by 15,305 results in a response rate of 10.9 per cent.
Note to the Reader
The current survey was conducted using what was referred to in the RCMP's 2017/18 survey of the public as a "hybrid" methodology (online and telephone). Starting in 2018/19, this methodology was referred to as the "overall" results. Overall results are tracked to the 2017/18 survey, which also used an online and telephone methodology; however, given that previous surveys (before the 2017/18 fiscal year) were conducted solely by telephone, only telephone results are tracked for earlier years.
It should be noted that online results tend to be generally less positive than telephone results – this is due to a mode effect (social desirability bias) that is exhibited in all telephone/online surveys. Social desirability bias occurs when individuals provide different responses in the presence of an interviewer to appear in a more favourable light.
Schonlau et al. (2004)[2] studied mode effects between online and telephone surveys. This study found evidence of social desirability bias among telephone respondents for sensitive questions. In particular, this study found that telephone respondents were far more likely to rate their health as "excellent" as opposed to merely "very good".
Greene et al. (2008)[3] conducted a meta-analysis of four health related studies that contrasted the results of online and telephone studies. All of these studies revealed evidence of social desirability bias among telephone respondents.
Given the subject matter in the survey (views on a national symbol of Canada – the RCMP), it appears that telephone respondents did not want to be as critical of the RCMP as those who completed the survey through a self-administered, online survey (with no interviewer involved).
Please also note that most of the questions in this survey asked respondents to respond using five-point scales (e.g., where one means strongly disagree, five means strongly agree, and the midpoint, three, means neither disagree nor agree). Responses of one to two and four to five are aggregated when discussing the findings in this report.
2. Attitudes toward the RCMP
Please note that, throughout this report, overall results refer to findings from both the telephone and online interviews (n=2,988). Overall results are tracked to the 2017/18 fiscal year survey (which also used an online and telephone methodology); however, given that previous surveys (before the 2017/18 fiscal year) were conducted solely by telephone, only telephone results are tracked for earlier years. Also, please note that throughout the report any discussion of tracking is referring to telephone tracking only, unless otherwise specified.
In this section, figures are based on valid responses only (in other words, the figures are adjusted to exclude those who skipped a given question).
2.1 Importance of RCMP's Contribution to Public Safety
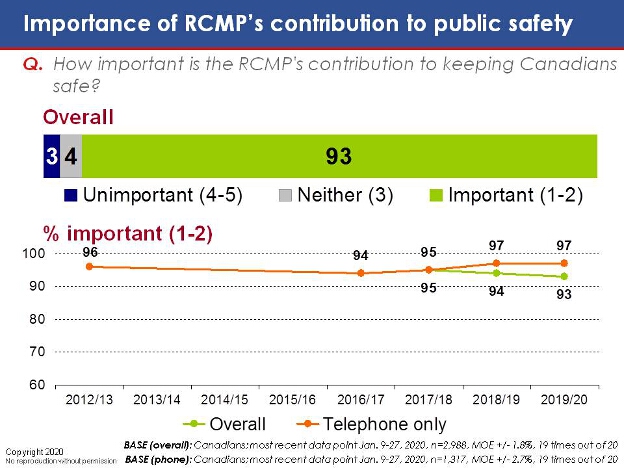
Survey findings reveal that Canadians place a great deal of importance on the RCMP's contribution to public safety. Roughly nine in ten respondents (93 per cent) assign a high degree of importance to the RCMP's role in keeping Canadians safe, and just three per cent say the RCMP's efforts to ensure public safety are of little or no importance.
Tracking suggests that these results have been largely consistent over the past several years.
Importance of RCMP's contribution to public safety
Importance of RCMP's contribution to public safety - Text version
This chart has one horizontal stacked bar for overall results Based on a five-point scale where 4-5 means unimportant, 3 means neither, and1-2 means important. Below is a line graph for overall and telephone only results – % important (1-2) – for the years 2012/13, 2016/17, 2017/18, 2018/19 and 2019/20.
Respondents were asked: "How important is the RCMP's contribution to keeping Canadians safe?"
Respondents selected:
Overall: Unimportant (3 per cent); neither (4 per cent); and important (93 per cent).
Important (1-2) 2012/13: telephone only (96 per cent);
Important (1-2) 2016/17: telephone only (94 per cent);
Important (1-2) 2017/18: overall (95 per cent); telephone only (95 per cent);
Important (1-2) 2018/19: overall (94 per cent); telephone only (97 per cent);
Important (1-2) 2019/20: overall (93 per cent); telephone only (97 per cent);
Base (overall): Canadians; most recent data point Jan. 9-27, 2020, n=2,988, MOE +/− 1.8%, 19 times out of 20
Base (phone): Canadians; most recent data point Jan. 9-27, 2020, n=1,317, MOE +/− 2.7%, 19 times out of 20
2.2 Satisfaction With RCMP's Contribution to Public Safety
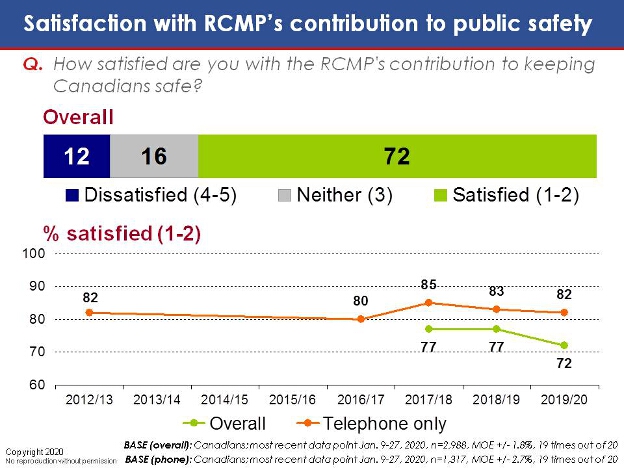
Results further reveal that seven in ten Canadians (72 per cent) are satisfied with how the RCMP fulfills its role in maintaining public safety, and only one in eight (12 per cent) are dissatisfied. One in six (16 per cent) are neither satisfied nor dissatisfied.
Tracking (overall results) reveals a five-point drop in satisfaction with the RCMP's contribution to public safety since 2018/19 (72 per cent, down from 77 per cent in 2018/19).
Satisfaction rises progressively with age (from 63 per cent among those under the age of 35 to 86 per cent among those ages 65 and over).
Satisfaction levels are higher in Atlantic Canada (83 per cent, compared to 72 per cent on average).
Those who identify as LGBTQ2 are less likely to say they are satisfied with the RCMP's contribution to public safety (57 per cent, compared to 72 per cent on average).
Satisfaction With RCMP's Contribution to Public Safety
Satisfaction With RCMP's Contribution to Public Safety - Text version
This chart has one horizontal stacked bar for overall results Based on a five-point scale where 4-5 means dissatisfied, 3 means neither, and1-2 means satisfied. Below is a line graph for overall and telephone only results – % satisfied (1-2) – for the years 2012/13, 2016/17, 2017/18, 2018/19 and 2019/20.
Respondents were asked: "How satisfied are you with the RCMP's contribution to keeping Canadians safe?"
Respondents selected:
Overall: Dissatisfied (12 per cent); neither (16 per cent); and satisfied (72 per cent).
Satisfied (1-2) 2012/13: telephone only (82 per cent);
Satisfied (1-2) 2016/17: telephone only (80 per cent);
Satisfied (1-2) 2017/18: overall (77 per cent); telephone only (85 per cent);
Satisfied (1-2) 2018/19: overall (77 per cent); telephone only (83 per cent);
Satisfied (1-2) 2019/20: overall (72 per cent); telephone only (82 per cent);
Base (overall): Canadians; most recent data point Jan. 9-27, 2020, n=2,988, MOE +/− 1.8%, 19 times out of 20
Base (phone): Canadians; most recent data point Jan. 9-27, 2020, n=1,317, MOE +/− 2.7%, 19 times out of 20
2.3 Impact on Sense of Safety
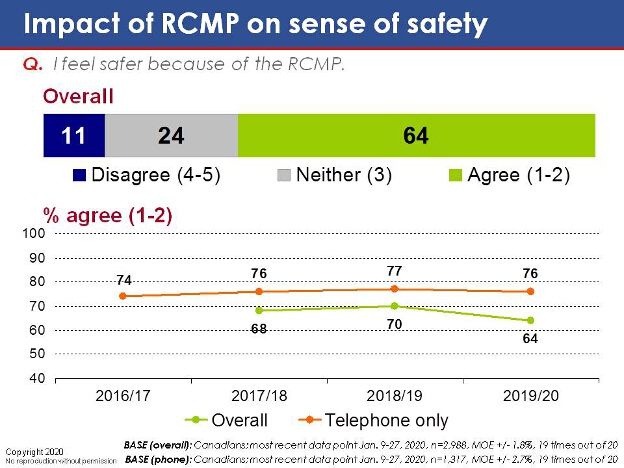
Results also reveal that the RCMP has a highly positive impact on the public's personal sense of safety. More than six in ten respondents (64 per cent) agree that they feel safer because of the RCMP, and just one in ten (11 per cent) disagree with this notion.
Tracking (overall results) reveals a six-point drop in the proportion of Canadians who say they feel safer from 2018/19 (64 per cent, down from 70 per cent in 2018/19).
Agreement rises with age (from 58 per cent among those under the age of 35 to 74 per cent among those ages 65 and over).
Agreement is higher among those who live in Atlantic Canada (79 per cent, compared to 64 per cent nationally).
Agreement is noticeably lower among members of the LGBTQ2 community (45 per cent, compared to 64 per cent on average).
Impact on Sense of Safety
Impact on Sense of Safet - Text version
This chart has one horizontal stacked bar for overall results Based on a five-point scale where 4-5 means disagree, 3 means neither, and1-2 means agree. Below is a line graph for overall and telephone only results – % agree (1-2) – for the years 2016/17, 2017/18, 2018/19 and 2019/20.
Respondents were asked if they agree or disagree with the following statement: "I feel safer because of the RCMP".
Respondents selected:
Overall: Disagree (11 per cent); neither (24 per cent); and agree (64 per cent).
Agree (1-2) 2016/17: telephone only (74 per cent);
Agree (1-2) 2017/18: overall (68 per cent); telephone only (76 per cent);
Agree (1-2) 2018/19: overall (70 per cent); telephone only (77 per cent);
Agree (1-2) 2019/20: overall (64 per cent); telephone only (76 per cent);
Base (overall): Canadians; most recent data point Jan. 9-27, 2020, n=2,988, MOE +/− 1.8%, 19 times out of 20
Base (phone): Canadians; most recent data point Jan. 9-27, 2020, n=1,317, MOE +/− 2.7%, 19 times out of 20
2.4 Core Values of the RCMP
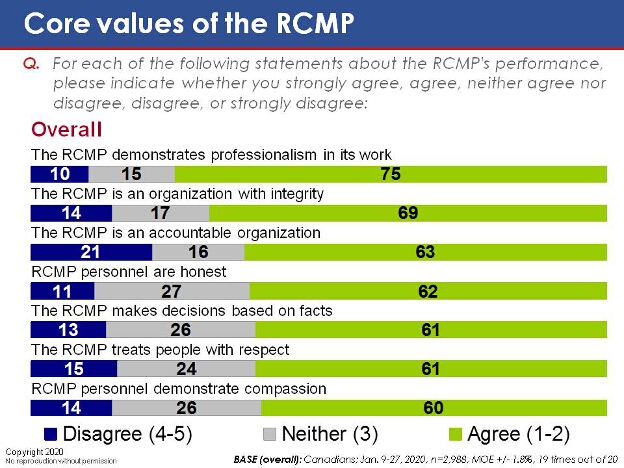
Respondents were presented with a series of statements regarding the six core values of the RCMP (professionalism, integrity, accountability, honesty, respect, and compassion), as well as a question on objectivity, and asked for their views on the RCMP's performance in each of these areas. The results reveal generally positive impressions of the RCMP.
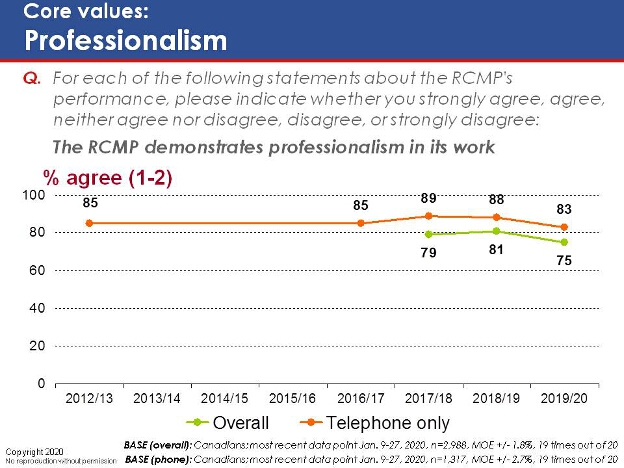
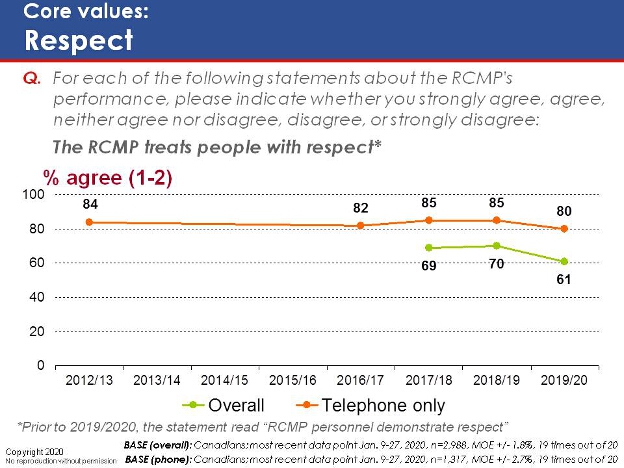
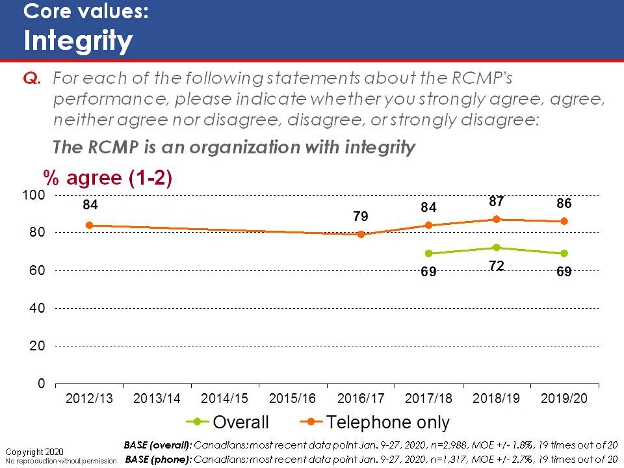
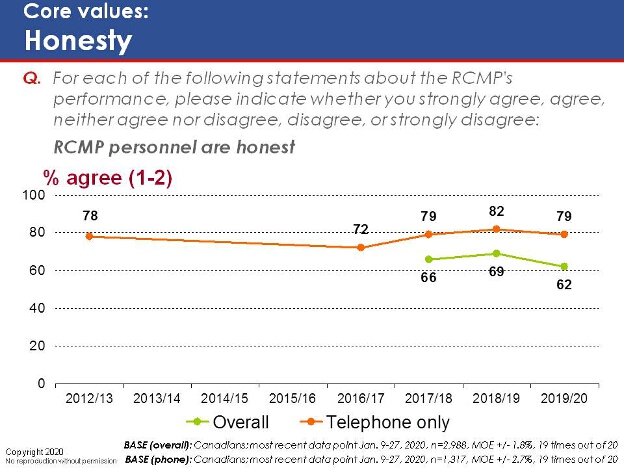
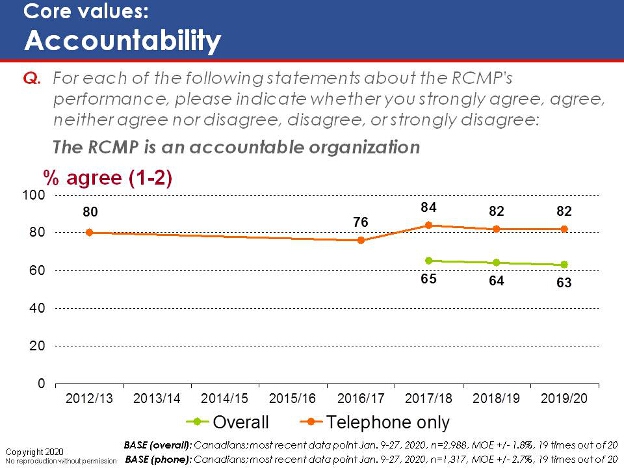
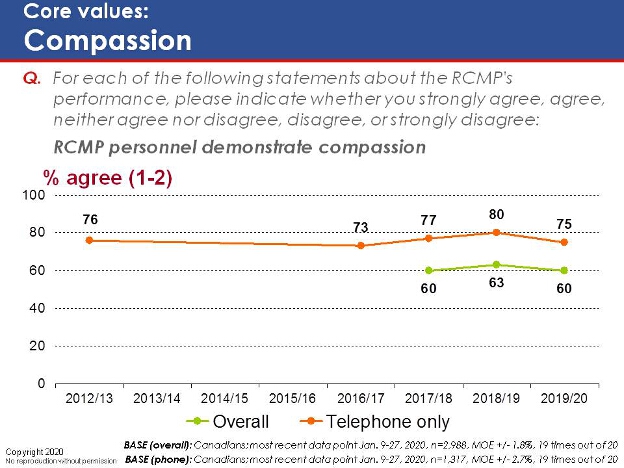
Three-quarters (75 per cent) agree that the RCMP demonstrates professionalism in its work, while seven in ten say the RCMP operates with integrity (69 per cent). Six in ten believe the RCMP is an accountable organization (63 per cent) and that its personnel are honest (62 per cent), objective (61 per cent), respectful (61 per cent), and compassionate (60 per cent). Relatively few respondents (between 10 and 21 per cent) disagree with any of these ideas.
Tracking (overall results) reveals a seven-point drop in the proportion of Canadians who perceive RCMP personnel as honest (62 per cent, down from 69 per cent in 2018/19), as well as a six-point drop in the proportion of Canadians who perceive RCMP personnel as professional in nature (75 per cent, down from 81 per cent in 2018/19). Other results are largely on par with those found last year.[4]
Agreement with each of these statements rises progressively with age. For instance, 56 per cent of those of those under the age of 35 agree that the RCMP is an accountable organization, a figure that rises to 73 per cent among those ages 65 and over.
Those with a high school education are consistently more likely to assign positive ratings to the RCMP. For example, 72 per cent described the RCMP as accountable, compared to 66 per cent of college graduates and 58 per cent of respondents with a university degree.
Those who identify as LGBTQ2 are consistently less likely to provide a positive appraisal of the RCMP (for instance, 54 per cent say the RCMP demonstrates professionalism, compared to 75 per cent on average). Indigenous respondents are somewhat less likely to perceive the RCMP as accountable (52 per cent versus 63 per cent), honest (52 per cent versus 62 per cent), or objective (45 per cent versus 61 per cent).
Core Values of the RCMP
Core Values of the RCMP - Text version
This chart has seven horizontal stacked bars for overall results Based on a five-point scale where 4-5 means disagree, 3 means neither, and1-2 means agree.
Respondents were asked: "For each of the following statements about the RCMP's performance, please indicate whether you strongly agree, agree, neither agree nor disagree, disagree, or strongly disagree."
Respondents selected:
The RCMP demonstrates professionalism in its work: Disagree (10 per cent); neither (15 per cent); and agree (75 per cent).
The RCMP is an organization with integrity: Disagree (14 per cent); neither (17 per cent); and agree (69 per cent).
The RCMP is an accountable organization: Disagree (21 per cent); neither (16 per cent); and agree (63 per cent).
RCMP personnel are honest: Disagree (11 per cent); neither (27 per cent); and agree (62 per cent).
The RCMP makes decisions Based on facts: Disagree (13 per cent); neither (26 per cent); and agree (61 per cent).
The RCMP treats people with respect: Disagree (15 per cent); neither (24 per cent); and agree (61 per cent).
RCMP personnel demonstrate compassion: Disagree (14 per cent); neither (26 per cent); and agree (60 per cent).
Base (overall): Canadians; Jan. 9-27, 2020, n=2,988, MOE +/− 1.8%, 19 times out of 20
Core values: Professionalism
Core values: Professionalism. Text version
This chart is a line graph for overall and telephone only results – % agree (1-2) – for the years 2012/13, 2016/17, 2017/18, 2018/19 and 2019/20.
Respondents were asked: "For each of the following statements about the RCMP's performance, please indicate whether you strongly agree, agree, neither agree nor disagree, disagree, or strongly disagree: The RCMP demonstrates professionalism in its work."
Respondents selected:
Agree (1-2) 2012/13: telephone only (85 per cent);
Agree (1-2) 2016/17: telephone only (85 per cent);
Agree (1-2) 2017/18: overall (79 per cent); telephone only (89 per cent);
Agree (1-2) 2018/19: overall (81 per cent); telephone only (88 per cent);
Agree (1-2) 2019/20: overall (75 per cent); telephone only (83 per cent);
Base (overall): Canadians; most recent data point Jan. 9-27, 2020, n=2,988, MOE +/− 1.8%, 19 times out of 20
Base (phone): Canadians; most recent data point Jan. 9-27, 2020, n=1,317, MOE +/− 2.7%, 19 times out of 20
Core values: Respect
Core values: Respect. Text version
This chart is a line graph for overall and telephone only results – % agree (1-2) – for the years 2012/13, 2016/17, 2017/18, 2018/19 and 2019/20.
Respondents were asked: "For each of the following statements about the RCMP's performance, please indicate whether you strongly agree, agree, neither agree nor disagree, disagree, or strongly disagree: The RCMP treats people with respect*"
Respondents selected:
Agree (1-2) 2012/13: telephone only (84 per cent);
Agree (1-2) 2016/17: telephone only (82 per cent);
Agree (1-2) 2017/18: overall (69 per cent); telephone only (85 per cent);
Agree (1-2) 2018/19: overall (70 per cent); telephone only (85 per cent);
Agree (1-2) 2019/20: overall (61 per cent); telephone only (80 per cent);
*Prior to 2019/2020, the statement read "RCMP personnel demonstrate respect"
Base (overall): Canadians; most recent data point Jan. 9-27, 2020, n=2,988, MOE +/− 1.8%, 19 times out of 20
Base (phone): Canadians; most recent data point Jan. 9-27, 2020, n=1,317, MOE +/− 2.7%, 19 times out of 20
Core values: Integrity
Core values: Integrity. Text version
This chart is a line graph for overall and telephone only results – % agree (1-2) – for the years 2012/13, 2016/17, 2017/18, 2018/19 and 2019/20.
Respondents were asked: "For each of the following statements about the RCMP's performance, please indicate whether you strongly agree, agree, neither agree nor disagree, disagree, or strongly disagree: The RCMP is an organization with integrity."
Respondents selected:
Agree (1-2) 2012/13: telephone only (84 per cent);
Agree (1-2) 2016/17: telephone only (79 per cent);
Agree (1-2) 2017/18: overall (69 per cent); telephone only (84 per cent);
Agree (1-2) 2018/19: overall (72 per cent); telephone only (87 per cent);
Agree (1-2) 2019/20: overall (69 per cent); telephone only (86 per cent);
Base (overall): Canadians; most recent data point Jan. 9-27, 2020, n=2,988, MOE +/− 1.8%, 19 times out of 20
Base (phone): Canadians; most recent data point Jan. 9-27, 2020, n=1,317, MOE +/− 2.7%, 19 times out of 20
Core values: Honesty
Core values: Honesty. Text version
This chart is a line graph for overall and telephone only results – % agree (1-2) – for the years 2012/13, 2016/17, 2017/18, 2018/19 and 2019/20.
Respondents were asked: "For each of the following statements about the RCMP's performance, please indicate whether you strongly agree, agree, neither agree nor disagree, disagree, or strongly disagree: RCMP personnel are honest." Respondents selected:
Agree (1-2) 2012/13: telephone only (78 per cent);
Agree (1-2) 2016/17: telephone only (72 per cent);
Agree (1-2) 2017/18: overall (66 per cent); telephone only (79 per cent);
Agree (1-2) 2018/19: overall (69 per cent); telephone only (82 per cent);
Agree (1-2) 2019/20: overall (62 per cent); telephone only (79 per cent);
Base (overall): Canadians; most recent data point Jan. 9-27, 2020, n=2,988, MOE +/− 1.8%, 19 times out of 20
Base (phone): Canadians; most recent data point Jan. 9-27, 2020, n=1,317, MOE +/− 2.7%, 19 times out of 20
Core values: Accountability
Core values: Accountability. Text version
This chart is a line graph for overall and telephone only results – % agree (1-2) – for the years 2012/13, 2016/17, 2017/18, 2018/19 and 2019/20.
Respondents were asked: "For each of the following statements about the RCMP's performance, please indicate whether you strongly agree, agree, neither agree nor disagree, disagree, or strongly disagree: The RCMP is an accountable organization."
Respondents selected:
Agree (1-2) 2012/13: telephone only (80 per cent);
Agree (1-2) 2016/17: telephone only (76 per cent);
Agree (1-2) 2017/18: overall (65 per cent); telephone only (84 per cent);
Agree (1-2) 2018/19: overall (64 per cent); telephone only (82 per cent);
Agree (1-2) 2019/20: overall (63 per cent); telephone only (82 per cent);
Base (overall): Canadians; most recent data point Jan. 9-27, 2020, n=2,988, MOE +/− 1.8%, 19 times out of 20
Base (phone): Canadians; most recent data point Jan. 9-27, 2020, n=1,317, MOE +/− 2.7%, 19 times out of 20
Core values: Compassion
Core values: Compassion. Text version
This chart is a line graph for overall and telephone only results – % agree (1-2) – for the years 2012/13, 2016/17, 2017/18, 2018/19 and 2019/20.
Respondents were asked: "For each of the following statements about the RCMP's performance, please indicate whether you strongly agree, agree, neither agree nor disagree, disagree, or strongly disagree: RCMP personnel demonstrate compassion."
Respondents selected:
Agree (1-2) 2012/13: telephone only (76 per cent);
Agree (1-2) 2016/17: telephone only (73 per cent);
Agree (1-2) 2017/18: overall (60 per cent); telephone only (77 per cent);
Agree (1-2) 2018/19: overall (63 per cent); telephone only (80 per cent);
Agree (1-2) 2019/20: overall (60 per cent); telephone only (75 per cent);
Base (overall): Canadians; most recent data point Jan. 9-27, 2020, n=2,988, MOE +/− 1.8%, 19 times out of 20
Base (phone): Canadians; most recent data point Jan. 9-27, 2020, n=1,317, MOE +/− 2.7%, 19 times out of 20
2.5 Views of the RCMP (General)
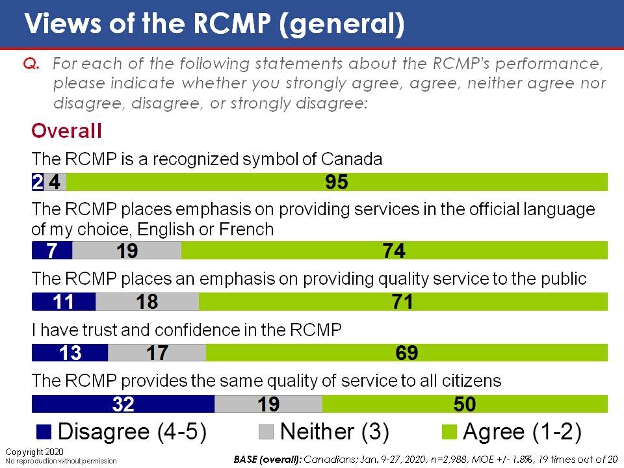
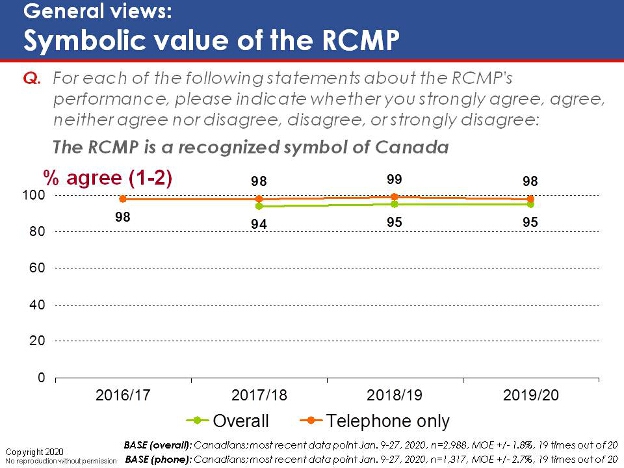
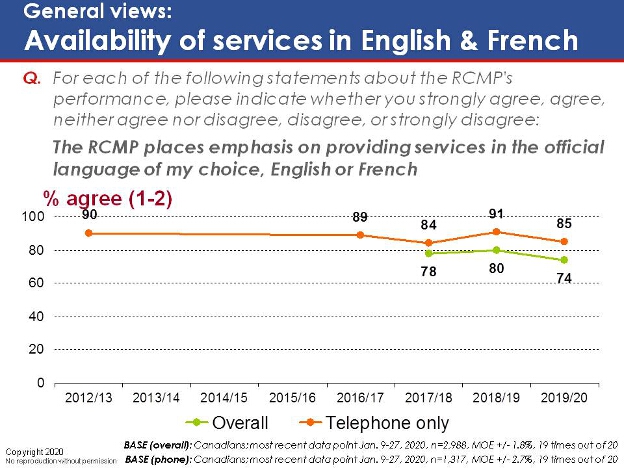
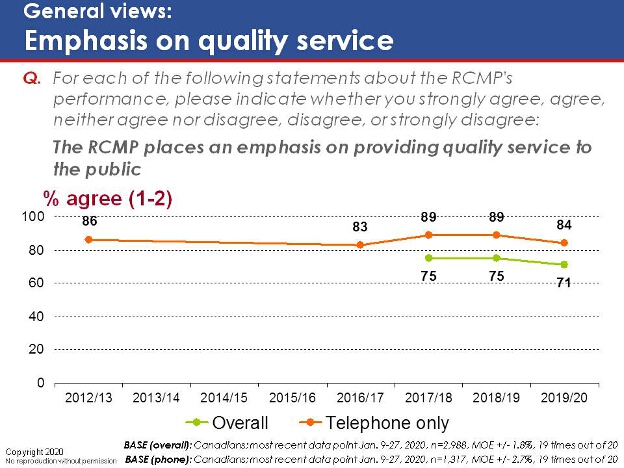
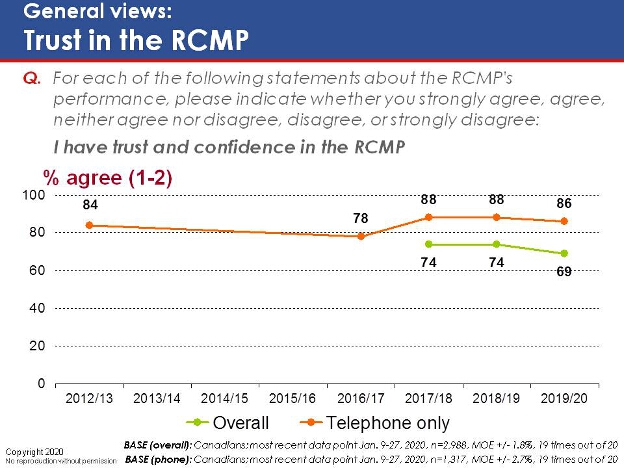
Respondents were presented with five general statements about the RCMP and asked to rate the extent to which they agree or disagree with each one. Once again, results reveal positive overall impressions of the RCMP. More than nine in ten (95 per cent) agree that the RCMP is a recognized symbol of Canada. Three-quarters (74 per cent) are satisfied with the RCMP's efforts to provide services in both official languages. Seven in ten agree that the RCMP prioritizes quality service (71 per cent), and express trust and confidence in the RCMP (69 per cent). Relatively few respondents (between two and 13 per cent) disagree with these statements.
However, results suggest the public perceive gaps in the RCMP's service offerings. Just half (50 per cent) say the RCMP provides the same quality of service to all citizens, and one in three (32 per cent) disagree with this statement.
Tracking (overall results) reveals a six-point drop in the proportion of Canadians who agree that the RCMP prioritizes bilingual services (74 per cent, down from 80 per cent in 2018/19). Other findings have remained largely stable over the past year.
Belief that the RCMP places emphasis on providing quality service rises with age (from 62 per cent among those under the age of 35 to 84 per cent among those ages 65 and over). Similarly, the likelihood of expressing trust and confidence in the RCMP also rises with age (from 62 per cent among those under 35 years of age to 79 per cent among those 65 and over). Those aged 65 and over are also more likely to agree the RCMP offers consistent service to all citizens (57 per cent, compared to 46 per cent among those under the age of 35).
Those with a high school level education are more likely to agree with most of these statements. For example, 66 per cent say the RCMP is consistent in the quality of service it provides, compared to 49 per cent of college graduates and 44 per cent of those who hold university degrees.
Those in the LGBTQ2 community express significantly less favourable views across the board (for example, just 28 per cent say the RCMP offers consistent service, compared to 50 per cent on average). Indigenous respondents also provided less favourable feedback when it came to the RCMP's status as a national symbol (84 per cent agree, compared to 95 per cent on average), the RCMP's quality of service (56 per cent versus 71 per cent), and the trust they place in the RCMP (54 per cent versus 69 per cent).
Views of the RCMP (General)
Views of the RCMP (General) - Text version
This chart has five horizontal stacked bars for overall results Based on a five-point scale where 4-5 means disagree, 3 means neither, and1-2 means agree.
Respondents were asked: "For each of the following statements about the RCMP's performance, please indicate whether you strongly agree, agree, neither agree nor disagree, disagree, or strongly disagree."
Respondents selected:
The RCMP is a recognized symbol of Canada: Disagree (2 per cent); neither (4 per cent); and agree (95 per cent).
The RCMP places emphasis on providing services in the official language of my choice, English or French: Disagree (7 per cent); neither (19 per cent); and agree (74 per cent).
The RCMP places an emphasis on providing quality service to the public: Disagree (11 per cent); neither (18 per cent); and agree (71 per cent).
I have trust and confidence in the RCMP: Disagree (13 per cent); neither (17 per cent); and agree (69 per cent).
The RCMP provides the same quality of service to all citizens: Disagree (32 per cent); neither (19 per cent); and agree (50 per cent).
Base (overall): Canadians; Jan. 9-27, 2020, n=2,988, MOE +/− 1.8%, 19 times out of 20
General views: Symbolic value of the RCMP
General views: Symbolic value of the RCMP - Text version
This chart is a line graph for overall and telephone only results – % agree (1-2) – for the years 2016/17, 2017/18, 2018/19 and 2019/20.
Respondents were asked: "For each of the following statements about the RCMP's performance, please indicate whether you strongly agree, agree, neither agree nor disagree, disagree, or strongly disagree: The RCMP is a recognized symbol of Canada."
Respondents selected:
Agree (1-2) 2016/17: telephone only (98 per cent);
Agree (1-2) 2017/18: overall (94 per cent); telephone only (98 per cent);
Agree (1-2) 2018/19: overall (95 per cent); telephone only (99 per cent);
Agree (1-2) 2019/20: overall (95 per cent); telephone only (98 per cent);
Base (overall): Canadians; most recent data point Jan. 9-27, 2020, n=2,988, MOE +/− 1.8%, 19 times out of 20
Base (phone): Canadians; most recent data point Jan. 9-27, 2020, n=1,317, MOE +/− 2.7%, 19 times out of 20
General views: Availability of services in English and French
General views: Availability of services in English and French - Text version
This chart is a line graph for overall and telephone only results – % agree (1-2) – for the years 2012/13, 2016/17, 2017/18, 2018/19 and 2019/20.
Respondents were asked: "For each of the following statements about the RCMP's performance, please indicate whether you strongly agree, agree, neither agree nor disagree, disagree, or strongly disagree: The RCMP places emphasis on providing services in the official language of my choice, English or French."
Respondents selected:
Agree (1-2) 2012/13: telephone only (90 per cent);
Agree (1-2) 2016/17: telephone only (89 per cent);
Agree (1-2) 2017/18: overall (78 per cent); telephone only (84 per cent);
Agree (1-2) 2018/19: overall (80 per cent); telephone only (91 per cent);
Agree (1-2) 2019/20: overall (74 per cent); telephone only (85 per cent);
Base (overall): Canadians; most recent data point Jan. 9-27, 2020, n=2,988, MOE +/− 1.8%, 19 times out of 20
Base (phone): Canadians; most recent data point Jan. 9-27, 2020, n=1,317, MOE +/− 2.7%, 19 times out of 20
General views: Emphasis on quality service
General views: Emphasis on quality service - Text version
This chart is a line graph for overall and telephone only results – % agree (1-2) – for the years 2012/13, 2016/17, 2017/18, 2018/19 and 2019/20.
Respondents were asked: "For each of the following statements about the RCMP's performance, please indicate whether you strongly agree, agree, neither agree nor disagree, disagree, or strongly disagree: The RCMP places an emphasis on providing quality service to the public."
Respondents selected:
Agree (1-2) 2012/13: telephone only (86 per cent);
Agree (1-2) 2016/17: telephone only (83 per cent);
Agree (1-2) 2017/18: overall (75 per cent); telephone only (89 per cent);
Agree (1-2) 2018/19: overall (75 per cent); telephone only (89 per cent);
Agree (1-2) 2019/20: overall (71 per cent); telephone only (84 per cent);
Base (overall): Canadians; most recent data point Jan. 9-27, 2020, n=2,988, MOE +/− 1.8%, 19 times out of 20
Base (phone): Canadians; most recent data point Jan. 9-27, 2020, n=1,317, MOE +/− 2.7%, 19 times out of 20
General views: Trust in the RCMP
General views: Trust in the RCMP - Text version
This chart is a line graph for overall and telephone only results – % agree (1-2) – for the years 2012/13, 2016/17, 2017/18, 2018/19 and 2019/20.
Respondents were asked: "For each of the following statements about the RCMP's performance, please indicate whether you strongly agree, agree, neither agree nor disagree, disagree, or strongly disagree: I have trust and confidence in the RCMP."
Respondents selected:
Agree (1-2) 2012/13: telephone only (84 per cent);
Agree (1-2) 2016/17: telephone only (78 per cent);
Agree (1-2) 2017/18: overall (74 per cent); telephone only (88 per cent);
Agree (1-2) 2018/19: overall (74 per cent); telephone only (88 per cent);
Agree (1-2) 2019/20: overall (69 per cent); telephone only (86 per cent);
Base (overall): Canadians; most recent data point Jan. 9-27, 2020, n=2,988, MOE +/− 1.8%, 19 times out of 20
Base (phone): Canadians; most recent data point Jan. 9-27, 2020, n=1,317, MOE +/− 2.7%, 19 times out of 20
2.6 Views of the RCMP (Leadership)
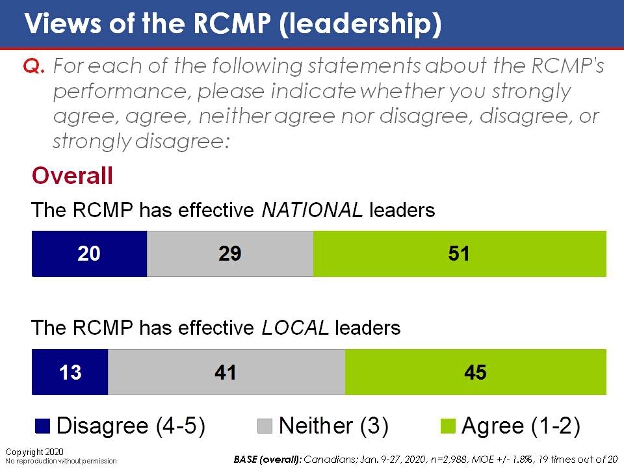
While Canadians have a high degree of confidence in the RCMP in general, they award lower marks when it comes to the calibre of its leadership. Respondents also made little distinction between the different levels of leadership; 51 per cent rate the RCMP's national leaders as effective (compared to 20 per cent who disagree), and slightly fewer (45 per cent) offer a positive appraisal of its local leaders (versus 13 per cent who disagree).
Tracking (overall) suggests that trust in the RCMP's has eroded somewhat over the past year. The proportion of Canadians who say they trust the RCMP's national leaders is down six points from 2018/19, while trust in its local leadership is down nine points.
Those ages 65 and over are more likely to express confidence in both the RCMP's national leaders (65 per cent, compared to 51 per cent on average) and its local leaders (60 per cent versus 44 per cent).
Those with a high school education are more likely to assign favourable ratings to RCMP's leadership at both the national level (65 per cent, compared to 51 per cent on average) and the local level (63 per cent versus 45 per cent).
Residents of Atlantic Canada express a higher degree of confidence in the RCMP's local leadership (64 per cent versus 45 per cent).
Views of the RCMP (Leadership)
Views of the RCMP (Leadership) - Text version
This chart has two horizontal stacked bar for overall results Based on a five-point scale where 4-5 means disagree, 3 means neither, and1-2 means agree.
Respondents were asked: "For each of the following statements about the RCMP's performance, please indicate whether you strongly agree, agree, neither agree nor disagree, disagree, or strongly disagree."
Respondents selected:
The RCMP has effective national leaders: Disagree (20 per cent); neither (29 per cent); and agree (51 per cent).
The RCMP has effective local leaders: Disagree (13 per cent); neither (41 per cent); and agree (45 per cent).
Base (overall): Canadians; Jan. 9-27, 2020, n=2,988, MOE +/− 1.8%, 19 times out of 20
Leadership: Effectiveness of national leaders
Leadership: Effectiveness of national leaders - Text version
This chart is a line graph for overall results – % agree (1-2) – for the years 2017/18, 2018/19 and 2019/20.
Respondents were asked: "For each of the following statements about the RCMP's performance, please indicate whether you strongly agree, agree, neither agree nor disagree, disagree, or strongly disagree: The RCMP has effective national leaders."
Respondents selected:
Agree (1-2) 2017/18: overall (48 per cent);
Agree (1-2) 2018/19: overall (57 per cent);
Agree (1-2) 2019/20: overall (51 per cent);
Base (overall): Canadians; most recent data point Jan. 9-27, 2020, n=2,988, MOE +/− 1.8%, 19 times out of 20
Leadership: Effectiveness of local leaders
Leadership: Effectiveness of local leaders - Text version
This chart is a line graph for overall results – % agree (1-2) – for the years 2017/18, 2018/19 and 2019/20.
Respondents were asked: "For each of the following statements about the RCMP's performance, please indicate whether you strongly agree, agree, neither agree nor disagree, disagree, or strongly disagree: The RCMP has effective local leaders."
Respondents selected:
Agree (1-2) 2017/18: overall (51 per cent);
Agree (1-2) 2018/19: overall (54 per cent);
Agree (1-2) 2019/20: overall (45 per cent);
Base (overall): Canadians; most recent data point Jan. 9-27, 2020, n=2,988, MOE +/− 1.8%, 19 times out of 20
2.7 Views of the RCMP (Transparency)
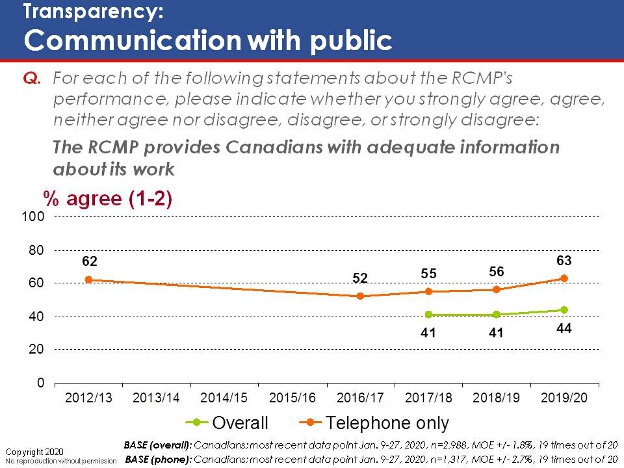
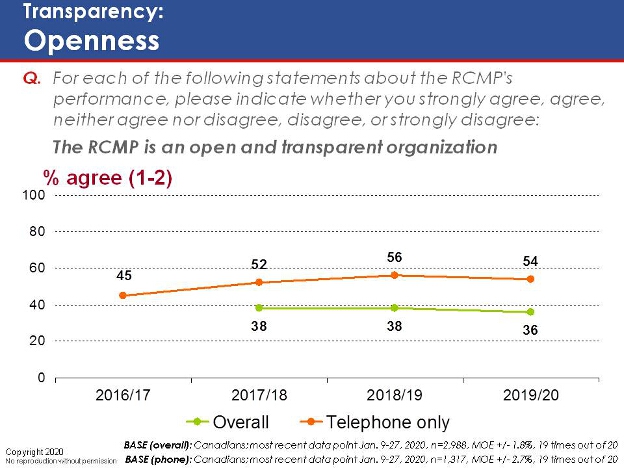
The RCMP receives mixed reviews when it comes to issues related to innovation and transparency. Fewer than half of respondents (46 per cent) agree that the RCMP is a forward-looking and innovative organisation, (compared to one in four – 24 per cent – who disagree), while a similar proportion (44 per cent) are satisfied with the level of information that the RCMP provides about its work (compared to one-third – 33 per cent – who express dissatisfaction in this area). Respondents are sharply divided on whether the RCMP could be considered an open and transparent organization – 36 per cent agree with this assessment, while virtually the same proportion (38 per cent) disagree (although it is possible that Canadians may see the RCMP as appropriately not transparent, given the type of information they hold – e.g., criminal records, witness addresses, information before the courts, investigative techniques, etc.).
Tracking reveals that these results are largely unchanged from last year.
Those ages 65 and over are more apt to agree that the RCMP is a forward-looking, open organization (59 per cent, compared to 46 per cent on average).
The likelihood of expressing favourable views of the RCMP in terms of its transparency declines with educational attainment. For example, 51 per cent of high school educated respondents deem the RCMP an open and transparent organization, a figure that declines to just 28 per cent among university graduates.
Regionally, those who reside in Atlantic Canada are more likely to say that the RCMP is a forward-looking, innovative organization (56 per cent, compared to 46 per cent on average).
Those in the LGBTQ2 community consistently gave the RCMP poorer marks on issues related to transparency. For example, 23 per cent believe the RCMP to be open and transparent, compared to 36 per cent on average.
Views of the RCMP (Transparency)
Views of the RCMP (Transparency) - Text version
This chart has three horizontal stacked bars for overall results Based on a five-point scale where 4-5 means disagree, 3 means neither, and1-2 means agree.
Respondents were asked: "For each of the following statements about the RCMP's performance, please indicate whether you strongly agree, agree, neither agree nor disagree, disagree, or strongly disagree."
Respondents selected:
The RCMP is a forward-looking, innovative organization: Disagree (24 per cent); neither (31 per cent); and agree (46 per cent).
The RCMP provides Canadians with adequate information about its work: Disagree (33 per cent); neither (23 per cent); and agree (44 per cent).
The RCMP is an open and transparent organization: Disagree (38 per cent); neither (26 per cent); and agree (36 per cent).
Base (overall): Canadians; Jan. 9-27, 2020, n=2,988, MOE +/− 1.8%, 19 times out of 20
Transparency: Innovation
Transparency: Innovation - Text version
This chart is a line graph for overall and telephone only results – % agree (1-2) – for the years 2016/17, 2017/18, 2018/19 and 2019/20.
Respondents were asked: "For each of the following statements about the RCMP's performance, please indicate whether you strongly agree, agree, neither agree nor disagree, disagree, or strongly disagree The RCMP is a forward-looking, innovative organization."
Respondents selected:
Agree (1-2) 2016/17: telephone only (59 per cent);
Agree (1-2) 2017/18: overall (44 per cent); telephone only (64 per cent);
Agree (1-2) 2018/19: overall (45 per cent); telephone only (62 per cent);
Agree (1-2) 2019/20: overall (46 per cent); telephone only (66 per cent);
Base (overall): Canadians; most recent data point Jan. 9-27, 2020, n=2,988, MOE +/− 1.8%, 19 times out of 20
Base (phone): Canadians; most recent data point Jan. 9-27, 2020, n=1,317, MOE +/− 2.7%, 19 times out of 20
Transparency: Communication with the public
Transparency: Communication with the public - Text version
This chart is a line graph for overall and telephone only results – % agree (1-2) – for the years 2012/13, 2016/17, 2017/18, 2018/19 and 2019/20.
Respondents were asked: "For each of the following statements about the RCMP's performance, please indicate whether you strongly agree, agree, neither agree nor disagree, disagree, or strongly disagree: The RCMP provides Canadians with adequate information about its work."
Respondents selected:
Agree (1-2) 2012/13: telephone only (62 per cent);
Agree (1-2) 2016/17: telephone only (52 per cent);
Agree (1-2) 2017/18: overall (41 per cent); telephone only (55 per cent);
Agree (1-2) 2018/19: overall (41 per cent); telephone only (56 per cent);
Agree (1-2) 2019/20: overall (44 per cent); telephone only (63 per cent);
Base (overall): Canadians; most recent data point Jan. 9-27, 2020, n=2,988, MOE +/− 1.8%, 19 times out of 20
Base (phone): Canadians; most recent data point Jan. 9-27, 2020, n=1,317, MOE +/− 2.7%, 19 times out of 20
Transparency: Openness
Transparency: Openness - Text version
This chart is a line graph for overall and telephone only results – % agree (1-2) – for the years 2016/17, 2017/18, 2018/19 and 2019/20.
Respondents were asked: "For each of the following statements about the RCMP's performance, please indicate whether you strongly agree, agree, neither agree nor disagree, disagree, or strongly disagree: The RCMP is an open and transparent organization."
Respondents selected:
Agree (1-2) 2016/17: telephone only (45 per cent);
Agree (1-2) 2017/18: overall (38 per cent); telephone only (52 per cent);
Agree (1-2) 2018/19: overall (38 per cent); telephone only (56 per cent);
Agree (1-2) 2019/20: overall (36 per cent); telephone only (54 per cent);
Base (overall): Canadians; most recent data point Jan. 9-27, 2020, n=2,988, MOE +/− 1.8%, 19 times out of 20
Base (phone): Canadians; most recent data point Jan. 9-27, 2020, n=1,317, MOE +/− 2.7%, 19 times out of 20
2.8 Views of the RCMP (Sensitivity)
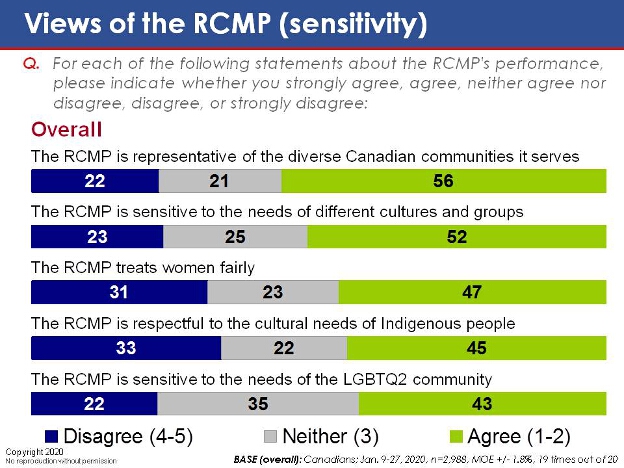
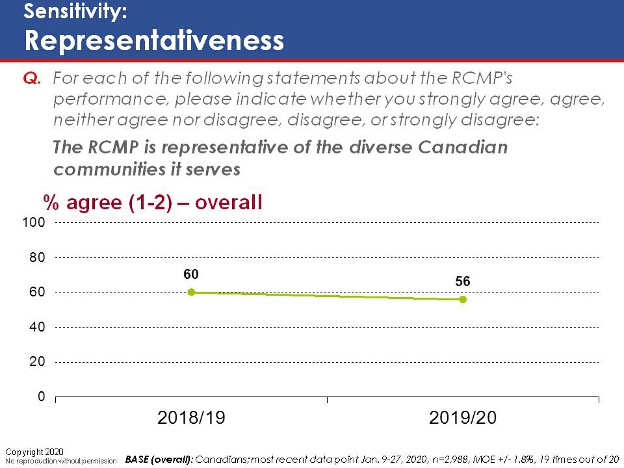
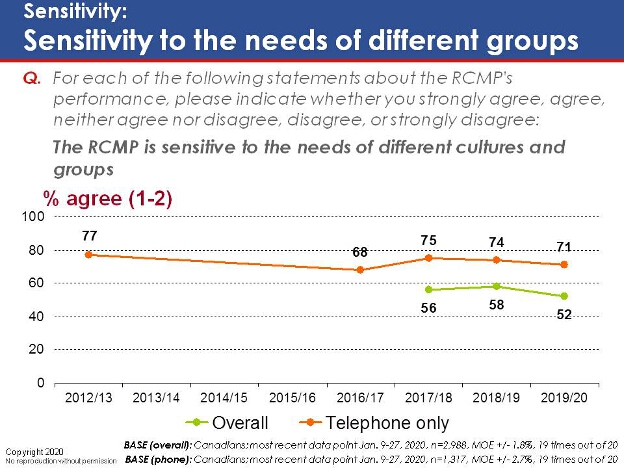
The RCMP scores moderately well on broader indicators related to sensitivity. More than half of respondents believe that the RCMP is representative of the diverse communities it serves (56 per cent, compared to 22 per cent who disagree) and that it is sensitive to the needs of Canada's various cultures and groups (52 per cent versus 23 per cent).
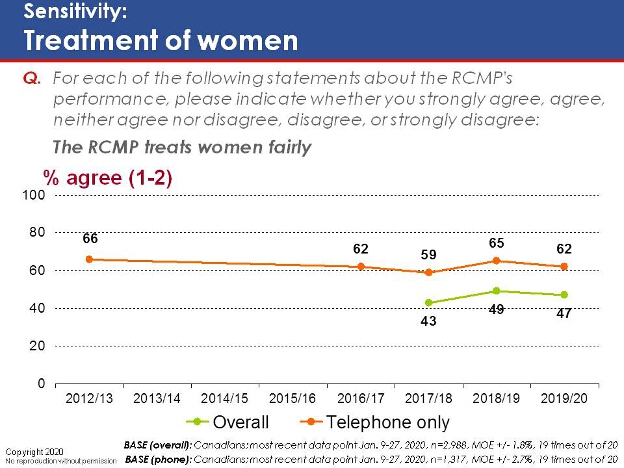
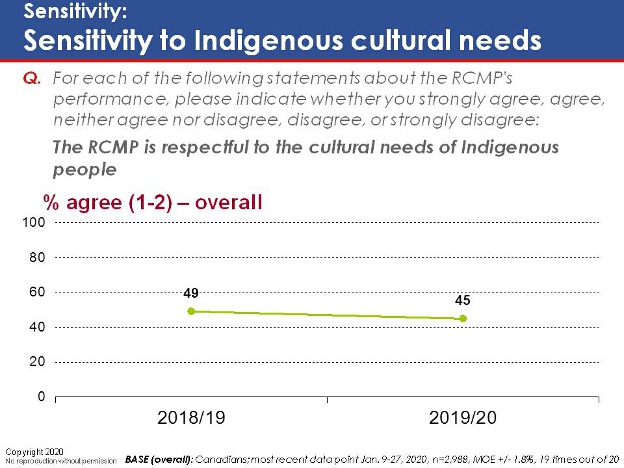
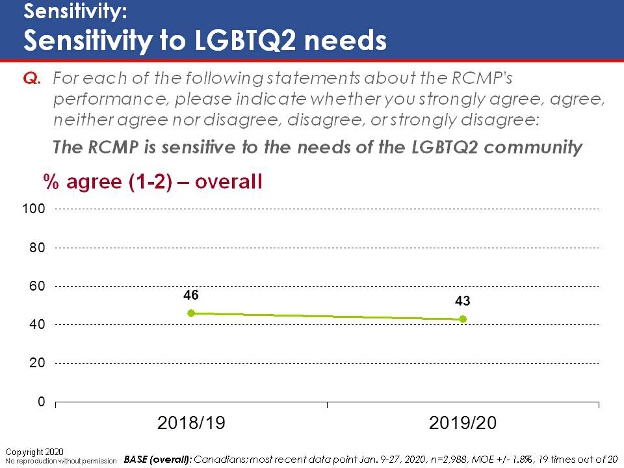
When the scope of the questions is narrowed to focus on specific groups, however, the RCMP elicits less favourable reviews. Fewer than half of respondents agree that the RCMP treats women fairly (47 per cent, compared to 31 per cent who disagree), that it is respectful to the cultural needs of Indigenous people (45 per cent versus 33 per cent), or that it is sensitive to the needs of the LGBTQ2 community (43 per cent versus 22 per cent, while the remaining 35 per cent neither agree nor disagree, suggesting a fair degree of uncertainty on the matter).
Tracking (overall results) reveals a six-point decrease in agreement over the past year that the RCMP is sensitive to varying cultural needs.
When it comes to the broader indicators of sensitivity, the likelihood of offering a positive appraisal of the RCMP rises with age. For example, 46 per cent of those under the age of 35 believe the RCMP is sensitive to the needs of different cultures and groups, compared to 58 per cent of those ages 65 and over.
Agreement with these statements consistently declines with educational attainment. For example, 67 per cent of high school graduates feel the RCMP is sensitive to varying cultural needs, compared to 45 per cent of university graduates.
LGBTQ2 respondents are significantly less likely to agree with these statements. Of particular note, just 22 per cent agree that the RCMP is sensitive to the needs of the LGBTQ2 community, compared to 43 per cent on average.
Interestingly, when compared to other Canadians, Indigenous respondents are more likely to indicate that they neither agree nor disagree that the RCMP is respectful of Indigenous cultural needs.
Views of the RCMP (Sensitivity)
Views of the RCMP (Sensitivity) - Text version
This chart has five horizontal stacked bars for overall results Based on a five-point scale where 4-5 means disagree, 3 means neither, and1-2 means agree.
Respondents were asked: "For each of the following statements about the RCMP's performance, please indicate whether you strongly agree, agree, neither agree nor disagree, disagree, or strongly disagree." Respondents selected:
The RCMP is representative of the diverse Canadian communities it serves: Disagree (22 per cent); neither (21 per cent); and agree (56 per cent).
The RCMP is sensitive to the needs of different cultures and groups: Disagree (23 per cent); neither (25 per cent); and agree (52 per cent).
The RCMP treats women fairly: Disagree (31 per cent); neither (23 per cent); and agree (47 per cent).
The RCMP is respectful to the cultural needs of Indigenous people: Disagree (33 per cent); neither (22 per cent); and agree (45 per cent).
The RCMP is sensitive to the needs of the LGBTQ2 community: Disagree (22 per cent); neither (35 per cent); and agree (43 per cent).
Base (overall): Canadians; Jan. 9-27, 2020, n=2,988, MOE +/− 1.8%, 19 times out of 20
Sensitivity: Representativeness
Sensitivity: Representativeness - Text version
This chart is a line graph for overall results – % agree (1-2) – for the years 2018/19 and 2019/20.
Respondents were asked: "For each of the following statements about the RCMP's performance, please indicate whether you strongly agree, agree, neither agree nor disagree, disagree, or strongly disagree: The RCMP is representative of the diverse Canadian communities it serves."
Respondents selected:
Agree (1-2) 2018/19: overall (60 per cent);
Agree (1-2) 2019/20: overall (56 per cent);
Base (overall): Canadians; most recent data point Jan. 9-27, 2020, n=2,988, MOE +/− 1.8%, 19 times out of 20
Sensitivity: Sensitivity to the needs of different groups
Sensitivity: Sensitivity to the needs of different groups - Text version
This chart is a line graph for overall and telephone only results – % agree (1-2) – for the years 2012/13, 2016/17, 2017/18, 2018/19 and 2019/20.
Respondents were asked: "For each of the following statements about the RCMP's performance, please indicate whether you strongly agree, agree, neither agree nor disagree, disagree, or strongly disagree: The RCMP is sensitive to the needs of different cultures and groups."
Respondents selected:
Agree (1-2) 2012/13: telephone only (77 per cent);
Agree (1-2) 2016/17: telephone only (68 per cent);
Agree (1-2) 2017/18: overall (56 per cent); telephone only (75 per cent);
Agree (1-2) 2018/19: overall (58 per cent); telephone only (74 per cent);
Agree (1-2) 2019/20: overall (52 per cent); telephone only (71 per cent);
Base (overall): Canadians; most recent data point Jan. 9-27, 2020, n=2,988, MOE +/− 1.8%, 19 times out of 20
Base (phone): Canadians; most recent data point Jan. 9-27, 2020, n=1,317, MOE +/− 2.7%, 19 times out of 20
Sensitivity: Treatment of women
Sensitivity: Treatment of women - Text version
This chart is a line graph for overall and telephone only results – % agree (1-2) – for the years 2012/13, 2016/17, 2017/18, 2018/19 and 2019/20.
Respondents were asked: "For each of the following statements about the RCMP's performance, please indicate whether you strongly agree, agree, neither agree nor disagree, disagree, or strongly disagree: The RCMP treats women fairly."
Respondents selected:
Agree (1-2) 2012/13: telephone only (66 per cent);
Agree (1-2) 2016/17: telephone only (62 per cent);
Agree (1-2) 2017/18: overall (43 per cent); telephone only (59 per cent);
Agree (1-2) 2018/19: overall (49 per cent); telephone only (65 per cent);
Agree (1-2) 2019/20: overall (47 per cent); telephone only (62 per cent);
Base (overall): Canadians; most recent data point Jan. 9-27, 2020, n=2,988, MOE +/− 1.8%, 19 times out of 20
Base (phone): Canadians; most recent data point Jan. 9-27, 2020, n=1,317, MOE +/− 2.7%, 19 times out of 20
Sensitivity: Sensitivity to Indigenous cultural needs
Sensitivity: Sensitivity to Indigenous cultural needs - Text version
This chart is a line graph for overall results – % agree (1-2) – for the years 2018/19 and 2019/20.
Respondents were asked: "For each of the following statements about the RCMP's performance, please indicate whether you strongly agree, agree, neither agree nor disagree, disagree, or strongly disagree: The RCMP is respectful to the cultural needs of Indigenous people."
Respondents selected:
Agree (1-2) 2018/19: overall (49 per cent);
Agree (1-2) 2019/20: overall (45 per cent);
Base (overall): Canadians; most recent data point Jan. 9-27, 2020, n=2,988, MOE +/− 1.8%, 19 times out of 20
Sensitivity: Sensitivity to LGBTQ2 needs
Sensitivity: Sensitivity to LGBTQ2 needs - Text version
This chart is a line graph for overall results – % agree (1-2) – for the years 2018/19 and 2019/20.
Respondents were asked: "For each of the following statements about the RCMP's performance, please indicate whether you strongly agree, agree, neither agree nor disagree, disagree, or strongly disagree: The RCMP is sensitive to the needs of the LGBTQ2 community."
Respondents selected:
Agree (1-2) 2018/19: overall (46 per cent);
Agree (1-2) 2019/20: overall (43 per cent);
Base (overall): Canadians; most recent data point Jan. 9-27, 2020, n=2,988, MOE +/− 1.8%, 19 times out of 20
2.9 Views of the RCMP (Relationship With RCMP)
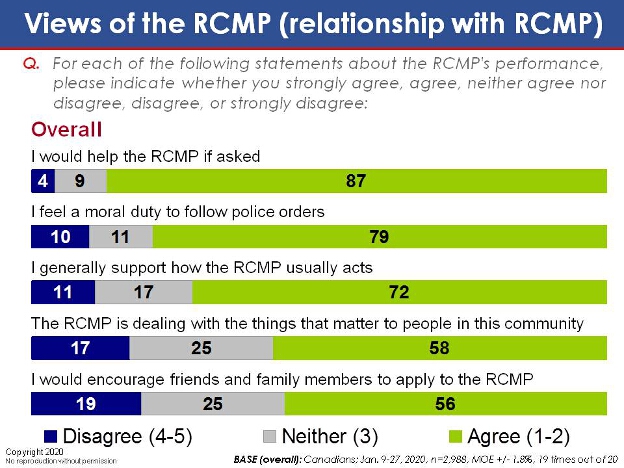
Results suggest that the RCMP maintains a widely positive relationship with the public. The vast majority of respondents (87 per cent) say they would help the RCMP if asked, while eight in ten (79 per cent) believe they have a moral obligation to follow police orders. Seven in ten (72 per cent) say they generally support the RCMP's actions. Roughly six in ten agree that the RCMP is dealing with things that matter to their community (58 per cent) and would encourage friends and family to consider the RCMP as a career path (56 per cent).
Women are more apt to express a sense of duty when it comes to following police orders (85 per cent, compared to 74 per cent of men).
Agreement with these statements is positively correlated with age. For example, 67 per cent of those under the age of 35 feel morally bound to follow police orders, a figure that rises to 91 per cent among those ages 65 and over.
High school graduates are more likely to agree that the RCMP deals with matters that are important to their community (67 per cent, compared to 58 per cent on average). The likelihood of encouraging friends and family to apply to the RCMP declines with educational attainment (from 63 per cent among high school graduates to 51 per cent among those with university degrees).
Atlantic Canadians are more likely to say they are generally supportive of how the RCMP conducts itself (82 per cent, compared to 72 per cent on average) and that they believe the RCMP addresses issues that are important to their community (71 per cent versus 58 per cent).
Members of Canada's LGBTQ2 and Indigenous communities consistently express a dimmer view of their relationship with the RCMP (for example, just 56 per cent of LGBTQ2 respondents and 64 per cent of Indigenous respondents convey a sense of obligation to follow police orders, compared to 79 per cent on average). Those who identify as visible minorities are less apt to say the RCMP focuses on matters that directly impact their communities (46 per cent, compared to 58 per cent on average).
Views of the RCMP (Relationship With RCMP)
Views of the RCMP (Relationship With RCMP) - Text version
This chart has five horizontal stacked bars for overall results Based on a five-point scale where 4-5 means disagree, 3 means neither, and1-2 means agree.
Respondents were asked: "For each of the following statements about the RCMP's performance, please indicate whether you strongly agree, agree, neither agree nor disagree, disagree, or strongly disagree."
Respondents selected:
I would help the RCMP if asked: Disagree (4 per cent); neither (9 per cent); and agree (87 per cent).
I feel a moral duty to follow police orders: Disagree (10 per cent); neither (11 per cent); and agree (79 per cent).
I generally support how the RCMP usually acts: Disagree (11 per cent); neither (17 per cent); and agree (72 per cent).
The RCMP is dealing with the things that matter to people in this community: Disagree (17 per cent); neither (25 per cent); and agree (58 per cent).
I would encourage friends and family members to apply to the RCMP: Disagree (19 per cent); neither (25 per cent); and agree (56 per cent).
Base (overall): Canadians; Jan. 9-27, 2020, n=2,988, MOE +/− 1.8%, 19 times out of 20
2.10 Views of the RCMP (Visibility)
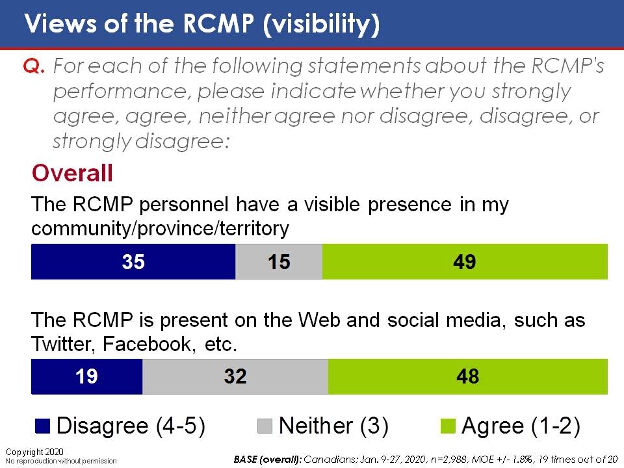
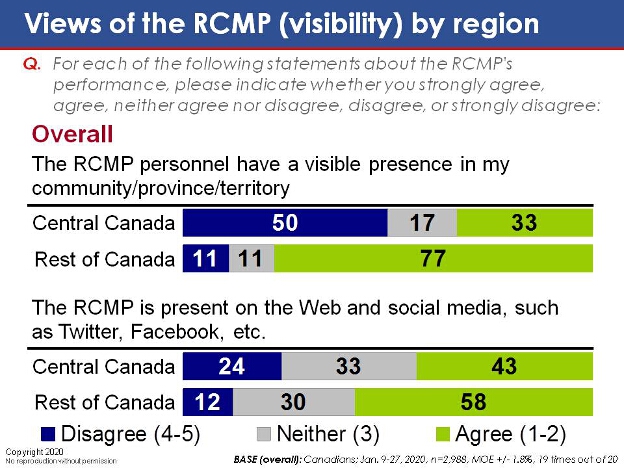
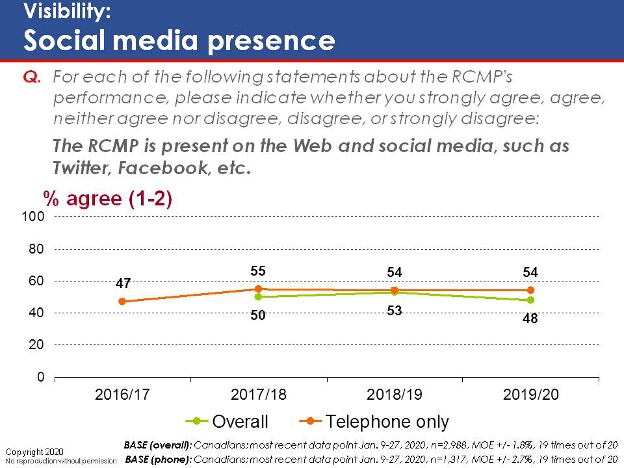
Outside of Ontario and Quebec, where residents deal primarily with their province's respective police forces rather than the RCMP, respondents rate the RCMP quite favourably in terms of visibility. Overall, half (49 per cent) agree that RCMP personnel have a visible presence in their community; however, this figure jumps to 77 per cent outside of Central Canada. A similar overall proportion (48 per cent) agree that the RCMP maintains an active presence on social media but, again, this figure is diluted by the comparatively lower levels of agreement from Central Canada.
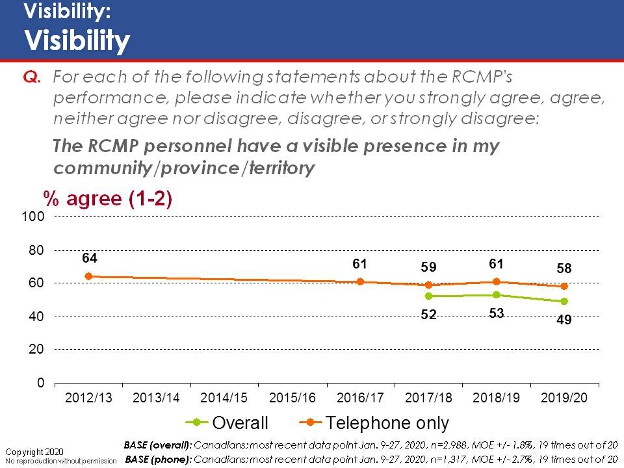
Tracking reveals that these results have remained relatively stable over the past few years.
High school graduates are more likely to agree that the RCMP is visibly present both in their community (59 per cent, compared to 49 per cent on average) and online (57 per cent versus 48 per cent).
Regionally, the proportion of Canadians who agree that the RCMP is visible in their community is much higher in Atlantic Canada (78 per cent), British Columbia (77 per cent), and the Prairies (75 per cent) when compared to Central Canada (31 per cent). Similarly, belief that the RCMP is present on social media is higher in Atlantic Canada (62 per cent), the Prairies (57 per cent), and British Columbia (55 per cent) when compared to Ontario and Quebec (43 per cent).
Views of the RCMP (Visibility)
Views of the RCMP (Visibility) - Text version
This chart has two horizontal stacked bars for overall results Based on a five-point scale where 4-5 means disagree, 3 means neither, and1-2 means agree.
Respondents were asked: "For each of the following statements about the RCMP's performance, please indicate whether you strongly agree, agree, neither agree nor disagree, disagree, or strongly disagree."
Respondents selected:
The RCMP personnel have a visible presence in my community/province/territory: Disagree (35 per cent); neither (15 per cent); and agree (49 per cent).
The RCMP is present on the Web and social media, such as Twitter, Facebook, etc.: Disagree (19 per cent); neither (32 per cent); and agree (48 per cent).
Base (overall): Canadians; Jan. 9-27, 2020, n=2,988, MOE +/− 1.8%, 19 times out of 20
Views of the RCMP (visibility) by region
Views of the RCMP (visibility) by region - Text version
This chart has four horizontal stacked bars for overall results for Central Canada and Rest of Canada, Based on a five-point scale where 4-5 means disagree, 3 means neither, and1-2 means agree.
Respondents were asked: "For each of the following statements about the RCMP's performance, please indicate whether you strongly agree, agree, neither agree nor disagree, disagree, or strongly disagree."
Respondents selected:
The RCMP personnel have a visible presence in my community/province/territory:
Central Canada: Disagree (50 per cent); neither (17 per cent); and agree (33 per cent).
Rest of Canada: Disagree (11 per cent); neither (11 per cent); and agree (77 per cent).
The RCMP is present on the Web and social media, such as Twitter, Facebook, etc.:
Central Canada: Disagree (24 per cent); neither (33 per cent); and agree (43 per cent).
Rest of Canada: Disagree (12 per cent); neither (30 per cent); and agree (58 per cent).
Base (overall): Canadians; Jan. 9-27, 2020, n=2,988, MOE +/− 1.8%, 19 times out of 20
Visibility: Visiblity
Visibility: Visiblity - Text version
This chart is a line graph for overall and telephone only results – % agree (1-2) – for the years 2012/13, 2016/17, 2017/18, 2018/19 and 2019/20.
Respondents were asked: "For each of the following statements about the RCMP's performance, please indicate whether you strongly agree, agree, neither agree nor disagree, disagree, or strongly disagree: The RCMP personnel have a visible presence in my community/province/territory."
Respondents selected:
Agree (1-2) 2012/13: telephone only (64 per cent);
Agree (1-2) 2016/17: telephone only (61 per cent);
Agree (1-2) 2017/18: overall (52 per cent); telephone only (59 per cent);
Agree (1-2) 2018/19: overall (53 per cent); telephone only (61 per cent);
Agree (1-2) 2019/20: overall (49 per cent); telephone only (58 per cent);
Base (overall): Canadians; most recent data point Jan. 9-27, 2020, n=2,988, MOE +/− 1.8%, 19 times out of 20
Base (phone): Canadians; most recent data point Jan. 9-27, 2020, n=1,317, MOE +/− 2.7%, 19 times out of 20
Visibility: Social media presence
Visibility: Social media presence - Text version
This chart is a line graph for overall and telephone only results – % agree (1-2) – for the years 2016/17, 2017/18, 2018/19 and 2019/20.
Respondents were asked: "For each of the following statements about the RCMP's performance, please indicate whether you strongly agree, agree, neither agree nor disagree, disagree, or strongly disagree: The RCMP is present on the Web and social media, such as Twitter, Facebook, etc.."
Respondents selected:
Agree (1-2) 2016/17: telephone only (47 per cent);
Agree (1-2) 2017/18: overall (50 per cent); telephone only (55 per cent);
Agree (1-2) 2018/19: overall (53 per cent); telephone only (54 per cent);
Agree (1-2) 2019/20: overall (48 per cent); telephone only (54 per cent);
Base (overall): Canadians; most recent data point Jan. 9-27, 2020, n=2,988, MOE +/− 1.8%, 19 times out of 20
Base (phone): Canadians; most recent data point Jan. 9-27, 2020, n=1,317, MOE +/− 2.7%, 19 times out of 20
2.11 Views of the RCMP (Responsiveness)
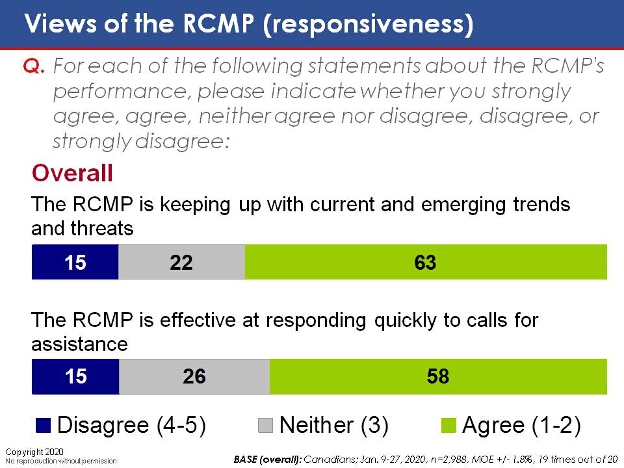
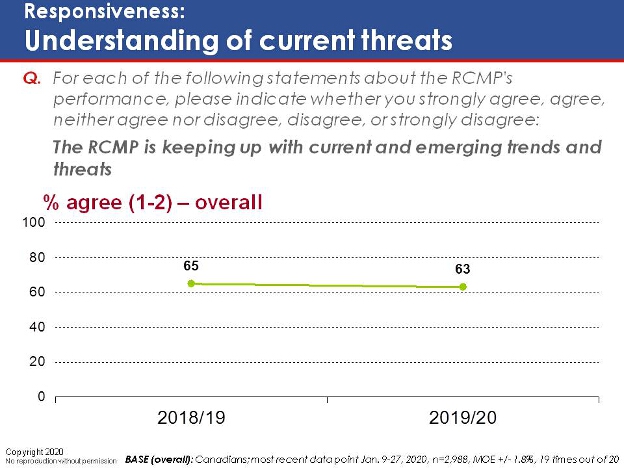
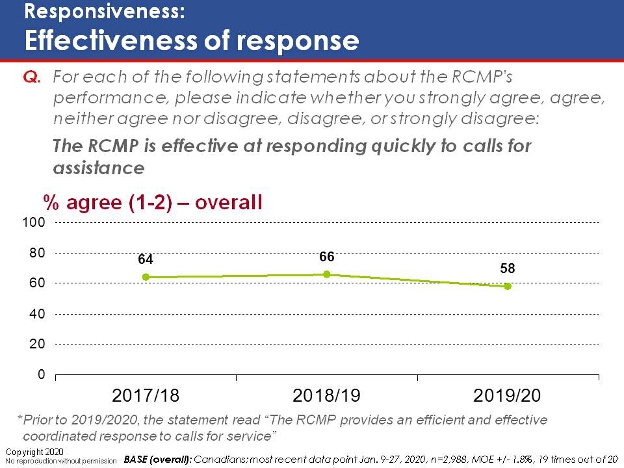
Turning to views on responsiveness, results reveal that Canadians hold generally positive views of the RCMP in this area. About six in ten agree that the RCMP keeps up with current and emerging threats (63 per cent) and that it is quick to respond to calls for assistance (58 per cent). Fewer than one in five disagree with either of these statements.
Tracking reveals that results have largely remained stable over the past few years.[5]
Those aged 65 and over are more apt to agree that the RCMP keeps itself informed of emerging threats (75 per cent, compared to 63 per cent on average) and that the RCMP responds to calls for assistance quickly (72 per cent versus 58 per cent).
Agreement with both statements declines with educational attainment. For instance, 72 per cent of respondents with a high school level education believe the RCMP keeps abreast of current risks to public safely, compared to 58 per cent of university graduates.
Atlantic Canadians are more likely to say the RCMP responds to calls quickly (67 per cent, compared to 58 per cent on average).
Those in the LGBTQ2 community rate the RCMP more poorly along both measures; 43 per cent say the RCMP is keeping up with evolving trends and threats (compared to 63 per cent on average) and 47 per cent believe the organization responds to calls in a timely manner (versus 58 per cent). Indigenous respondents are less likely to express positive views on the RCMP's response time (48 per cent, compared to 58 per cent on average), while visible minorities are less apt to agree that the RCMP stays on top of risks to public safety (51 per cent versus 63 per cent).
Views of the RCMP (Responsiveness)
Views of the RCMP (Responsiveness) - Text version
This chart has two horizontal stacked bars for overall results Based on a five-point scale where 4-5 means disagree, 3 means neither, and1-2 means agree.
Respondents were asked: "For each of the following statements about the RCMP's performance, please indicate whether you strongly agree, agree, neither agree nor disagree, disagree, or strongly disagree."
Respondents selected:
The RCMP is keeping up with current and emerging trends and threats: Disagree (15 per cent); neither (22 per cent); and agree (63 per cent).
The RCMP is effective at responding quickly to calls for assistance: Disagree (15 per cent); neither (26 per cent); and agree (58 per cent).
Base (overall): Canadians; Jan. 9-27, 2020, n=2,988, MOE +/− 1.8%, 19 times out of 20
Responsiveness: Understanding of current threats
Responsiveness: Understanding of current threats - Text version
This chart is a line graph for overall results – % agree (1-2) – for the years 2018/19 and 2019/20.
Respondents were asked: "For each of the following statements about the RCMP's performance, please indicate whether you strongly agree, agree, neither agree nor disagree, disagree, or strongly disagree: The RCMP is keeping up with current and emerging trends and threats."
Respondents selected:
Agree (1-2) 2018/19: overall (65 per cent);
Agree (1-2) 2019/20: overall (63 per cent);
Base (overall): Canadians; most recent data point Jan. 9-27, 2020, n=2,988, MOE +/− 1.8%, 19 times out of 20
Responsiveness: Effectiveness of response
Responsiveness: Effectiveness of response - Text version
This chart is a line graph for overall results – % agree (1-2) – for the years 2017/18, 2018/19 and 2019/20.
Respondents were asked: "For each of the following statements about the RCMP's performance, please indicate whether you strongly agree, agree, neither agree nor disagree, disagree, or strongly disagree: The RCMP is effective at responding quickly to calls for assistance."
Respondents selected:
Agree (1-2) 2017/18: overall (64 per cent);
Agree (1-2) 2018/19: overall (66 per cent);
Agree (1-2) 2019/20: overall (58 per cent);
Base (overall): Canadians; most recent data point Jan. 9-27, 2020, n=2,988, MOE +/− 1.8%, 19 times out of 20
2.12 Impact of the RCMP
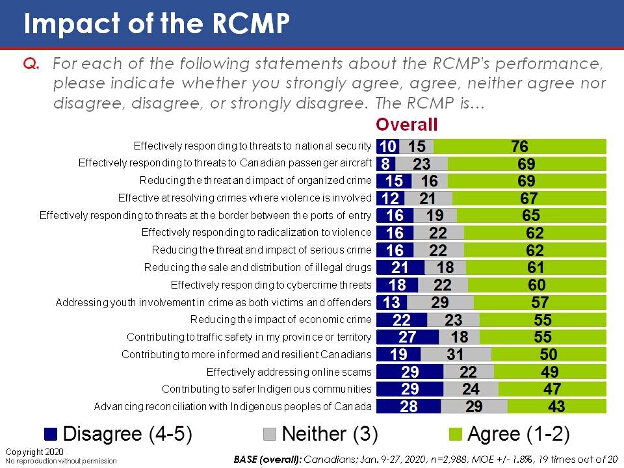
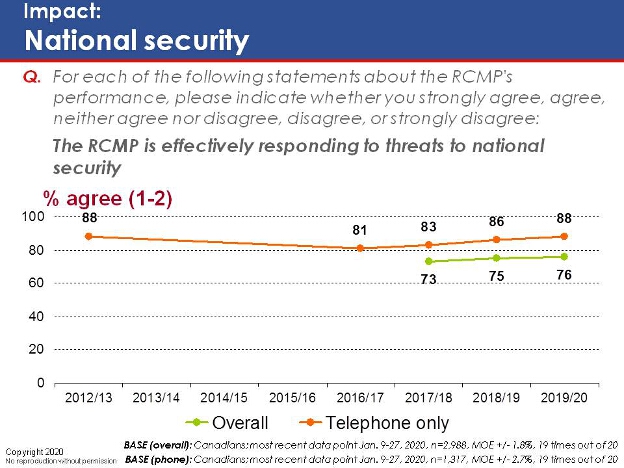
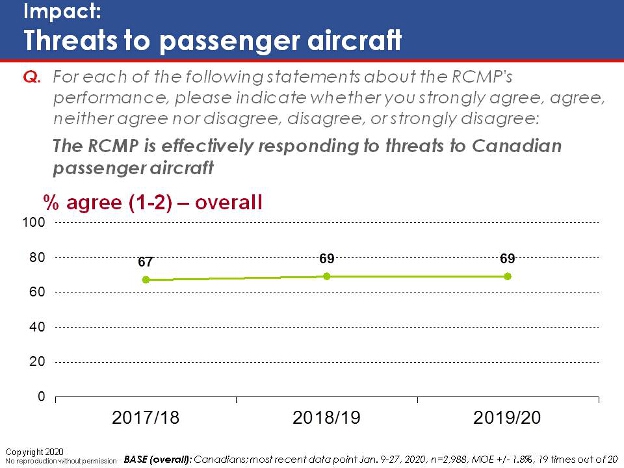
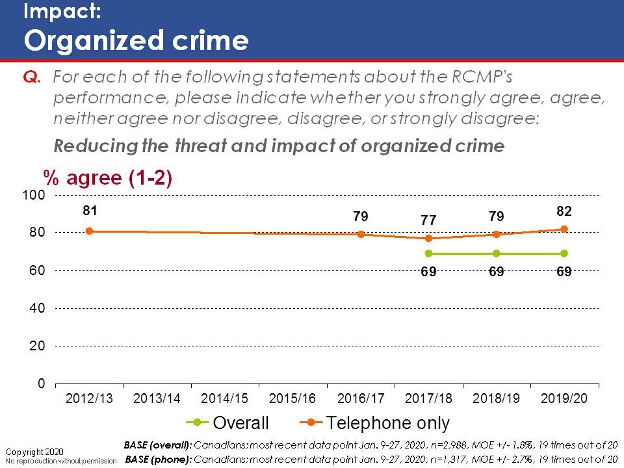
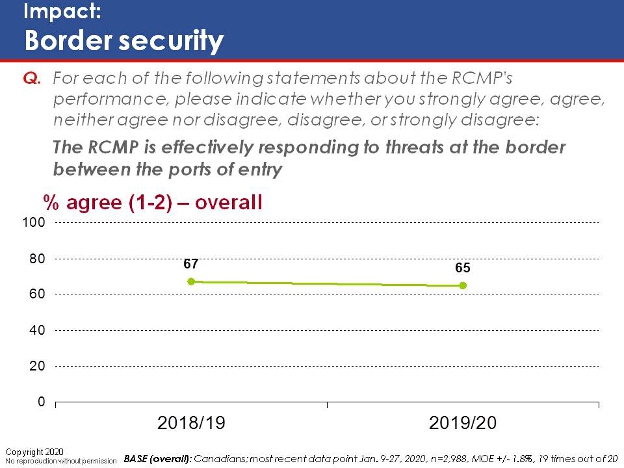
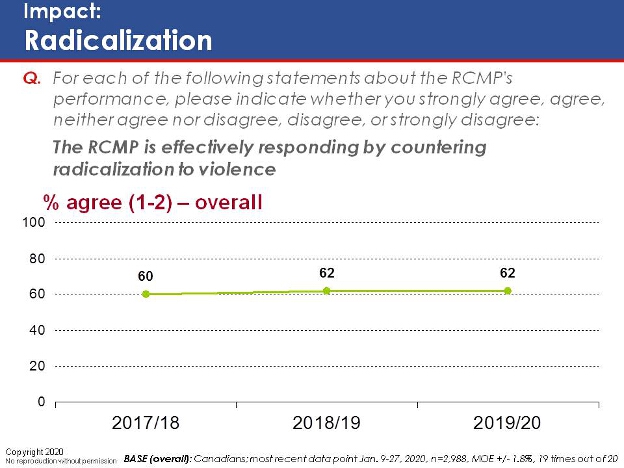
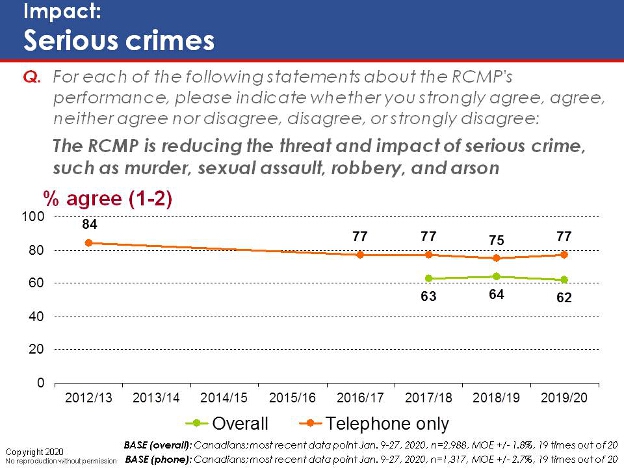
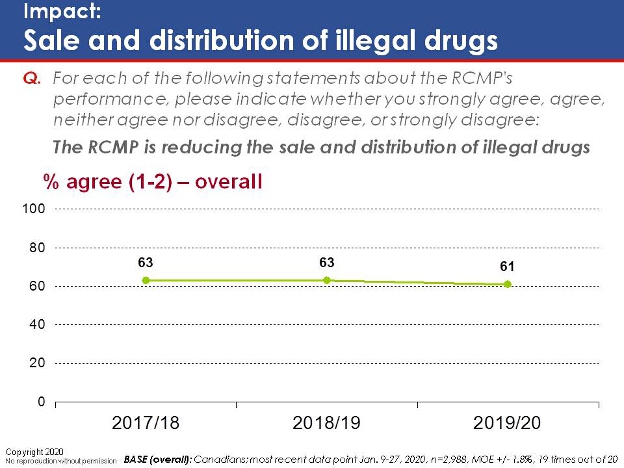
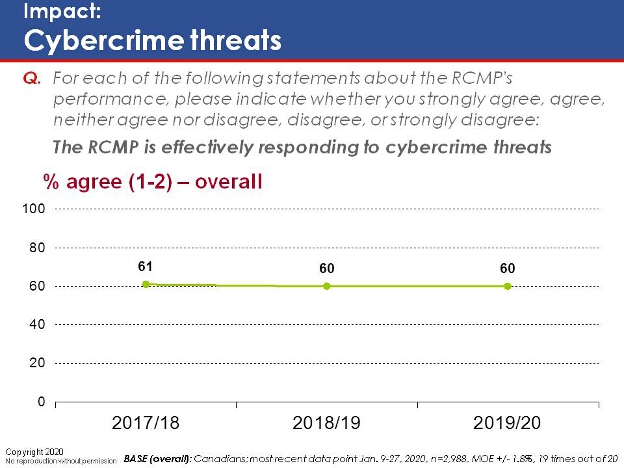
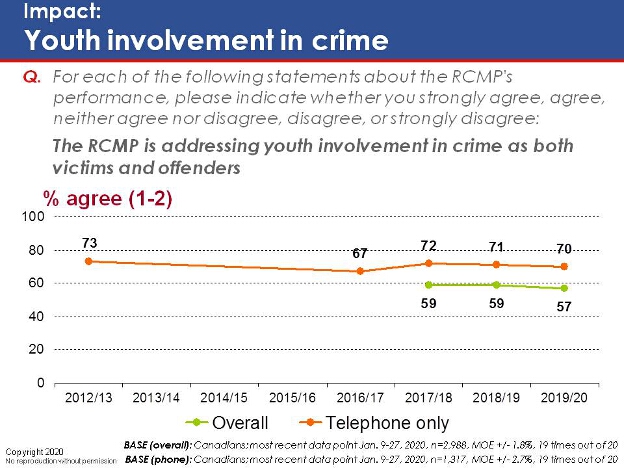
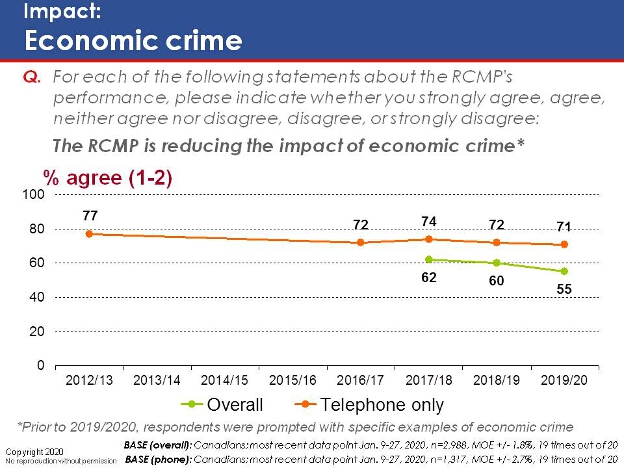
Results also reveal generally positive impressions of the impact of the RCMP on Canadians, although findings also suggest room for improvement in some areas, particularly when it comes to how the RCMP handles Indigenous matters. Three-quarters (76 per cent) express confidence in the RCMP's ability to respond to national security threats effectively. About seven in ten agree the RCMP effectively handles threats to passenger aircraft (69 per cent), diminishes the threat of organized crime (69 per cent), and resolves crimes where violence is involved (67 per cent), while slightly fewer (65 per cent) believe the RCMP provides an adequate response to border threats. About six in ten believe the RCMP is effective in countering radicalization to violence (62 per cent), mitigating the impact of serious crime (62 per cent), reducing the distribution of illegal drugs (61 per cent), responding to cybercrime threats (60 per cent), and addressing youth crime (57 per cent). Slightly fewer agree that the RCMP is successfully lessening the impact of economic crime (55 per cent) and improving traffic safety (55 per cent).
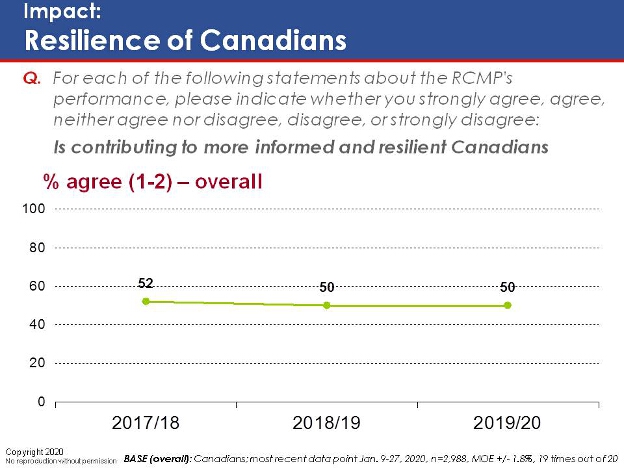
However, just half of respondents are satisfied with the RCMP's contribution to making Canadians more informed and resilient (50 per cent), its attempts to combat online scams (49 per cent), and its efforts in fostering safer Indigenous communities (47 per cent). Only four in ten (43 per cent) say the RCMP is advancing reconciliation with Canada's Indigenous peoples.
Overall results have largely remained stable over the past few years.[6]
Compared to men, women convey a greater sense of confidence in the RCMP on most of the indicators tested, particularly when it comes to border security (73 per cent, compared to 58 per cent of men), combating cybercrime (68 per cent versus 53 per cent), and addressing online scams (56 per cent versus 43 per cent).
Those aged 65 and over are consistently more likely to express a positive opinion of the impact of the RCMP's services. For example, 59 per cent agree that the RCMP is effective in safeguarding Indigenous communities, compared to 47 per cent on average.
On most of the indicators tested, those with a high school education are more likely to provide a positive assessment of the RCMP. For example, 65 per cent agree that the RCMP contributes to safer Indigenous communities, compared to 47 per cent on average.
Regionally, British Columbia residents convey a less favourable outlook on most of the items tested (for instance, 64 per cent believe the RCMP adequately responds to national security threats, compared to 76 per cent on average).
Members of the LGBTQ2 community and, to a lesser extent, those who identify as Indigenous are consistently less likely to agree with these statements. For instance, just 23 per cent of LGBTQ2 respondents and 40 per cent of Indigenous respondents believe the organization is contributing to safer Indigenous communities, compared to 47 per cent on average.
Impact of the RCMP
Impact of the RCMP - Text version
This chart has sixteen horizontal stacked bars for overall results Based on a five-point scale where 4-5 means disagree, 3 means neither, and1-2 means agree.
Respondents were asked: "For each of the following statements about the RCMP's performance, please indicate whether you strongly agree, agree, neither agree nor disagree, disagree, or strongly disagree."
Respondents selected:
Effectively responding to threats to national security: Disagree (10 per cent); neither (15 per cent); and agree (76 per cent).
Effectively responding to threats to Canadian passenger aircraft: Disagree (8 per cent); neither (23 per cent); and agree (69 per cent).
Reducing the threat and impact of organized crime: Disagree (15 per cent); neither (16 per cent); and agree (69 per cent).
Effective at resolving crimes where violence is involved: Disagree (12 per cent); neither (21 per cent); and agree (67 per cent).
Effectively responding to threats at the border between the ports of entry: Disagree (16 per cent); neither (19 per cent); and agree (65 per cent).
Effectively responding to radicalization to violence: Disagree (16 per cent); neither (22 per cent); and agree (62 per cent).
Reducing the threat and impact of serious crime: Disagree (16 per cent); neither (22 per cent); and agree (62 per cent).
Reducing the sale and distribution of illegal drugs: Disagree (21 per cent); neither (18 per cent); and agree (61 per cent).
Effectively responding to cybercrime threats: Disagree (18 per cent); neither (22 per cent); and agree (60 per cent).
Addressing youth involvement in crime as both victims and offenders: Disagree (13 per cent); neither (29 per cent); and agree (57 per cent).
Reducing the impact of economic crime: Disagree (22 per cent); neither (23 per cent); and agree (55 per cent).
Contributing to traffic safety in my province or territory: Disagree (27 per cent); neither (18 per cent); and agree (55 per cent).
Contributing to more informed and resilient Canadians: Disagree (19 per cent); neither (31 per cent); and agree (50 per cent).
Effectively addressing online scams: Disagree (29 per cent); neither (22 per cent); and agree (49 per cent).
Contributing to safer Indigenous communities: Disagree (29 per cent); neither (24 per cent); and agree (47 per cent).
Advancing reconciliation with Indigenous peoples of Canada: Disagree (28 per cent); neither (29 per cent); and agree (43 per cent).
Base (overall): Canadians; Jan. 9-27, 2020, n=2,988, MOE +/− 1.8%, 19 times out of 20
Impact: National security
Impact: National security - Text version
This chart is a line graph for overall and telephone only results – % agree (1-2) – for the years 2012/13, 2016/17, 2017/18, 2018/19 and 2019/20.
Respondents were asked: "For each of the following statements about the RCMP's performance, please indicate whether you strongly agree, agree, neither agree nor disagree, disagree, or strongly disagree: The RCMP is effectively responding to threats to national security."
Respondents selected:
Agree (1-2) 2012/13: telephone only (88 per cent);
Agree (1-2) 2016/17: telephone only (81 per cent);
Agree (1-2) 2017/18: overall (73 per cent); telephone only (83 per cent);
Agree (1-2) 2018/19: overall (75 per cent); telephone only (86 per cent);
Agree (1-2) 2019/20: overall (76 per cent); telephone only (88 per cent);
Base (overall): Canadians; most recent data point Jan. 9-27, 2020, n=2,988, MOE +/− 1.8%, 19 times out of 20
Base (phone): Canadians; most recent data point Jan. 9-27, 2020, n=1,317, MOE +/− 2.7%, 19 times out of 20
Impact: Threats to passenger aircraft
Impact: Threats to passenger aircraft - Text version
This chart is a line graph for overall results – % agree (1-2) – for the years 2017/18, 2018/19 and 2019/20.
Respondents were asked: "For each of the following statements about the RCMP's performance, please indicate whether you strongly agree, agree, neither agree nor disagree, disagree, or strongly disagree: The RCMP is effectively responding to threats to Canadian passenger aircraft."
Respondents selected:
Agree (1-2) 2017/18: overall (67 per cent);
Agree (1-2) 2018/19: overall (69 per cent);
Agree (1-2) 2019/20: overall (69 per cent);
Base (overall): Canadians; most recent data point Jan. 9-27, 2020, n=2,988, MOE +/− 1.8%, 19 times out of 20
Impact: Organized crime
Impact: Organized crime - Text version
This chart is a line graph for overall and telephone only results – % agree (1-2) – for the years 2012/13, 2016/17, 2017/18, 2018/19 and 2019/20.
Respondents were asked: "For each of the following statements about the RCMP's performance, please indicate whether you strongly agree, agree, neither agree nor disagree, disagree, or strongly disagree: Reducing the threat and impact of organized crime."
Respondents selected:
Agree (1-2) 2012/13: telephone only (81 per cent);
Agree (1-2) 2016/17: telephone only (79 per cent);
Agree (1-2) 2017/18: overall (69 per cent); telephone only (77 per cent);
Agree (1-2) 2018/19: overall (69 per cent); telephone only (79 per cent);
Agree (1-2) 2019/20: overall (69 per cent); telephone only (82 per cent);
Base (overall): Canadians; most recent data point Jan. 9-27, 2020, n=2,988, MOE +/− 1.8%, 19 times out of 20
Base (phone): Canadians; most recent data point Jan. 9-27, 2020, n=1,317, MOE +/− 2.7%, 19 times out of 20
Impact: Border security
Impact: Border security - Text version
This chart is a line graph for overall results – % agree (1-2) – for the years 2018/19 and 2019/20.
Respondents were asked: "For each of the following statements about the RCMP's performance, please indicate whether you strongly agree, agree, neither agree nor disagree, disagree, or strongly disagree: The RCMP is effectively responding to threats at the border between the ports of entry."
Respondents selected:
Agree (1-2) 2018/19: overall (67 per cent);
Agree (1-2) 2019/20: overall (65 per cent);
Base (overall): Canadians; most recent data point Jan. 9-27, 2020, n=2,988, MOE +/− 1.8%, 19 times out of 20
Impact: Radicalization
Impact: Radicalization - Text version
This chart is a line graph for overall results – % agree (1-2) – for the years 2017/18, 2018/19 and 2019/20.
Respondents were asked: "For each of the following statements about the RCMP's performance, please indicate whether you strongly agree, agree, neither agree nor disagree, disagree, or strongly disagree: The RCMP is effectively responding by countering radicalization to violence."
Respondents selected:
Agree (1-2) 2017/18: overall (60 per cent);
Agree (1-2) 2018/19: overall (62 per cent);
Agree (1-2) 2019/20: overall (62 per cent);
Base (overall): Canadians; most recent data point Jan. 9-27, 2020, n=2,988, MOE +/− 1.8%, 19 times out of 20
Impact: Serious crimes
Impact: Serious crimes - Text version
This chart is a line graph for overall and telephone only results – % agree (1-2) – for the years 2012/13, 2016/17, 2017/18, 2018/19 and 2019/20.
Respondents were asked: "For each of the following statements about the RCMP's performance, please indicate whether you strongly agree, agree, neither agree nor disagree, disagree, or strongly disagree: The RCMP is reducing the threat and impact of serious crime, such as murder, sexual assault, robbery, and arson."
Respondents selected:
Agree (1-2) 2012/13: telephone only (84 per cent);
Agree (1-2) 2016/17: telephone only (77 per cent);
Agree (1-2) 2017/18: overall (63 per cent); telephone only (77 per cent);
Agree (1-2) 2018/19: overall (64 per cent); telephone only (75 per cent);
Agree (1-2) 2019/20: overall (62 per cent); telephone only (77 per cent);
Base (overall): Canadians; most recent data point Jan. 9-27, 2020, n=2,988, MOE +/− 1.8%, 19 times out of 20
Base (phone): Canadians; most recent data point Jan. 9-27, 2020, n=1,317, MOE +/− 2.7%, 19 times out of 20
Impact: Sale and distribution of illegal drugs
Impact: Sale and distribution of illegal drugs - Text version
This chart is a line graph for overall results – % agree (1-2) – for the years 2017/18, 2018/19 and 2019/20.
Respondents were asked: "For each of the following statements about the RCMP's performance, please indicate whether you strongly agree, agree, neither agree nor disagree, disagree, or strongly disagree: The RCMP is reducing the sale and distribution of illegal drugs."
Respondents selected:
Agree (1-2) 2017/18: overall (63 per cent);
Agree (1-2) 2018/19: overall (63 per cent);
Agree (1-2) 2019/20: overall (61 per cent);
Base (overall): Canadians; most recent data point Jan. 9-27, 2020, n=2,988, MOE +/− 1.8%, 19 times out of 20
Impact: Cybercrime threats
Impact: Cybercrime threats - Text version
This chart is a line graph for overall results – % agree (1-2) – for the years 2017/18, 2018/19 and 2019/20.
Respondents were asked: "For each of the following statements about the RCMP's performance, please indicate whether you strongly agree, agree, neither agree nor disagree, disagree, or strongly disagree: The RCMP is effectively responding to cybercrime threats."
Respondents selected:
Agree (1-2) 2017/18: overall (61 per cent);
Agree (1-2) 2018/19: overall (60 per cent);
Agree (1-2) 2019/20: overall (60 per cent);
Base (overall): Canadians; most recent data point Jan. 9-27, 2020, n=2,988, MOE +/− 1.8%, 19 times out of 20
Impact: Youth involvement in crime
Impact: Youth involvement in crime - Text version
This chart is a line graph for overall and telephone only results – % agree (1-2) – for the years 2012/13, 2016/17, 2017/18, 2018/19 and 2019/20.
Respondents were asked: "For each of the following statements about the RCMP's performance, please indicate whether you strongly agree, agree, neither agree nor disagree, disagree, or strongly disagree: The RCMP is addressing youth involvement in crime as both victims and offenders."
Respondents selected:
Agree (1-2) 2012/13: telephone only (73 per cent);
Agree (1-2) 2016/17: telephone only (67 per cent);
Agree (1-2) 2017/18: overall (59 per cent); telephone only (72 per cent);
Agree (1-2) 2018/19: overall (59 per cent); telephone only (71 per cent);
Agree (1-2) 2019/20: overall (57 per cent); telephone only (70 per cent);
Base (overall): Canadians; most recent data point Jan. 9-27, 2020, n=2,988, MOE +/− 1.8%, 19 times out of 20
Base (phone): Canadians; most recent data point Jan. 9-27, 2020, n=1,317, MOE +/− 2.7%, 19 times out of 20
Impact: Economic crime
Impact: Economic crime - Text version
This chart is a line graph for overall and telephone only results – % agree (1-2) – for the years 2012/13, 2016/17, 2017/18, 2018/19 and 2019/20.
Respondents were asked: "For each of the following statements about the RCMP's performance, please indicate whether you strongly agree, agree, neither agree nor disagree, disagree, or strongly disagree: The RCMP is reducing the impact of economic crime*."
Respondents selected:
Agree (1-2) 2012/13: telephone only (77 per cent);
Agree (1-2) 2016/17: telephone only (72 per cent);
Agree (1-2) 2017/18: overall (62 per cent); telephone only (74 per cent);
Agree (1-2) 2018/19: overall (60 per cent); telephone only (72 per cent);
Agree (1-2) 2019/20: overall (55 per cent); telephone only (71 per cent);
*Prior to 2019/2020, respondents were prompted with specific examples of economic crime
Base (overall): Canadians; most recent data point Jan. 9-27, 2020, n=2,988, MOE +/− 1.8%, 19 times out of 20
Base (phone): Canadians; most recent data point Jan. 9-27, 2020, n=1,317, MOE +/− 2.7%, 19 times out of 20
Impact: Resilience of Canadians
Impact: Resilience of Canadians - Text version
This chart is a line graph for overall results – % agree (1-2) – for the years 2017/18, 2018/19 and 2019/20.
Respondents were asked: "For each of the following statements about the RCMP's performance, please indicate whether you strongly agree, agree, neither agree nor disagree, disagree, or strongly disagree: Is contributing to more informed and resilient Canadians."
Respondents selected:
Agree (1-2) 2017/18: overall (52 per cent);
Agree (1-2) 2018/19: overall (50 per cent);
Agree (1-2) 2019/20: overall (50 per cent);
Base (overall): Canadians; most recent data point Jan. 9-27, 2020, n=2,988, MOE +/− 1.8%, 19 times out of 20
Impact: Safety of Indigenous communities
Impact: Safety of Indigenous communities - Text version
This chart is a line graph for overall and telephone only results – % agree (1-2) – for the years 2012/13, 2016/17, 2017/18, 2018/19 and 2019/20.
Respondents were asked: "For each of the following statements about the RCMP's performance, please indicate whether you strongly agree, agree, neither agree nor disagree, disagree, or strongly disagree: The RCMP is contributing to safer Indigenous communities."
Respondents selected:
Agree (1-2) 2012/13: telephone only (66 per cent);
Agree (1-2) 2016/17: telephone only (54 per cent);
Agree (1-2) 2017/18: overall (49 per cent); telephone only (65 per cent);
Agree (1-2) 2018/19: overall (51 per cent); telephone only (66 per cent);
Agree (1-2) 2019/20: overall (47 per cent); telephone only (65 per cent);
Base (overall): Canadians; most recent data point Jan. 9-27, 2020, n=2,988, MOE +/− 1.8%, 19 times out of 20
Base (phone): Canadians; most recent data point Jan. 9-27, 2020, n=1,317, MOE +/− 2.7%, 19 times out of 20
2.13 Incidence of the RCMP Exceeding Their Authority
Results reveal that most Canadians believe the RCMP generally acts within their authority, although a significant minority believe the organization exceeds their authority at times. Seven in ten (70 per cent) say the RCMP seldom exceeds its authority (including 45 per cent who say 'never' or 'almost never'). One in six (17 per cent), however, feel the RCMP sometimes oversteps its boundaries, and one in eight (13 per cent) believe the RCMP often or always oversteps its authority.
Those who identify as LGBTQ2, Indigenous, having a disability, or visible minorities are all more likely to claim that the RCMP regularly exceeds their authority (29 per cent, 26 per cent, 23 per cent, and 21 per cent, respectively, compared to 13 per cent on average).
Incidence of the RCMP Exceeding Their Authority
Incidence of the RCMP Exceeding Their Authority - Text version
This chart has five bars for overall (unweighted) results.
Respondents were asked: "About how often would you say that the RCMP in your neighbourhood exceeds their authority?"
Respondents selected:
Never / Almost never (45 per cent);
Rarely (25 per cent);
Sometimes (17 per cent);
Most of the time (7 per cent);
Almost always (6 per cent);
Base (overall): Canadians; Jan. 9-27, 2020, n=2,988, MOE +/− 1.8%, 19 times out of 20
2.14 Awareness of RCMP's International Activities
Results suggest broad awareness of the RCMP's international undertakings. Three-quarters (73 per cent) say they are aware that the RCMP participates in activities such as peacekeeping and training foreign police, and only one in seven (15 per cent) say they are not aware that the RCMP engages in these activities. Longer-term tracking suggests a steady rise in the public's familiarity with the RCMP's presence on the international stage.
Awareness of the RCMP's international engagements rises progressively with age (from 61 per cent among those under the age of 35 to 84 per cent of those ages 65 and over) and declines with educational attainment (from 80 per cent among high school educated to 70 per cent among university graduates).
Awareness is higher in Atlantic Canada (83 per cent, compared to 73 per cent on average).
LGBTQ2 respondents are comparatively less familiar with these activities (60 per cent, compared to 73 per cent on average).
Awareness of RCMP's International Activities
Awareness of RCMP's International Activities - Text version
This chart has one horizontal stacked bar for overall results Based on a five-point scale where 4-5 means disagree, 3 means neither, and1-2 means agree. Below is a line graph for overall and telephone only results – % important (1-2) – for the years 2016/17, 2017/18, 2018/19 and 2019/20.
Respondents were asked: "For each of the following statements about the RCMP's performance, please indicate whether you strongly agree, agree, neither agree nor disagree, disagree, or strongly disagree: I am aware that the RCMP participates in a variety of international activities, such as peacekeeping missions and offering training to foreign police?"
Respondents selected:
Overall: Disagree (15 per cent); neither (12 per cent); and agree (73 per cent).
Agree (1-2) 2016/17: overall (73 per cent);
Agree (1-2) 2017/18: overall (71 per cent); telephone only (77 per cent);
Agree (1-2) 2018/19: overall (70 per cent); telephone only (75 per cent);
Agree (1-2) 2019/20: overall (73 per cent); telephone only (81 per cent);
Base (overall): Canadians; most recent data point Jan. 9-27, 2020, n=2,988, MOE +/− 1.8%, 19 times out of 20
Base (phone): Canadians; most recent data point Jan. 9-27, 2020, n=1,317, MOE +/− 2.7%, 19 times out of 20
3. Contact with the RCMP
This section looks at incidence of recent contact with RCMP, the reasons behind these contacts, and client satisfaction with the contact along a number of key measures. In order to remain consistent with past iterations of this survey, the figures reported in this section are unweighted.
Note that "DK/NR" – or "Don't know/No response" – is used to denote those respondents who did not provide a response to a question.
3.1 Incidence of Contact With the RCMP
Respondents were asked if they have had any direct contact with the RCMP in the past year. Three in ten (31 per cent) indicate yes, while the majority (67 per cent) say no.
Tracking reveals that these results have remained largely stable over the past few years.
Regionally, those in Central Canada are far less likely to report contact (seven per cent, compared to 31 per cent on average).
Indigenous respondents and those with a disability are more likely to have had direct contact with the RCMP (49 per cent and 41 per cent, respectively, compared to 31 per cent on average).
Incidence of Contact With the RCMP
Incidence of Contact With the RCMP - Text version
This chart has one horizontal stacked bar for overall (unweighted) and telephone only results Based on a scale: DK/NR, no, and yes. Below is a line graph for the years 2016/17, 2017/18, 2018/19 and 2019/20 (% yes).
Respondents were asked: "In the past year, did you have any direct contact with the RCMP, such as reporting a crime, being stopped for a traffic offence or accident, seeking information, or any other reason?"
Respondents selected:
Overall: DK/NR (1 per cent); no (67 per cent); and yes (31 per cent).
Yes 2016/17: telephone only (33 per cent);
Yes 2017/18: overall (34 per cent); telephone only (38 per cent);
Yes 2018/19: overall (33 per cent); telephone only (36 per cent);
Yes 2019/20: overall (31 per cent); telephone only (36 per cent);
Base (overall): Canadians; most recent data point Jan. 9-27, 2020, n=2,988, MOE +/− 1.8%, 19 times out of 20
Base (phone): Canadians; most recent data point Jan. 9-27, 2020, n=1,317, MOE +/− 2.7%, 19 times out of 20
3.2 Nature of Contact With RCMP
Those who indicated they had had contact with the RCMP in the past year were asked the reason for their most recent contact. Responses varied, with one in five indicating their contact involved a traffic offence or an accident (21 per cent) or a criminal matter (19 per cent). One in ten say the contact involved a complaint (12 per cent) or a crime prevention activity (11 per cent).
Tracking reveals that results have remained largely stable over the past two years, though the proportion of traffic-related contacts is down eight points from 2016/17.
Regionally, those who reside in Atlantic Canada are more apt to attribute their contact to a traffic offence or accident (32 per cent, compared to 21 per cent on average).
Nature of contact with RCMP
Nature of contact with RCMP - Text version
This chart has five stacked bars composed of three categories each: 2017/18, 2018/19 and 2019/20 for overall results (unweighted).
Respondents were asked: "[If yes] What was the reason for your most recent contact with the RCMP?"
Respondents selected:
For a traffic offence or an accident: 2019/20 (20 per cent); 2018/19 (20 per cent); and 2017/18 (21 per cent).
For a criminal matter: 2019/20 (16 per cent); 2018/19 (18 per cent); and 2017/18 (19 per cent).
For a complaint: 2019/20 (11 per cent); 2018/19 (11 per cent); and 2017/18 (12 per cent).
For a crime prevention activity: 2019/20 (12 per cent); 2018/19 (11 per cent); and 2017/18 (11 per cent).
For another reason: 2019/20 (40 per cent); 2018/19 (38 per cent); and 2017/18 (36 per cent).
Base (overall): Had contact with the RCMP; Jan. 9-27, 2020, n=936, MOE +/− 3.2%, 19 times out of 20
Tracking nature of contact with RCMP
Tracking nature of contact with RCMP - Text version
This chart has six stacked bars composed of four categories each: 2016/17, 2017/18, 2018/19 and 2019/20 for telephone only results (unweighted).
Respondents were asked: "[If yes] What was the reason for your most recent contact with the RCMP?"
Respondents selected:
For a criminal matter: 2019/20 (21 per cent); 2018/19 (20 per cent); 2017/18 (16 per cent); and 2016/17 (16 per cent).
For a traffic offence or an accident: 2019/20 (17 per cent); 2018/19 (16 per cent); 2017/18 (17 per cent); and 2016/17 (25 per cent).
For a crime prevention activity: 2019/20 (12 per cent); 2018/19 (12 per cent); 2017/18 (13 per cent); and 2016/17 (13 per cent).
For a complaint: 2019/20 (11 per cent); 2018/19 (10 per cent); 2017/18 (12 per cent); and 2016/17 (10 per cent).
For another reason: 2019/20 (38 per cent); 2018/19 (39 per cent); 2017/18 (43 per cent); and 2016/17 (34 per cent).
Don’t know/No response: 2019/20 (1 per cent); 2018/19 (1 per cent); 2017/18 (0 per cent); and 2016/17 (2 per cent).
Base (overall): Had contact with the RCMP; Jan. 9-27, 2020, n=936, MOE +/− 3.2%, 19 times out of 20
3.3 Origin of Contact With the RCMP
Those who indicated they had contact with the RCMP in the past year were also asked if they had initiated the contact. Most (62 per cent) indicate that they did initiate the contact, while about four in ten (38 per cent) did not.
Tracking reveals that the proportion who initiated contact with the RCMP has remained unchanged over the past two years, though it is up nine points since 2016/2017.
Origin of contact with the RCMP
Origin of contact with the RCMP - Text version
This chart has one horizontal stacked bar for overall (unweighted) and telephone only (unweighted) results Based on a scale: DK/NR, no, and yes. Below is a line graph for the years 2016/17, 2017/18, 2018/19 and 2019/20 (% yes).
Respondents were asked: "Still thinking of the most recent contact, did you initiate the contact with the RCMP yourself?"
Respondents selected:
Overall: DK/NR (1 per cent); no (38 per cent); and yes (62 per cent).
Yes 2016/17: telephone only (57 per cent);
Yes 2017/18: overall (64 per cent); telephone only (68 per cent);
Yes 2018/19: overall (63 per cent); telephone only (66 per cent);
Yes 2019/20: overall (62 per cent); telephone only (66 per cent);
Base (overall): Had contact with the RCMP; most recent data point Jan. 9-27, 2020, n=936, MOE +/− 3.2%, 19 times out of 20
Base (phone): Had contact with the RCMP; most recent data point Jan. 9-27, 2020, n=470, MOE +/− 4.5%, 19 times out of 20
3.4 Views on Contact With RCMP
Those who indicated they had contact with the RCMP in the past year were then asked for their views on RCMP performance during this contact. Results are generally positive with more than eight in ten (85 per cent) agreeing that it was easy to get in touch with the RCMP, while similar proportions say RCMP personnel were courteous and respectful (84 per cent), treated them fairly (84 per cent), and demonstrated professionalism (83 per cent). Roughly three-quarters feel that RCMP personnel were knowledgeable and competent (78 per cent), provided all the information needed (73 per cent), and delivered the service in a timely fashion (72 per cent). Results are more mixed in terms of the RCMP going beyond minimum requirements in providing good service: 56 per cent feel the RCMP went beyond minimum service requirements, and 20 per cent disagree with this idea.
Tracking reveals that these results have remained largely stable over the past few years.
Agreement consistently rises with age. For instance, 93 per cent of those ages 65 and over believe that RCMP personnel were courteous and respectful, compared to 71 per cent of those under the age of 35.
Views on contact with RCMP
Views on contact with RCMP - Text version
This chart has eight horizontal stacked bars for overall results (unweighted) Based on a five-point scale where 4-5 means disagree, 3 means neither, and1-2 means agree and an additional point for don’t know/not applicable.
Respondents were asked: "Regarding your contact(s) with the RCMP in the last year, please indicate whether you strongly agree, agree, neither agree nor disagree, disagree or strongly disagree with each of the following statements about the RCMP's performance."
Respondents selected:
It was easy to get in touch with the RCMP*: Don’t know/not applicable (0 per cent); disagree (12 per cent); neither (3 per cent); and agree (85 per cent).
RCMP personnel were courteous and respectful: Don’t know/not applicable (1 per cent); disagree (8 per cent); neither (7 per cent); and agree (84 per cent).
RCMP personnel treated me fairly: Don’t know/not applicable (2 per cent); disagree (9 per cent); neither (5 per cent); and agree (84 per cent).
RCMP personnel demonstrated professionalism: Don’t know/not applicable (1 per cent); disagree (10 per cent); neither (6 per cent); and agree (83 per cent).
RCMP personnel were knowledgeable and competent: Don’t know/not applicable (3 per cent); disagree (10 per cent); neither (10 per cent); and agree (78 per cent).
RCMP personnel gave me all the information that I needed for the situation: Don’t know/not applicable (3 per cent); disagree (16 per cent); neither (8 per cent); and agree (73 per cent).
RCMP personnel delivered the service in a timely fashion: Don’t know/not applicable (4 per cent); disagree (16 per cent); neither (8 per cent); and agree (72 per cent).
RCMP personnel went beyond minimum requirements in providing good service: Don’t know/not applicable (6 per cent); disagree (20 per cent); neither (18 per cent); and agree (56 per cent).
*Asked only of those who initiated contact with the RCMP (n=577, MOE +/− 4.1%, 19 times out of 20)
Base (overall): Had contact with the RCMP; Jan. 9-27, 2020, n=936, MOE +/− 3.2%, 19 times out of 20
Views on contact with RCMP: Ease of contact
Views on contact with RCMP: Ease of contact - Text version
This chart is a line graph for overall (unweighted) and telephone only (unweighted) results – % agree (1-2) – for the years 2012/13, 2016/17, 2017/18, 2018/19 and 2019/20.
Respondents were asked: "Regarding your contact(s) with the RCMP in the last year, please indicate whether you strongly agree, agree, neither agree nor disagree, disagree or strongly disagree with each of the following statements about the RCMP's performance. It was easy to get in touch with the RCMP."
Respondents selected:
Agree (1-2) 2012/13: telephone only (92 per cent);
Agree (1-2) 2016/17: telephone only (92 per cent);
Agree (1-2) 2017/18: overall (83 per cent); telephone only (89 per cent);
Agree (1-2) 2018/19: overall (82 per cent); telephone only (85 per cent);
Agree (1-2) 2019/20: overall (85 per cent); telephone only (90 per cent);
Base (overall): Initiated contact with the RCMP; most recent data point Jan. 9-27, 2020, n=577, MOE +/− 4.1%, 19 times out of 20
Base (phone): Initiated contact with the RCMP; most recent data point Jan. 9-27, 2020, n=308, MOE +/− 5.6%, 19 times out of 20
Views on contact with RCMP: Courtesy and respect
Views on contact with RCMP: Courtesy and respect - Text version
This chart is a line graph for overall (unweighted) and telephone only (unweighted) results – % agree (1-2) – for the years 2012/13, 2016/17, 2017/18, 2018/19 and 2019/20.
Respondents were asked: "Regarding your contact(s) with the RCMP in the last year, please indicate whether you strongly agree, agree, neither agree nor disagree, disagree or strongly disagree with each of the following statements about the RCMP's performance. RCMP personnel were courteous and respectful."
Respondents selected:
Agree (1-2) 2012/13: telephone only (88 per cent);
Agree (1-2) 2016/17: telephone only (89 per cent);
Agree (1-2) 2017/18: overall (85 per cent); telephone only (90 per cent);
Agree (1-2) 2018/19: overall (87 per cent); telephone only (92 per cent);
Agree (1-2) 2019/20: overall (84 per cent); telephone only (90 per cent);
Base (overall): Had contact with the RCMP; most recent data point Jan. 9-27, 2020, n=936, MOE +/− 3.2%, 19 times out of 20
Base (phone): Had contact with the RCMP; most recent data point Jan. 9-27, 2020, n=470, MOE +/− 4.5%, 19 times out of 20
Views on contact with RCMP: Fairness
Views on contact with RCMP: Fairness - Text version
This chart is a line graph for overall (unweighted) and telephone only (unweighted) results – % agree (1-2) – for the years 2012/13, 2016/17, 2017/18, 2018/19 and 2019/20.
Respondents were asked: "Regarding your contact(s) with the RCMP in the last year, please indicate whether you strongly agree, agree, neither agree nor disagree, disagree or strongly disagree with each of the following statements about the RCMP's performance. RCMP personnel treated me fairly."
Respondents selected:
Agree (1-2) 2012/13: telephone only (88 per cent);
Agree (1-2) 2016/17: telephone only (89 per cent);
Agree (1-2) 2017/18: overall (86 per cent); telephone only (91 per cent);
Agree (1-2) 2018/19: overall (85 per cent); telephone only (91 per cent);
Agree (1-2) 2019/20: overall (84 per cent); telephone only (91 per cent);
Base (overall): Had contact with the RCMP; most recent data point Jan. 9-27, 2020, n=936, MOE +/− 3.2%, 19 times out of 20
Base (phone): Had contact with the RCMP; most recent data point Jan. 9-27, 2020, n=470, MOE +/− 4.5%, 19 times out of 20
Views on contact with RCMP: Professionalism
Views on contact with RCMP: Professionalism - Text version
This chart is a line graph for overall (unweighted) and telephone only (unweighted) results – % agree (1-2) – for the years 2012/13, 2016/17, 2017/18, 2018/19 and 2019/20.
Respondents were asked: "Regarding your contact(s) with the RCMP in the last year, please indicate whether you strongly agree, agree, neither agree nor disagree, disagree or strongly disagree with each of the following statements about the RCMP's performance. RCMP personnel demonstrated professionalism."
Respondents selected:
Agree (1-2) 2012/13: telephone only (91 per cent);
Agree (1-2) 2016/17: telephone only (90 per cent);
Agree (1-2) 2017/18: overall (86 per cent); telephone only (90 per cent);
Agree (1-2) 2018/19: overall (86 per cent); telephone only (91 per cent);
Agree (1-2) 2019/20: overall (83 per cent); telephone only (88 per cent);
Base (overall): Had contact with the RCMP; most recent data point Jan. 9-27, 2020, n=936, MOE +/− 3.2%, 19 times out of 20
Base (phone): Had contact with the RCMP; most recent data point Jan. 9-27, 2020, n=470, MOE +/− 4.5%, 19 times out of 20
Views on contact with RCMP: Knowledge and competence
Views on contact with RCMP: Knowledge and competence - Text version
This chart is a line graph for overall (unweighted) and telephone only (unweighted) results – % agree (1-2) – for the years 2012/13, 2016/17, 2017/18, 2018/19 and 2019/20.
Respondents were asked: "Regarding your contact(s) with the RCMP in the last year, please indicate whether you strongly agree, agree, neither agree nor disagree, disagree or strongly disagree with each of the following statements about the RCMP's performance. RCMP personnel were knowledgeable and competent."
Respondents selected:
Agree (1-2) 2012/13: telephone only (86 per cent);
Agree (1-2) 2016/17: telephone only (83 per cent);
Agree (1-2) 2017/18: overall (78 per cent); telephone only (85 per cent);
Agree (1-2) 2018/19: overall (79 per cent); telephone only (87 per cent);
Agree (1-2) 2019/20: overall (78 per cent); telephone only (85 per cent);
Base (overall): Had contact with the RCMP; most recent data point Jan. 9-27, 2020, n=936, MOE +/− 3.2%, 19 times out of 20
Base (phone): Had contact with the RCMP; most recent data point Jan. 9-27, 2020, n=470, MOE +/− 4.5%, 19 times out of 20
Views on contact with RCMP: Knowledge and competence
Views on contact with RCMP: Receipt of needed information - Text version
This chart is a line graph for overall (unweighted) and telephone only (unweighted) results – % agree (1-2) – for the years 2012/13, 2016/17, 2017/18, 2018/19 and 2019/20.
Respondents were asked: "Regarding your contact(s) with the RCMP in the last year, please indicate whether you strongly agree, agree, neither agree nor disagree, disagree or strongly disagree with each of the following statements about the RCMP's performance. RCMP personnel gave me all the information that I needed for the situation."
Respondents selected:
Agree (1-2) 2012/13: telephone only (79 per cent);
Agree (1-2) 2016/17: telephone only (80 per cent);
Agree (1-2) 2017/18: overall (72 per cent); telephone only (81 per cent);
Agree (1-2) 2018/19: overall (73 per cent); telephone only (80 per cent);
Agree (1-2) 2019/20: overall (73 per cent); telephone only (81 per cent);
Base (overall): Had contact with the RCMP; most recent data point Jan. 9-27, 2020, n=936, MOE +/− 3.2%, 19 times out of 20
Base (phone): Had contact with the RCMP; most recent data point Jan. 9-27, 2020, n=470, MOE +/− 4.5%, 19 times out of 20
Views on contact with RCMP: Timeliness
Views on contact with RCMP: Timeliness - Text version
This chart is a line graph for overall (unweighted) and telephone only (unweighted) results – % agree (1-2) – for the years 2012/13, 2016/17, 2017/18, 2018/19 and 2019/20.
Respondents were asked: "Regarding your contact(s) with the RCMP in the last year, please indicate whether you strongly agree, agree, neither agree nor disagree, disagree or strongly disagree with each of the following statements about the RCMP's performance. RCMP personnel delivered the service in a timely fashion."
Respondents selected:
Agree (1-2) 2012/13: telephone only (85 per cent);
Agree (1-2) 2016/17: telephone only (82 per cent);
Agree (1-2) 2017/18: overall (73 per cent); telephone only (81 per cent);
Agree (1-2) 2018/19: overall (73 per cent); telephone only (81 per cent);
Agree (1-2) 2019/20: overall (72 per cent); telephone only (78 per cent);
Base (overall): Had contact with the RCMP; most recent data point Jan. 9-27, 2020, n=936, MOE +/− 3.2%, 19 times out of 20
Base (phone): Had contact with the RCMP; most recent data point Jan. 9-27, 2020, n=470, MOE +/− 4.5%, 19 times out of 20
Views on contact with RCMP: Incidence of exceeding basic requirements
Views on contact with RCMP: Incidence of exceeding basic requirements - Text version
This chart is a line graph for overall (unweighted) and telephone only (unweighted) results – % agree (1-2) – for the years 2012/13, 2016/17, 2017/18, 2018/19 and 2019/20.
Respondents were asked: "Regarding your contact(s) with the RCMP in the last year, please indicate whether you strongly agree, agree, neither agree nor disagree, disagree or strongly disagree with each of the following statements about the RCMP's performance. RCMP personnel went beyond minimum requirements in providing good service."
Respondents selected:
Agree (1-2) 2012/13: telephone only (67 per cent);
Agree (1-2) 2016/17: telephone only (62 per cent);
Agree (1-2) 2017/18: overall (58 per cent); telephone only (69 per cent);
Agree (1-2) 2018/19: overall (58 per cent); telephone only (68 per cent);
Agree (1-2) 2019/20: overall (56 per cent); telephone only (64 per cent);
Base (overall): Had contact with the RCMP; most recent data point Jan. 9-27, 2020, n=936, MOE +/− 3.2%, 19 times out of 20
Base (phone): Had contact with the RCMP; most recent data point Jan. 9-27, 2020, n=470, MOE +/− 4.5%, 19 times out of 20
3.5 Satisfaction With Contact With RCMP
Those who indicated they had had contact with the RCMP in the past year were also asked to rate their overall satisfaction with the service they received from the RCMP. Three in four (74 per cent) expressed satisfaction, and only 17 per cent were dissatisfied.
Tracking suggests that satisfaction has remained stable over the past few years.
Satisfaction with contact
Satisfaction with contact - Text version
This chart has one horizontal stacked bar for overall results (unweighted) Based on a five-point scale where 4-5 means dissatisfied, 3 means neither, and 1-2 means satisfied, with an additional point for DK/NR. Below is a line graph for overall (unweighted) and telephone only (unweighted) results – % satisfied (1-2) – for the years 2016/17, 2017/18, 2018/19 and 2019/20.
Respondents were asked: "How satisfied were you with the service you received during your contact(s) with the RCMP?"
Respondents selected:
Overall: DK/NR (1 per cent); dissatisfied (17 per cent); neither (8 per cent); and satisfied (74 per cent).
Satisfied (1-2) 2016/17: telephone only (76 per cent);
Satisfied (1-2) 2017/18: overall (75 per cent); telephone only (80 per cent);
Satisfied (1-2) 2018/19: overall (74 per cent); telephone only (82 per cent);
Satisfied (1-2) 2019/20: overall (74 per cent); telephone only (82 per cent);
Base (overall): Had contact with the RCMP; most recent data point Jan. 9-27, 2020, n=936, MOE +/− 3.2%, 19 times out of 20
Base (phone): Had contact with the RCMP; most recent data point Jan. 9-27, 2020, n=470, MOE +/− 4.5%, 19 times out of 20
Appendix A: Questionnaire
Phone Introduction
Good afternoon/evening. My name is [name of caller] and I am calling from Ekos, a public opinion research company. May I speak with [name of participant]?
Confirm whether respondent prefers English or French
We are conducting a study on behalf of the Royal Canadian Mounted Police (RCMP) to determine satisfaction with specific aspects of the RCMP's performance. Please be assured that we are not selling or soliciting anything. The survey is voluntary and your responses will be kept entirely confidential and anonymous. The survey should take about 15 minutes to complete.
[If asked:] You can call the RCMP contact, Dr. James Lea, at 613-843-6143 to verify that the survey is legitimate. May we begin with the survey?
Yes: 1
No: 2
Privacy
This call may be recorded for quality control or training purposes.
Web Introduction
We are conducting a study on behalf of the Royal Canadian Mounted Police (RCMP) to determine satisfaction with specific aspects of the RCMP's performance. Please be assured that we are not selling or soliciting anything. The survey is voluntary and your responses will be kept entirely confidential and anonymous.
The survey should take about 15 minutes to complete.
You can call the RCMP contact, Dr. James Lea, at 613-843-6143 to verify that the survey is legitimate.
Q1
How important is the RCMP's contribution to keeping Canadians safe?
Very important: 1
Somewhat important: 2
Neither important nor unimportant: 3
Somewhat unimportant: 4
Not at all important: 5
Don't know: 99 X
Q2
How satisfied are you with the RCMP's contribution to keeping Canadians safe?
Very satisfied: 1
Somewhat satisfied: 2
Neither satisfied nor dissatisfied: 3
Somewhat dissatisfied: 4
Very dissatisfied: 5
Don't know: 99 X
Q3
I feel safer because of the RCMP.
Strongly agree: 1
Agree: 2
Neither agree nor disagree: 3
Disagree: 4
Strongly disagree: 5
Don't know: 99 X
Q4
Is the RCMP your local policing service?
Yes: 1
No: 2
Partially: 3
Don't know: 99 X
PQ5
For each of the following statements about the RCMP's performance, please indicate whether you strongly agree, agree, neither agree nor disagree, disagree, or strongly disagree.
General
Q5A
The RCMP demonstrates professionalism in its work.
Strongly agree: 1
Agree: 2
Neither agree nor disagree: 3
Disagree: 4
Strongly disagree: 5
Don't know/ No response: 99 XS
Q5B
The RCMP is an organization with integrity.
Strongly agree: 1
Agree: 2
Neither agree nor disagree: 3
Disagree: 4
Strongly disagree: 5
Don't know/ No response: 99 XS
Q5C
RCMP personnel are honest.
Strongly agree: 1
Agree: 2
Neither agree nor disagree: 3
Disagree: 4
Strongly disagree: 5
Don't know/ No response: 99 XS
Q5D
RCMP personnel demonstrate compassion.
Strongly agree: 1
Agree: 2
Neither agree nor disagree: 3
Disagree: 4
Strongly disagree: 5
Don't know/ No response: 99 XS
Q5E
The RCMP is an accountable organization.
Strongly agree: 1
Agree: 2
Neither agree nor disagree: 3
Disagree: 4
Strongly disagree: 5
Don't know/ No response: 99 XS
Q5F
The RCMP treats people with respect.
Strongly agree: 1
Agree: 2
Neither agree nor disagree: 3
Disagree: 4
Strongly disagree: 5
Don't know/ No response: 99 XS
Q5G
The RCMP places an emphasis on providing quality service to the public.
Strongly agree: 1
Agree: 2
Neither agree nor disagree: 3
Disagree: 4
Strongly disagree: 5
Don't know/ No response: 99 XS
Q5H
The RCMP provides the same quality of service to all citizens.
Strongly agree: 1
Agree: 2
Neither agree nor disagree: 3
Disagree: 4
Strongly disagree: 5
Don't know/ No response: 99 XS
Q5I
The RCMP places emphasis on providing services in the official language of my choice, English or French.
Strongly agree: 1
Agree: 2
Neither agree nor disagree: 3
Disagree: 4
Strongly disagree: 5
Don't know/ No response: 99 XS
Q5J
The RCMP is a recognized symbol of Canada.
Strongly agree: 1
Agree: 2
Neither agree nor disagree: 3
Disagree: 4
Strongly disagree: 5
Don't know/ No response: 99 XS
Q5K
I have trust and confidence in the RCMP.
Strongly agree: 1
Agree: 2
Neither agree nor disagree: 3
Disagree: 4
Strongly disagree: 5
Don't know/ No response: 99 XS
Q5KK
I would encourage friends and family members to apply to the RCMP.
Strongly agree: 1
Agree: 2
Neither agree nor disagree: 3
Disagree: 4
Strongly disagree: 5
Don't know/ No response: 99 XS
PQ5L - Relationship with the RCMP
RELQ5L
The RCMP has effective local leaders.
Strongly agree: 1
Agree: 2
Neither agree nor disagree: 3
Disagree: 4
Strongly disagree: 5
Don't know/ No response: 99 XS
RELQ5M
The RCMP has effective national leaders.
Strongly agree: 1
Agree: 2
Neither agree nor disagree: 3
Disagree: 4
Strongly disagree: 5
Don't know/ No response: 99 XS
RELQ5N
The RCMP provides Canadians with adequate information about its work.
Strongly agree: 1
Agree: 2
Neither agree nor disagree: 3
Disagree: 4
Strongly disagree: 5
Don't know/ No response: 99 XS
RELQ5O
The RCMP is an open and transparent organization.
Strongly agree: 1
Agree: 2
Neither agree nor disagree: 3
Disagree: 4
Strongly disagree: 5
Don't know/ No response: 99 XS
RELQ5P
The RCMP is representative of the diverse Canadian communities it serves.
Strongly agree: 1
Agree: 2
Neither agree nor disagree: 3
Disagree: 4
Strongly disagree: 5
Don't know/ No response: 99 XS
RELQ5Q
The RCMP is dealing with the things that matter to people in this community.
Strongly agree: 1
Agree: 2
Neither agree nor disagree: 3
Disagree: 4
Strongly disagree: 5
Don't know/ No response: 99 XS
RELQ5R
I feel a moral duty to follow police orders.
Strongly agree: 1
Agree: 2
Neither agree nor disagree: 3
Disagree: 4
Strongly disagree: 5
Don't know/ No response: 99 XS
RELQ5S
I generally support how the RCMP usually acts.
Strongly agree: 1
Agree: 2
Neither agree nor disagree: 3
Disagree: 4
Strongly disagree: 5
Don't know/ No response: 99 XS
RELQ5T
I would help the RCMP if asked.
Strongly agree: 1
Agree: 2
Neither agree nor disagree: 3
Disagree: 4
Strongly disagree: 5
Don't know/ No response: 99 XS
PQ5U - Sensitivity
SENQ5U
The RCMP is sensitive to the needs of different cultures and groups.
Strongly agree: 1
Agree: 2
Neither agree nor disagree: 3
Disagree: 4
Strongly disagree: 5
Don't know/ No response: 99 XS
SENQ5V
The RCMP is respectful to the cultural needs of Indigenous people.
Strongly agree: 1
Agree: 2
Neither agree nor disagree: 3
Disagree: 4
Strongly disagree: 5
Don't know/ No response: 99 XS
SENQ5W
The RCMP treats women fairly.
Strongly agree: 1
Agree: 2
Neither agree nor disagree: 3
Disagree: 4
Strongly disagree: 5
Don't know/ No response: 99 XS
SENQ5X
The RCMP is sensitive to the needs of the LGBTQ2 community.
Strongly agree: 1
Agree: 2
Neither agree nor disagree: 3
Disagree: 4
Strongly disagree: 5
Don't know/ No response: 99 XS
PQ5Y - Visibility and responsiveness
RESQ5Y
The RCMP personnel have a visible presence in my community/province/territory.
Strongly agree: 1
Agree: 2
Neither agree nor disagree: 3
Disagree: 4
Strongly disagree: 5
Don't know/ No response: 99 XS
RESQ5Z
The RCMP is present on the Web and social media, such as Twitter, Facebook, etc.
Strongly agree: 1
Agree: 2
Neither agree nor disagree: 3
Disagree: 4
Strongly disagree: 5
Don't know/ No response: 99 XS
RESQ5AA
The RCMP is effective at responding quickly to calls for assistance.
Strongly agree: 1
Agree: 2
Neither agree nor disagree: 3
Disagree: 4
Strongly disagree: 5
Don't know/ No response: 99 XS
RESQ5BB
The RCMP is contributing to traffic safety in my province or territory.
Strongly agree: 1
Agree: 2
Neither agree nor disagree: 3
Disagree: 4
Strongly disagree: 5
Don't know/ No response: 99 XS
RESQ5CC
The RCMP makes decisions based on facts.
Strongly agree: 1
Agree: 2
Neither agree nor disagree: 3
Disagree: 4
Strongly disagree: 5
Don't know/ No response: 99 XS
RESQ5DD
The RCMP is a forward-looking, innovative organization.
Strongly agree: 1
Agree: 2
Neither agree nor disagree: 3
Disagree: 4
Strongly disagree: 5
Don't know/ No response: 99 XS
PQ5EE - Priorities of the RCMP
PRIQ5EE
The RCMP is addressing youth involvement in crime as both victims and offenders.
Strongly agree: 1
Agree: 2
Neither agree nor disagree: 3
Disagree: 4
Strongly disagree: 5
Don't know/ No response: 99 XS
PRIQ5FF
The RCMP is reducing the threat and impact of organized crime.
Strongly agree: 1
Agree: 2
Neither agree nor disagree: 3
Disagree: 4
Strongly disagree: 5
Don't know/ No response: 99 XS
PRIQ5GG
The RCMP is reducing the threat and impact of serious crime, such as murder, sexual assault, robbery, and arson.
Strongly agree: 1
Agree: 2
Neither agree nor disagree: 3
Disagree: 4
Strongly disagree: 5
Don't know/ No response: 99 XS
PRIQ5HH
The RCMP is effective at resolving crimes where violence is involved.
Strongly agree: 1
Agree: 2
Neither agree nor disagree: 3
Disagree: 4
Strongly disagree: 5
Don't know/ No response: 99 XS
PRIQ5II
The RCMP is effectively responding to threats to national security.
Strongly agree: 1
Agree: 2
Neither agree nor disagree: 3
Disagree: 4
Strongly disagree: 5
Don't know/ No response: 99 XS
PRIQ5JJ
The RCMP is effectively responding by countering radicalization to violence.
Strongly agree: 1
Agree: 2
Neither agree nor disagree: 3
Disagree: 4
Strongly disagree: 5
Don't know/ No response: 99 XS
PRIQ5KK
The RCMP is effectively responding to threats to Canadian passenger aircraft.
Strongly agree: 1
Agree: 2
Neither agree nor disagree: 3
Disagree: 4
Strongly disagree: 5
Don't know/ No response: 99 XS
PRIQ5LL
The RCMP is contributing to safer Indigenous communities.
Strongly agree: 1
Agree: 2
Neither agree nor disagree: 3
Disagree: 4
Strongly disagree: 5
Don't know/ No response: 99 XS
PRIQ5MM
The RCMP is advancing reconciliation with Indigenous peoples of Canada.
Strongly agree: 1
Agree: 2
Neither agree nor disagree: 3
Disagree: 4
Strongly disagree: 5
Don't know/ No response: 99 XS
PRIQ5NN
The RCMP is contributing to more informed and resilient Canadians.
Strongly agree: 1
Agree: 2
Neither agree nor disagree: 3
Disagree: 4
Strongly disagree: 5
Don't know/ No response: 99 XS
PRIQ5OO
The RCMP is reducing the overall impact of economic crime.
Strongly agree: 1
Agree: 2
Neither agree nor disagree: 3
Disagree: 4
Strongly disagree: 5
Don't know/ No response: 99 XS
PRIQ5PP
The RCMP is effectively responding to cybercrime threats.
Strongly agree: 1
Agree: 2
Neither agree nor disagree: 3
Disagree: 4
Strongly disagree: 5
Don't know/ No response: 99 XS
PRIQ5QQ
The RCMP is effectively addressing online scams.
Strongly agree: 1
Agree: 2
Neither agree nor disagree: 3
Disagree: 4
Strongly disagree: 5
Don't know/ No response: 99 XS
PRIQ5RR
The RCMP is reducing the sale and distribution of illegal drugs.
Strongly agree: 1
Agree: 2
Neither agree nor disagree: 3
Disagree: 4
Strongly disagree: 5
Don't know/ No response: 99 XS
PRIQ5SS
The RCMP is effectively responding to threats at the border between the ports of entry.
Strongly agree: 1
Agree: 2
Neither agree nor disagree: 3
Disagree: 4
Strongly disagree: 5
Don't know/ No response: 99 XS
PRIQ5TT
The RCMP is keeping up with current and emerging trends and threats.
Strongly agree: 1
Agree: 2
Neither agree nor disagree: 3
Disagree: 4
Strongly disagree: 5
Don't know/ No response: 99 XS
PRIQ5UU
I am aware that the RCMP participates in a variety of international activities, such as peacekeeping missions and offering training to foreign police.
Strongly agree: 1
Agree: 2
Neither agree nor disagree: 3
Disagree: 4
Strongly disagree: 5
Don't know/ No response: 99 XS
Q6
About how often would you say that the RCMP in your neighbourhood exceeds their authority?
Always / almost always: 1
Most of the time: 2
Sometimes: 3
Rarely: 4
Never / almost never: 5
Don't know: 99 X
Q7
In the past year, did you have any direct contact with the RCMP, such as reporting a crime, being stopped for a traffic offence or accident, seeking information, or any other reason?
Yes: 1
No: 2 ->Q12
Don't know: 99 X ->Q12
Q8
If... Q7 = 1
What was the reason for your most recent contact with the RCMP?
For a criminal matter: 1
For a traffic offence or an accident: 2
For a complaint: 3
For a natural disaster, e.g. flood, wildfire: 4
For a crime prevention activity, project, or program: 5
For another reason: 6
Don't know: 99 X
Q9
If... Q7 = 1
Still thinking of the most recent contact, did you initiate the contact with the RCMP yourself?
Yes: 1
No: 2
Don't know: 99 X
PQ10
If... Q7 = 1
Regarding your contact(s) with the RCMP in the last year, please indicate whether you strongly agree, agree, neither agree nor disagree, disagree or strongly disagree with each of the following statements about the RCMP's performance.
If a statement does not apply, select "Not applicable".
Q10A
If... Q9 = 1
It was easy to get in touch with the RCMP.
Strongly agree: 1
Agree: 2
Neither agree nor disagree: 3
Disagree: 4
Strongly disagree: 5
Not applicable: 98 XS
Don't know: 99 XS
Q10B
If... Q7 = 1
RCMP personnel treated me fairly.
Strongly agree: 1
Agree: 2
Neither agree nor disagree: 3
Disagree: 4
Strongly disagree: 5
Not applicable: 98 XS
Don't know: 99 XS
Q10C
If... Q7 = 1
RCMP personnel demonstrated professionalism.
Strongly agree: 1
Agree: 2
Neither agree nor disagree: 3
Disagree: 4
Strongly disagree: 5
Not applicable: 98 XS
Don't know: 99 XS
Q10D
If... Q7 = 1
RCMP personnel were courteous and respectful.
Strongly agree: 1
Agree: 2
Neither agree nor disagree: 3
Disagree: 4
Strongly disagree: 5
Not applicable: 98 XS
Don't know: 99 XS
Q10E
If... Q7 = 1
RCMP personnel were knowledgeable and competent.
Strongly agree: 1
Agree: 2
Neither agree nor disagree: 3
Disagree: 4
Strongly disagree: 5
Not applicable: 98 XS
Don't know: 99 XS
Q10F
If... Q7 = 1
RCMP personnel delivered the service in a timely fashion.
Strongly agree: 1
Agree: 2
Neither agree nor disagree: 3
Disagree: 4
Strongly disagree: 5
Not applicable: 98 XS
Don't know: 99 XS
Q10G
If... Q7 = 1
RCMP personnel went beyond minimum requirements in providing good service.
Strongly agree: 1
Agree: 2
Neither agree nor disagree: 3
Disagree: 4
Strongly disagree: 5
Not applicable: 98 XS
Don't know: 99 XS
Q10H
If... Q7 = 1
RCMP personnel gave me all the information that I needed for the situation.
Strongly agree: 1
Agree: 2
Neither agree nor disagree: 3
Disagree: 4
Strongly disagree: 5
Not applicable: 98 XS
Don't know: 99 XS
Q11
If... Q7 = 1
How satisfied were you with the service you received during your contact(s) with the RCMP?
Very satisfied: 1
Somewhat satisfied: 2
Neither satisfied nor dissatisfied: 3
Somewhat dissatisfied: 4
Very dissatisfied: 5
Don't know: 99 X
Q12
In which of the following age categories do you belong?
18-34 years: 1
35-49 years: 2
50-64 years: 3
65 years or older: 4
Prefer not to answer: 99 X
Q13
What is the highest level of formal education that you have completed?
Grade 8 or less: 1
Some high school: 2
High School diploma or equivalent: 3
Post-secondary courses: 4
Registered Apprenticeship or other trades certificate or diploma: 5
College, CEGEP or other non-university certificate or diploma: 6
University certificate or diploma below Bachelor's level: 7
Bachelor's degree: 8
Post graduate degree above bachelor's level: 9
Prefer not to answer: 99 X
Q14
Do you consider yourself...
Select all that apply.
A person with a disability: 1
A member of a visible minority group: 2
An Indigenous person: 3
A member of the LGBTQ2 community: 4
None of the above: 5 X
Don't know / Prefer not to answer: 99 X
Q15
Which of the following best describes the community you live in:
Population up to 1,000 1
Population of 1,001 to 5,000 2
Population of 5,001 to 15,000 3
Population of 15,001 to 30,000 4
Population of 30,001 to 100,000 5
Population over 100,000 6
Don't know: 99 X
Q16
Do you live in an Indigenous community, settlement or reserve?
Yes: 1
No: 2
Don't know / Prefer not to answer: 99 X
Q17
What is your gender?
Male: 1
Female: 2
Other: 3
Prefer not to answer: 99 X
Q18
Please indicate the first three characters of your postal code:
Please specify : 1
Don't know / Prefer not to answer: 99 X
Thank you
Thank you very much for taking the time to complete this survey.