Findings report
Prepared for Transport Canada
Supplier: Phoenix Strategic Perspectives Inc. (Phoenix SPI)
Contract Number: T8053-210135
Contract Value: $84,709.25 (including HST)
Award Date: 2021-11-26
Delivery Date: 2022-03-31
Registration Number: POR 050-21
For more information on this report, please contact Transport Canada at TC.Publicopinion-Opinionpublique.TC@tc.gc.ca.
This public opinion research report presents the results of an online survey conducted by Phoenix SPI on behalf of Transport Canada. The research study was conducted with 1,003 Canadians between January 26 and March 20, 2022.
Cette publication est aussi disponible en français sous le titre Recherche sur l'opinion publique: connaissances et compréhension de la population canadienne concernant les épaulards résidents du sud et la sécurité nautique.
This publication may be reproduced for non-commercial purposes only. Prior written permission must be obtained from Transport Canada. For more information on this report, please contact Transport Canada at: TC.Publicopinion-Opinionpublique.TC@tc.gc.ca.
Transport Canada
330 Sparks Street
Ottawa, ON
K1A 0N5
Catalogue Number: T22-251/1-2022E-PDF
International Standard Book Number (ISBN): 978-0-660-43894-8
Related publications (registration number: POR 050-21):
© Her Majesty the Queen in Right of Canada, as represented by the Minister of Public Works and Government Services, 2022.
Transport Canada commissioned Phoenix Strategic Perspectives Inc. (Phoenix SPI) to conduct public opinion research with residents of south coastal British Columbia (BC) and selected areas of Vancouver Island who use or plan to use recreational watercrafts.
The main purpose of the research was to conduct a follow-up study to the one conducted in 2021 on the awareness of Southern Resident killer whale (SRKW) mandatory and voluntary protective measures and of boating safety in the southern coastal waters of British Columbia. Specific objectives included measuring the awareness of Transport Canada's efforts to protect the SRKW, measuring the awareness and recall of the related advertising campaign, and determining the use of depth finder technology since reducing the impact of underwater noise is one of the goals of the Whales Initiative.
An 11-minute random digit dialling (RDD) telephone survey was administered to 1,003 adults aged 18 and older who reside in coastal communities on the south coast of British Columbia and selected areas of Vancouver Island and who meet the eligibility criteria for boating. The fieldwork was conducted between January 26 and March 20, 2022. For the purposes of this research, to be classified as a boater, adults must have done the following at least once in the previous 12 months or plan to do so in the coming 12 months:
1) own, operate, rent, or be a passenger on a recreational vessel, motorized or sail; and/or
2) paddle board, kayak, or canoe on the ocean during this timeframe.
Based on a sample of this size, the overall results can be considered accurate within ±3.1%, 19 times out of 20. The margin of error is greater for results pertaining to subgroups of the full sample. Data were weighted to reflect the population in terms of age, gender, and area (with the geographic parameters of the study). For a more complete description of the methodology, refer to the Appendix: 1, Technical Specifications.
There was relatively widespread awareness (60%) of protective measures in place to protect Southern Resident killer whales in BC coastal waters (a slight increase from 2021, when 56% said they were aware). Boat owners, year-round watercraft users, Vancouver Island residents, and those aged 35+ were more likely to be aware of the protective measures.
Awareness of the specific mandatory and voluntary protective measures varied considerably. In total, 73% said they were aware (47% definitely, 25% somewhat) of the measure that boats should reduce speed within 1,000 metres of a killer whale. Following this, close to six in 10 were definitely (35%) or somewhat (24%) aware that watercraft must keep 400 metres from killer whales in all southern BC coastal waters. Awareness of the voluntary measure that fishing should not take place within 1,000 metres of a killer whale was divided: 46% were somewhat (20%) or definitely (26%) aware and 53% were not aware. The majority of respondents were not aware that whale watching boats should not be followed nor were they aware of any of the interim sanctuary zones.
Two-thirds of respondents have used a recreational watercraft in the last year. Notably,boat owners were more likely than boat renters and passengers to have been out on the ocean in the last year. The rest (34%) intend to go out on the ocean in a recreational watercraft in the next year, either as a boat owner and operator, renter, or passenger.
Among respondents who were out on the ocean this past year, 42% said they went out as a passenger, 32% as a boat owner, and 19% as boat renter. In contrast, 59% of those who plan to go out on the ocean in the next year intend to go as a passenger, 9% as a boat owner, and 22% as a boat renter. Taken together, nearly half the survey respondents (48%) were (or plan to be) passengers, 24% were (or plan to be) boat owners/operators, and 20% rented (or plan to rent) a watercraft.
Approximately four in 10 (43%) have been out on the ocean in a power boat in the last few years, while 31% have been out in a kayak. A range of other watercraft were used or will be used by 14% or fewer respondents. Residents of the Sunshine Coast and Central Vancouver Island were more likely than others to have been out in a power boat in recent years, especially compared to those in Metro Vancouver.
Two in five (37%) use a depth finder when out on the ocean.Boat owners and passengers were more likely to say they use a depth finder compared to watercraft renters. Powerboat users and year-round watercraft users were also more likely to report using a depth finder. Just over two-thirds (68%) who use a depth finder use it for navigational purposes, while 57% use it for fishing. Not surprisingly, boat owners were more likely than passengers to use a depth finder for navigation.
In total, 78% always wear or plan to wear a life jacket or personal flotation device (PFD) when out on the ocean. Boat owners and renters were more likely to say they wear a life jacket or PFD compared to watercraft passengers. Seasonal watercraft users were also more likely to report wearing a life jacket or PFD as compared to year-round boaters. Those who go out in kayaks were also more likely to report wearing a life jacket or PFD.
The source for obtaining boating safety and regulatory information used most often by respondents was Google (16%). Following this, 14% turn to friends, family, and colleagues, while almost as many (13%) reported getting this type of information from boat rental shops. Nine percent pointed to Transport Canada and the internet as their main sources of boating safety and regulatory information. Nine percent of those surveyed said they have never needed to look for this type of information. Boat owners were more likely to say they get their boating safety and regulatory information from the internet (24%), while renters were more likely to mention boat rental shops (44%) and passengers to point to friends, family, and colleagues (17%).
Just under half (47%) recalled hearing or seeing an advertisement about protecting the killer whales in BC coastal waters by staying away from them when boating. Boat owners and year-round watercraft users were most likely to recall seeing or hearing an advertisement. Vancouver Island residents were also more likely to recall hearing or seeing an advertisement.
Of those who recall seeing or hearing any advertisement about protecting killer whales in BC coastal waters (n=531), one-third (32%) said they recall seeing an advertisement on television.Footnote 1 Just under one-quarter said they recall the advertisement from social media or from the radio (23%, respectively). Respondents from Metro Vancouver and Central Vancouver Island were more likely to say they recall the ad on television. Boat owners were more likely to recall seeing an advertisement on a physical poster, sign, or pamphlet, while passengers were more likely to recall the ad on television.
Twenty-eight percent of those who recalled an ad, said the main message of the ad was "help keep killer whales safe". This was followed by "slow down and stay away if you see a whale", mentioned by 24%. Additionally, 19% said they recall the message of "Stay 400 metres away from killer whales." Boat owners were most likely to recall a message about "stay 400 metres away from killer whales."
Probability sampling was used. The results, therefore, are generalizable to the target population. The only limitation are smaller sample sizes when it comes to analyzing the results for sub-groups of the population. The survey results will be used by Transport Canada to help inform communications planning, outreach and education activities, and to improve boaters' confidence, awareness and compliance with the voluntary and mandatory protective measures for the SRKW and associated boating safety regulations.
The contract value was $84,709.25 (HST included).
I hereby certify as a Senior Officer of Phoenix Strategic Perspectives that the deliverables fully comply with the Government of Canada political neutrality requirements outlined in the Communications Policy of the Government of Canada and Procedures for Planning and Contracting Public Opinion Research. Specifically, the deliverables do not contain any reference to electoral voting intentions, political party preferences, standings with the electorate, or ratings of the performance of a political party or its leader.
(original signed by)
Alethea Woods
President
Phoenix Strategic Perspectives Inc.
Phoenix Strategic Perspectives Inc. (Phoenix SPI) was commissioned by Transport Canada to conduct a survey on boaters' awareness and understanding of Southern Resident killer whales (SRKW) and boating safety.
Building on the Ocean's Protection Plan in Budget 2018, the Government of Canada introduced a 5-year $167.4 million Whales Initiative to help protect and support the recovery of the Southern Resident killer whale, the North Atlantic right whale, and the St. Lawrence Estuary beluga whale. In October 2018, the Government of Canada announced an additional $61.5 million specifically to address threats to Southern Resident killer whales following the finding that the Southern Resident killer whales were facing an imminent threat to their survival.
Through this funding, the Government of Canada is addressing the main threats to the Southern Resident killer whales by:
For the third year in a row, Transport Canada has put in place an Interim Order under the Canada Shipping Act, 2001 to help reduce acoustic and physical disturbance from vessels in key areas of importance to the SRKW.
The measures include:
Given Transport Canada's mandate to promote environmentally-responsible transportation and to put in place measures to address vessel-related threats to endangered whales, the Department commissioned public opinion research to measure awareness of the vessel management measures – both mandatory and voluntary – and of boating safety in the southern coastal waters of British Columbia. The survey results will help to better inform communications planning, outreach, and education activities, and to improve boaters' confidence, awareness, and compliance with the voluntary and mandatory measures for the SRKW and associated boating safety regulations.
An 11-minute random digit dialling (RDD) telephone survey was completed with 1,000 adults aged 18 and older who reside in coastal communities located on the south coast of British Columbia and selected areas of Vancouver Island and who met the eligibility criteria for boating. Specifically, this included the coastal communities between Campbell River and Ucluelet on Vancouver Island, and residents of the Sunshine Coast, the Lower Mainland and Howe Sound.
To be classified as a boater, adults must have done the following at least once in the previous 12 months or plan to do so in the coming 12 months:
1) own, operate, rent, or be a passenger on a recreational vessel, motorized or sail; and/or
2) paddle board, kayak, or canoe on the ocean during this timeframe.
Based on a sample of this size, the overall results can be considered accurate to within ±3.1%, 19 times out of 20. The margin of error is greater for results pertaining to subgroups of the total sample.
The data was weighted to reflect the population in terms of age, gender, and region. The fieldwork was conducted January 26 and March 20, 2022. For a more complete description of the methodology, refer to the Appendix: 1, Technical Specifications.
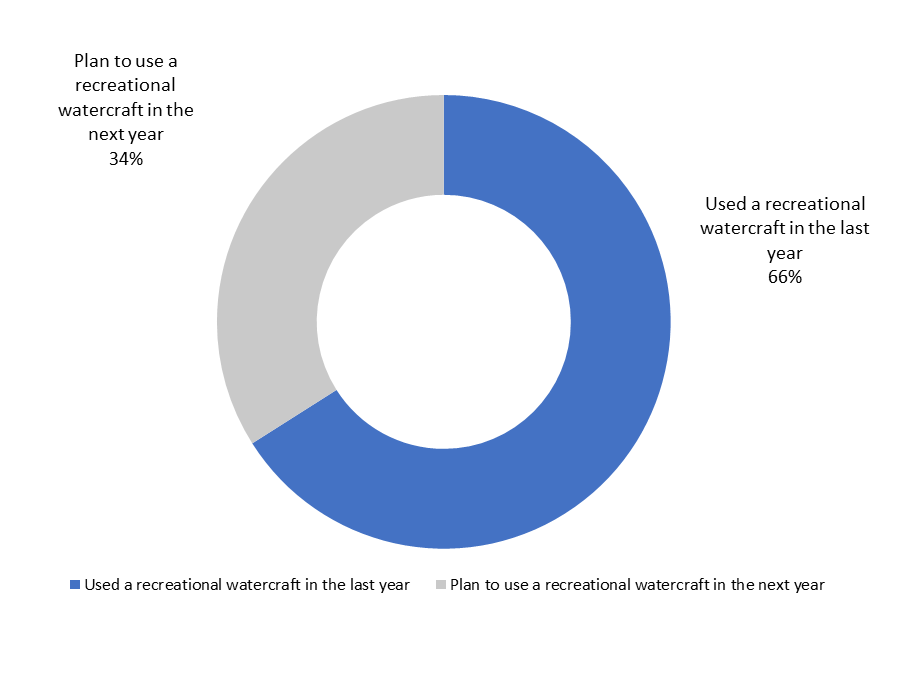
Two-thirds of respondents (66%) have gone out on the ocean in or on a recreational watercraft in the last year. By design, the remainder (34%) plan to use a recreational watercraft in the coming year.
| Used a recreational watercraft in the last year | 66% |
| Plan to use a recreational watercraft in the next year | 34% |
SCR. 1A. In the last year, did you go out on the ocean in or on a recreational watercraft?
SCR. 1B. In the next year, do you plan to go out on the ocean in or on a recreational watercraft?
Base: n=1,003; all respondents
Boat owners (87%) were significantly more likely than renters (62%), passengers (58%), and those who go out in multiple roles (62%) to have been out on the ocean in the last year. In addition, respondents from South Vancouver Island (77%), Central Vancouver Island (74%) and the Sunshine Coast (74%) were more likely than those from Metro Vancouver (63%) to report having been out on the ocean in the last year, as were those between 35 to 54 years old (69% versus 61% of those 55 or older) and respondents from higher income households (68% of those from households with incomes of $60,000 to under $100,000 and 73% of those with incomes of $100,000 and over versus 48% of those from lower income households). Those who use depth finders (81%) were more likely than those who do not use a depth finder (72%) to have been out on the ocean in the last year.
Among respondents who were out on the ocean this past year (n=676), 42% said they went out as a passenger, 32% as a boat owner, and 19% as boat renter. In contrast, 59% of those who plan to go out on the ocean in the next year (n=327) intend to go as a passenger, 9% as a boat owner, and 22% as a boat renter.
Taken together, nearly half of survey respondents (48%) were (or plan to be) passengers, 24% were (or plan to be) boat owners/operators, and 20% rented (or plan to rent) a watercraft. Eight percent reported doing, or planning to do, a combination of these things (i.e., going out as a passenger and a boat renter, or as a boat owner and a passenger, etc.).
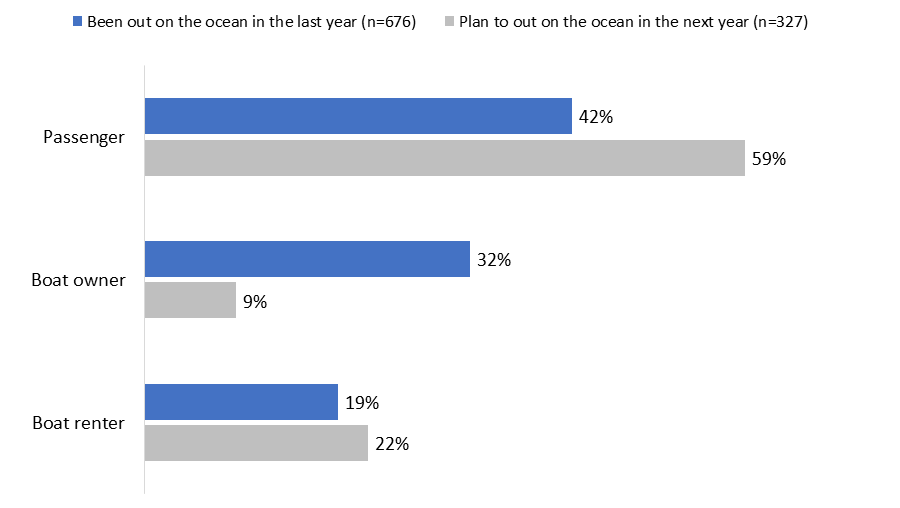
| Been out on the ocean in the last year (n=676) | Plan to out on the ocean in the next year (n=327) | |
| Passenger | 42% | 59% |
| Boat owner | 32% | 9% |
| Boat renter | 19% | 22% |
SCR2A/B. When you were out on the ocean this year/go out on the ocean in the next year, will you go out/did you go out as a watercraft owner, renter, or passenger? [multiple responses accepted]
Base: all respondents; [DK/NR: 1%].
The following subgroup differences of those who went out, or plan to go out on the ocean were noteworthy:
Forty-three percent (43%) of survey respondents have been out on the ocean on a power boat in the last few years, most likely to be a passenger or boat owner. Fewer (31%), but still almost one-third, said they have been out on the ocean in a kayak (inflatable or hard shell), most likely as an owner or renter.
These results are similar to the proportions from the previous study conducted in 2021, when 42% said they had been out on a power boat and 33% on a kayak. Additionally, these were the top types of watercrafts mentioned, by a wide margin. Following power boats and kayaks, smaller and similar proportions said they have been out on a paddleboard (14%), a sailboat (13%), or a canoe (10%). The full range of watercrafts identified can be found in Figure 3.
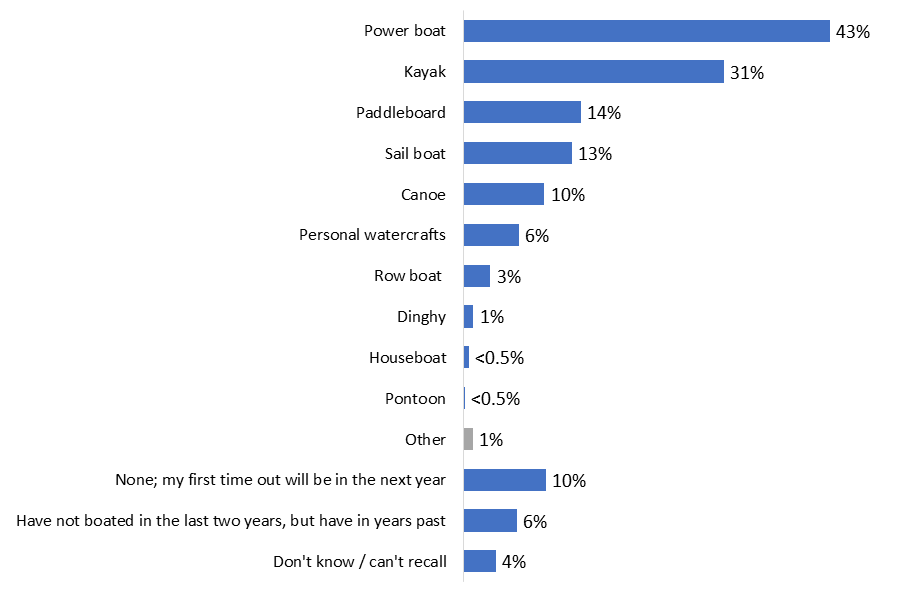
| Power boat | 43% |
| Kayak | 31% |
| Paddleboard | 14% |
| Sail boat | 13% |
| Canoe | 10% |
| Personal watercrafts | 6% |
| Row boat | 3% |
| Dinghy | 1% |
| Houseboat | 0.59% |
| Pontoon | 0.12% |
| Other | 1% |
| None; my first time out will be in the next year | 10% |
| Have not boated in the last two years, but have in years past | 6% |
| Don't know / can't recall | 4% |
Q3. What type of recreational watercraft have you used on the ocean in the last few years? [multiple responses accepted]
Base: n=1,003; All respondents.
Respondents who went out on the ocean in a power boat were more likely to have been located on Sunshine Coast (56%) and Central Vancouver Island (55%), particularly compared to those in Metro Vancouver (40%). This was also the case for those reporting annual household incomes of $100,000 or more. They were more likely than respondents from lower-income households to report having used a power boat in the last year (47% of those with incomes of $100,000 and more compared to 35% of those with incomes under $60,000). Those who went out on a power boat were most likely to be passengers (51%), be aware of the protective measures (48%), use a depth finder (74%) and recall ads (49%).
Kayak users were more likely to be 18 to 34 and 35 to 54 years of age (36% and 33% respectively versus 25% of those aged 55+), to be boat owners and renters (44% each) than passengers (29%), to not use a depth finder (44%), to be from South Vancouver Island (41%) compared to those from Metro Vancouver (29%) and Sunshine Coast (27%), to have a household income of $60,000 to just under $100,000 (36%) than those with an income of under $60,000 (26%), and to be female (36% versus 26% of males).
In a typical year, roughly three in ten respondents said they go out on the ocean in a watercraft for recreational purposes once (15%) or twice (13%). At the other end of the spectrum, an additional three in ten are typically out on the ocean 10 to 29 times (18%) or 30 or more times (9%). Most of the rest (28%) said they are out on the ocean three to nine times in a typical year. Notably, 13% are first-time watercraft users—that is, they volunteered that they do not typically go out on the ocean in a watercraft or that their plans to go out in the next year will be their first time on the ocean in a watercraft for recreational purposes.
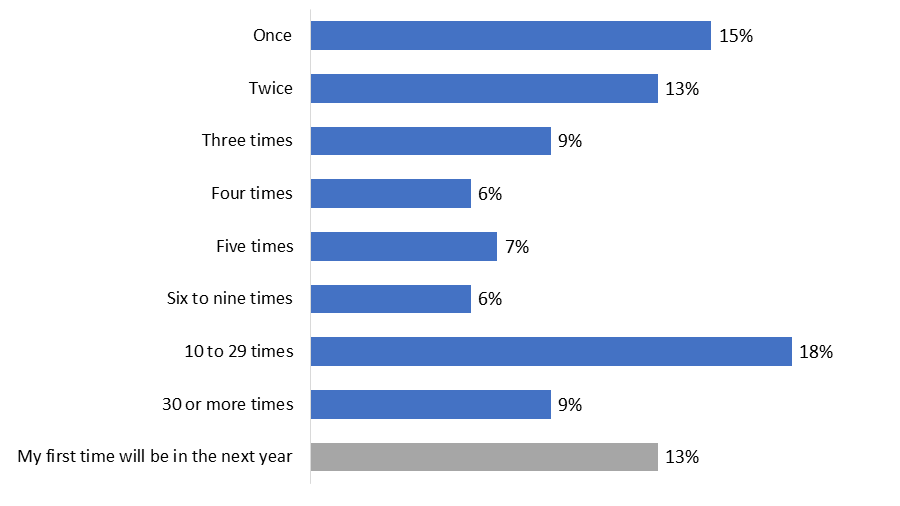
| Once | 15% |
| Twice | 13% |
| Three times | 9% |
| Four times | 6% |
| Five times | 7% |
| Six to nine times | 6% |
| 10 to 29 times | 18% |
| 30 or more times | 9% |
| My first time will be in the next year | 13% |
Q4. On average, how many times a year do you typically go out on the ocean in a watercraft for recreational purposes?
Base: n=1,003; All respondents. [DK/NR: 3%].
These proportions are similar to the previous study of 2021 when one third said they went out no more than twice a year, one-quarter said they went out on the ocean 10 or more times, and 28% said they went out between three to nine times.
Boat owners were more likely than others to report going out on the ocean 10 or more times in a typical year.
The vast majority of coastal BC residents surveyed (84%) tend to go out on the ocean in a recreational watercraft as a seasonal activity. In contrast, 13% do so year-round, while 2% volunteered that it depends. These results are relatively unchanged from the previous study – 85% said it was a seasonal activity, 13% it was a year-round, and 1% said it depended.
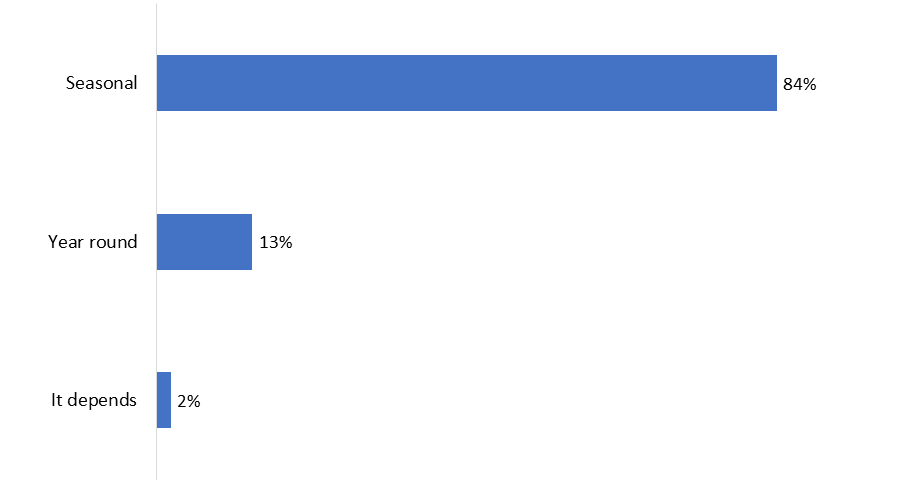
| Seasonal | 84% |
| Year round | 13% |
| It depends | 2% |
Q5. Do you tend to go out on ocean in a watercraft all year long or is this a seasonal activity?
Base: n=851; Respondents who typically go out on the ocean in a watercraft for recreational purposes. [DK/NR: 1%].
Those who typically go out on the ocean in or on a watercraft for recreational purposes all year round were more likely to be boat owners (23%), to be aware that there are measures in place to protect SRKW in BC coastal waters (16%), to live on South (25%) or Central (19%) Vancouver Island, to use a depth finder (20%), to recall ads (17%), and to be aged 55 and older (15%) compared to those 18 to 34 years old (8%).
The likelihood of going out on the ocean on a seasonal basis was higher among those not aware of the protective measures (92%), to be boat renters (90%) or passengers (86%) compared to boat owners (76%), to live in Metro Vancouver (87%), not use a depth finder (88%), not recall ads (87%), and be under 35 years of age (90%).
More than a third of respondents (37%) who typically go out in a watercraft for recreational purposes said they use a depth finder when they go out on the ocean. Conversely, 61% said they do not use a depth finder, while 2% volunteered that they did not know.
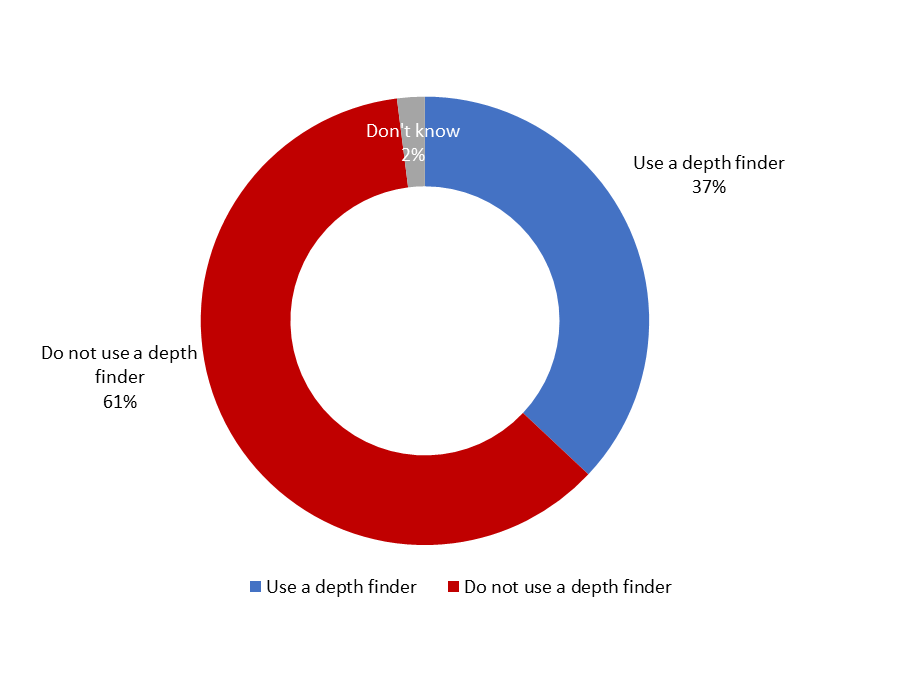
| Use a depth finder | 37% |
| Do not use a depth finder | 61% |
| Don't know | 2% |
Q5A. When out on the ocean for recreational purposes, have you used a depth finder, also sometimes called an echo sounder?
Base: n=851; Respondents who typically go out on the ocean in a watercraft for recreational purposes.
The likelihood of using a depth finder was higher among those who use watercraft multiple ways (45%), and boat owners (42%) and passengers (42%) compared to boat renters (16%). Furthermore, those who went out in a powerboat (55%), are year-round boaters (56%), are aware that there are measures in place to protect SRKW in BC coastal waters (44%), and to recall the ads (44%) were most likely to use a depth finder. Additionally, those who live in Central Vancouver (52%) compared to Metro Vancouver (33%), are men (47%), and 55 years old and older (43%) compared to those 18 to 34 years old (28%) are more likely to use a depth finder.
Respondents who use a depth finder were asked why they use it. Navigational purposes was the reason mentioned most often, cited by 68%. This was followed by 57% saying they use a depth finder for finding fish. Few (2%) said they use a depth finder for safety or safety measures in general.
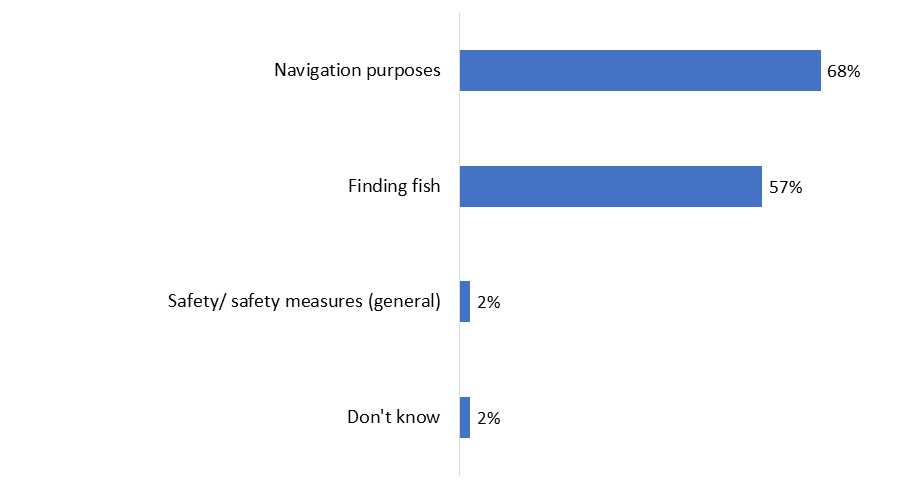
| Navigation purposes | 68% |
| Finding fish | 57% |
| Safety/ safety measures (general) | 2% |
| Don't know | 2% |
Q5B. For what purpose have you used a depth finder? [multiple responses accepted]
Base: n=353; Respondents who typically go out on the ocean in a watercraft for recreational purposes and use a depth finder
Boat owners (78%) were more likely than passengers (62%) to use a depth finder for navigation purposes. Additionally, those who go out on a recreational watercraft all year (81%) were more likely to use it for navigation than those who only go out seasonally (63%).
Those who are Indigenous (76%) were more likely than non-Indigenous (55%) to use a depth finder for finding fish.
Of those who use a depth finder when out on a recreational watercraft, half (49%) said they used a depth finder every time. Following this, 15% each said they used it either most of the time or some of the time, with 20% saying they rarely used a depth finder.
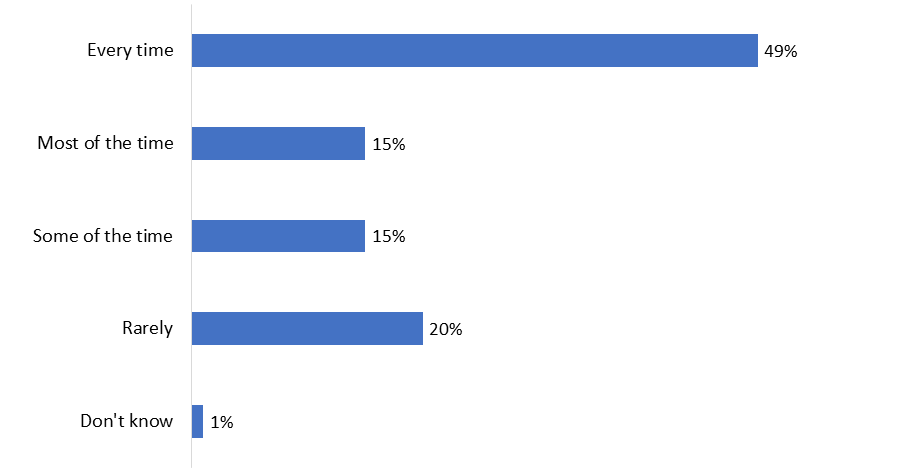
| Every time | 49% |
| Most of the time | 15% |
| Some of the time | 15% |
| Rarely | 20% |
| Don't know | 1% |
Q5C. How frequently do you use a depth finder when out on the ocean for recreational purposes?
Base: n=353; Respondents who typically go out on the ocean in a watercraft for recreational purposes and use a depth finder
Residents of Central (63%) and South (54%) Vancouver Island were more likely to say they use a depth finder every time they go out, especially compared to those from Sunshine Coast (31%).
The large majority of respondents (78%) said they wear or plan to wear a life jacket or personal flotation device (PFD) when they go out on the ocean. Among the rest, 14% reported not wearing or planning not to wear a life jacket or PFD, while 4% volunteered that whether they wear a life jacket or PFD depends on the type of watercraft. As well, 3% said it depends on the situation and people involved.
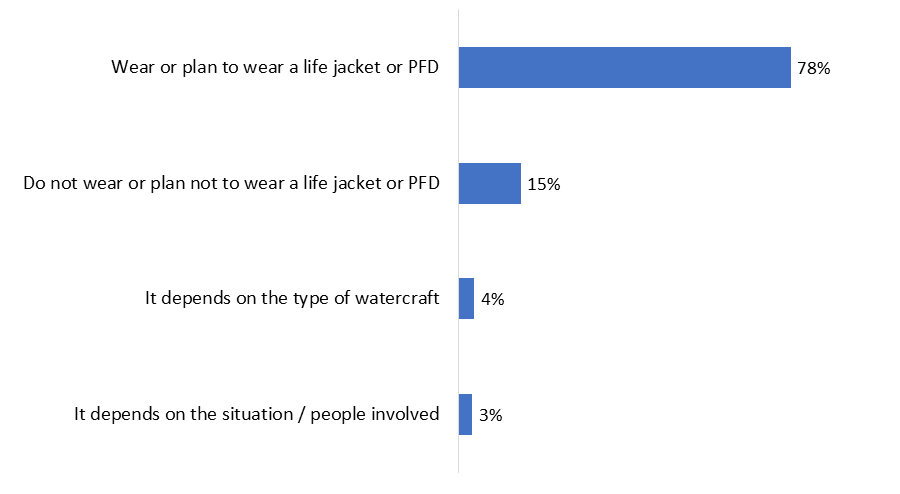
| Wear or plan to wear a life jacket or PFD | 78% |
| Do not wear or plan not to wear a life jacket or PFD | 15% |
| It depends on the type of watercraft | 4% |
| It depends on the situation / people involved | 3% |
Q6. When you go out on the ocean, do you wear a life jacket or personal flotation device?
Q6B. When you go out on the ocean in the next year, do you plan to wear a life jacket?
Base: n=1,003; All respondents. [DK/NR: <0.5%]
The following groups were more likely to say they wear a life jacket or PFD when out on the ocean: boat owners (79%) and boat renters (89%), kayakers (84%), seasonal watercraft users (80%), and those who do not use a depth finder (82%).
The sample size for those who plan to go out on the ocean in the next year is too small for subgroup analysis.
There was relatively widespread awareness (60%) of protective measures in place to protect Southern Resident killer whales in BC coastal waters. This is a slight increase from the previous study in 2021, when 56% said they were aware. Conversely, 15% were not aware of these protective measures, a decrease from 19% in 2021. As well, 25% were unsure (unchanged from 2021).
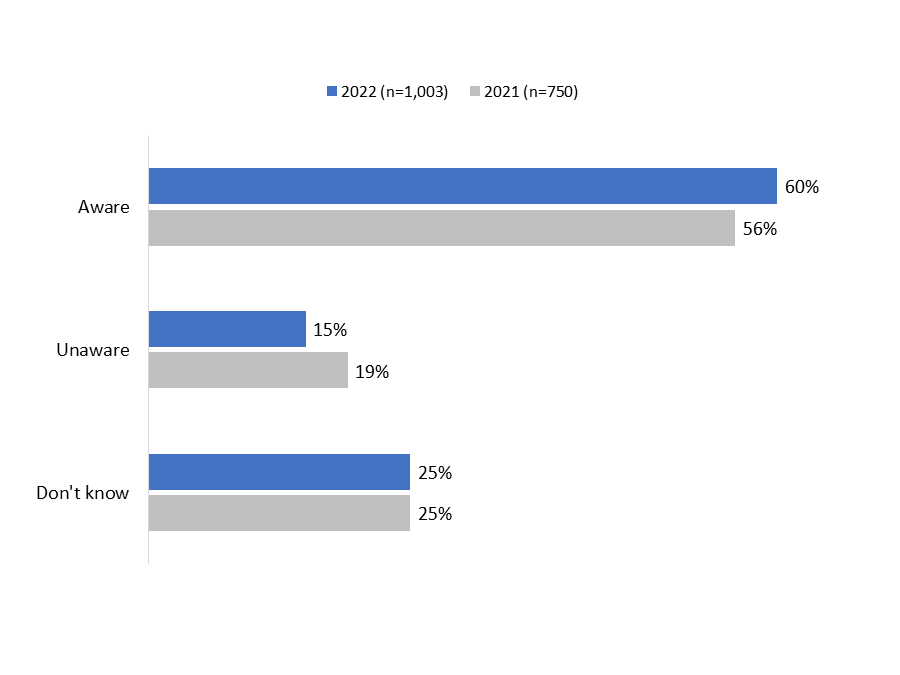
| 2022 (n=1,003) | 2021 (n=750) | |
| Aware | 60% | 56% |
| Unaware | 15% | 19% |
| Don't know | 25% | 25% |
Q1. To the best of your knowledge, are there any protective measures in place to protect Southern Resident Killer whales in BC coastal waters?
Base: n=1,003; All respondents.
The following groups were more likely to be aware that there are measures in place to protect Southern Resident killer whales:
After being asked about protective measures in general, respondents were informed that there are mandatory and voluntary measures in place designed to protect Southern Resident killer whales. These measures were then read to respondents who were asked to indicate whether they are aware of each, either definitely or vaguely aware. The measures included:
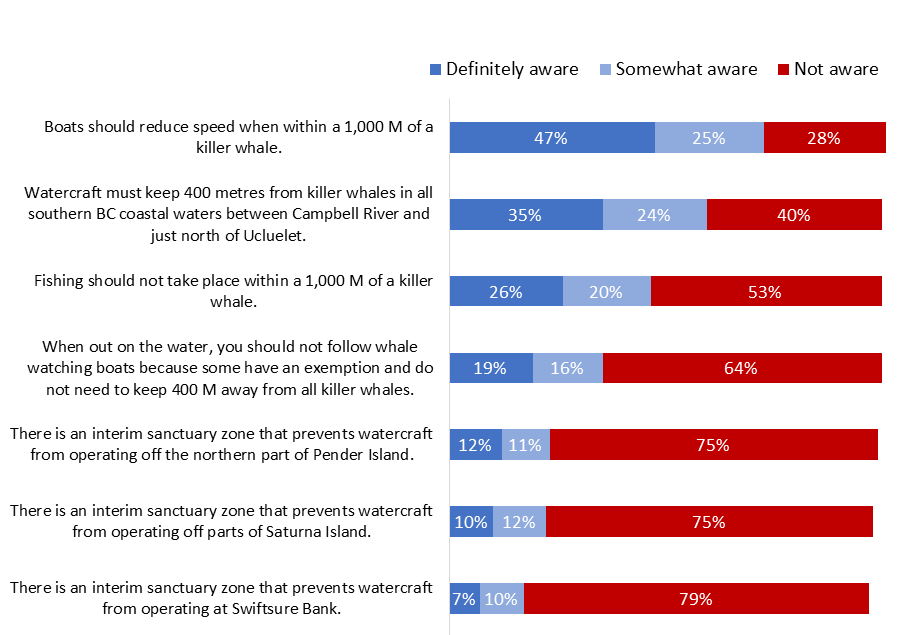
| Definitely aware | Somewhat aware | Not aware | |
| Boats should reduce speed when within a 1,000 M of a killer whale. | 47% | 25% | 28% |
| Watercraft must keep 400 metres from killer whales in all southern BC coastal waters between Campbell River and just north of Ucluelet. | 35% | 24% | 40% |
| Fishing should not take place within a 1,000 M of a killer whale. | 26% | 20% | 53% |
| When out on the water, you should not follow whale watching boats because some have an exemption and do not need to keep 400 M away from all killer whales. | 19% | 16% | 64% |
| There is an interim sanctuary zone that prevents watercraft from operating off the northern part of Pender Island. | 12% | 11% | 75% |
| There is an interim sanctuary zone that prevents watercraft from operating off parts of Saturna Island. | 10% | 12% | 75% |
| There is an interim sanctuary zone that prevents watercraft from operating at Swiftsure Bank. | 7% | 10% | 79% |
Q2A – Q2G. [DK/NR: Ranged from 1 to 4%].
Base: n=1,003; All respondents.
In total, 73% said they were aware (47% definitely, 25% somewhat) of the measure that boats should reduce speed within 1,000 metres of a killer whale. Following this, close to six in 10 were definitely (35%) or somewhat (24%) aware that watercraft must keep 400 metres from killer whales in all southern BC coastal waters. Awareness of the voluntary measure that fishing should not take place within 1,000 metres of a killer whale was much less: 46% aware versus 53% not aware (the rest volunteered that they did not know).
The majority of respondents were not aware that whale watching boats should not be followed nor were they aware of any of the interim sanctuary zones.Footnote 4
Awareness of these measures varied by subgroup. Specifically:
The following graph, Figure 12, compares the overall awareness of protective measures between the baseline survey in 2021 and the current survey of 2022.Footnote 5 As can be seen, the overall awareness for each measure has changed little over time. No movement in either direction exceeded four percentage points.
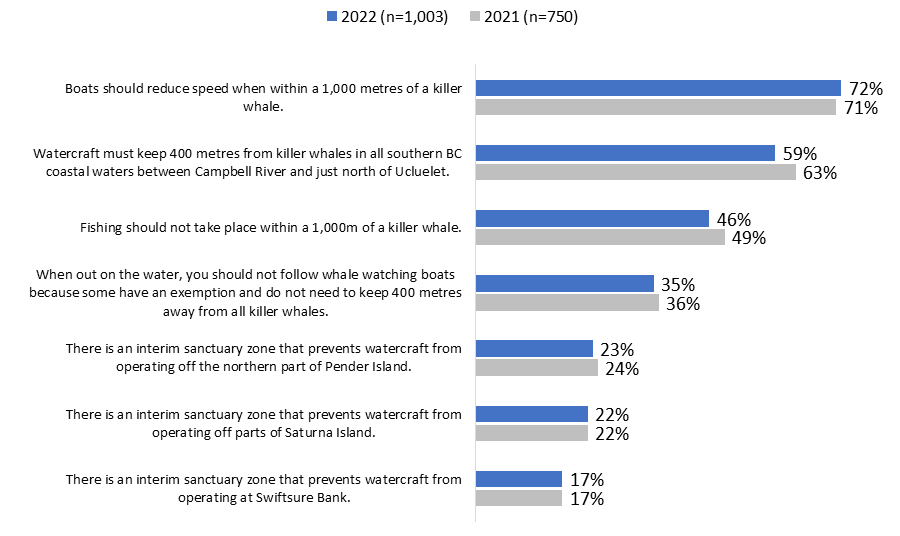
| 2022 (n=1,003) | 2021 (n=750) | |
| Boats should reduce speed when within a 1,000 metres of a killer whale. | 72% | 71% |
| Watercraft must keep 400 metres from killer whales in all southern BC coastal waters between Campbell River and just north of Ucluelet. | 59% | 63% |
| Fishing should not take place within a 1,000m of a killer whale. | 46% | 49% |
| When out on the water, you should not follow whale watching boats because some have an exemption and do not need to keep 400 metres away from all killer whales. | 35% | 36% |
| There is an interim sanctuary zone that prevents watercraft from operating off the northern part of Pender Island. | 23% | 24% |
| There is an interim sanctuary zone that prevents watercraft from operating off parts of Saturna Island. | 22% | 22% |
| There is an interim sanctuary zone that prevents watercraft from operating at Swiftsure Bank. | 17% | 17% |
When asked what term they use most often to refer to killer whales, just over half (53%) said they use the term 'orca'. In contrast, 39% said they mainly use the term 'killer whale'. Four percent volunteered that they use both terms interchangeably, while less than 1% use a different term all together.
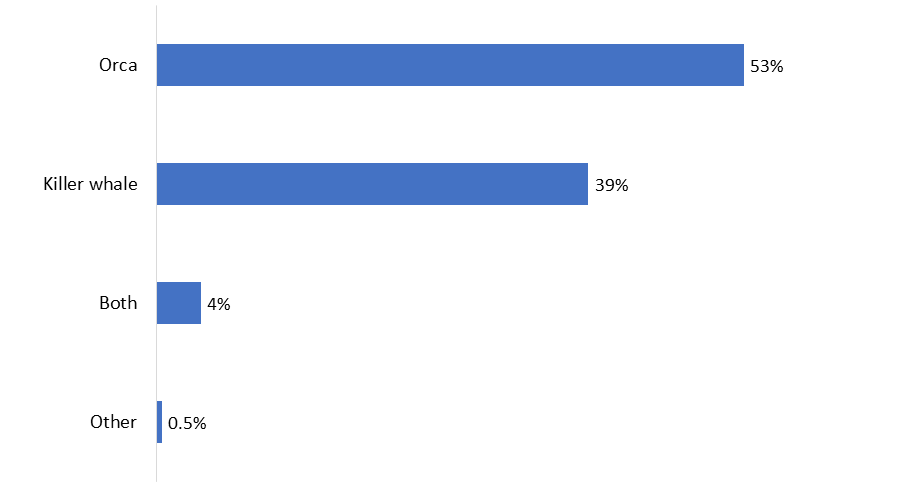
| Orca | 53% |
| Killer whale | 39% |
| Both | 4% |
| Other | 0.5% |
Q3A. Killer whales are also referred to as 'Orcas'. Which term do you most commonly use?
Base: n=1,003; all respondents. [DK/NR: 4%].
Residents of South Vancouver Island (72%) were the most likely to say they use the term 'orca'. Conversely, respondents of Metro Vancouver (42%) and Central Vancouver Island (39%) were more likely to use the term 'killer whale'. Those who have an annual income of $60,000 to just under $100,000 (61%) were more likely than those with an income under $60,000 (48%) to use the term 'orca'.
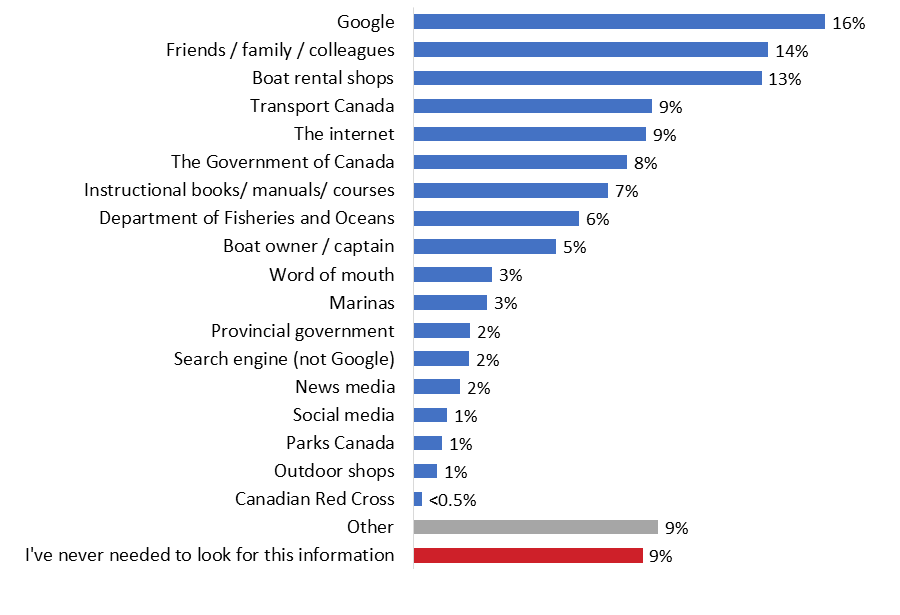
The source for obtaining boating safety and regulatory information used most often by respondents was Google (16%). Following this, 14% turn to friends, family, and colleagues, while almost as many (13%) reported getting this type of information from boat rental shops. Nine percent pointed to Transport Canada and the internet as their main sources of their boating safety and regulatory information. Figure 14 displays the full range of sources mentioned by respondents. Nine percent of those surveyed said they have never needed to look for this type of information.
| 16% | |
| Friends / family / colleagues | 14% |
| Boat rental shops | 13% |
| Transport Canada | 9% |
| The internet | 9% |
| The Government of Canada | 8% |
| Instructional books/ manuals/ courses | 7% |
| Department of Fisheries and Oceans | 6% |
| Boat owner / captain | 5% |
| Word of mouth | 3% |
| Marinas | 3% |
| Provincial government | 2% |
| Search engine (not Google) | 2% |
| News media | 2% |
| Social media | 1% |
| Parks Canada | 1% |
| Outdoor shops | 1% |
| Canadian Red Cross | 0.4% |
| Other | 9% |
| I've never needed to look for this information | 9% |
Q7. Where do you get your boating safety and regulatory information? [multiple responses accepted]
Base: n=1,003; All respondents. [DK/NR: 7%].
Respondents who mentioned the internet as their source of boating safety and regulatory information were asked to specify which websites they use. A wide variety of sites was mentioned, each by very small numbers of respondents. Examples include Power Squadron (Canadian Power and Sail Squadrons), the Coast Guard, BC Boating, 'government websites', fishing websites, sailing and boat clubs, and licensing websites.
Boat owners were more likely to say they get their boating safety and regulatory information from Transport Canada (15%) and instructional books, manuals, and courses (14%). Renters and seasonal boaters were more likely to mention boat rental shops (44% and 16%, respectively), while passengers were more apt to point to friends, family and colleagues and the boat captain or owner (17% and 9%, respectively). The likelihood of mentioning the federal government was higher among boat owners, those aware of the protective measures, and those who use watercraft year-round.
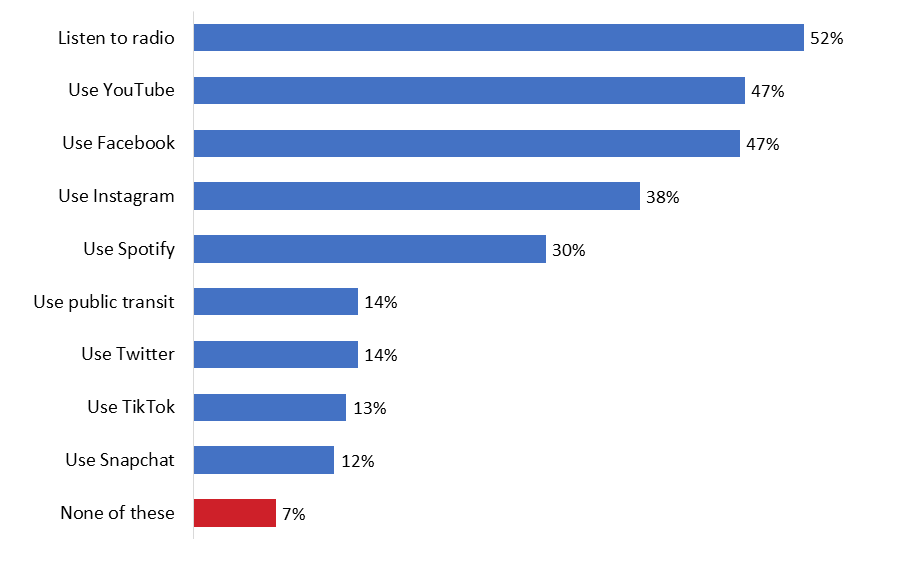
When asked to identify from a list of activities what they do on a daily basis, approximately half said they listen to the radio (52%) or use YouTube (47%) or Facebook (47%) every day. Daily use of Instagram was also relatively widespread (38%).
Following this, 30% said they use Spotify on a daily basis. Other social media are used daily by significantly smaller proportions: 14% reported using Twitter daily, 13% TikTok, and 12% Snapchat. Fourteen percent (14%) said they typically use public transit every day. Seven percent volunteered that they do none of these activities on a daily basis.
| Listen to radio | 52% |
| Use YouTube | 47% |
| Use Facebook | 47% |
| Use Instagram | 38% |
| Use Spotify | 30% |
| Use public transit | 14% |
| Use Twitter | 14% |
| Use TikTok | 13% |
| Use Snapchat | 12% |
| None of these | 7% |
Q8. Which of the following do you typically do on a daily basis? [multiple responses accepted]
Base: n=1,003; All respondents. [NR: <0.5%].
Boat owners (60%) were more likely to report listening to the radio on a daily basis compared to passengers (48%). Boat renters were most likely to use YouTube (59%), Instagram (51%), TikTok (22%), Snapchat (20%) and public transit (21%) on a daily basis. Similarly, seasonal watercraft users were most likely to use YouTube (50%), Spotify (34%), TikTok (13%), and Snapchat (13%).
Respondents were asked if in the past year they recalled seeing or hearing any advertisement about protecting the killer whales in BC coastal waters by staying away from them when boating. Just under half (47%) said they recalled hearing or seeing such an advertisement.Footnote 6 Conversely, 49% said they did not recall seeing an advertisement. Four percent were uncertain.
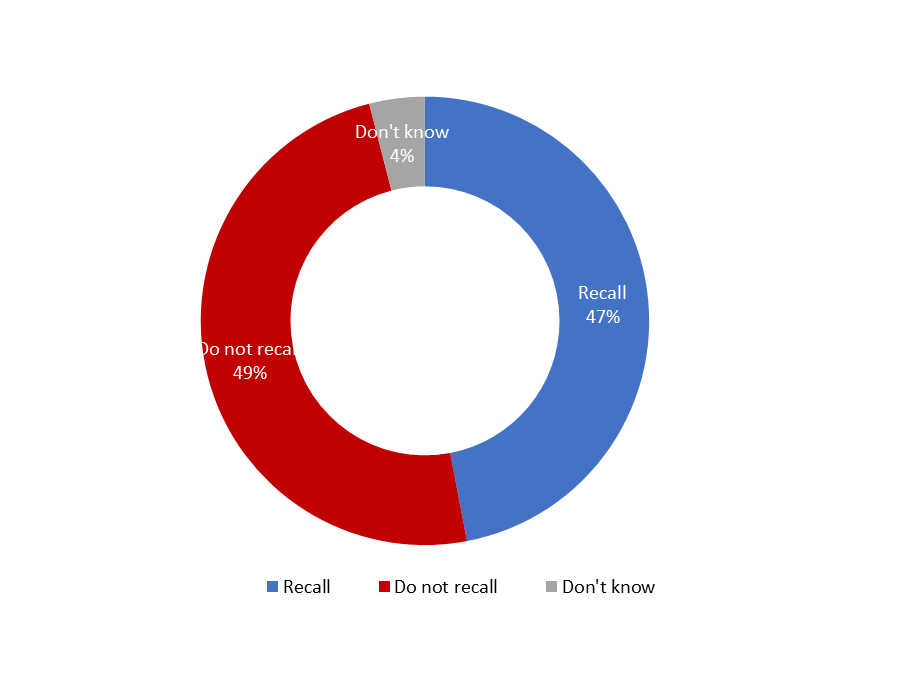
| Recall | 47% |
| Do not recall | 49% |
| Don't know | 4% |
Q9. In the past year, do you recall seeing or hearing any advertisements about protecting the killer whales in BC coastal waters by staying away from them when boating?
Base: n=1,003; All respondents.
Respondents from Central and South Vancouver Island (58% respectively) were more likely to recall hearing or seeing an advertisement about protecting the killer whales in BC coastal waters by staying away from them when boating than those living in Metro Vancouver (44%). Boat owners (57%), year-round watercraft users (63%), those aware of the protective measures (59%) and those aged 55+ (62%) were most likely to recall seeing or hearing an advertisement.
The ad campaign ran from July 2021 until the election was called in August 2021 when it was paused and resumed at the end of September 2021 through to October 2021 and included digital (web banner ads and social media ads), radio announcements, as well as billboard and transit shelter ads with various messages designed to raise awareness of the measures in place to protect SRKW in BC coastal waters among residents, and among boaters, in particular.
Of those who recall seeing or hearing any advertisement about protecting killer whales in BC coastal waters (n=531), one-third (32%) said they recall seeing an advertisement on television. Roughly one-quarter (23%) cited social media, while an equal number identified radio as their source of ad recall. Within the 23% who cited social media – 14% pointed to Facebook, 7% YouTube, 3% Instagram or Twitter, and 1% TikTok or other social media platforms. Following this, 14% said they recall seeing an advertisement in the newspaper or print media.
It should be noted that the advertising campaign did not air on television, nor did it appear in newspapers or other print publications. Despite this, the single largest proportion of respondents pointed to television and a smaller proportion to newspapers and other print publications. This is not uncommon when measuring recall of ads. Respondents defer to the medium they use most often and assume this is where they saw or heard the ad. The other possibility is that Transport Canada's advertising campaign is being confused with that of a similar campaign running at the same time one television and in print media.
Other sources were cited by much smaller proportions: 6% said physical posters/signs/pamphlets and billboards, 5% each said media outlets in general and the Internet. Eight percent of respondents did not recall where they saw or heard the advertisement.
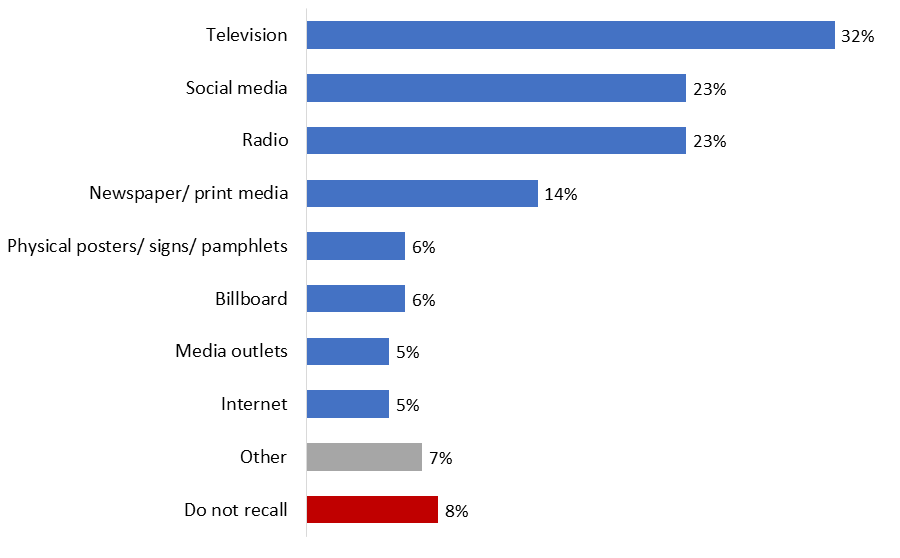
| Television | 32% |
| Social media | 23% |
| Radio | 23% |
| Newspaper/ print media | 14% |
| Physical posters/ signs/ pamphlets | 6% |
| Billboard | 6% |
| Media outlets | 5% |
| Internet | 5% |
| Other | 7% |
| Do not recall | 8% |
Q10. Where do you recall seeing or hearing these advertisements?
Base: n=531; Respondents who recall seeing or hearing any advertisements about protecting the killer whales in BC coastal waters.
Boat owners were more likely to recall seeing an advertisement on a physical poster, sign, or pamphlet (10%). Passengers were more likely to recall seeing an advertisement on television (38%). Respondents who are not aware of the protective measures were most likely to recall seeing an ad about protecting killer whales on social media (55%). Residents of Metro Vancouver (34%) and Central Vancouver Island (37%) were more likely cite television. Residents of Central (13%) and South (14%) Vancouver Island were more likely to recall seeing an advertisement on a physical poster, sign, or pamphlet. As age increased, the likelihood of recalling seeing an advertisement on television increased (from 8% of those aged 18 to 34 years old to 46% of those 55 and older). Conversely, as age increased the likelihood of recalling seeing an advertisement on social media decreased (from 49% of those aged 18 to 34 to 12% of those 55+).
Respondents who recalled seeing or hearing an advertisement about protecting killer whales (n=531) were asked what they recalled about the ad. Almost three in 10 (28%) said they recall the message "Help keep killer whales safe". One-quarter (24%) said they recall the message of "Slow down and stay away if you see a whale". Additionally, 19% said they recall the message of "Stay 400 metres away from killer whales".
Following this, 13% said they recall a picture of a Southern Resident killer whale. Other advertisement content and messaging were mentioned by much smaller proportions: 5% said they recall a message about "no-go" zones or interim sanctuary, 5% a message about keeping a distance other than 400 metres away, and 4% the message of "Reduce noise or shut off engine". Notably, one-quarter (24%) of respondents that said they recalled the advertisement could not recall any details.
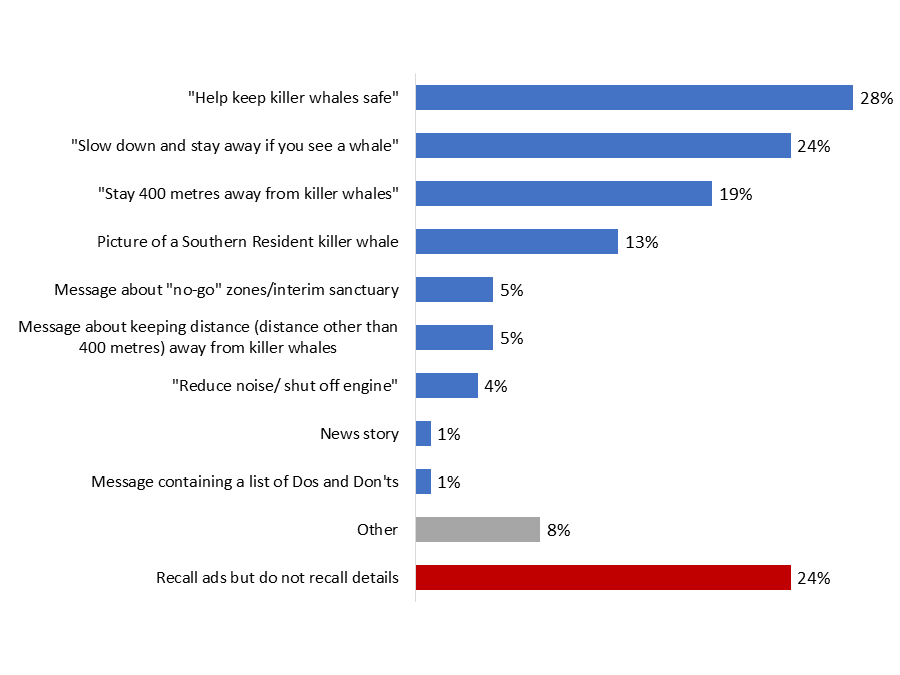
| "Help keep killer whales safe" | 28% |
| "Slow down and stay away if you see a whale" | 24% |
| "Stay 400 metres away from killer whales" | 19% |
| Picture of a Southern Resident killer whale | 13% |
| Message about "no-go" zones/interim sanctuary | 5% |
| Message about keeping distance (distance other than 400 metres) away from killer whales | 5% |
| "Reduce noise/ shut off engine" | 4% |
| News story | 1% |
| Message containing a list of Dos and Don'ts | 1% |
| Other | 8% |
| Recall ads but do not recall details | 24% |
Q11. What, if anything, do you recall about these advertisements?
Base: n=531; Respondents who recall seeing or hearing any advertisements about protecting the killer whales in BC coastal waters.
Boat owners were most likely to recall the message of "Stay 400 metres away from killer whales" (29%). Respondents who are aware of the protective measures were most likely to recall the advertisement message "Slow down and stay away if you see a whale" (26%). Those from South Vancouver Island were more likely to recall the message of a "no-go" zone or interim sanctuary (12%).
The single largest proportion of respondents (26%) have completed a bachelor's degree, followed by one in five (22%) who have completed a post graduate degree. Taken together, roughly half have completed at least a bachelor's level education. Following this, just under one-third have completed an apprenticeship or trades certificate (5%), a college or non-university certificate or diploma (17%), or a university certificate or diploma below a bachelor's level (10%). The rest have completed a high school diploma (16%) or have less formal education (2%).
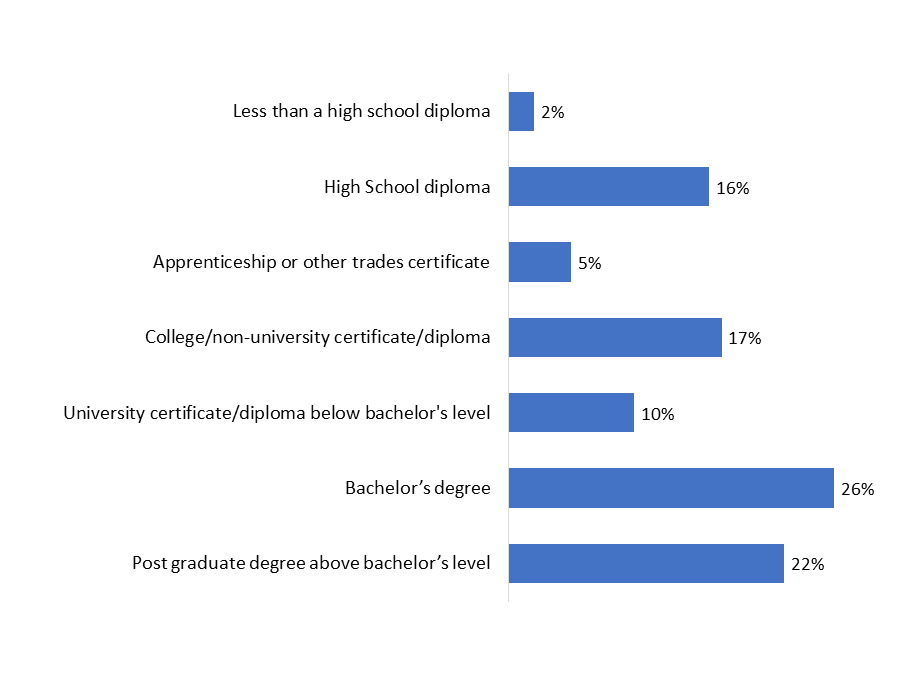
| Less than a high school diploma | 2% |
| High School diploma | 16% |
| Apprenticeship or other trades certificate | 5% |
| College/non-university certificate/diploma | 17% |
| University certificate/diploma below bachelor's level | 10% |
| Bachelor's degree | 26% |
| Post graduate degree above bachelor's level | 22% |
Q12. What is the highest level of formal education that you have completed?
Base: n=1,003; All respondents. [NR: 1%].
Roughly two in five respondents (39%) had a household income of $100,000 or more last year, including more than half of these reporting an annual household income of $150,000 and above. Following this, one in five (22%) had a household income of $60,000 to just under $100,000, while 10% reportedly earned $40,000 to just under $60,000 and 11% under $40,000 in the last year.
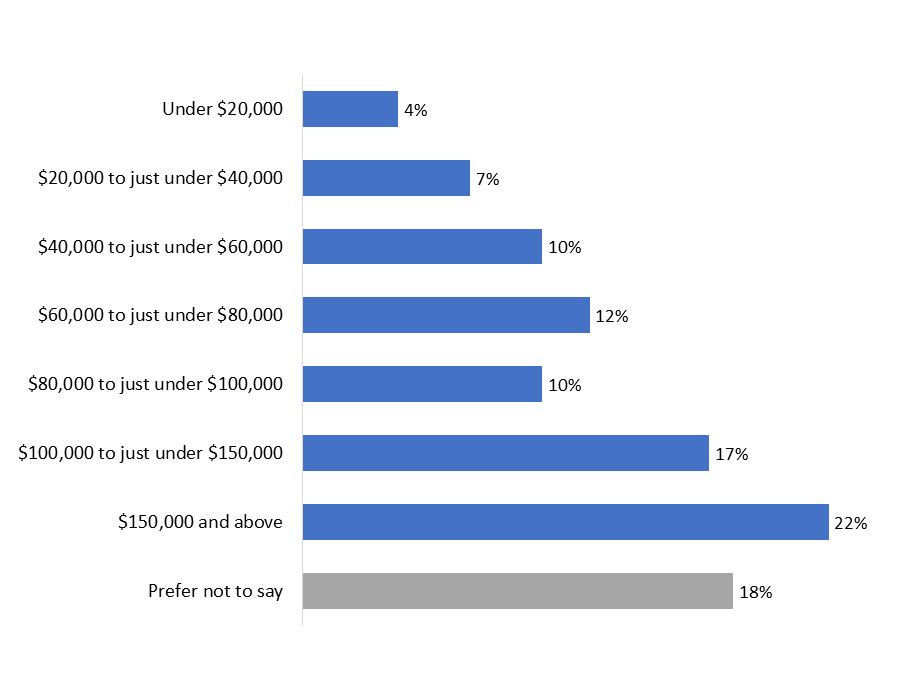
| Under $20,000 | 4% |
| $20,000 to just under $40,000 | 7% |
| $40,000 to just under $60,000 | 10% |
| $60,000 to just under $80,000 | 12% |
| $80,000 to just under $100,000 | 10% |
| $100,000 to just under $150,000 | 17% |
| $150,000 and above | 22% |
| Prefer not to say | 18% |
Q13. Which of the following best describes your total household income last year, before taxes, from all sources for all household members?
Base: n=1,003; All respondents. [NR: 1%].
As would be expected given the region of interest for the survey, the vast majority of respondents (91%) speak English most often at home. In addition, 10% speak a non-official language most often at home, while 2% speak French (i.e., are a member of an Official Language Minority Community).
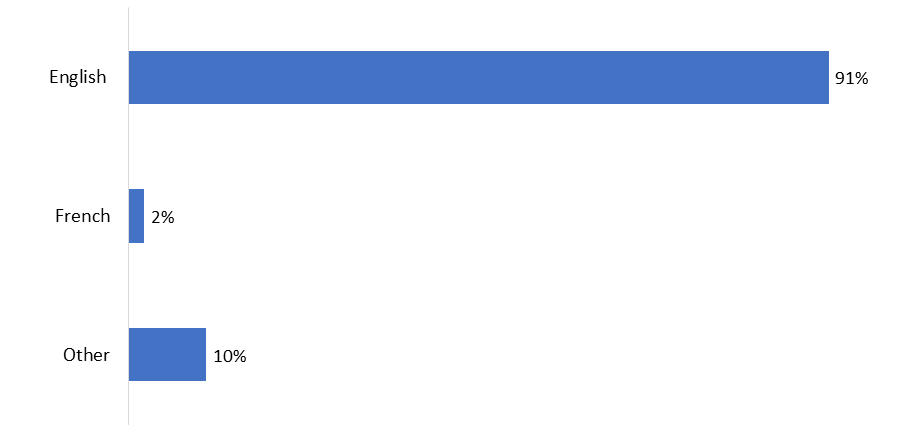
| English | 91% |
| French | 2% |
| Other | 10% |
Q14. What language do you speak most often at home?
Base: n=1,003; All respondents.
The large majority of respondents (92%) do not identify as Indigenous Canadians. In contrast, 7% identified themselves as First Nations, Métis, or Inuk.
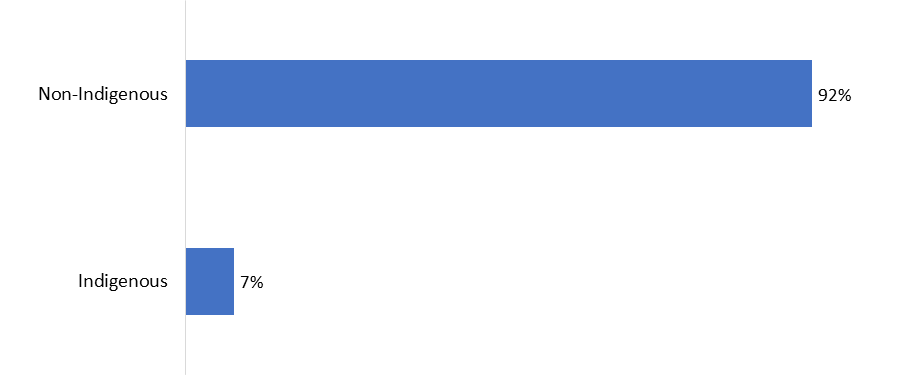
| Non-Indigenous | 92% |
| Indigenous | 7% |
Q15. Are you First Nations, Métis or Inuk (Inuit)?
Base: n=1,003; All respondents. [NR: 1%].
Three-quarters of respondents live in Metro Vancouver. Following this, 12% live on South Vancouver Island, and 10% on Central Vancouver Island. Fewer live on the Sunshine Coast (3%).
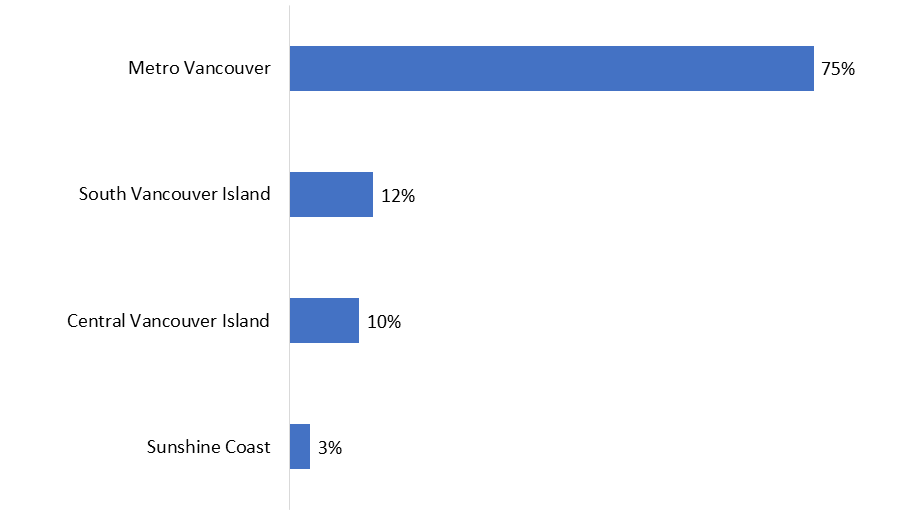
| Metro Vancouver | 75% |
| South Vancouver Island | 12% |
| Central Vancouver Island | 10% |
| Sunshine Coast | 3% |
Base: n=1,003; All respondents
Respondents varied in terms of their age, with the greatest single proportion aged 55 and older.
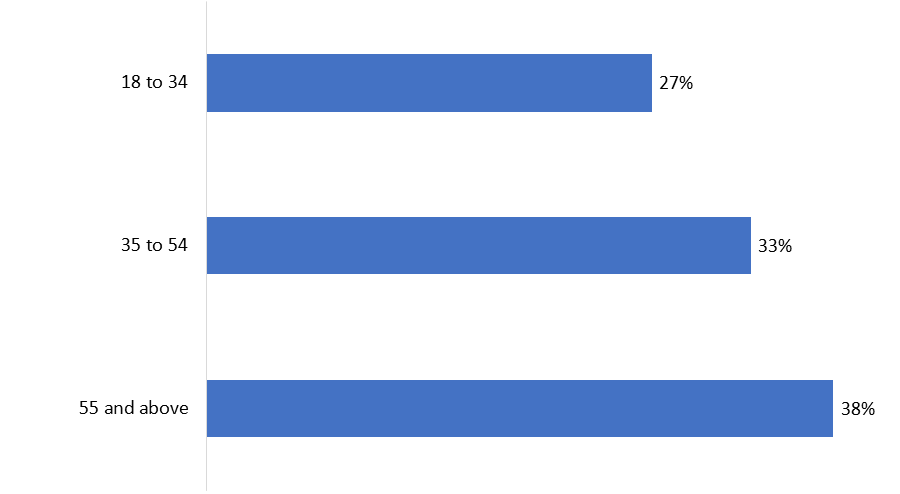
| 18 to 34 | 27% |
| 35 to 54 | 33% |
| 55 and above | 38% |
Base: n=750; All respondents. [DK/NR: 1%].
Exactly half of those surveyed identified as female, with slightly fewer identifying as male (48%). Very few respondents said they identify with another gender.

| Female | 50% |
| Male | 48% |
| Other | 1% |
Base: n=1,003; All respondents. [NR: 1%].
This research yielded some noteworthy observations about residents' awareness and understanding of Southern Resident killer whales and general boating safety, as well as recall of the advertisement campaign.
The following specifications applied to this survey:
| Total | Landline | Cell | |
|---|---|---|---|
| Total Numbers Attempted | 108,924 | 41,004 | 66,221 |
| Out-of-scope - Invalid | 47,017 | 10,302 | 36,715 |
| Unresolved (U) | 34,456 | 19,327 | 15,129 |
| No answer/Answering machine | 34,456 | 19,327 | 15,129 |
| In-scope - Non-responding (IS) | 11,145 | 3,259 | 7,886 |
| Language barrier | 2,045 | 967 | 1,078 |
| Incapable of completing (ill/deceased) | 17 | 10 | 17 |
| Callback (Respondent not available) | 9,083 | 2,282 | 6,801 |
| Refusal | 13,254 | 7,481 | 5,773 |
| Termination | 251 | 92 | 159 |
| In-scope - Responding units (R) | 2,801 | 1,614 | 1,187 |
| Completed Interview | 1,003 | 533 | 470 |
| Quota Filled | 6 | 0 | 6 |
| Not Qualified – Under 18 years | 60 | 0 | 60 |
| Not Qualified – Did not/will not go on the ocean | 1,699 | 1,071 | 628 |
| Not Qualified – Does not use watercrafts | 33 | 10 | 23 |
| Region and age | Population % | Sample % | Difference |
|---|---|---|---|
| Central Vancouver Island - 18-34 | 2% | 1% | -1% |
| Central Vancouver Island - 35-54 | 3% | 5% | 2% |
| Central Vancouver Island - 55+ | 5% | 6% | 1% |
| Metro Vancouver - 18-34 | 22% | 9% | -13%Footnote 7 |
| Metro Vancouver - 35-54 | 26% | 15% | -11%6 |
| Metro Vancouver - 55+ | 27% | 27% | 0% |
| South Vancouver Island - 18-34 | 3% | 2% | -1% |
| South Vancouver Island - 35-54 | 4% | 7% | 3% |
| South Vancouver Island - 55+ | 5% | 15% | 10%6 |
| Sunshine Coast - 18-34 | <1% | 2% | 1% |
| Sunshine Coast - 35-54 | 1% | 3% | 2% |
| Sunshine Coast - 55+ | 1% | 7% | 6%6 |
| Region and gender | Population % | Sample % | Difference |
|---|---|---|---|
| Central Vancouver Island - female | 5% | 5% | 0% |
| Central Vancouver Island - male | 5% | 6% | 1% |
| Metro Vancouver - female | 38% | 25% | -13%6 |
| Metro Vancouver - male | 36% | 27% | -9%6 |
| South Vancouver Island - female | 6% | 14% | 8%6 |
| South Vancouver Island - male | 6% | 11% | 5%6 |
| Sunshine Coast - female | 2% | 5% | 3% |
| Sunshine Coast - male | 2% | 6% | 4% |
Hello/Bonjour, my name is [Interviewer's name] and I am calling from Phoenix SPI, a Canadian research firm, on behalf of the Government of Canada. We are conducting a survey on current issues of interest to Canadians. Would you prefer that I continue in English or French? Préférez-vous continuer en français ou en anglais? [IF NEEDED: Je vous remercie. Quelqu'un vous rappellera bientôt pour mener le sondage en français.]
The survey takes about 10 minutes and is voluntary. Your responses will be kept confidential and anonymous, and the information provided will be administered according to the requirements of the Privacy Act, the Access to Information Act, and any other pertinent legislation.
This survey is registered with the Canadian Research Insights Council's survey validation system. Should you have any questions about the survey, I can give you a contact person within the Government of Canada / Transport Canada. May I continue?
[IF THE INDIVIDUAL HESITATES, OR IF THE STATE OF EMERGENCY IS MENTIONED, SAY: We understand that the flooding which recently happened may have impacted you personally. While it is important that we hear from as many British Columbians as possible, we also understand that completing a survey at this time may not be something you have time to do. We appreciate you taking our call. ONLY CONTINUE IF THE INDIVIDUAL AGREES TO PARTICIPATE. IF THE INDIVIDUAL DOES NOT WANT TO CONTINUE, TERMINATE THE SURVEY AND OFFER THE PROVINCIAL EMERGENCY RESPONSE CONTACT INFORMATION.]
IF REQUESTED, THE CONTACT PERSON AT TRANSPORT CANADA IS DEBRA DAVIS: debra.davis@tc.gc.ca
IF REQUESTED, THE CRIC REGISTRATION NUMBER IS: 20211215-PH827
[LANDLINE SAMPLE]
A. May I please speak with the person in your household who is 18 years of age or older and who has had the most recent birthday? Would that be you?
01. Yes GO TO SCR. 1
02. No ASK TO SPEAK TO THAT PERSON; REPEAT INTRO AS NEEDED
[CELL SAMPLE]
B. Are you 18 years of age or older?
01. Yes CONTINUE
02. No THANK/DISCONTINUE
TERMINATE MESSAGE-1: "Thank you for your willingness to take part in this survey, but you need to be at least 18 years of age to participate.
C. Are you in a place where you can safely talk on the phone and answer my questions?
01. Yes CONTINUE
02. No ARRANGE CALLBACK
INTERVIEWER NOTE: If you think that respondents' setting may endanger them (e.g., driving a vehicle), hinder their participation (e.g., background distractions), or hamper their ability to respond openly (e.g., lack of privacy), suggest rescheduling the interview.
D. Does your household subscribe to a home phone service, also known as a landline?
01. Yes CONTINUE
02. No CONTINUE; CODE AS CELLPHONE ONLY [WATCH QUOTAS]
03. Don't know CONTINUE
99. Prefer not to answer CONTINUE
SCREENING QUESTIONS
SCR. 1a In the last year, did you go out on the ocean in or on a recreational watercraft? Recreational watercraft includes power boats, sailboats, and jet skis, as well as canoes, kayaks, row boats or paddleboards that are privately owned or rented. This does not include watercraft used for commercial purposes, such as tour boats, ferries, or cruise ships.
NOTE TO INTERVIEWER: This does not include activities on lakes or rivers (respondents must have gone out on the ocean in the last year or plan to in the next year: see SCR.1b).
01. Yes GO TO SCR. 2a
02. No CONTINUE
99. Don't know/Refused THANK/TERMINATE
TERMINATE MESSAGE-2: "Thank you for your willingness to take part in this survey, but you do not meet the eligibility requirements of this study."
SCR. 1b [ASK IF SCR.1a=2 OR 99] In the next year, do you plan to go out on the ocean in or on a recreational watercraft?
01. Yes CONTINUE
02. No THANK/TERMINATE
99. Don't know/Refused THANK/TERMINATE
TERMINATE MESSAGE-2: "Thank you for your willingness to take part in this survey, but you do not meet the eligibility requirements of this study."
SCR. 2a [IF SCR1a=01] When you were out on the ocean this last year, were you out as a watercraft owner, renter, or passenger? [ACCEPT MULTIPLE RESPONSES.]
01. Boat owner
02. Boat renter
03. Passenger
99. Don't know/Refused
SCR. 2b [IF SCR1b=01] When you go out on the ocean in the next year, will you go out as a watercraft owner, renter, or passenger? [ACCEPT MULTIPLE RESPONSES.]
01. Boat owner
02. Boat renter
03. Passenger
99. Don't know/Refused
SCR. 3a May I have the first three digits of your postal code?
FSA: ____________ VALIDATE AGAINST LIST; GO TO SCR.4a
99. Don't know/Refused CONTINUE
SCR. 3b [ASK IF SCR.3a=99] We need to speak with people who live on Vancouver Island, the Gulf Islands, the Sunshine Coast, or the Greater Vancouver area or use watercrafts in those areas. In which city or area of coastal British Columbia do you live or use watercrafts?
01. TEXT – OPEN-END CONTINUE
02. Do not live or use watercrafts in coastal BC THANK/TERMINATE
99. Don't know/Refused THANK/TERMINATE
TERMINATE MESSAGE-2: "Thank you for your willingness to take part in this survey, but you do not meet the eligibility requirements of this study."
INTERVIEWERS: IF UNCERTAIN, CHECK LIST.
Anvil Island [SUNSHINE COAST]
Bowen Island [SUNSHINE COAST]
Burnaby [METRO VANCOUVER]
Campbell River [VANCOUVER ISLAND]
Central Saanich [VANCOUVER ISLAND]
Chemainus [VANCOUVER ISLAND]
Cloverdale [METRO VANCOUVER]
Comox [VANCOUVER ISLAND]
Coquitlam [METRO VANCOUVER]
Courtney [VANCOUVER ISLAND]
Crofton [VANCOUVER ISLAND]
Delta [METRO VANCOUVER]
Discovery Islands [UNSPECIFIED]
Duncan [VANCOUVER ISLAND]
Gabriola Island [GULF ISLANDS]
Galiano Island [GULF ISLANDS]
Gambier Island [SUNSHINE COAST]
Gibsons [SUNSHINE COAST]
Gulf Islands [UNSPECIFIED]
Jordan River [VANCOUVER ISLAND]
Ladner [METRO VANCOUVER]
Ladysmith [VANCOUVER ISLAND]
Langdale [SUNSHINE COAST]
Langley [METRO VANCOUVER]
Lions Bay [SUNSHINE COAST]
Maple Ridge [METRO VANCOUVER]
Mayne Island [GULF ISLANDS]
Mill Bay [VANCOUVER ISLAND]
Nanaimo [VANCOUVER ISLAND]
Nanoose Bay [VANCOUVER ISLAND]
New Westminster [METRO VANCOUVER]
North Vancouver [METRO VANCOUVER]
Parksville [VANCOUVER ISLAND]
Pender Island [GULF ISLANDS]
Pitt Meadows [METRO VANCOUVER]
Port Alberni [VANCOUVER ISLAND]
Port Coquitlam [METRO VANCOUVER]
Port Moody [METRO VANCOUVER]
Port Renfrew [VANCOUVER ISLAND]
Porteau Cove [SUNSHINE COAST]
Powell River [SUNSHINE COAST]
Qualicum Beach [VANCOUVER ISLAND]
Richmond [METRO VANCOUVER]
Salt Spring Island [GULF ISLANDS]
Saanich [VANCOUVER ISLAND]
Saturna Island [GULF ISLANDS]
Sechelt [SUNSHINE COAST]
Sidney [VANCOUVER ISLAND]
Sooke [VANCOUVER ISLAND]
Southern Gulf Islands [UNSPECIFIED]
Squamish [SUNSHINE COAST]
Sunshine Coast [UNSPECIFIED]
Surrey [METRO VANCOUVER]
Ucluelet [VANCOUVER ISLAND]
Vancouver [METRO VANCOUVER]
Vancouver Island [UNSPECIFIED]
Victoria [VANCOUVER ISLAND]
West Vancouver [METRO VANCOUVER]
Whistler/Sea-to-Sky [SUNSHINE COAST]
White Rock [METRO VANCOUVER]
SCR.4a In what year were you born?
Record year: ____________
99. [DO NOT READ] Don't know/Refused
SCR.4b [ASK IF SCR.4a=99] Would you be willing to tell me in which of the following age categories you belong?
[READ LIST; STOP WHEN RESPONDENT SELECTS AN ANSWER]
01. 18 to 24
02. 25 to 34
03. 35 to 44
04. 45 to 54
05. 55 to 64
06. 65 or older
99. [DO NOT READ] Refused SCR. 5 What is your gender?
[READ LIST; STOP WHEN RESPONDENT SELECTS AN ANSWER]
01. Female
02. Male
03. Other
99. [DO NOT READ] Refused
MAIN SURVEY
1. To the best of your knowledge, are there any protective measures in place to protect Southern Resident killer whales in BC coastal waters?
01. Yes
02. No
99. I don't know
2. [IF Q1=02,99: Actually, there are protective measures in place to protect killer whales, as well as some voluntary measures. / IF Q1=01: As you know, there are measures in place to protect killer whale, as well as some voluntary measures.] I'm going to read several of them to you and I'd like you to tell me if it's something you are aware of or not. The first one is: [ROTATE ITEMS; A-C ROTATE AS A BLOCK; D-E ROTATE AS A BLOCK; F-G ROTATE AS A BLOCK]
NOTE TO INTERVIEWER: IF RESPONDENTS ARE UNCLEAR ABOUT WHAT IS MEANT BY "WATERCRAFT", PLEASE REMIND THEM THAT WATERCRAFT INCLUDES POWER BOATS, SAILBOATS, JET SKIS, CANOES, KAYAKS, ROW BOATS OR PADDLEBOARDS.
A. There is an interim sanctuary zone that prevents watercraft from operating off the northern part of Pender Island.
B. There is an interim sanctuary zone that prevents watercraft from operating off parts of Saturna Island.
C. There is an interim sanctuary zone that prevents watercraft from operating at Swiftsure Bank.
D. Watercraft must keep 400 metres from killer whales in all southern BC coastal waters between Campbell River and just north of Ucluelet.
E. When out on the water, you should not follow whale watching boats because some have an exemption and do not need to keep 400 metres away from all killer whales.
F. Boats should reduce speed when within a 1,000 metres of a killer whale.
G. Fishing should not take place within a 1,000 metres of a killer whale.
[READ]
01. Definitely aware
02. Somewhat aware
03. Not aware
99. [DO NOT READ] I don't know
3a. Killer whales are also referred to as 'Orcas'. Which term do you most commonly use?
[READ LIST]
01. Killer whale
02. Orca, or
03. Some other term: specify
99. [DO NOT READ] Don't know/Refused
3. What type of recreational watercraft have you used on the ocean in the last two years? [IF NEEDED, REMIND RESPONDENTS OF THE FOLLOWING: Recreational watercraft does not include watercraft used for commercial purposes, such as tour boats, ferries, or cruise ships.]
[ACCEPT ALL THAT APPLY; DO NOT READ LIST]
01. Power boat, motor boat or speedboat
02. Sailboat
03. Personal watercrafts (e.g., WaveRunners/Sea-Doos/Jet Skis)
04. Canoe
05. Kayak (includes inflatable crafts)
06. Row boat
07. Paddleboard (includes inflatable crafts)
08. Dinghy
09. Houseboat
10. Pontoon
11. Other: specify
12. None; my first time out will be in the next year. SKIP TO Q6
13. Have not boated in the last two years, but have in years past
99. I don't know/I can't recall
4. On average, how many days per year do you typically go out on the ocean in a watercraft for recreational purposes?
01. Record days:
02. None; my first time out will be in the next year SKIP TO Q6
99. [DO NOT READ] Don't know/Refused SKIP TO Q6
5. [IF Q4=01] Do you tend to go out on ocean in a watercraft all year long or is this a seasonal activity?
01. All year
02. Seasonal
03. [VOLUNTEERED] It depends
99. Don't know/Refused
5a. When out on the ocean for recreational purposes, have you used a depth finder, also sometimes called an echo sounder?
01. Yes
02. No SKIP TO Q6
99. I don't know/I can't recall SKIP TO Q6
5b. For what purpose have you used a depth finder? [READ LIST; ACCEPT ALL THAT APPLY]
01. For navigation purposes
02. For finding fish
03. [DO NOT READ] Other: specify
99. [DO NOT READ] I don't know/I can't recall
5c. How frequently do you use a depth finder when out on the ocean for recreational purposes? [READ LIST]
01. Every time
02. Most of the time
03. Some of the time, or
04. Rarely
99. [DO NOT READ] I don't know/I can't recall
6. When you go out on the ocean, do you wear a life jacket or personal flotation device?
01. Yes
02. No
03. [VOLUNTEERED] It depends on the type of watercraft
04. [VOLUNTEERED] It depends on the situation/people involved
99. Don't know/Refused
7. Where do you get your boating safety and regulatory information? [ACCEPT ALL THAT APPLY]
[DO NOT READ LIST]
01. The internet: ASK TO SPECIFY WHICH SITES. IF THEY MENTION DOING A SEARCH, ASK IF THEY USED GOOGLE OR ANOTHER SEARCH ENGINE. IF GOOGLE, CODE AS 02. IF ANOTHER SEARCH ENGINE IS MENTIONED, CODE AS 03.
02. Google
03. Search engine [not Google]
04. Transport Canada
05. Parks Canada
06. Department of Fisheries and Oceans (DFO)
07. The Government of Canada
08. Canadian Red Cross
09. Social Media - ASK TO SPECIFY:
• Reddit
• YouTube
• TikTok
• Facebook
• Twitter
• Instagram
• Other: Please specify: [TEXT]
10. Outdoors shops
11. Boat rental shops
12. Marinas
13. Friends/family/colleagues
14. Word of mouth
15. News media
16. Other: specify
17. I've never needed to look for this information
99. I don't know/I can't recall
8. Which of the following do you typically do on a daily basis? [ACCEPT ALL THAT APPLY]
[RANDOMIZE; READ LIST]
01. Listen to radio
02. Use public transit
03. Use Facebook
04. Use Instagram
05. Use Spotify
06. Use Twitter
07. Use YouTube
08. Use Snapchat
09. Use TikTok
10. [VOLUNTEERED] None of these
99. [DO NOT READ] Prefer not to answer
9. In the past year, do you recall seeing or hearing any advertisements about protecting the killer whales in BC coastal waters by staying away from them when boating?
01. Yes
02. No SKIP TO Q11
99. I don't know/unsure SKIP TO Q11
10. Where do you recall seeing or hearing these advertisements? [ACCEPT ALL THAT APPLY]
01. Radio
02. Social media - ASK TO SPECIFY:
• Reddit
• YouTube
• TikTok
• Facebook
• Twitter
• Instagram
• Other: Please specify: [TEXT]
03. Billboard
88. Other: specify
99. I don't know/I can't recall
11. What, if anything, do you recall about these advertisements? [ACCEPT ALL THAT APPLY]
01. A picture of a whale/orca/Southern Resident killer whale
02. The message to slow down and stay away if you see a whale
03. That there are "no-go" zones / interim sanctuary
04. People should stay 400 metres away from killer whales
05. Help keep killer whales safe
88. Other: specify
99. I don't know/I can't recall
DEMOGRAPHICS
We have a couple final questions for statistical classification purposes. Be assured that your responses will be held in strict confidence.
12. What is the highest level of formal education that you have completed?
[READ LIST; STOP WHEN RESPONDENT SELECTS AN ANSWER]
01. Less than a High School diploma or equivalent
02. High School diploma or equivalent
03. Registered Apprenticeship or other trades certificate or diploma
04. College, CEGEP or other non-university certificate or diploma
05. University certificate or diploma below bachelor's level
06. Bachelor's degree
07. Post graduate degree above bachelor's level
99. [DO NOT READ] Prefer not to answer
13. Which of the following best describes your total household income last year, before taxes, from all sources for all household members?
[READ LIST; STOP WHEN RESPONDENT SELECTS AN ANSWER]
01. Under $20,000
02. $20,000 to just under $40,000
03. $40,000 to just under $60,000
04. $60,000 to just under $80,000
05. $80,000 to just under $100,000
06. $100,000 to just under $150,000
07. $150,000 and above
99. [DO NOT READ] Prefer not to answer
14. What language do you speak most often at home? [ACCEPT ALL THAT APPLY]
[DO NOT READ]
01. English
02. French
03. Other [DO NOT SPECIFY]
99. Prefer not to answer
Finally,
15. Are you First Nations, Métis or Inuk (Inuit)?
[DO NOT READ]
01. No
02. Yes
99. Prefer not to say
CONCLUSION
That concludes the survey. Thank you very much for your thoughtful feedback. This survey was conducted on behalf of Transport Canada.