Detailed Findings
Introduction
A core responsibility of
Veterans Affairs Canada is to support the care and well-being of Veterans and
their families through a range of benefits, services, research, partnerships,
and advocacy. This research will strengthen performance measurement and ensure
that VAC’s work is informed by evidence and feedback from the Veterans and all
of those served by VAC. Further, as well-being has been established as the
ultimate desired outcome for Veterans and their families, the results of the
survey will contribute to the ongoing and systematic assessment, monitoring and
improvement of programs and services that impact Veteran well-being. Gender
Based Analysis Plus (GBA+) considerations will also be included in the research
design to ensure an intersectional approach.
This research supports the
priorities of both the Government of Canada and Veterans Affairs Canada through
the:
· VAC
Well-being Framework (2017)
· VAC
Departmental Results Framework (2017)
· Government
of Canada Policy on Results (2016)
This research project
seeks to gain a deeper understanding of the Veteran client population and
needs.
The VAC National Client Survey
findings will be used to a) increase VAC’s understanding of clients’
experiences with these programs and services, b) inform the development of
survey items for future VAC National Client Surveys, and c) inform future
research to support the development, management and improvement of programs and
services provided to Veterans and their families.
The purpose of this
research project is to measure VAC clients’ levels of satisfaction with Service
Delivery and to measure VAC client health and well-being.
The objectives of the VAC
National Client Survey are to:
1.
Assess satisfaction with
Service Delivery;
2.
Determine preferred service
channels;
3.
Measure client health and
well-being; and
4.
Support improvements to
Service Delivery.
Methodology
Forum Research administered a quantitative study to 3268 VAC
clients, consisting of War Service Veterans, CAF Veterans and members, RCMP
members and former members, and Survivors. Fieldwork was conducted in two
waves: February 12th–March 19th, 2020 and August 6th–October 9th, 2020.
Throughout the report, “pre-COVID” refers to responses collected February–March
2020 during the first wave, and “post-COVID” represents responses collected
August–October 2020, during the second wave.
The survey was conducted using computer-assisted telephone
interviewing (CATI) and respondents were reached using contact information from
a sample file provided by VAC. The average response rate was 36%, which is an
increase of 3% from 2017. The average duration of the questionnaire was 24
minutes and ranged from 13 minutes to 49 minutes.
Analysis and approach
This report analyzes survey results in three ways for each
question. First, the report will visualize and state the overall frequencies
for the question. Then, it will break out the responses visually by a key
demographic, either by age or the six main strata. The six strata which are
frequently referred to throughout the report are Veterans 85+, Veterans 65–84,
Veterans under 65 (case-managed), Veterans under 65 (not case-managed), RCMP,
and Survivors. Here, “Veterans” refers to CAF and War Service Veterans. Then,
it will add additional commentary on notable trends in the data across
demographic groups. For example, if there is a noticeable difference between
men and women’s responses to a question, the report will note that in the text.
Where there are no noticeable differences—e.g., suppose that satisfaction with
wait times are relatively consistent across age groups—then the report will
generally not note that sort of non-finding.
Research considerations
Top 2 (TOP2) and bottom 2 (BTM2) reference the collective
TOP2 positive and BTM2 negative responses, where applicable. For example, a
TOP2 grouping referred to as “satisfied” may be the combined result of “very
satisfied” and “somewhat satisfied,” where a grouping of “not satisfied” (BTM2)
may be the combined result of “not very satisfied” and “not at all satisfied.”
Due to rounding, numbers presented throughout this document
may not add up to the totals provided. For example, in some cases, the sum of
all question values may add up to 101% instead of 100%. Similar logic applies
to TOP2 and BTM2 groupings.
Visualizations generally exclude “don’t know” or “prefer not
to say” responses, though specific notes are provided at the bottom of each
page to clarify the group of respondents being visualized on the slide.
 Demographics
This section summarizes the demographic makeup of the
respondents. All data have been weighted by age, sex, and strata using
proportions from a larger sample file.
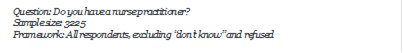
Respondents are predominantly male
· Three-quarters
(77%) of respondents are male.
· Five of
the six strata are predominantly male: Survivors are the exception.
· On one in
10 (10%) respondents’ files, their sex is labelled “male” while reporting their
gender as female.
· Only 2%
of respondents have their sex as “female” while reporting their gender as male.

![Question: What is your gender classification? [options not read]
Sample size: 3228
Framework: All respondents, excluding “don’t know” and refused](VAC_FullReport_Final_Apr_06_2021_EN_files/image006.png)
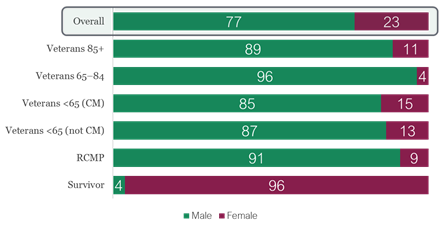
Visible minorities make up small fraction of respondents
· Only one
in ten (10%) respondents consider themselves visible minorities.
· These
visible minorities are distributed fairly evenly among the strata.

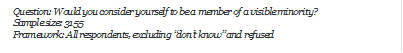
Few Indigenous respondents
· One in 19
respondents reports being Indigenous.
· 19 in 20
respondents do not report being Indigenous.

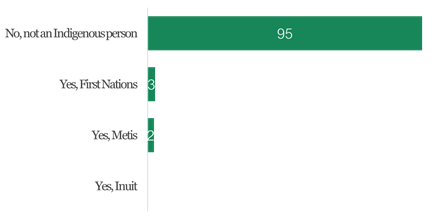
Indigenous
respondents evenly distributed
There are no notable trends concerning how Indigenous
respondents are distributed among the strata.

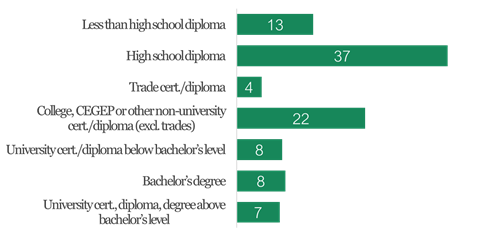
Half of respondents have a high school education or less
· Half
(50%) of respondents have a high school diploma or less.
· A quarter
(24%) have some form of university education.

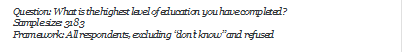

Great
variation in education between strata
· Veterans
85 and over, Veterans 65–84, and Survivors are more likely than other strata to
have less than a high school diploma.
· College,
CEGEP, etc. are more common for Veterans under 65.

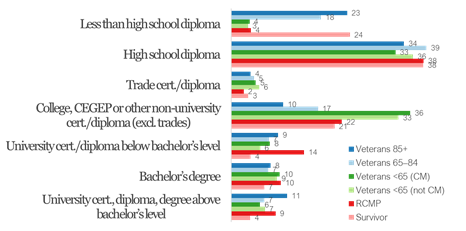
Older Veterans and Survivors tend to live alone
· For
Veterans 85 and over and Survivors, living alone is the most common response. More than two-thirds (69%) of Survivors live alone.
· Other
groups are more likely to live with others, most commonly with one other
person.

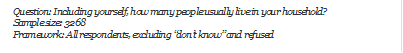
Some
strata predominantly lower-income
· Survivors
stand out as predominantly lower-income compared to other strata. Two-thirds
(65%) of Survivors make $40,000 or less after tax.
· Veterans
65 and up also have comparatively lower incomes.

Communicating with Veterans Affairs Canada
The most common and preferred method of contact is by phone.
Those who use My VAC Account find it useful. Those who do not use it tend to
cite lack of need or issues with accessing the internet or a computer. VAC
generally receives positive feedback for its communications efforts.
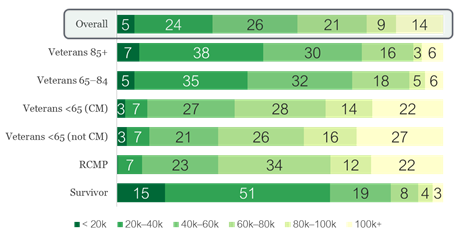
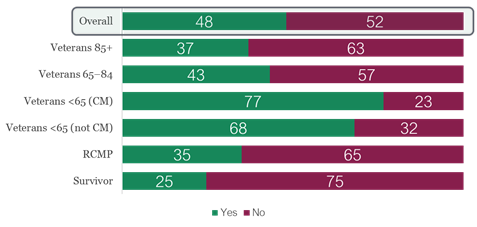
Three in five have contacted VAC
· Three in five (60%) say they contacted VAC in the past
12 months.
· Almost all (97%) case-managed Veterans under 65
have had contact with VAC.
· Only a third (35%) of Survivors say they have
contacted VAC.
· There is a gender gap: two-thirds (64%) of male
respondents have contacted VAC in the past 12 months, compared to just under
half (48%) of female respondents.
· Indigenous
clients (70%) are more likely than non-Indigenous clients (60%) to have
contacted VAC.
· Older
respondents were less likely to have contacted VAC than younger respondents:
for example, 84% for those under 40 compared to 51% for those 90 and over.

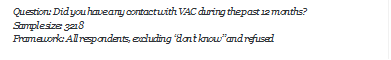
Most
have received a letter
· Seven in
10 (69%) respondents say they received a letter from VAC in the past 12 months.
· Case-managed
Veterans under 65 are the most likey (92%) to have received a letter.
· There is
a slight drop-off post-COVID: 73% say they received a letter pre-pandemic
compared to 65% after pandemic measures set in.
· There is
a gender gap: 71% of men vs. 64% of women
· Older
respondents are less likely than younger respondents to have received a letter.

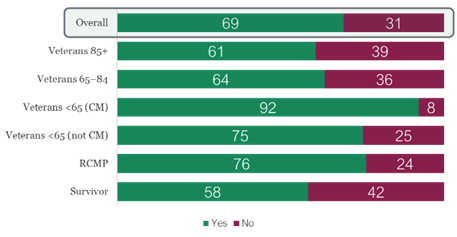
Phone most popular way of contacting VAC
· Four in five (78%) respondents say they have contacted
VAC by phone.
· Half
(52%) of respondents have contacted VAC through My VAC Account.
· In person
options are the least popular.

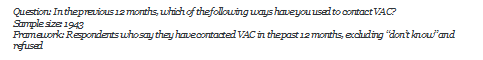
Slight
variations in methods of contact between strata
· Younger
Veterans are more likely to have contacted VAC through My VAC Account: Veterans
under 65 and are much more likely than Veterans 65–84 and Veterans
over 85.
o
The same trend exists for email communication.
· Survivors
are the least likely to contact VAC online (i.e., through email or My VAC
Account).

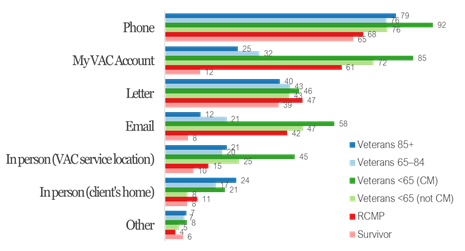
Phone most preferred by far
· Phone
(49%) is by far the most preferred method of communication for contacting VAC.
· Letter
(15%), My VAC Account (13%), and email (12%) are preferred relatively equally.
· In-person
options are the least preferred.

![Question: In general, what is your preferred method of contact with VAC? [multiple responses allowed]
Sample size: 3166
Framework: All respondents, excluding “don’t know” and refused](VAC_FullReport_Final_Apr_06_2021_EN_files/image041.png)
Different strata prefer different methods 0f contact
· Survivors
greatly prefer phone (58%) and letters (34%) but are unlikely to prefer
contacting VAC online.
· Case-managed
Veterans under 65 tend to prefer phone (42%) and My VAC Account (30%) over
letters (2%).

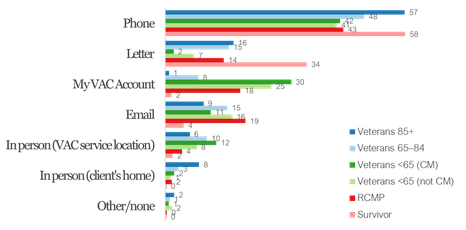
![Question: In general, what is your preferred method of contact with VAC? [multiple responses allowed]
Sample size: 3166
Framework: All respondents, excluding “don’t know” and refused](VAC_FullReport_Final_Apr_06_2021_EN_files/image044.png)
Majority
agree that communication has been easy
· Seven in
10 (TOP2: 69%) respondents agree that communication with VAC has been easy.
· Survivors
are the most likely to agree (TOP2: 79%) while case-managed Veterans under
65 are the least likely (TOP2: 60%).
· French-speakers
are more likely (TOP2: 75%) than English-speakers (TOP2: 68%) to
agree.
· Indigenous
clients (TOP2: 58%) are less likely to agree than non-Indigenous clients
(70%).

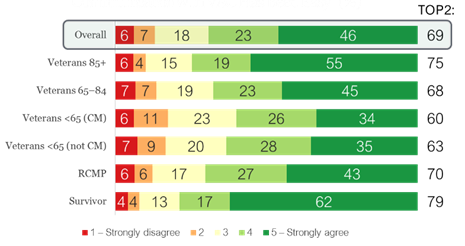
![Question: [Explanation of 5-point scale as a measure of agreement with the statement.] … “Communication with VAC has been easy.”
Sample size: 3146
Framework: All respondents, excluding “don’t know” and refused](VAC_FullReport_Final_Apr_06_2021_EN_files/image047.png)
Most agree communication is provided in a timely manner
· Seven in
10 (TOP2: 69%) agree that communication was provided in a timely manner.
· Case-managed
Veterans under 65 (TOP2: 55%) are the least likely to agree.
· Older
respondents are more likely to agree than younger ones: for example, four in
five (TOP2: 79%) respondents over 90 agreed, compared to just under half
(TOP2: 48%) of those under 40.
· There is
no noticeable difference between pre-COVID (TOP2: 69%) and post-COVID
(TOP2: 69%)

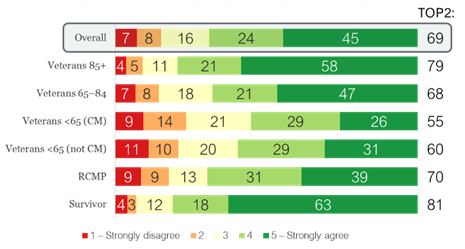
![Question: [Explanation of 5-point scale as a measure of agreement with the statement.] … “Communication with VAC was provided in a timely manner.”
Sample size: 3123
Framework: All respondents, excluding “don’t know” and refused](VAC_FullReport_Final_Apr_06_2021_EN_files/image050.png)
Two-thirds say it is easy to submit the necessary info to
apply
· Two-thirds
(TOP2: 63%) agree that it is easy to submit the needed information.
· Veterans
under 65 (not case-managed) are the least likely to agree (TOP2: 55%).
· No
notable trends for language, gender, visible minority, or indigenous
background.

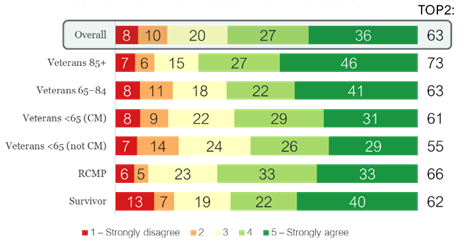
![Question: [Explanation of 5-point scale as a measure of agreement with the statement.] … “It was easy to submit the required information to VAC needed for my application.”
Sample size: 1151
Framework: Respondents who say they applied for a service or benefit within the past 12 months, excluding “don’t know” and refused](VAC_FullReport_Final_Apr_06_2021_EN_files/image053.png)
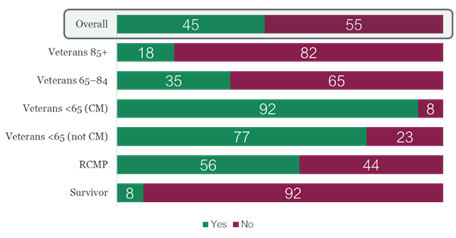
Large variances in My VAC Account usage
· Just
under half (45%) of respondents say they have used My VAC Account.
· There is
great variance among the strata: nine in 10 (92%) case-managed Veterans over
65 have used it, versus just one in 10 (8%) Survivors.
· Younger
respondents are much more likely than older ones to use My VAC Account.
· French-speakers
(55%) are more likely than English-speakers (44%) to use the service.
· Men
(51%) are much more likely than women (29%) to use it, and this is
clearly connected to low usage among Survivors, who are predominantly women.

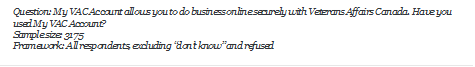
Lack of need is the top reason for not using My VAC
Account
· Of those
who do not use My VAC Account, a quarter (28%) say they have no need for it.
· One in
five (19%) say they did not know about it.
· Other
technological barriers like lack of access to a computer or internet (18%), or
feeling that technology is too complex (17%) are also top reasons.

![Question: Why don’t you use My VAC Account? [multiple responses allowed]
Sample size: 1736
Framework: Respondents who say they have not used My VAC Account, excluding “don’t know” and refused](VAC_FullReport_Final_Apr_06_2021_EN_files/image059.png)
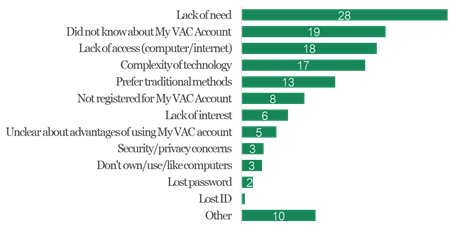
Barriers and awareness a theme for lower-usage groups
· Survivors
and Veterans over 85 are more likely than other strata to say they did
not know about My VAC Account or that they cannot access the needed technology.
· English-speakers
(21%) are twice as likely to be unaware of My VAC Account than French-speakers
(10%).

![Question: Why don’t you use My VAC Account? [multiple responses allowed]
Sample size: 1736
Framework: Respondents who say they have not used My VAC Account, excluding “don’t know” and refused](VAC_FullReport_Final_Apr_06_2021_EN_files/image062.png)
Most think My VAC Account helps find out about benefits
and services
· Of those
who use My VAC Account, four in five (83%) respondents say My VAC Account is a
good way to find out about benefits and services.
· Visible
minority (75%) and indigenous (74%) respondents are less likely to
say “yes.”
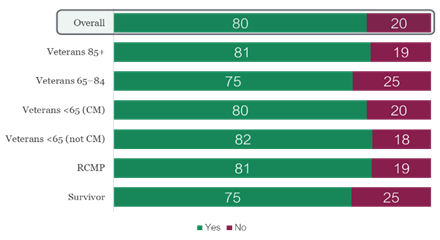
Strong majority say My VAC Account is good for checking in
on application status
Four in five (80%)
My VAC Account users say it is a good way to find out about the status of their
applications.
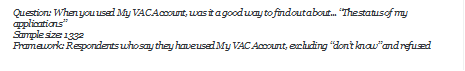
Three-quarters of users say My VAC Account is good for
learning VAC news
· Three in
four (76%) respondents who use my VAC Account say it is a good way to find out
about VAC news.
· Visible
minority respondents (65%) are less likely to say “yes.”
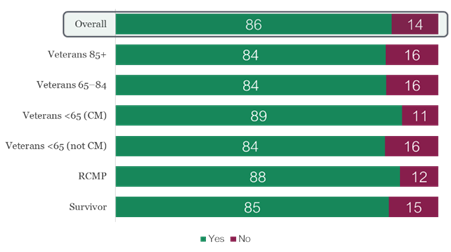
Vast majority say My VAC Account is a good way to message
securely with VAC
Seven in eight (86%) say My VAC Account is a good way to
communicate securely with VAC.
Satisfaction with Service Experience
Satisfaction with the service experience is high. VAC staff
receive high marks for being competent, knowledgeable, and respectful. There is
no noticeable increase in wait times or drop-off in service quality when
comparing pre- to post-pandemic numbers.
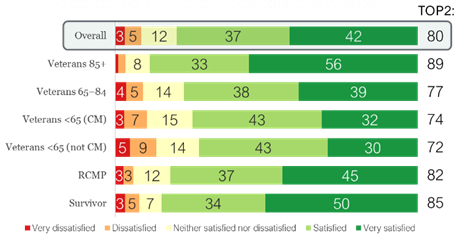
Most satisfied with quality of programs and services
· Four in
five (TOP2: 80%) respondents are satisfied with the quality of programs and
services.
· This is
similar to 2017 (TOP2: 81%), though the number of “very satisfied” respondents
increased from 29% to 42%.
· Younger
respondents, like those under 40 (TOP2: 65%) are less satisfied than
older respondents, like those 90 and over (TOP2: 90%).
· Indigenous
respondents (TOP2: 72%) are less satisfied than non-Indigenous
respondents (TOP2: 80%).

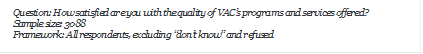
Majority satisfied with the quality of service delivery
· Four in five
(TOP2: 81%) respondents say they are satisfied with the quality of service
delivery.
· This
maintains 2017 levels (TOP2: 81%), though the number of “very satisfied”
respondents has risen from 32% to 47%.
· Indigenous
respondents (TOP2: 75%) tend to be less satisfied than non-Indigenous
respondents (TOP2: 81%).
· Veterans
under 65 who are not case-managed (TOP2: 69%) are the least satisfied of the
six strata.
· There has
been no drop-off in satisfaction post-COVID (TOP2: 82%) compared to pre-COVID
(TOP2: 80%).

Less than half agree service has improved in the past 12
months
· Four in
nine (TOP2: 44%) agree that VAC service has improved in the past 12 months.
· Younger
respondents like those under 40 (TOP2: 23%) are less likely to agree
than their older counterparts, e.g., respondents 90 and over (TOP2:
59%).
· There is
no noticeable drop-off from pre-COVID (TOP2: 45%) to post-COVID
(TOP2: 43%).

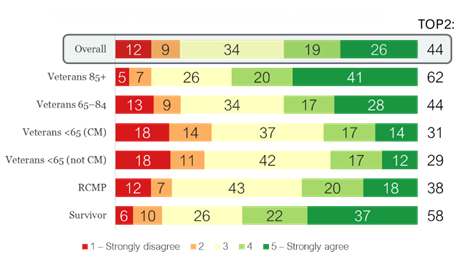
![Question: [Explanation of 5-point scale as a measure of agreement with the statement.] … “Over the past 12 months, VAC service has improved.”
Sample size: 2614
Framework: All respondents, excluding “don’t know” and refused](VAC_FullReport_Final_Apr_06_2021_EN_files/image083.png)
Most agree most recent letter was “easy to understand”
· Seven in
eight (TOP2: 84%) respondents who contacted VAC by letter agree that VAC’s most
recent letter was “easy to understand.”
· Visible
minority respondents (TOP2: 76%) are less likely to agree than non-minority
respondents (TOP2: 85%).

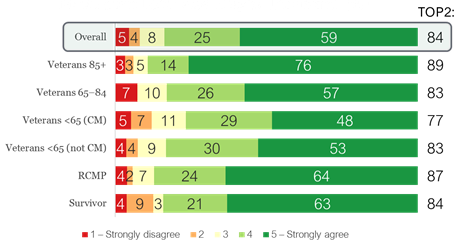
![Question: [Explanation of 5-point scale as a measure of agreement with the statement.] … “The most recent letter I received from VAC was easy to understand.”
Sample size: 832
Framework: Respondents who say have contacted VAC by letter, excluding “don’t know”](VAC_FullReport_Final_Apr_06_2021_EN_files/image086.png)
Staff get high marks for service
· Four in
five (TOP2: 78%) agree that VAC staff provided satisfactory service.
· Veterans
under 65 are again least likely of the strata to agree.
· There is
no decline pre-COVID (TOP2: 78%) to post-COVID (TOP2: 78%).

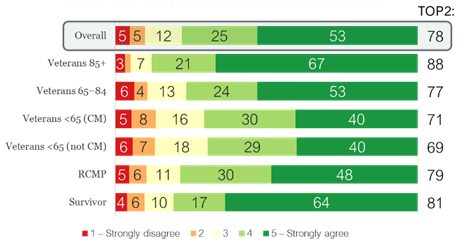
![Question: [Explanation of 5-point scale as a measure of agreement with the statement.] … “Overall, VAC staff provided a satisfactory service.”
Sample size: 3107
Framework: All respondents, excluding “don’t know” and refused](VAC_FullReport_Final_Apr_06_2021_EN_files/image089.png)
VAC staff perceived as knowledgeable
· Three-quarters
(TOP2: 77%) of respondents say VAC staff were knowledgeable about programs and
services.
· Veterans
under 65 are least likely to agree.
· Indigenous
respondents (TOP2: 61%) are much less likely than non-Indigenous
respondents (TOP2: 78%) to agree.

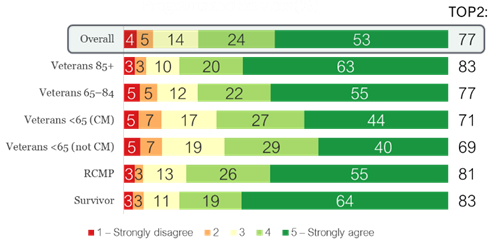
![Question: [Explanation of 5-point scale as a measure of agreement with the statement.] … “VAC staff were knowledgeable about the programs and services I inquired about.”
Sample size: 2885
Framework: All respondents, excluding “don’t know” and refused](VAC_FullReport_Final_Apr_06_2021_EN_files/image092.png)
Most feel staff are competent
· Four in
five (TOP2: 78%) respondents agree that VAC staff were competent when
responding to their inquiry.
· French-speakers
(TOP2: 86%) are much more likely than English-speakers (TOP2: 77%) to
agree.
· Indigenous
respondents (TOP2: 68%) are much less likely than non-Indigenous
respondents (TOP2: 79%) to agree.

![Question: [Explanation of 5-point scale as a measure of agreement with the statement.] … “VAC staff were competent in responding to my inquiry.”
Sample size: 2943
Framework: All respondents, excluding “don’t know” and refused](VAC_FullReport_Final_Apr_06_2021_EN_files/image095.png)
Many clients say
VAC staff treated them exceptionally
· Three-quarters
(TOP2: 77%) say VAC staff treated them exceptionally.
· Veterans
under 65 who are not case-managed are the least likely to agree (TOP2:
71%).
· There is
no drop-off in agreement from pre-COVID (TOP2: 76%) to post-COVID
(TOP2: 77%).

![Question: [Explanation of 5-point scale as a measure of agreement with the statement.] … “Treatment by VAC staff was exceptional.”
Sample size: 2972
Framework: All respondents, excluding “don’t know” and refused](VAC_FullReport_Final_Apr_06_2021_EN_files/image098.png)
Most agree that they were respected by VAC staff
· Four in
five (BTM2: 80%) agree that they were respected by VAC staff.
· Only one
in eight (TOP2: 13%) respondents say they feel like VAC staff did not respect
them.
· Survivors
(TOP2: 22%) are the most likely to feel negatively, i.e., that they were not
respected by VAC staff.

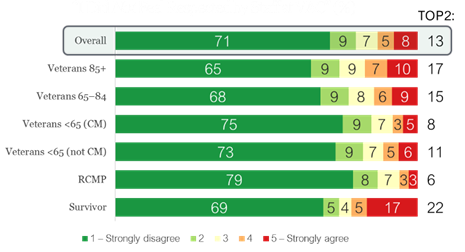
![Question: [Explanation of 5-point scale as a measure of agreement with the statement.] … “I did not feel respected by staff at VAC.”
Sample size: 2968
Framework: All respondents, excluding “don’t know” and refused](VAC_FullReport_Final_Apr_06_2021_EN_files/image101.png)
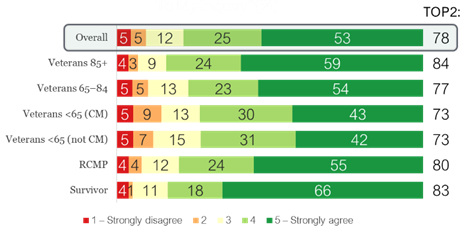
 Most
agree that staff were responsive to their needs
Most
agree that staff were responsive to their needs
· Three-quarters
(BTM2: 74%) agree that VAC staff were responsive to their needs.
· Only one in
seven (TOP2: 14%) say that VAC staff was not responsive to their needs.
· RCMP
(BTM2: 82%) are the most likely to feel positively about staff’s
responsiveness.
· Survivors
(TOP2: 22%) are the most likely to feel negatively.

![Question: [Explanation of 5-point scale as a measure of agreement with the statement.] … “VAC staff were not responsive to my needs.”
Sample size: 2962
Framework: All respondents, excluding “don’t know” and refused](VAC_FullReport_Final_Apr_06_2021_EN_files/image105.png)
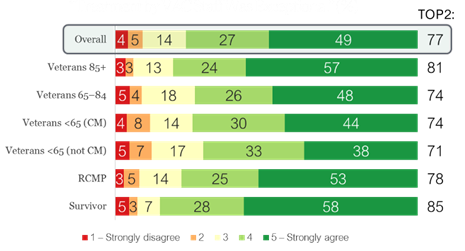
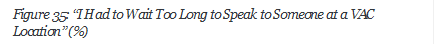
Most think wait time at VAC location is reasonable
· Two-thirds
(BTM2: 66%) of respondents say that they did not have to wait too long to speak
to someone at a VAC location.
· Survivors
(TOP2: 26%) are the most likely to say they had to wait too long.
· There are
no noticeable changes pre-COVID (TOP2: 19%) to post-COVID (TOP2:
19%).
![Question: [Explanation of 5-point scale as a measure of agreement with the statement.] … “I had to wait too long to speak to someone at a VAC location.”
Sample size: 2816
Framework: All respondents, excluding “don’t know” and refused](VAC_FullReport_Final_Apr_06_2021_EN_files/image108.png)
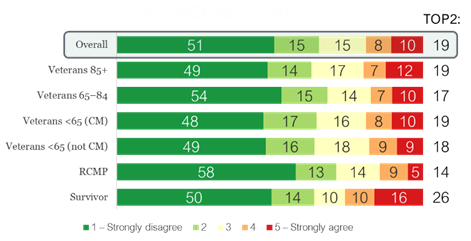
Vast
majority agree that they were communicated with in official language of choice
· 19 in 20
(TOP2: 95%) respondents agree that they were communicated with in the official
language of their choice.
· French-speakers
(TOP2: 96%) are just as likely as English-speakers (TOP2: 95%) to agree.
![Question: [Explanation of 5-point scale as a measure of agreement with the statement.] … “VAC staff communicated with me in my official language of choice.”
Sample size: 3098
Framework: All respondents, excluding “don’t know” and refused](VAC_FullReport_Final_Apr_06_2021_EN_files/image111.png)
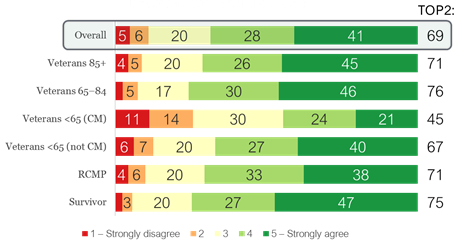
Variation
in timeliness of obtaining services and benefits
· Overall,
seven in 10 (TOP2: 70%) respondents say they obtained a service or benefit in a
timely manner.
· Case-managed
Veterans under 65 (TOP2: 42%) are the least likely to agree.
· Survivors
(TOP2: 87%) and Veterans 85 and up (TOP2: 87%) are the most likely to
agree.

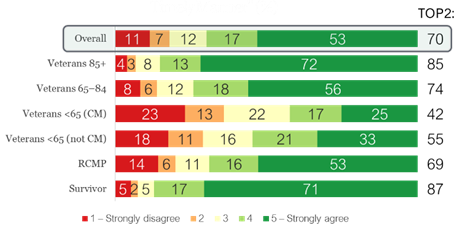
![Question: [Explanation of 5-point scale as a measure of agreement with the statement.] … “I obtained a service or benefit in a timely manner.”
Sample size: 3089
Framework: All respondents, excluding “don’t know” and refused](VAC_FullReport_Final_Apr_06_2021_EN_files/image114.png)
Most understand services and benefits offered
· Overall,
seven in 10 (TOP2: 69%) respondents agree that they understand the services and
benefits offered by VAC.
· Younger
respondents like those under 40 (TOP2: 58%) are less likely to agree
than their older counterparts, e.g., respondents 90 and over (TOP2:
80%).
· Men
(TOP2: 68%) are less likely to agree than women (TOP2: 74%).

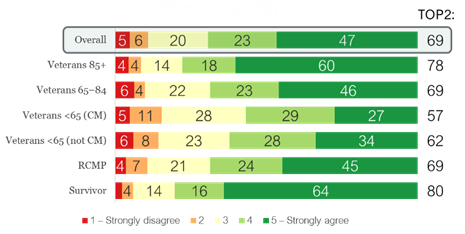
![Question: [Explanation of 5-point scale as a measure of agreement with the statement.] … “I understand the services and benefits offered by Veterans Affairs Canada.”
Sample size: 3168
Framework: All respondents, excluding “don’t know” and refused](VAC_FullReport_Final_Apr_06_2021_EN_files/image117.png)
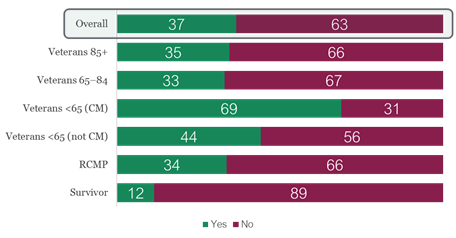
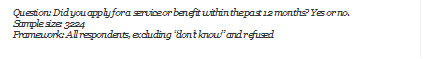
Most have not applied for a service or benefit
recently
· Three in
eight (37%) respondents say they have applied for a service or benefit in the
past 12 months.
· Case-managed
Veterans under 65 (69%) are the most likely strata to say they applied
recently.
· Survivors
(12%) are the least likely to say they applied.
· Women
(23%) are less likely than men (41%) to say they applied in the past 12
months.

Veterans under 65 less likely to find application process
easy
· Three in
five (TOP2: 58%) respondents who applied for a service or benefit in the last
12 months agreed that the application process was easy.
· Veterans
over 85 (TOP2: 77%) are most likely to agree.
· Veterans
under 65 are least less likely to agree.
· There is
no difference in agreement between French-speakers (TOP2: 58%) and English-speakers
(TOP2: 58%).

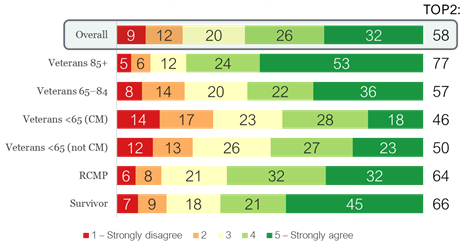
![Question: [Explanation of 5-point scale as a measure of agreement with the statement.] … “Overall, the application process was easy.”
Sample size: 1159
Framework: Respondents who say they applied for a service or benefit within the past 12 months, excluding “don’t know” and refused](VAC_FullReport_Final_Apr_06_2021_EN_files/image123.png)
Veterans under
65 do not agree that information is easy to find
· Half
(TOP2: 53%) of respondents who applied for a service or benefit in the past 12
months agree that the information needed to apply was “easy to find.”
· Once
again, Veterans under 65 are the two strata least likely to agree.

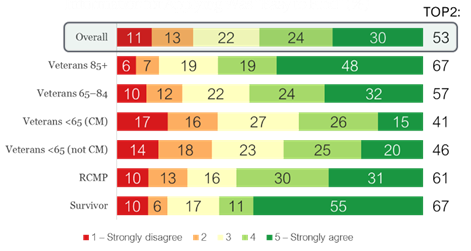
![Question: [Explanation of 5-point scale as a measure of agreement with the statement.] … “Overall, the information I needed to apply for a service or benefit that I am eligible for was easy to find.”
Sample size: 1153
Framework: Respondents who say they applied for a service or benefit within the past 12 months, excluding “don’t know” and refused](VAC_FullReport_Final_Apr_06_2021_EN_files/image126.png)
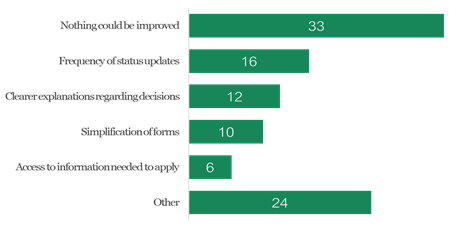
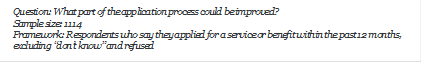
A third say “nothing could be improved”
· When
asked about potential improvements to the application process, a third (33%) of
respondents who applied say nothing could be improved.
· The most
popular improvement areas are frequency of status updates (16%), clearer
explanations regarding decisions (12%) and simplification of forms (10%).

Services and Programs
Three-quarters are satisfied with case management services
and two-thirds say it improves their quality of life. Most are generally
satisfied with the working relationship they have with their case manager.
Younger respondents tend to be less satisfied with case management.
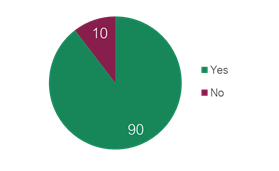
Most case-managed respondents have a case manager
· Of the
respondents who are on file as case-managed, nine in 10 (90%) say they
currently have a case manager
· This
question serves as a screener for the next section of the survey. Those who
responded “yes” to this question are asked further questions about case
management and other relevant services and programs.

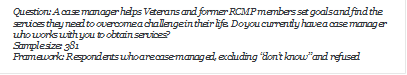
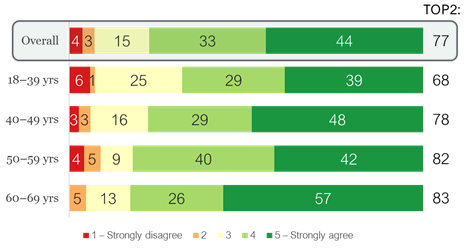
High satisfaction with case management; varies by age
· Three-quarters
(TOP2: 75%) of respondents who say they have a case manager agree that they are
satisfied with case management services.
· Indigenous
respondents (TOP2: 69%) are less likely to agree than non-Indigenous
respondents (TOP2: 76%).
· There is
a clear age trend, as see in the figure. Respondents 60 and over are
more likely to agree than respondents under 40.
· French-speakers
(TOP2: 82%) more satisfied than English-speakers (TOP2: 73%).

![Question: [Reminder of 5-point scale as a measure of agreement with the statement.] … “Overall, I have been satisfied with case management services.”
Sample size: 337
Framework: Respondents who say they have a case manager, excluding “don’t know” and refused](VAC_FullReport_Final_Apr_06_2021_EN_files/image135.png)
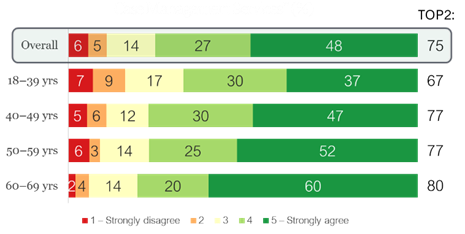
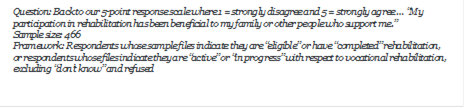
Case
management seen as beneficial
· Of those
who say they have a case manager, four in five (TOP2: 80%) agree that case
management services were beneficial to them.
· Indigenous
respondents (TOP2: 73%) are less likely to agree than non-Indigenous
respondents (TOP2: 81%).
· Veterans 60
and older (TOP2: 89%) are more likely to agree than younger veterans, like
those under 40.
· Respondents
are more likely to agree post-COVID (TOP2: 84%) than pre-COVID
(TOP2: 77%).

![Question: [Reminder of 5-point scale as a measure of agreement with the statement.] … “Case management services were beneficial to me.”
Sample size: 335
Framework: Respondents who say they have a case manager, excluding “don’t know” and refused](VAC_FullReport_Final_Apr_06_2021_EN_files/image138.png)
Two-thirds
say lives improved due to case management7
· Two-thirds
(TOP2: 66%) of respondents who say they have a case manager agree that case
management has improved their lives.
· Women
(TOP2: 71%) are slightly more likely than men (TOP2: 65%) to agree.
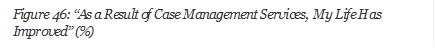
![Question: [Reminder of 5-point scale as a measure of agreement with the statement.] … “As a result of case management services, my life has improved.”
Sample size: 334
Framework: Respondents who say they have a case manager, excluding “don’t know” and refused](VAC_FullReport_Final_Apr_06_2021_EN_files/image141.png)
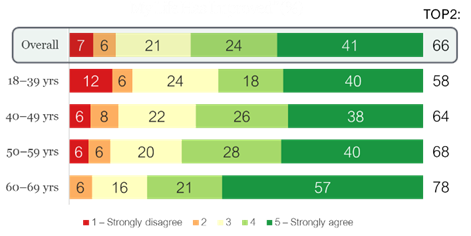
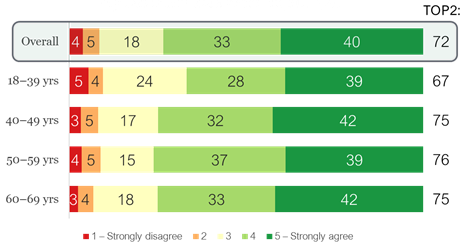
Most agree a manager was assigned reasonably quickly
· Of those
who say they have case managers, three-quarters (TOP2: 76%) agree that they
were assigned their case manager in a reasonable amount of time.
· Indigenous
respondents (TOP2: 68%) are less likely to agree than non-Indigenous
respondents (TOP2: 77%).
· As seen
in the figure, older respondents are more likely to agree than younger
respondents.
· No COVID
drop-off: post-COVID levels (TOP2: 78%) are similar to pre-COVID (TOP2:
75%) levels.
![Question: [Reminder of 5-point scale as a measure of agreement with the statement.] … “I was assigned a case manager in a reasonable amount of time.”
Sample size: 338
Framework: Respondents who say they have a case manager, excluding “don’t know” and refused](VAC_FullReport_Final_Apr_06_2021_EN_files/image144.png)
Most have a good relationship with case manager
· Eight in
10 (TOP2: 78%) respondents agree that they are happy with the working
relationship they have with their current case manager.
· Once
again, there is a clear age trend in the graph: older respondents are
more likely to be happy than younger respondents.
· Indigenous
respondents (TOP2: 16%) are slightly more likely to be unhappy than non-Indigenous
respondents (TOP2: 11%).
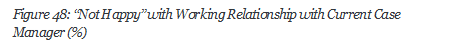
![Question: [Reminder of 5-point scale as a measure of agreement with the statement.] … “I am not happy with the working relationship I have with my current case manager.”
Sample size: 336
Framework: Respondents who say they have a case manager, excluding “don’t know” and refused](VAC_FullReport_Final_Apr_06_2021_EN_files/image147.png)
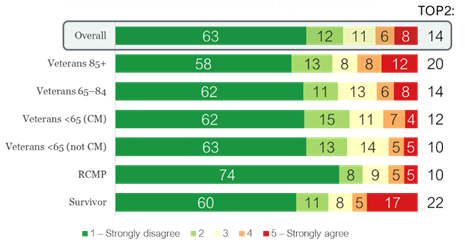
Majority
feel case plan goals do reflect their needs
· Seven in
10 (BTM2: 72%) agree that the goals in their case plan reflect their needs.
· Only one
in eight (TOP2: 12%) respond negatively.
· More
respondents are likely to feel positively post-COVID (TOP2: 77%) than pre-COVID
(TOP2: 67%).

![Question: [Reminder of 5-point scale as a measure of agreement with the statement.] … “The goals in my case plan do not reflect my needs.”
Sample size: 327
Framework: Respondents who say they have a case manager, excluding “don’t know” and refused](VAC_FullReport_Final_Apr_06_2021_EN_files/image150.png)
Most agree they were involved in developing case plan
goals
· Three-quarters
(TOP2: 73%) of respondents agree that they were involved in developing goals
for their case plan.
· Women
(TOP2: 79%) are more likely than men (TOP2: 71%) to agree.

![Question: [Reminder of 5-point scale as a measure of agreement with the statement.] … “I was involved in developing my goals for my case plan.”
Sample size: 328
Framework: Respondents who say they have a case manager, excluding “don’t know” and refused](VAC_FullReport_Final_Apr_06_2021_EN_files/image153.png)
Half had the opportunity to involve family and supporters
· Five in
nine (TOP2: 54%) agree that they had the opportunity to involve family and
other supporters in case plan development.
· This
maintains 2017 levels (TOP2: 53%).
· As seen
in the figure, younger respondents are less likely to agree than older
respondents.
· Women
(TOP2: 45%) are less likely to agree than men (TOP2: 55%).
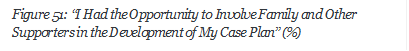
![Question: [Reminder of 5-point scale as a measure of agreement with the statement.] … “I had the opportunity to involve family and other supporters in the development of my case plan.”
Sample size: 318
Framework: Respondents who say they have a case manager, excluding “don’t know” and refused](VAC_FullReport_Final_Apr_06_2021_EN_files/image156.png)
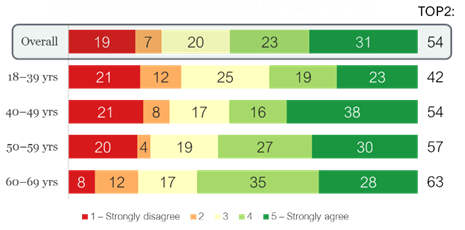
Regular contact with case manager varies
· Overall,
three in five (TOP2: 61%) agree that they had regular contact with their case
manager to discuss progress on their goals.
· Those under
40 (TOP2: 48%) are much less likely to agree.
· Women
(TOP2: 65%) are slightly more likely to agree than men (TOP2: 60%).
· No
drop-off post-COVID (TOP2: 63%) vs. pre-COVID (TOP2: 59%).
![Question: [Reminder of 5-point scale as a measure of agreement with the statement.] … “I had regular contact with my case manager to discuss if I was reaching my goals.”
Sample size: 330
Framework: Respondents who say they have a case manager, excluding “don’t know” and refused](VAC_FullReport_Final_Apr_06_2021_EN_files/image159.png)
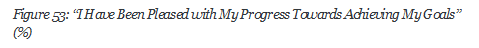
Majority pleased with progress towards achieving goals
· Three in
five (TOP2: 60%) agree that they are pleased with their progress towards
achieving their goals.
· As seen
in the figure, older respondents are slightly more likely to agree
compared to younger respondents.
· Visible
minorities (TOP2: 56%) are slightly less likely than non-minorities
(TOP2: 61%) to agree.
![Question: [Reminder of 5-point scale as a measure of agreement with the statement.] … “I have been pleased with my progress towards achieving my goals.”
Sample size: 327
Framework: Respondents who say they have a case manager, excluding “don’t know” and refused](VAC_FullReport_Final_Apr_06_2021_EN_files/image162.png)
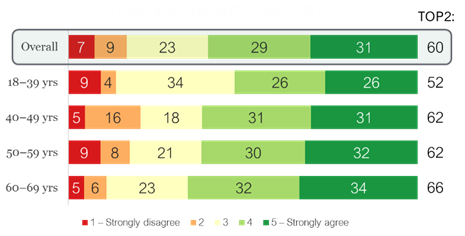
Case managers helping inform about programs and services
· Seven in
10 (TOP2: 69%) say their case manager better informed them on accessing VAC’s
programs and services.
· Older
respondents are more likely than younger ones to agree, as shown in the
figure.
· Respondents
are more likely to agree post-COVID (TOP2: 74%) than pre-COVID
(TOP2: 65%), showing how helpful case managers are for clients navigating the
pandemic.
![Question: [Reminder of 5-point scale as a measure of agreement with the statement.] … “In working with my case manager, I became better informed on how to access VAC´s programs and services that I needed.”
Sample size: 334
Framework: Respondents who say they have a case manager, excluding “don’t know” and refused](VAC_FullReport_Final_Apr_06_2021_EN_files/image165.png)
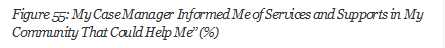
Case managers pointing to community supports
· Six in 10
(TOP2: 63%) agree that case managers informed them of helpful supports and
services in their community.
· Post-COVID
(TOP2: 68%) respondents are more likely to agree than pre-COVID (TOP2:
59%).
· Once
again, there is a clear positive trend between age and agreement. Older
respondents are more likely to agree.
· Indigenous
respondents (TOP2: 57%) are less likely to agree than non-Indigenous
respondents (TOP2: 64%).
![Question: [Reminder of 5-point scale as a measure of agreement with the statement.] … “My case manager informed me of services and supports in my community that could help me.”
Sample size: 331
Framework: Respondents who say they have a case manager, excluding “don’t know” and refused](VAC_FullReport_Final_Apr_06_2021_EN_files/image168.png)
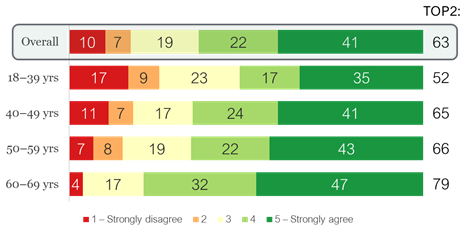
Most say case managers are responding to calls promptly
· Four in
five (TOP2: 80%) agree that case managers are responding to their calls in a
reasonable amount of time.
· Women
(TOP2: 86%) are more likely to agree than men (TOP2: 79%).
· There has
been no drop-off pre-COVID (TOP2: 76%) to post-COVID (TOP2: 84%),
but rather an improvement.
![Question: [Reminder of 5-point scale as a measure of agreement with the statement.] … “My case manager responded to my calls in a reasonable amount of time.”
Sample size: 335
Framework: Respondents who say they have a case manager, excluding “don’t know” and refused](VAC_FullReport_Final_Apr_06_2021_EN_files/image171.png)
Most feel case plan goals are relevant
· Three-quarters
(TOP2: 77%) of respondents agree that their case plan goals were relevant.
· Indigenous
(TOP2: 69%) and visible minority (TOP2: 70%) respondents are less likely
to agree than non-Indigenous (TOP2: 78%) and non-minority (TOP2:
79%) respondents.

![Question: [Reminder of 5-point scale as a measure of agreement with the statement.] … “My case plan goals were relevant.”
Sample size: 325
Framework: Respondents who say they have a case manager, excluding “don’t know” and refused](VAC_FullReport_Final_Apr_06_2021_EN_files/image174.png)
Majority agree case plan goals were helpful
· Seven in
10 (TOP2: 72%) respondents agree that their case plan goals were helpful.
· Indigenous
respondents (TOP2:64%) are less likely to agree than non-Indigenous
respondents (TOP2: 75%).

![Question: [Reminder of 5-point scale as a measure of agreement with the statement.] … “My case plan goals were helpful.”
Sample size: 327
Framework: Respondents who say they have a case manager, excluding “don’t know” and refused](VAC_FullReport_Final_Apr_06_2021_EN_files/image176.png)
Veterans Independence Program (VIP)
VIP receives very positive feedback from program recipients.
The vast majority are satisfied with the program. Overwhelmingly, respondents
say VIP has met their needs, helped keep them in their community, and been a
benefit to them.
High overall satisfaction with VIP
· Nine in
10 (TOP2: 90%) respondents who receive benefits from VIP agree that they are
satisfied with the program overall.
· Seven in
10 (71%) strongly agree.
· Indigenous
respondents (64%) are slightly less likely to strongly agree than non-Indigenous
respondents (71%).

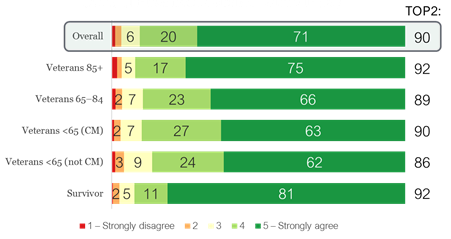
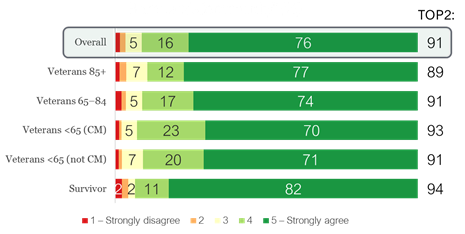
VIP relied on to keep recipients in their homes and
communities
Nine in 10 (TOP2: 91%) respondents who are in receipt of VIP
benefits agree that they rely on VIP to help them remain in their home and
community.
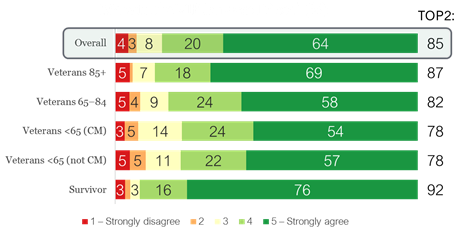
Most able to find
providers to help with VIP services
· Six in
seven (TOP2: 85%) of those in receipt of benefits agree that they are able to
find service providers to help them with needed VIP services.
· This is
down from 2017 (TOP2: 93%).
· Veterans
under 65 (TOP2: 78%) are the least likely to agree of the five strata.
· French-speakers
(TOP2: 79%) are slightly less likely than English-speakers (TOP2: 85%)
to agree.
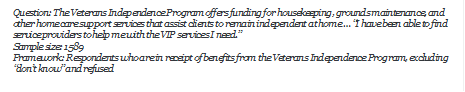
Majority
agree that VIP meets their needs
Six in seven (TOP2: 84%)of those in receipt of benefits from
VIP agree that VIP meets their needs.

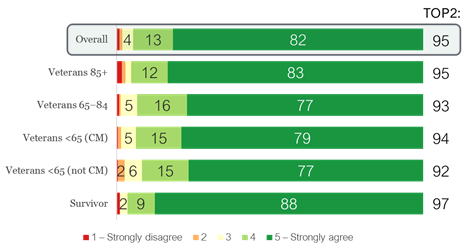
Overwhelming number say VIP has been a benefit to them
· 19 in 20
(TOP2: 95%) respondents in receipt of benefits from VIP say that it has been a
benefit to them.
· Four in
five (82%) strongly agree.

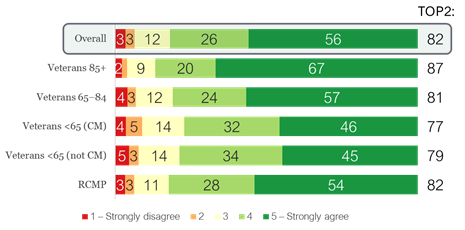
Four in five respondents are satisfied with the Treatment
Benefits Program. Most people say the program meets their needs and that the
reimbursement time is reasonable. Around nine in 10 are able to access their
benefits. The biggest barrier to accessing benefits is lack of approval from
VAC.
Program enjoys high satisfaction
· Overall,
four in five (TOP2: 82%) respondents who used treatment benefits over the past
24 months agree that they are satisfied.
· Indigenous
respondents (TOP2: 69%) are less likely to agree than non-Indigenous
respondents (TOP2: 83%).
· Younger
respondents, like those under 40 (TOP2: 73%), are less likely to agree
than older respondents, like those 90 and over (TOP2: 88%).
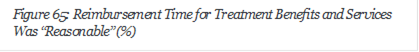
Most
agree reimbursement time was reasonable
· Three-quarters
(TOP2: 76%) of those who used treatment benefits in the past 24 months agree
that the time it took to get reimbursed was reasonable.
· Indigenous
respondents (TOP2: 58%) are less likely to agree than non-Indigenous
respondents (TOP2: 77%).
· Visible
minorities (TOP2: 66%) are less likely to agree than non-minorities
(TOP2: 77%).
· Case-managed
Veterans under 65 (TOP2: 63%) are the least likely to agree.
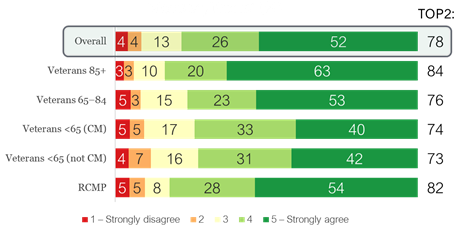
For
most, the Treatment Benefits Program meets their needs
· Four in
five (TOP2: 78%) agree that the program meets their needs.
· This is
down from 2017 (TOP2: 84%).
· Indigenous
respondents (TOP2: 72%) are less likely to agree than non-Indigenous
respondents (TOP2: 79%).
· Younger
respondents, like those under 40 (TOP2: 71%) are less likely to agree
than older respondents like those 90 and over (TOP2: 85%).

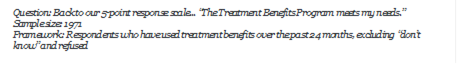
Vast majority able to
access needed treatment benefits
· Eight in
nine (TOP2: 87%) respondents who used treatment benefits in the past 24 months
say they were able to access their needed benefits.
· Women
(TOP2: 81%) are less likely than men (TOP2: 87%) to say yes.

Lack of VAC approval for benefits/services top reason for
lack of access
· Of those
who say they were not able to access their needed treatment benefits, four in
10 (37%) say the benefit or service was not approved by VAC.
· One in
five (20%) say the wait time to access the benefits was too long.
· Visible
minorities (51%) and Indigenous respondents (45%) are more likely
than average to say their benefit or service was not approved by VAC.

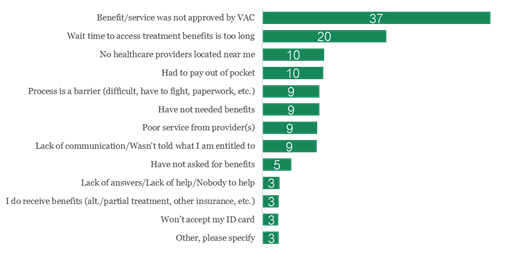
![Question: Why haven’t you accessed the benefits you needed? [multiple responses allowed]
Sample size: 241
Framework: Respondents who say they were not able access the treatment benefits they needed, excluding “don’t know” and refused](VAC_FullReport_Final_Apr_06_2021_EN_files/image207.png)
Some variation by strata
· RCMP
are the most likely to cite lack of approval (54%) and wait times (40%)
compared to other strata.
· Having to
pay out of pocket (29%) is the most prevalent among case-managed Veterans
under 65.

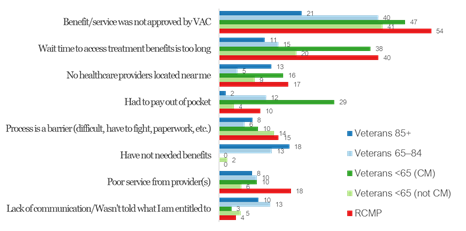
![Question: Why haven’t you accessed the benefits you needed? [multiple responses allowed]
Sample size: 241
Framework: Respondents who say they were not able access the treatment benefits they needed, excluding “don’t know” and refused](VAC_FullReport_Final_Apr_06_2021_EN_files/image210.png)
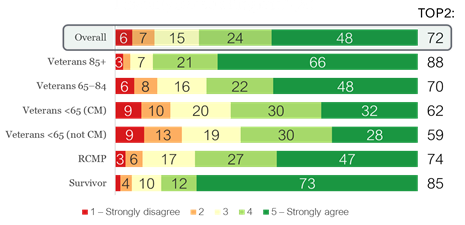
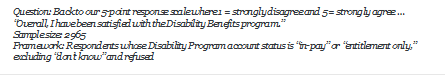
Most program recipients are satisfied with the Disability
Benefits Program. A majority agree that the program recognizes their
service-related disability and compensates them for it.
High satisfaction with program, though varies between
strata
· Seven in
10 (TOP2: 72%) respondents agree that they are satisfied with the Disability
Benefits Program overall.
· Veterans
under 65 are least satisfied among the six strata.
· Indigenous
respondents (TOP2: 63%) are less satisfied than non-Indigenous
respondents (TOP2: 73%).
· Men
(TOP2: 71%) are less satisfied than women (TOP2: 77%).
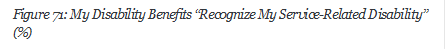
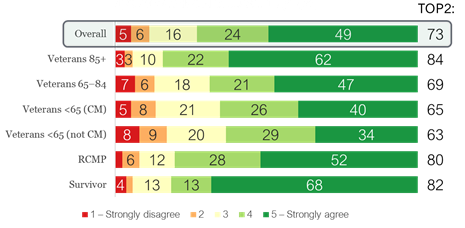
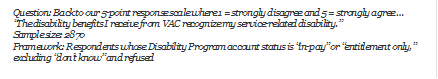
Most
agree benefits recognize their disability
· Three-quarters
(TOP2: 73%) of respondents agree that their disability benefits recognize their
service-related disability.
· Veterans
under 65 are the least likely of the six strata to agree.
· Indigenous
respondents (TOP2: 68%) are slightly less likely than non-Indigenous
respondents (TOP2: 73%) to agree.
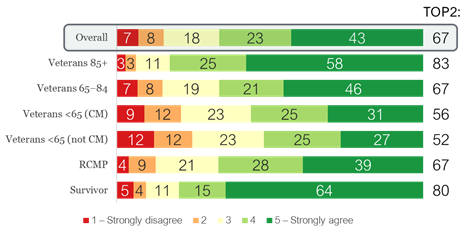
Majority agree benefits compensate them for disability
· Two-thirds
(TOP2: 67%) of respondents agree that their disability benefits compensate them
for their service-related disability.
· Indigenous
respondents (TOP2: 58%) are less likely to agree than non-Indigenous
respondents (TOP2: 67%).
· In
general, younger respondents are less likely than older
respondents to agree.
Rehabilitation Services and Vocational Assistance
Seven in 10 are satisfied with the rehabilitation services
and vocational assistance. A majority say it helped improve their quality of
life. Fewer people say that the program helped them return to work/their main
activity, or that it improved barriers in their life.
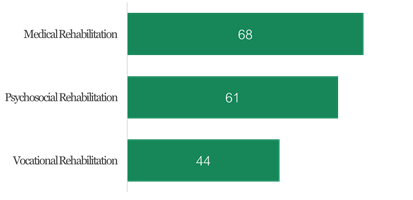
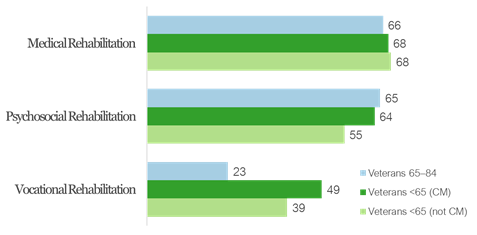
Medical and psychosocial rehabilitation most common
When asked which rehabilitation program streams they had
participated in, two-thirds (68%) say medical rehabilitation, three in five
(61%) say psychosocial rehabilitation, and four in nine (44%) say vocational
rehabilitation.

![Question: What stream(s) of VAC rehabilitation program have you participated in? [multiple responses allowed]
Sample size: 466
Framework: Respondents whose sample files indicate they are “eligible” or have “completed” rehabilitation, or respondents whose files indicate they are “active” or “in progress” with respect to vocational rehabilitation, excluding “don’t know” and refused](VAC_FullReport_Final_Apr_06_2021_EN_files/image222.png)
Strata evenly-represented in each stream
· Various
strata are generally evenly-represented in each rehabilitation program stream.
· The notable
exception is that Veterans 65–84 are much less likely than younger Veterans to
participate in vocational rehabilitation, likely because more are retired at
that age.

![Question: What stream(s) of VAC rehabilitation program have you participated in? [multiple responses allowed]
Sample size: 466
Framework: Respondents whose sample files indicate they are “eligible” or have “completed” rehabilitation, or respondents whose files indicate they are “active” or “in progress” with respect to vocational rehabilitation, excluding “don’t know” and refused](VAC_FullReport_Final_Apr_06_2021_EN_files/image225.png)
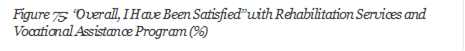
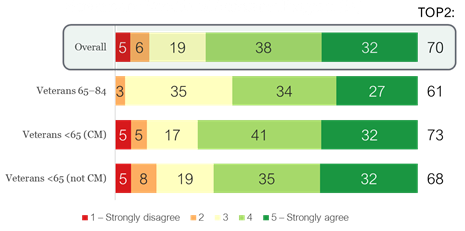
Most
are satisfied with vocational assistance and rehabilitation
· Seven in
10 (TOP2: 70%) of respondents agree that they are satisfied with VAC’s
Rehabilitation Services and Vocational Assistance Program.
· Indigenous
respondents (TOP2: 61%) are less likely to agree than non-Indigenous
respondents (TOP2: 71%).
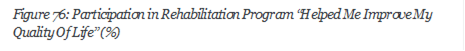
Most agree program improved quality of life
· Two-thirds
(TOP2: 64%) of respondents agree that participation in VAC’s Rehabilitation
Program has helped improve their quality of life.
· Women
(TOP2: 70%) are more likely to agree than men (TOP2: 62%).
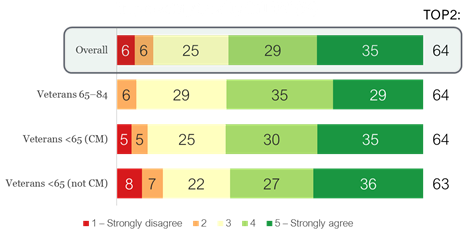
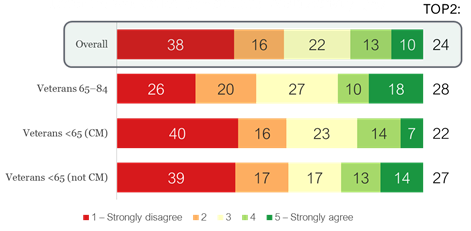
Fewer agree that the program helped them return to work
· Only a
quarter (TOP2: 24%) of respondents agree that the program helped them enter the
workforce or return to their main activity.
· Indigenous
respondents (TOP2: 10%) are far less likely than non-Indigenous
respondents (TOP2: 25%) to agree.
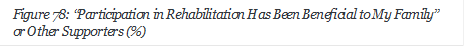
Majority
agree rehabilitation has benefited their supporters
· Three in
five (TOP2: 59%) agree that participating in rehabilitation has been beneficial
to their family others for support them.
· Indigenous
respondents (TOP2: 50%) are less likely than non-Indigenous respondents
(TOP2: 60%) to agree.
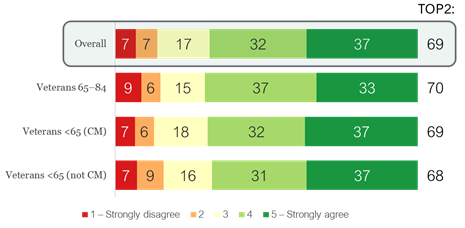
Most agree that rehabilitation was personally beneficial
· Seven in
10 (TOP2: 69%) agree that participating in rehabilitation was beneficial to
them.
· Once
again, Indigenous respondents (TOP2: 60%) are less likely to agree than non-Indigenous
respondents (TOP2: 69%).

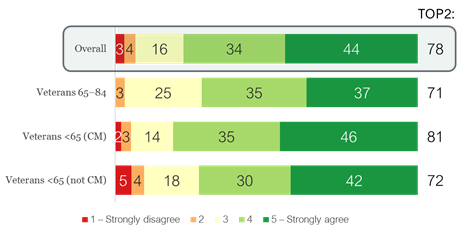
Level
of participation generally perceived as reasonable
· Four in
five (TOP2: 78%) respondents agree that the level of participation expected of
them in the rehabilitation program was reasonable.
· Respondents
aged 60–69 are slightly less likely to agree.
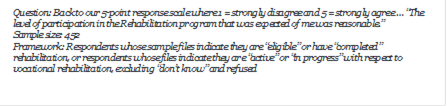
Vast majority agree that they tried hard to follow their
plan
· Nine in
10 (TOP2: 90%) respondents say they tried hard to follow their rehabilitation
plan.
· There is
no noticeable drop-off from pre-COVID (TOP2: 91%) to post-COVID (TOP2: 90%) in
determination to follow the plan.

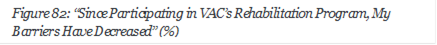
Respondents split on whether participation decreased barriers
· Three in
10 (TOP2: 31%) agree that their barriers decreased after participating.
· A similar
number (BTM2: 33%) disagreed.
· Indigenous
respondents (BTM2: 41%) are more likely to disagree than non-Indigenous
respondents (BTM2: 32%).
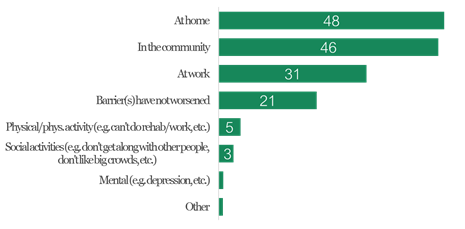
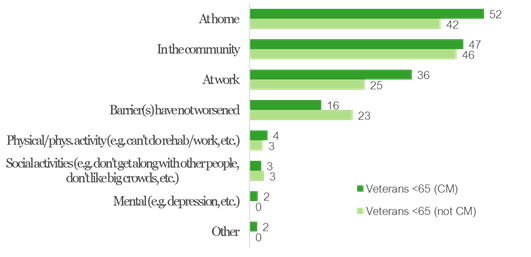
Home and community top areas where barriers worsened
· Of those
who disagreed that their barriers improved, the most commonly-cited areas where
barriers worsened are at home (48%) and in the community (46%).
· Three in
10 (31%) say their barriers worsened at work.
· One in
five (21%) say their barrier(s) have not worsened, presumably because they have
stayed the same.

![Question: Where has one of your barriers worsened? [multiple responses allowed]
Sample size: 143
Framework: Respondents who rated their agreement with the statement “Since participating in VAC’s Rehabilitation Program, my barriers have decreased” as a 2 or lower, excluding “don’t know” and refused](VAC_FullReport_Final_Apr_06_2021_EN_files/image252.png)
Even
spread among strata
· There are
no drastic differences between strata regarding where barriers worsened.
· Case-managed
Veterans under 65 are slightly more likely to say their barriers worsened
at home, in the community, and at work.

![Question: Where has one of your barriers worsened? [multiple responses allowed]
Sample size: 143
Framework: Respondents who rated their agreement with the statement “Since participating in VAC’s Rehabilitation Program, my barriers have decreased” as a 2 or lower, excluding “don’t know” and refused](VAC_FullReport_Final_Apr_06_2021_EN_files/image255.png)
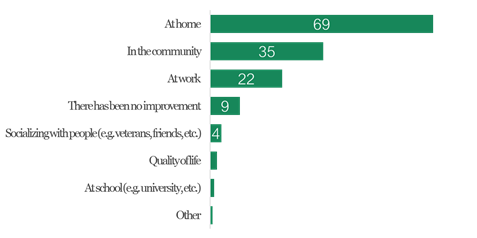
Improvements in barriers tended to be at home
· Of those
who agree that their barriers have decreased as a result of participation,
seven in 10 (69%) say they experienced this improvement at home.
· A third
(35%) say they experienced the improvement in the community.
· One in
five (22%) say they saw an improvement at work.

![Question: Where is the improvement in one of your barriers noticeable? [multiple responses allowed]
Sample size: 129
Framework: Respondents who rated their agreement with the statement “Since participating in VAC’s Rehabilitation Program, my barriers have decreased” as a 4 or higher, excluding “don’t know” and refused](VAC_FullReport_Final_Apr_06_2021_EN_files/image258.png)
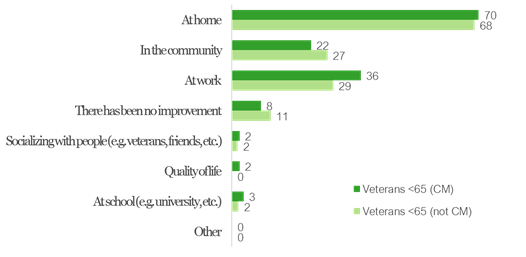
Barrier
improvements evenly distributed among strata
There are no great variations between strata regarding where
barriers improved.

![Question: Where is the improvement in one of your barriers noticeable? [multiple responses allowed]
Sample size: 129
Framework: Respondents who rated their agreement with the statement “Since participating in VAC’s Rehabilitation Program, my barriers have decreased” as a 4 or higher, excluding “don’t know” and refused](VAC_FullReport_Final_Apr_06_2021_EN_files/image261.png)
Pension for Life
Around half of respondents received information from VAC
about Pension for Life. For most, it did not change their personal benefits.
For those whose benefits changed, most understood the changes.
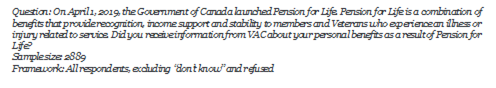
Half of respondents received information
· Just
under half (48%) of respondents received information from VAC about their
personal benefits as a result of Pension for Life.
· Younger
respondents, like those under 40 (70%) are more likely than older
respondents, like those 90 and over (32%) to have received information
about Pension for Life.
· Men
(52%) are more likely than women (36%) to have received information.

Most
saw no change in benefits
· Only a
quarter (28%) of respondents saw a change in their benefits as a result of
Pension for Life.
· Men
(30%) are more likely to have seen a change than women (21%).
· Younger
people, like those under 40 (53%) are more likely to have seen a change
than older respondents, like those 90 and above (18%).

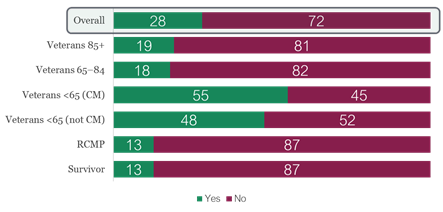

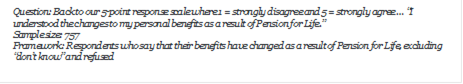
Most understood
benefits changes
· Of those
who say they experienced changes to their personal benefits, seven in 10 (TOP2:
69%) say they understood the changes.
· Understanding
is the lowest among Veterans under 85.
· Women
(TOP2: 74%) are more likely to understand than men (TOP2: 68%).
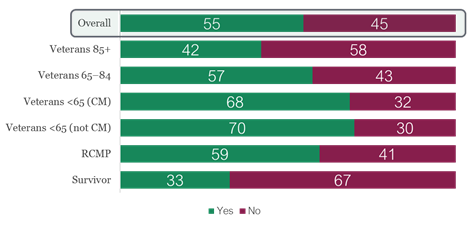
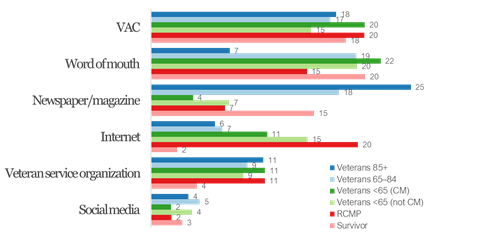
Office of the Veterans Ombudsman
Half of respondents are aware of the Office of the Veterans
Ombudsman. Of those who are aware, around half are familiar with the Office’s
services. Many heard about the Office from VAC or through word of mouth.
Just over half are aware with the Office
· Five in
nine (55%) of respondents are aware of the Office of the Veterans Ombudsman.
· Survivors
(33%) and Veterans 85 and over (42%) are the least likely to be aware of
the Office.
· Visible
minorities (45%) are less likely to be aware than non-minorities
(56%).
· Women
(40%) are less likely to be aware than men (59%).

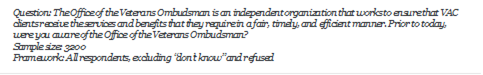
VAC and word of mouth most popular source of awareness
· Of those
who are aware of the Office, many either heard from VAC (18%) or through word
of mouth (17%).
· Other
popular sources of awareness are newspapers and magazines (13%), the internet
(10%), and Veterans service organizations (9%).
· Social
media (3%) is the least popular place to have heard about the Office.

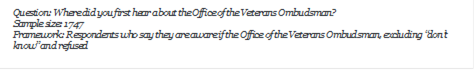
Some variations by strata
· Veterans
85 and older are the least likely (7%) of the six strata to have heard
about the Office through word of mouth.
· Survivors
are the least likely to have heard about the Office through the internet (2%),
while RCMP are the most likely (20%).

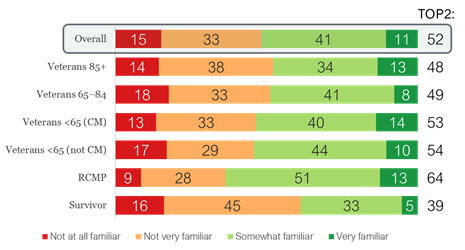
Survivors are least familiar with the Office’s services
· Half
(TOP2: 52%) of respondents who are aware of the Office say they are familiar
with the Office’s services.
· Survivors
(TOP2: 39%) are the stratum least familiar with the services of the Office.

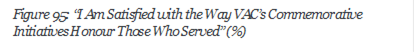
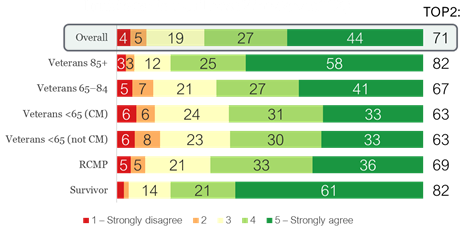
Most are satisfied with VAC’s commemoration initiatives and
the way they honour those who served. To ensure more Canadians are aware of
VAC’s commemoration initiatives, respondents suggest reaching out to schools,
community groups, and via social media.
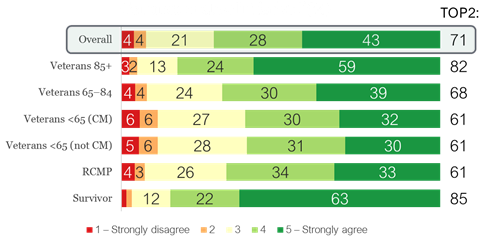
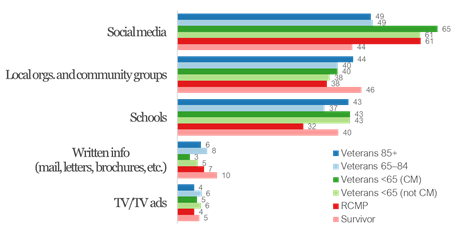
Most satisfied with commemoration overall
· Seven in
10 (TOP2: 71%) agree that they are satisfied with VAC’s commemoration
initiatives.
· Younger
respondents, like those under 40 (TOP2: 55%), are less satisfied than
older respondents, like those 90 and over (TOP2: 86%).
· Indigenous
respondents (TOP2: 63%) are less satisfied than non-Indigenous
respondents (TOP2: 71%).
·
Women (TOP2: 77%) are more satisfied than men (TOP2: 69%).
·
French-speakers (TOP2: 79%) are more satisfied than
English-speakers (TOP2: 70%).
Majority satisfied with how initiatives honour those who
served
· Seven in
10 (TOP2: 71%) respondents agree that they are satisfied with the way VAC’s
commemorative initiatives honour those who served.
· Older
respondents, like those 90 and over (TOP2: 86%), are more satisfied than
younger respondents, like those under 40 (TOP2: 60%).
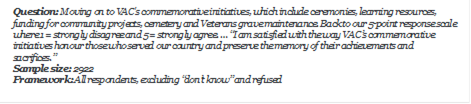
Three main suggestions for raising awareness
The three most popular suggestions for raising awareness for
commemoration initiatives are social media (55%), local organizations and
community groups (41%), and through schools (40%).

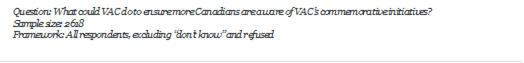
No great variation between strata
Social media is less commonly suggested by Veterans 65 and
over (49%).

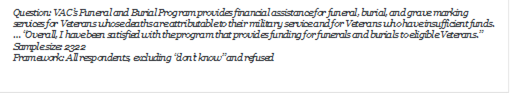
Two-thirds of respondents are satisfied with the Funeral and
Burial Program. Two-thirds are satisfied with the access to financial
assistance for Veterans’ estates.
Most satisfied with program overall
· Two-thirds
(TOP2: 67%) of respondents are satisfied with the Funeral and Burial Program
overall.
· Younger
respondents, like those under 40 (TOP2: 54%) are consistently less
satisfied than older respondents, like those 90 and over (TOP2: 81%).
· Indigenous
respondents (TOP2: 58%) are less satisfied than non-Indigenous
respondents (TOP2: 67%).
· Women
(TOP2: 74%) more satisfied than men (TOP2: 64%).

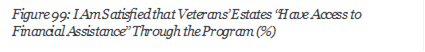
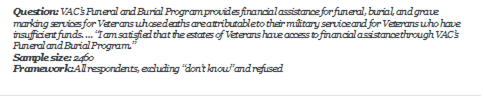
Two-thirds
satisfied with financial assistance for estates
· Two-thirds
(TOP2: 67%) of respondents are satisfied that the estates of Veterans have
access to financial assistance through VAC’s Funeral and Burial Program.
· Younger
respondents, like those under 40 (TOP2: 59%), are less satisfied than
older respondents, like those 90 and over (TOP2: 80%).
· Women
(TOP2: 73%) are more satisfied than men (TOP2: 64%).
· Indigenous
respondents (TOP2: 55%) are less satisfied than non-Indigenous (TOP2:
67%).
Satisfaction with Life
Three-quarters of respondents are satisfied with life in
general. Consistently, case-managed Veterans under 65 are the least satisfied,
while Survivors and Veterans 85+ are the most satisfied. Indigenous and visible
minority respondents are generally less satisfied. There are few notable gender
differences.
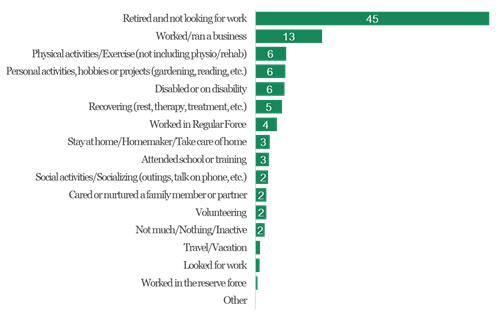
Most common main activity in past 12 months is retirement
· When
asked what their main activity has been in the past 12 months, four in nine
(45%) say retirement.
· Working/running
a business was cited by one in eight (13%).
· English-speakers
(46%) are more likely to be retired than French-speakers (37%).

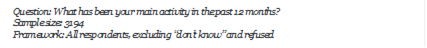
Some
variation for main activity between strata
· Unsurprisingly,
strata comprising respondents under 65 are much less likely to be
retired and more likely to be working or running a business.
· Conversely,
strata with older respondents are more likely to be retired and less
likely to be working.

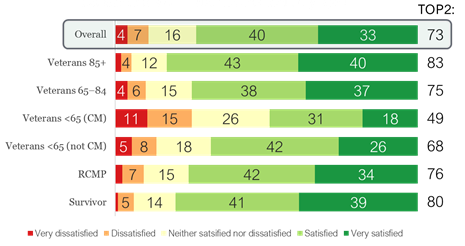
Most
are satisfied with main job or activity
· Three-quarters
(TOP2: 73%) of respondents are satisfied with their main job or activity.
· Case-managed
Veterans under 65 are the least satisfied (TOP2: 49%) of the six strata.
· Older
respondents tend to be more satisfied than younger respondents.
· Indigenous
respondents (TOP2: 64%) are less satisfied than non-Indigenous respondents
(TOP2: 74%).

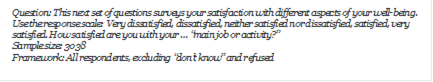
Most are satisfied with life in general
· Three-quarters
(TOP2: 76%) of respondents say they are satisfied with life in general.
· This is
slightly down from 2017 (TOP2: 85%).
· Case-managed
Veterans under 65 are the least satisfied strata: less than half (TOP2:
49%) are satisfied.
· Indigenous
respondents (TOP2: 62%) and visible minorities (TOP2: 67%) are less
satisfied than non-Indigenous (TOP2: 77%) and non-minorities
(TOP2: 77%).

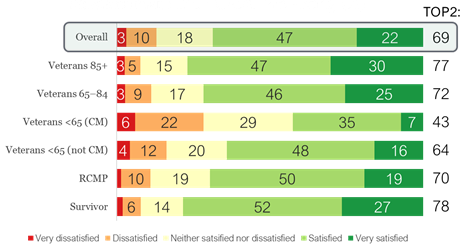
High satisfaction with overall well-being; variations by
strata
· Seven in
10 (TOP2: 69%) respondents are satisfied with their overall well-being.
· This
represents a decrease from 2017 (TOP2: 80%).
· Once
again, case-managed Veterans under 65 are the least satisfied (TOP2:
43%).
· Younger
respondents are less satisfied than older respondents.
· Indigenous
(TOP2: 61%) and visible minority (TOP2: 61%) respondents are less
satisfied than non-Indigenous (TOP2: 69%) and non-minority (TOP2:
69%) respondents.
· There is
no noticeable drop-off from pre-COVID (TOP2: 67%) to post-COVID
(TOP2: 71%).

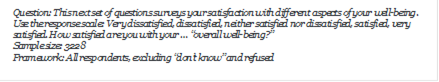
Majority
satisfied with leisure activities
· Two-thirds
(TOP2: 65%) of respondents are satisfied with their leisure activities.
· Case-managed
Veterans under 65 (TOP2: 36%) are much less satisfied than other strata.
· Younger
respondents, like those under 40 (TOP2: 47%), tend to be less satisfied
than older respondents, like those 90 and over (TOP2: 74%).
· Indigenous
respondents (TOP2: 53%) less satisfied than non-Indigenous respondents
(TOP2: 66%).
· Visible
minority respondents (TOP2: 56%) less satisfied than non-minority respondents
(TOP2: 66%).

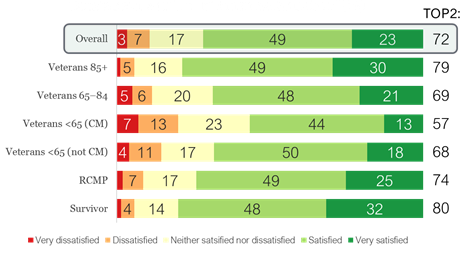
Most are satisfied with their finances
· Seven in
10 (TOP2: 72%) respondents are satisfied with their financial situation.
· Younger
respondents, like those under 40 (TOP2: 53%), are generally less
satisfied than older respondents, like those 90 and over (TOP2: 82%).
· Case-managed
Veterans under 65 (TOP2: 57%) are less satisfied than other strata.

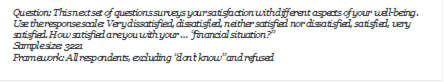
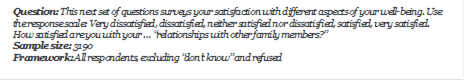
Strong majority satisfied with their family relationships
· Six in
seven (TOP2: 85%) respondents are satisfied with their relationships with their
family members.
· Case-managed
Veterans under 65 (TOP2: 61%) are the least satisfied of the six strata.
· Younger
respondents, like those under 40 (TOP2: 69%), tend to be less satisfied
than older respondents, like those 90 and over (TOP2: 94%).
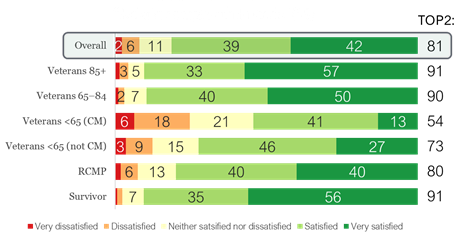
Most say they are satisfied with their friendships
· Four in
five (TOP2: 81%) say they are satisfied with their relationships with their
friends.
· Case-managed
Veterans under 65 (TOP2: 54%) are the least satisfied of the six strata.
· Respondents
aged 80–89 (TOP2: 94%) are the most satisfied age group, while those aged
49 and under (TOP2: 60%) are the least satisfied.

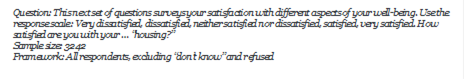
Vast majority are satisfied with housing
· Nine in
10 (TOP2: 90%) respondents say they are satisfied with their housing.
· Case-managed
Veterans under 65 (TOP2: 78%) are the least satisfied stratum.
· Indigenous
(TOP2: 84%) and visible minority (TOP2: 83%) respondents are less
satisfied than non-Indigenous (TOP2: 90%) and non-minority (TOP2:
91%) respondents.

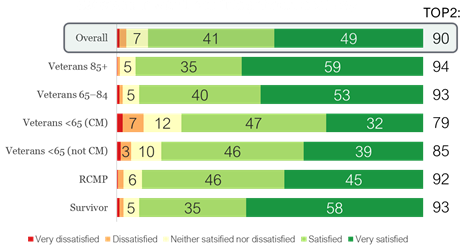
Vast majority are satisfied with their neighbourhood
· Nine in
10 (TOP2: 90%) respondents are satisfied with their neighbourhood.
· Indigenous
(TOP2: 84%) and visible minority (TOP2: 85%) respondents tend to
be less satisfied than their non-Indigenous (TOP2: 90%) and non-minority
(TOP2: 90%) counterparts.
· Case-managed
Veterans under 65 (TOP2: 79%) are the least satisfied of the strata.

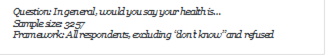
Respondents split when asked to rate their health
· Less than
a third of respondents said their health was very good or excellent (TOP2:
27%).
· More
respondents rated their health as poor or fair (BTM2: 38%).
· Older
respondents tend to rate their health better than younger respondents.
Respondents 90 and over (TOP2: 40%) are more positive than those under
40 (TOP2: 23%).
· Indigenous
respondents (TOP2: 16%) are less positive than non-Indigenous
respondents (TOP2: 28%).

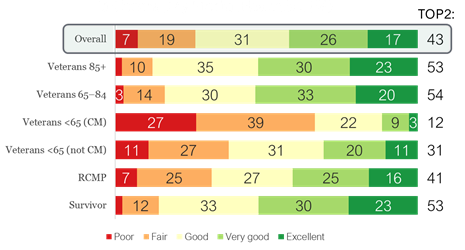
Case-managed Veterans least positive about mental health
· Two in
five (TOP2: 43%) respondents rated their mental health as very good or
excellent.
· Case-managed
Veterans under 65 are the most negative about their mental health (BTM2:
66%).
· Indigenous
respondents (TOP2: 31%) are less positive.
· There is
no noticeable drop-off from pre-COVID (TOP2: 41%) to post-COVID (TOP2:
44%).

Most agree that they have a life purpose
· Seven in
10 (TOP2: 69%) respondents agree that they have a purpose in life.
· Case-managed
Veterans under 65 (TOP2: 45%) are much less likely to agree compared to
other strata and a quarter (BTM: 25%) actually disagree.
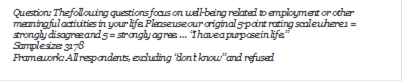
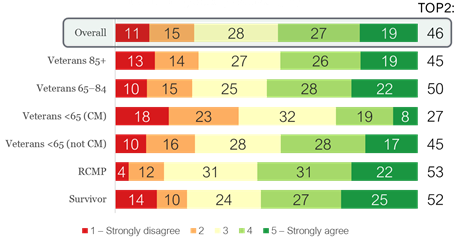
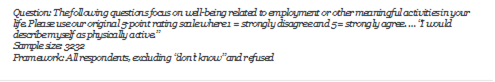
Just under half agree they are physically active
· Under
half (TOP2: 46%) of respondents agree that they are physically active.
· Only a
quarter (TOP2: 27%) of case-managed Veterans under 65 agree.
· Respondents
under 40 and over 59 tend to be more active than respondents aged
40–59.
· There is
no noticeable drop-off from pre-COVID (TOP2: 46%) to post-COVID
(TOP2: 47%).
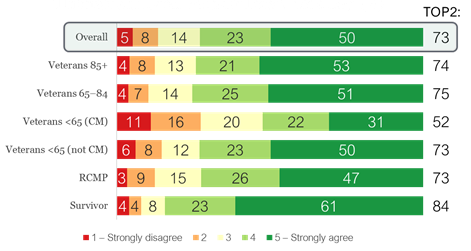
Case-managed Veterans under 65 less likely to socialize
· Three-quarters
(TOP2: 73%) of respondents agree that they interact with other people at least
once a day.
· Once
again, case-managed Veterans under 65 are the exception, with only half
(TOP2: 52%) agreeing.
· Pre-COVID
(TOP2: 73%) levels of agreement have maintained (TOP2: 73%) throughout the
pandemic.

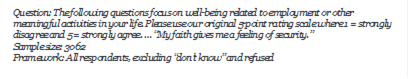
Great
variation in the helpfulness of faith
· Three in
five (TOP2: 60%) respondents agree that their faith gives them a feeling of
security.
· However,
there is great variation among strata: Veterans 85 and over (TOP2: 77%)
and Survivors (TOP2: 83%) are the most likely to agree, compared to case-managed
Veterans under 65 (TOP2: 31%) who are the least likely to agree.

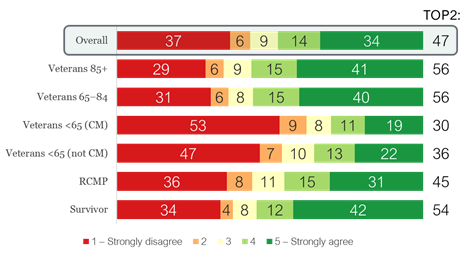
Many do not belong to a community group
· Four in
nine (BTM2: 44%) disagree that they belong to at least one community group.
· The
number is highest for case-managed Veterans under 65 (BTM2: 62%).
· Women
(TOP2: 52%) are more likely to agree than men (TOP2: 46%).

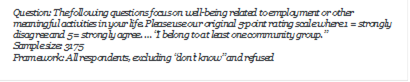
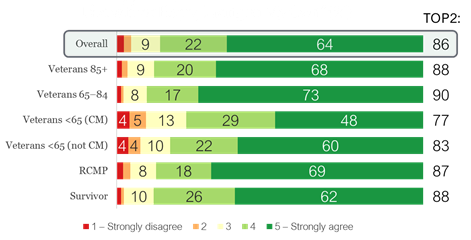
Most
are happy with their living arrangement
· Eight in
nine (TOP2: 86%) respondents agree that they are happy living with the people
they live with or living on their own.
· Respondents
under 60 (TOP2: 79%) are slightly less likely than older respondents to
agree.
· Indigenous
respondents (TOP2: 33%) more likely to agree than non-Indigenous
respondents (TOP2: 26%).
· Visible
minority respondents (TOP2: 39%) more likely to agree than non-minority respondents
(TOP2: 25%).
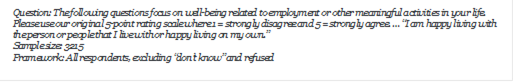

Many case-managed Veterans under 65 feel depressed
· Only one
in five (TOP2: 21%) respondents say they feel down, depressed, or hopeless.
· This
number is almost double for case-managed Veterans under 65 (TOP2: 38%).
· Visible
minorities (TOP2: 31%) are more likely than non-minorities (TOP2:
19%) to agree.

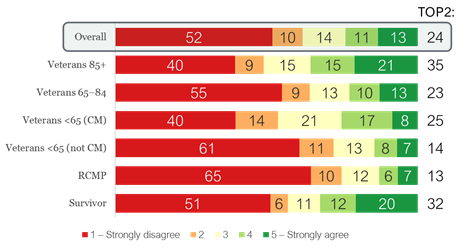
Few need help preparing meals
· A quarter
(TOP2: 24%) of respondents agree that they need help preparing meals.
· A
majority (BTM2: 62%) disagree with the statement.
· Older
respondents, especially those 90 and over (TOP2: 40%), are most likely
to agree with the statement.
· Women
(TOP2: 27%) are more likely to agree than men (TOP2: 23%).

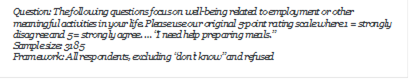
Most have savings set aside for unexpected expenses
· Three in
five (TOP2: 60%) respondents agree that they have savings set aside for an
unplanned expense.
· Case-managed
Veterans under 65 (TOP2: 50%) are the least prepared for unplanned expenses
of the six strata.

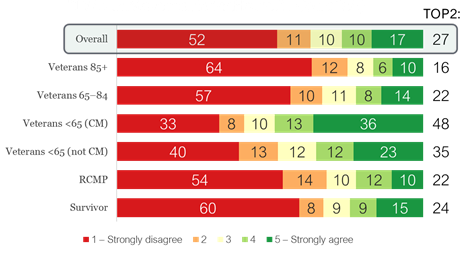
Majority would not move to a better home even if they
could
· Almost
two-thirds (BTM2: 63%) of respondents would not move to a better home even if
they could, showing that they are happy where they are.
· Case-managed
Veterans under 65 are the most likely to agree, with almost half (TOP2: 48%)
wanting to move out if they could.
· Indigenous
(TOP2: 33%) more likely to agree than non-Indigenous (TOP2: 26%)
· Visible
minority (TOP2: 39%) more likely to agree than non-minority (TOP2: 25%)

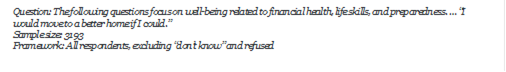
Vast majority feel they live in a safe neighbourhood
· Nine in
10 (TOP2: 89%) agree that they live in a safe neighbourhood.
· Indigenous
respondents (TOP2: 79%) are less likely to agree than non-Indigenous
respondents (TOP2: 90%).
· Visible
minorities (TOP2: 82%) are less likely to agree than non-minority
respondents (TOP2: 90%).

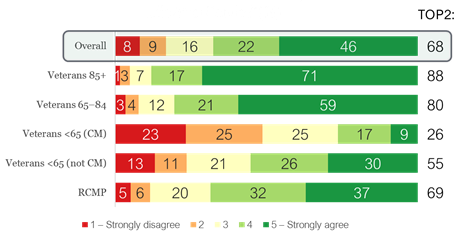
Great variance in post-service transition
· Seven in
10 (TOP2: 68%) respondents agree that they have transitioned well into life
after service.
· Only a
quarter (TOP2: 26%) of case-managed Veterans under 65 agree.
· Women
(TOP2: 62%) are less likely to agree than men (TOP2: 68%).
· Indigenous
respondents (TOP2: 49%) are less likely to agree than non-Indigenous
respondents (TOP2: 69%).
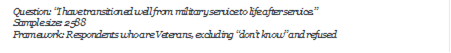
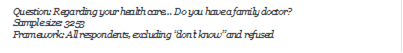
Vast majority have a family doctor
· Eight in
nine (88%) respondents say they have a family doctor.
· A quarter
of Veterans (25%) under 65 (not case-managed) do not have family doctors.
· Younger
respondents are the least likely to have a family doctor: those under 40 (38%)
and those aged 40–49 (27%) are much more likely to not have a family
doctor.

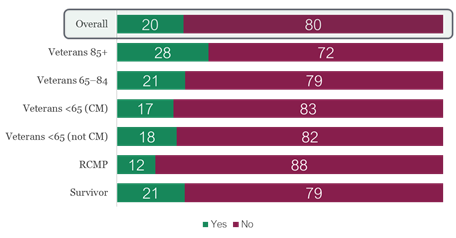
Most do not have a nurse practitioner
· Only one
in five (20%) respondents have a nurse practitioner.
· Veterans
85 and up (28%) are the most likely stratum to have a nurse practitioner.