Final Report
Prepared for Veterans Affairs Canada
Supplier Name: Phoenix SPI
Contract Number: CW2349603
Contract Value: $226,983.10 (including HST)
Award Date: 2024-02-12
Delivery Date: 2025-02-26
Registration Number: POR #129-23
This public opinion research report presents the results of a multi-mode survey of 3,842 respondents conducted by Phoenix SPI on behalf of Veterans Affairs Canada. The primary method of data collection was telephone followed by web. Those who preferred not to participate by phone or web or who requested an alternate format for accessibility reasons were sent a paper copy of the survey by mail. The fieldwork took place July 29 through September 23, 2024.
This publication may be reproduced for non-commercial purposes only. Prior written permission must be obtained from Veterans Affairs Canada. For more information on this report, please contact Veterans Affairs Canada at:
commsresearch-commsrecherche@veterans.gc.ca
Catalogue Number: V32-343/2024E-PDF
International Standard Book Number (ISBN): 978-0-660-75470-3
Related publications (registration number: POR 129-23):
Cette publication est aussi disponible en français sous le titre Recherche sur l'opinion publique: Sondage national de 2024 auprès des clients d'Anciens Combattants Canada
© His Majesty the King in Right of Canada, as represented by the Minister of Veterans Affairs, 2025.
Phoenix Strategic Perspectives Inc. (Phoenix SPI) was commissioned by Veterans Affairs Canada (VAC) to conduct the 2024 VAC National Client Survey (VNCS). This report presents the findings from the 2024 VNCS.
The purpose of the VNCS is to find out how satisfied individuals are with the department’s programs and services and how they feel about their health and well-being. The specific research objectives of the 2024 VNCS were to:
The findings will be used to increase VAC’s understanding of individuals’ experiences with the department’s programs and services and to inform future research to support the development, management and improvement of programs and services.
Phoenix SPI conducted a multi-mode survey via computer-assisted telephone interviewing (CATI) and computer-assisted web interviewing (CAWI) with Veterans, serving members of the Canadian Armed Forces (CAF), serving and retired members of the Royal Canadian Mounted Police (RCMP), and Survivors of deceased Veterans. Telephone contact was the initial and primary method of data collection. When reached by phone, individuals were given the option to complete the survey online or over the phone. Those who preferred not to participate by phone or web or who requested an alternate format for accessibility reasons were sent a paper copy of the survey by mail. A well-being protocol was in place to minimize any risk to respondents when taking part in the research. In total, 3,842 individuals completed the survey in either French or English. The phone survey averaged 30 minutes, while the online survey averaged 24 minutes. The fieldwork was conducted July 29 through September 23, 2024. Based on a sample of this size, the overall results have a maximum margin of error of ±1.6% (at the 95% confidence interval). Maximum margins of error for subsamples are larger. Maximum margins of error for subsamples are larger.
Contact with VAC over the past 12 months took place most often by phone or through My VAC Account, with just over two-thirds (68%) using the phone and nearly half (46%) using My VAC Account. Phone (49%), followed by My VAC Account (24%) are also the top two methods of interaction with VAC preferred by respondents. Thinking about their experience over the past 12 months, most respondents said it was at least somewhat easy to communicate with VAC (75%) and that VAC does a good or very good job (73%) of communicating with them in a timely manner.
Close to two-thirds (64%) of respondents said they had used My VAC Account during the past 12 months. Among those who did, a large majority described My VAC Account as a good way to do each of the following: communicate with VAC through secure messaging (92%), check the status of applications (86%), find out about VAC benefits and services (84%), and get VAC news (78%). The most commonly given reason for not using My VAC Account was lack of need (33%).
Six in 10 (61%) respondents who applied for a service or benefit in the past 12 months said the overall application process was somewhat (39%) or very (22%) easy. In addition, 79% said it was easy to understand the recent letter they received from VAC, while smaller majorities indicated that submitting the required information (66%) and finding the information needed (61%) were easy. To improve the application process, respondents suggested that VAC provide more frequent status updates (30%), simplify the forms (27%), provide access to information needed to apply (25%), and offer clearer explanations regarding decisions (23%).
Overall, respondents offered generally positive assessments of VAC service, both overall in terms of service quality, and in relation to specific aspects of service. Most notably, strong majorities had favourable impressions of VAC staff: 86% felt respected by VAC staff, 84% felt that VAC staff were knowledgeable, and 77% each agreed that VAC staff was exceptional and responsive. Areas where slightly fewer respondents offered positive assessments included wait times at service locations (72% disagreed with the statement: I waited too long to speak to someone at a VAC location) and receipt of services or benefits in a timely manner (68%).
In addition to being satisfied with VAC service, over three-quarters of respondents (78%) were satisfied with the quality of VAC’s programs and services. Looking at individual services and programs, 75% of respondents who have a case plan expressed satisfaction with Case Management Services and 67% said their life is improved as a result of Case Management Services. Large majorities of respondents in receipt of Veterans Independence Program (VIP) benefits rely on these services to remain in their home and community (94%) and have found service providers to help with VIP services (86%).
Almost eight in 10 respondents in the Treatment Benefits Program were satisfied with the program and said the program meets their needs (79%). Among those in the Disability Benefits Program, 70% were satisfied with the program, 79% agreed the benefits recognize their service-related disability, and 67% felt the benefits compensate them for the effects of their service-related disability. Impressions of the Rehabilitation Program were also favourable, with 69% agreeing that their participation in the program has helped improve their quality of life and has been beneficial to their family or other people who support them.
The majority of respondents expressed satisfaction with various aspects of their lives and their overall well-being. Respondents were most likely to be satisfied with their housing (89%) and neighbourhood (88%), followed by their relationships with family members (82%) and friends (80%). Nearly three-quarters (74%) expressed satisfaction with their financial situation and life in general. Over two-thirds (70%) expressed satisfaction with their main job or activity, while approximately two-thirds were satisfied with their leisure activities (67%) and their overall well-being (65%).
While respondents are generally satisfied with VAC service and programs, satisfaction levels and impressions varied across the different groups of respondents. The strongest and most consistent pattern observed was that Veterans between the ages of 19 and 64, in particular case managed Veterans, tended to report lower levels of satisfaction and less positive impressions across the issues explored in the survey. In contrast, Veterans aged 85+ and Survivors were often the most likely to express satisfaction with service or offer a favourable impression of VAC and its staff. Respondents from racialized population groups tended to be less satisfied with the department’s service, while Indigenous respondents offered less favourable assessments of aspects of the application process. Both groups of respondents provided less favourable ratings of their overall well-being in some areas.
In addition, this year, respondents were more likely to rate their satisfaction with VAC services and programs as “moderate” rather than “strong”. This is a change from 2022 when respondents often chose the highest ratings, such as “very satisfied” or “strongly agree”, instead of “satisfied” or “agree”. In other words, in 2022, respondents were not just satisfied—they were very satisfied with their service experience. In 2024, however, this was not the case. Survey responses were more moderate, suggesting there is room for improvement to increase the intensity of respondents' satisfaction.
I hereby certify as a Senior Officer of Phoenix SPI that the deliverables fully comply with the Government of Canada political neutrality requirements outlined in the Communications Policy of the Government of Canada and the Procedures for Planning and Contracting Public Opinion Research. Specifically, the deliverables do not contain any reference to electoral voting intentions, political party preferences, standings with the electorate, or ratings of the performance of a political party or its leader.
(original signed by)
Alethea Woods
President
Phoenix Strategic Perspectives Inc.
The contract value was $226,983.10 (including HST).
Veterans Affairs Canada (VAC) commissioned Phoenix Strategic Perspectives Inc. (Phoenix SPI) to conduct the 2024 VAC National Client Survey (VNCS).
Veterans Affairs Canada (VAC) provides essential benefits and services to Veterans and still-serving members of the Canadian Armed Forces (CAF), still-serving and retired Royal Canadian Mounted Police (RCMP), and Survivors of deceased Veterans. In response to the government-wide service improvement initiative approved by the Treasury Board Secretariat (TBS) in August 2000, VAC has been conducting satisfaction surveys since 2001. This year marks the ninth iteration of the VAC National Client Survey (VNCS), with follow up surveys conducted in 2003, 2005, 2007, 2010, 2017, 2020, and 2022.
The purpose of the VNCS is to find out how satisfied individuals are with the department’s service and how they feel about their health and well-being. The overall objective is to provide VAC with a deeper understanding of the population they serve and their needs. As such, the specific research objectives of the 2024 VAC National Client Survey were to:
The findings from the research will be used to increase VAC’s understanding of individuals’ experiences with the department’s programs and services and to inform future research to support the development, management and improvement of programs and services.
Phoenix SPI conducted a multi-mode survey via computer-assisted telephone interviewing (CATI) and computer-assisted web interviewing (CAWI) with Veterans and still-serving members of the CAF, still-serving and retired RCMP, and Survivors of deceased Veterans. Individuals were first contacted by telephone. During the brief recruitment interview, they were asked if they wanted to complete the survey over the phone (at the time of the call) or online. Those who chose to complete the survey online were asked to provide their email address so that the secure URL to access the online survey could be sent to them. Those who preferred not to participate by phone or web or who requested an alternate format for accessibility reasons were sent a paper copy of the survey by mail.
Eligible individuals for this research were those aged 19 and older in receipt of benefits or those who had applied for a benefit in the previous 12 months. This included individuals who had been declined for a benefit or who were still awaiting a decision. In total, 3,842 individuals completed the survey in either French or English: 2,902 did so by phone, 908 by web, and 32 by mail. The table below presents the distribution of survey responses by eligible individuals and mode of completion:
| Type of respondent | Phone | Online | Total | |
|---|---|---|---|---|
| Veterans 85+ | 410 | 79 | 15 | 504 |
| Veterans 65-84 | 573 | 100 | 6 | 679 |
| Veterans 19-64 (case managed)* | 505 | 174 | 1 | 680 |
| Veterans 19-64 (not case managed)* | 650 | 319 | 3 | 972 |
| RCMP** | 288 | 115 | 1 | 404 |
| Survivors | 476 | 121 | 6 | 603 |
| Total | 2,902 | 908 | 32 | 3,842 |
*This includes Veterans and still-serving CAF members.
** This includes still-serving and retired members.
The phone survey averaged 30 minutes to complete, while the online survey averaged 24 minutes. The fieldwork was conducted July 29 through September 23, 2024.
The survey data were weighted by age, sex, and type of respondent based on the population parameters (as provided by VAC). Based on a sample of this size, the overall results have a maximum margin of error of ±1.6% (at the 95% confidence interval). Maximum margins of error for subsamples are larger, and are as follows:
| Type of respondent | Sample Size | Margin of error |
|---|---|---|
| Veterans 85+ | 504 | ±4.4% |
| Veterans 65-84 | 679 | ±3.8% |
| Veterans 19-64 (case managed)* | 680 | ±3.8% |
| Veterans 19-64 (not case managed)* | 972 | ±3.1% |
| RCMP** | 404 | ±4.9% |
| Survivors | 603 | ±4.0% |
*This includes Veterans and still-serving CAF members.
** This includes still-serving and retired members.
For a more complete description of the methodology, refer to the Technical Information in the Appendix.
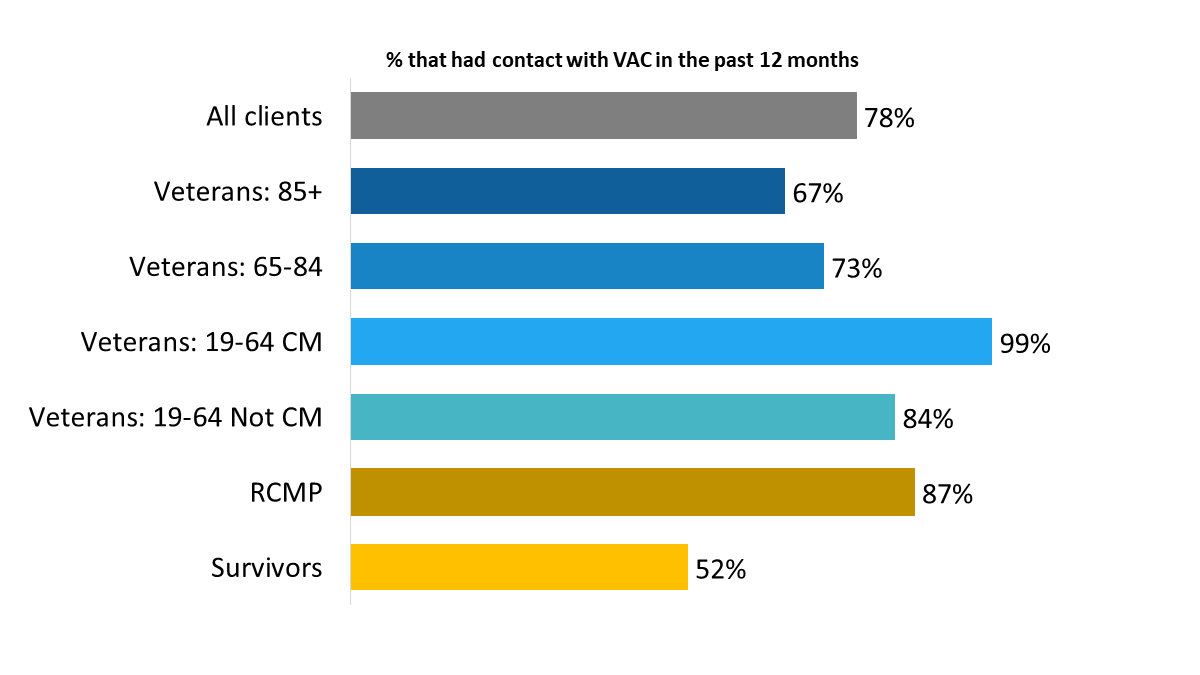
Just over three-quarters of survey respondents (78%; up from 67% in 2022) reported having had contact with the organization in the past 12 months, whether initiated by themselves or by VAC. Case managed Veterans aged 19 to 64 (99%) were the most likely to have had contact with VAC and Survivors (52%) were the least likely to report any contact with the department.
| Survivors | 52% |
| RCMP | 87% |
| Veterans: 19-64 Not CM | 84% |
| Veterans: 19-64 CM | 99% |
| Veterans: 65-84 | 73% |
| Veterans: 85+ | 67% |
| All clients | 78% |
OP_Q01. During the past 12 months, did you have any contact with VAC? Base: n=3,768 all respondents, excluding “don’t know” and refused.
The following subgroups of respondents were more likely to have had contact with VAC in the past 12 months:
Contact with VAC over the past 12 months took place most often by phone or through My VAC Account, just over two-thirds (68%; down from 79% in 2022) using the phone and nearly half (46%; down from 66% in 2022) using My VAC Account.
Other methods of contact used with some frequency included email (24%) and letter (16%). In addition, nearly one in 10 have been in contact with VAC in person, either at a VAC service location (7%) or at their home (2%). Infrequently used methods of contact (1% or less) included video conferencing, online (general), and via a third-party (i.e. case manager, health care worker, person at the Legion).
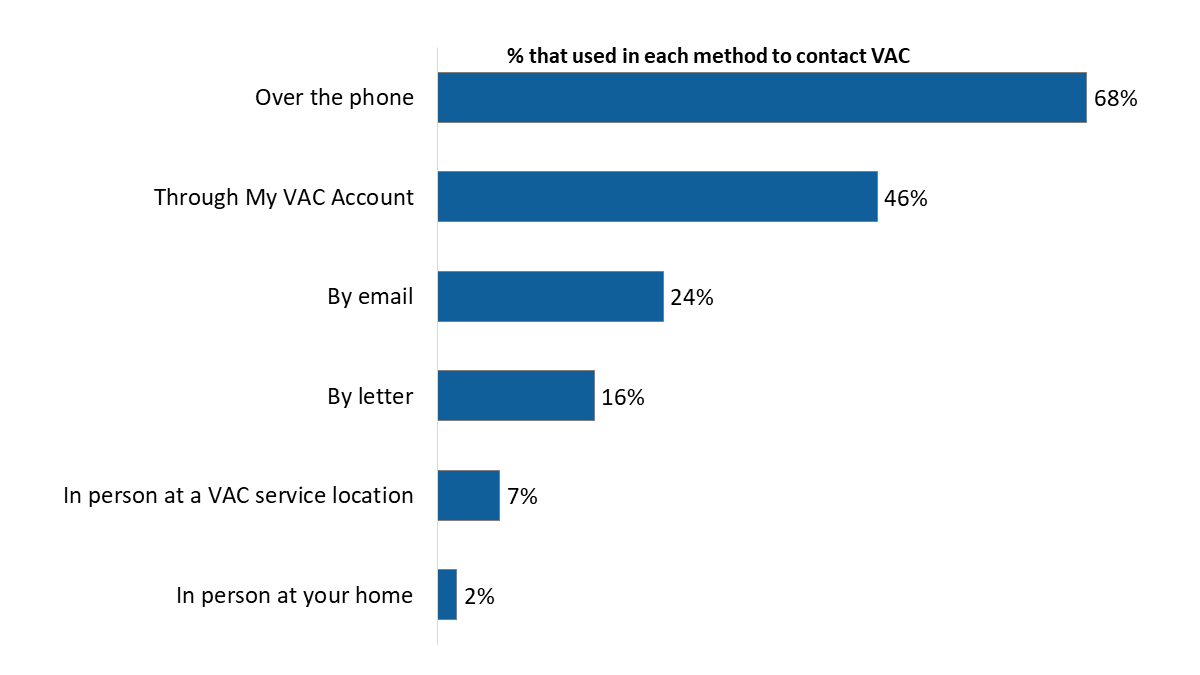
| Service channel used | |
| In person at your home | 2% |
| In person at a VAC service location | 7% |
| By letter | 16% |
| By email | 24% |
| Through My VAC Account | 46% |
| Over the phone | 68% |
OP_Q02. How have you been in contact with VAC in the past 12 months? [Multiple response accepted] Base: n=2,899; respondents who contacted VAC in the Last 12 months, excluding “don’t know” and refused.
Case managed Veterans aged 19 to 64 (83%) were the most likely to have had contact with VAC by phone while members of the RMCP (54%) were the least likely to report having been in contact with VAC by phone.
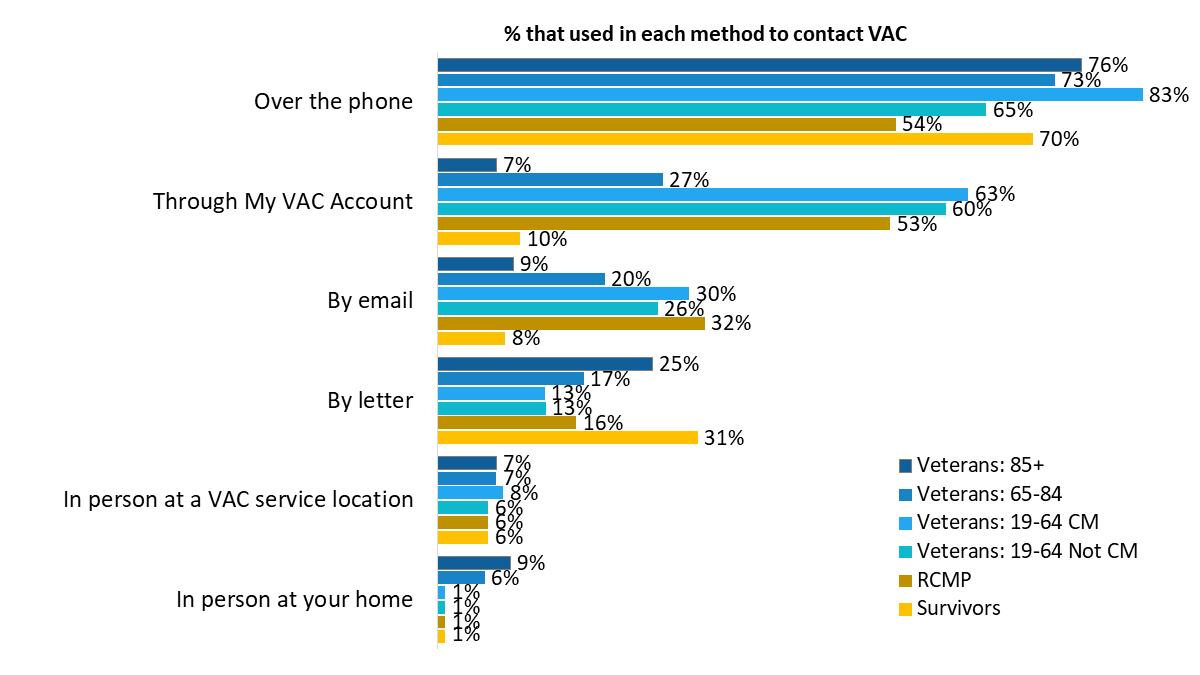
| Veterans: 85+ | Veterans: 65-84 | Veterans: 19-64 CM | Veterans: 19-64 Not CM | RCMP | Survivors | |
| Over the phone | 76% | 73% | 83% | 65% | 54% | 70% |
| Through My VAC Account | 7% | 27% | 63% | 60% | 53% | 10% |
| By email | 9% | 20% | 30% | 26% | 32% | 8% |
| By letter | 25% | 17% | 13% | 13% | 16% | 31% |
| In person at a VAC service location | 7% | 7% | 8% | 6% | 6% | 6% |
| In person at your home | 9% | 6% | 1% | 1% | 1% | 1% |
| Videoconference | 6% | 1% | ||||
| Other | 5% | 3% | 7% | 2% | 1% | 3% |
OP_Q02. How have you been in contact with VAC in the past 12 months? [Multiple response accepted] Base: n=2,899; respondents who contacted VAC in the Last 12 months, excluding “don’t know” and refused.
The following subgroup differences are noteworthy:
Telephone contact leads the way as the preferred way of interacting with VAC, with nearly half of survey respondents (49%) saying they prefer to interact with the department in this way. This was followed at a distance by My VAC Account, preferred by approximately one-quarter (24%) of respondents. Smaller proportions said they prefer contact by email (12%), letter (7%), and in person at a VAC service location (5%). Service channel preferences have not changed over time. The relative priority assigned to each method in 2024 is the same as 2022.
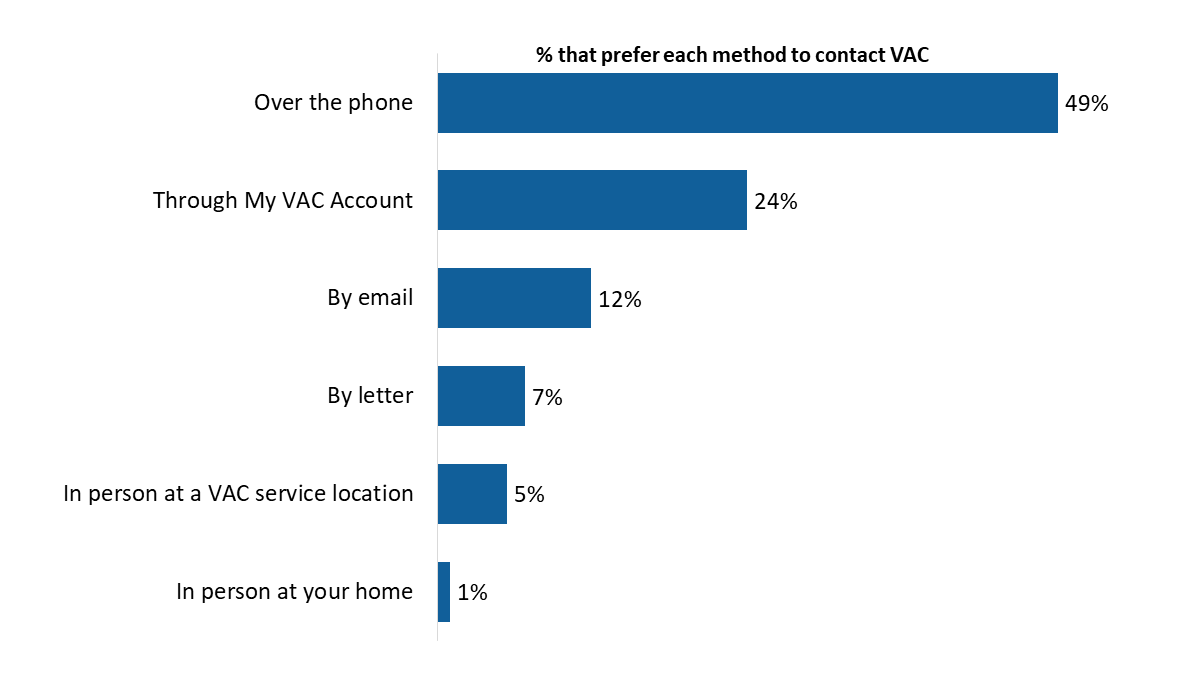
| In person at your home | 1% |
| In person at a VAC service location | 5% |
| By letter | 7% |
| By email | 12% |
| Through My VAC Account | 24% |
| Over the phone | 49% |
OP_Q04. In general, how do you prefer to interact with VAC? [Multiple response accepted] Base: all respondents; n=3,712, excluding “don’t know” and refused.
Preferred methods of interaction identified infrequently (1% or less) included through video conferencing, through a case manager, and online in general.
Veterans aged 85+ (65%), followed by Survivors (63%) were the most likely to prefer telephone. My VAC Account was more likely to be preferred by members of the RCMP (38%), followed by Veterans 19-64 years of age, both those who are case managed (30%) and those who are not (34%). Written correspondence (i.e., a letter) is the preferred method of interacting with VAC for Survivors (21%) and Veterans aged 85+ (14%).
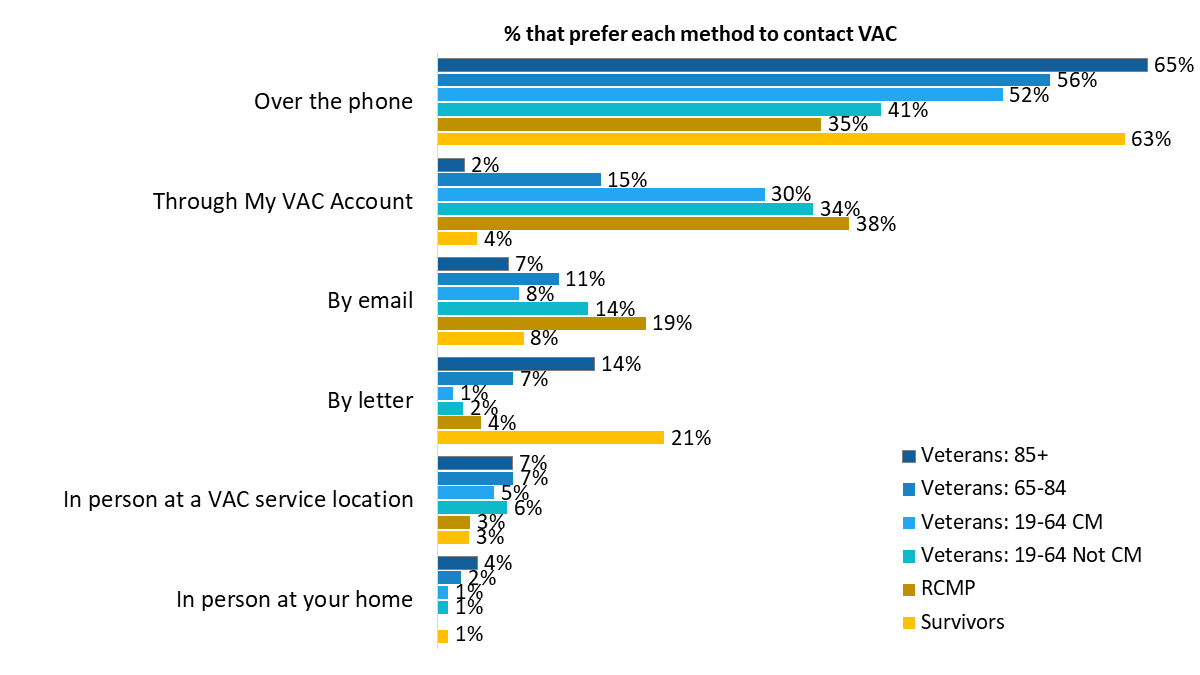
| Veterans: 85+ | Veterans: 65-84 | Veterans: 19-64 CM | Veterans: 19-64 Not CM | RCMP | Survivors | |
| Over the phone | 65% | 56% | 52% | 41% | 35% | 63% |
| Through My VAC Account | 2% | 15% | 30% | 34% | 38% | 4% |
| By email | 7% | 11% | 8% | 14% | 19% | 8% |
| By letter | 14% | 7% | 1% | 2% | 4% | 21% |
| In person at a VAC service location | 7% | 7% | 5% | 6% | 3% | 3% |
| In person at your home | 4% | 2% | 1% | 1% | 1% | |
| Videoconference | 0% | 2% | 0% | |||
| Other | 1% | 0% | 1% | 1% | 0% |
OP_Q04. In general, how do you prefer to interact with VAC? [Multiple response accepted] Base: all respondents; n=3,712, excluding “don’t know” and refused.
The following subgroup differences are noteworthy:
Just over half (52%) of respondents reported applying for a service or benefit during the past 12 months. Case managed Veterans aged 19 to 64 (81%) were the most likely to have applied for a service or benefit while Survivors (20%) were the least likely to have done so.
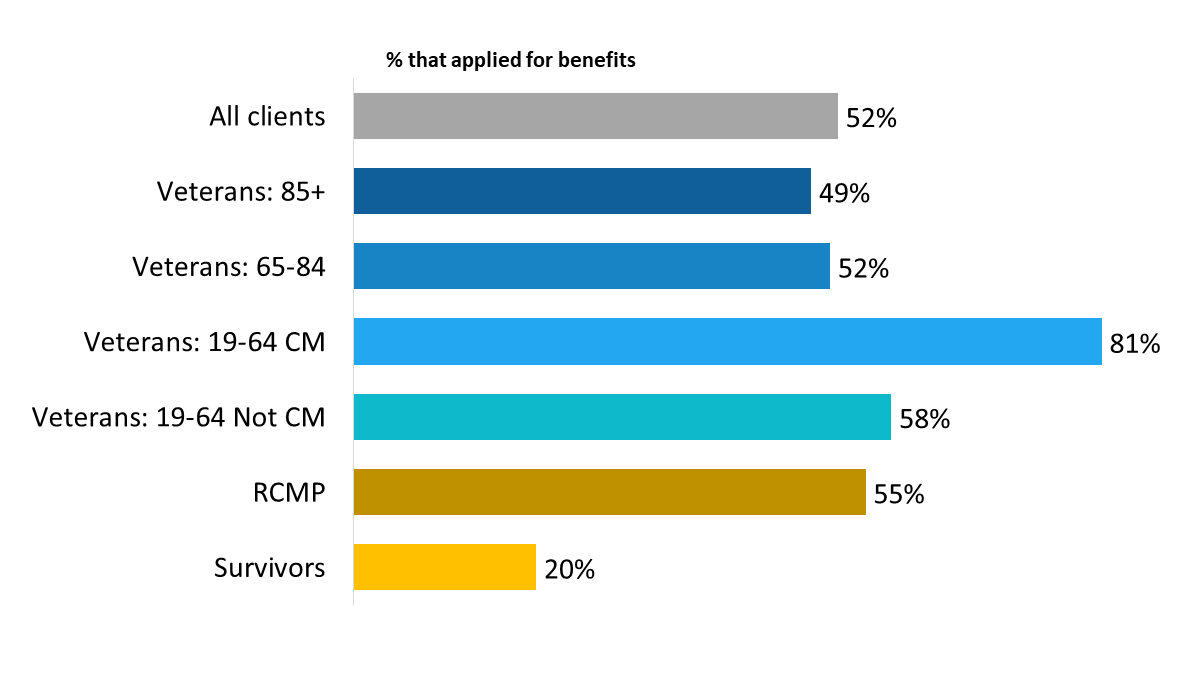
| Survivors | 20% |
| RCMP | 55% |
| Veterans: 19-64 Not CM | 58% |
| Veterans: 19-64 CM | 81% |
| Veterans: 65-84 | 52% |
| Veterans: 85+ | 49% |
| All clients | 52% |
OP_Q05. During the past 12 months, did you apply for a service or benefit? Base: all respondents; n=3,724, excluding “don’t know” and refused.
Veterans (59% compared to 36% of those who are not Veterans) and those released from service between 2019 and 2024 (74% versus 50% of those released between 2014 and 2018) were also more likely to have applied for a service or benefit.
Nearly three-quarters (74%) of respondents said that they received a letter from VAC over the past 12 months. Case managed Veterans aged 19 to 64 (90%), followed by members of the RCMP (83%) were the most likely to have received a letter, while Survivors (63%) were among those least likely to have received one.
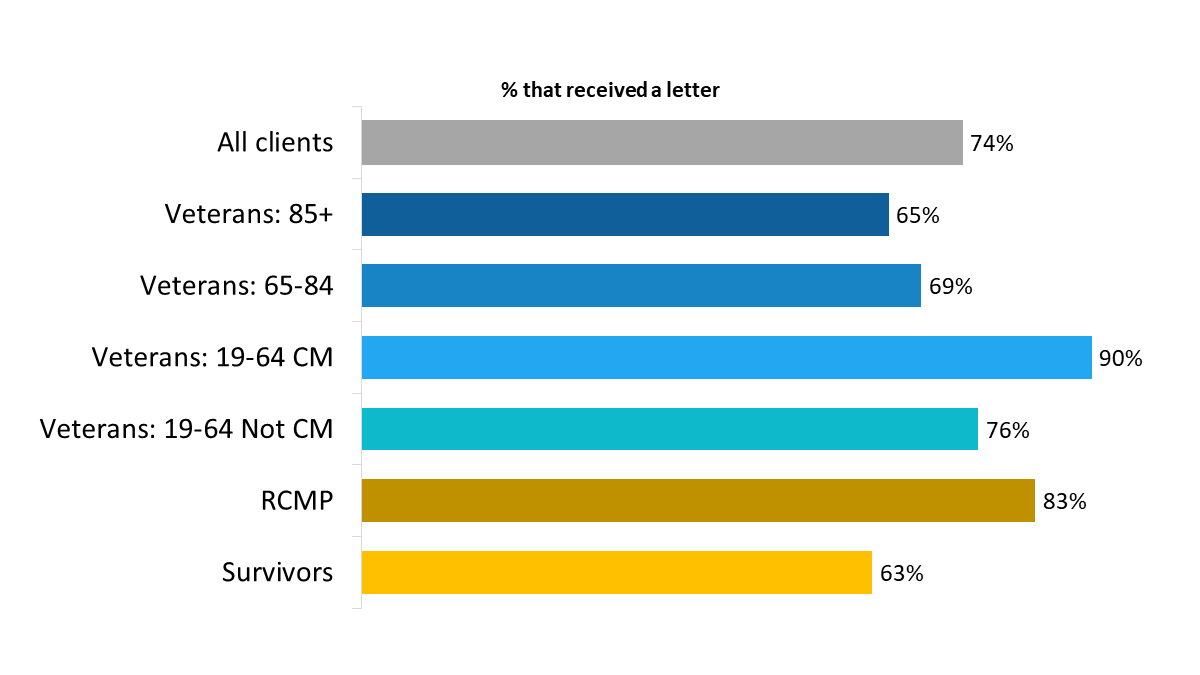
| Survivors | 63% |
| RCMP | 83% |
| Veterans: 19-64 Not CM | 76% |
| Veterans: 19-64 CM | 90% |
| Veterans: 65-84 | 69% |
| Veterans: 85+ | 65% |
| All clients | 74% |
OP_Q07. During the past 12 months, did you receive a letter from VAC? Base: all respondents; n=3,607, excluding “don’t know” and refused.
Women Veterans (80% compared to 74% of men who are Veterans), Indigenous respondents (83% compared to 74% of non-Indigenous respondents), and those released from service between 2019 and 2024 (87% versus 72% of those released between 2014 and 2018) were more likely to have received a letter during the past 12 months.
Thinking about their experience over the past 12 months, respondents were asked how easy or difficult was it to communicate with VAC. In response, three-quarters (75%) said it was at least somewhat easy, with close to half (45%) saying it was very easy. Of the one-quarter of respondents who did not describe the process as easy, 10% described it as neither difficult nor easy, and 16% as at least somewhat difficult. Perceptions of communicating with VAC have not changed since 2022, when 71% of respondents agreed that communication with VAC has been easy.
Veterans between the ages of 19 and 64 (67% of those case managed and 69% of those not case managed) were less likely than other groups to have found it easy to communicate with VAC.
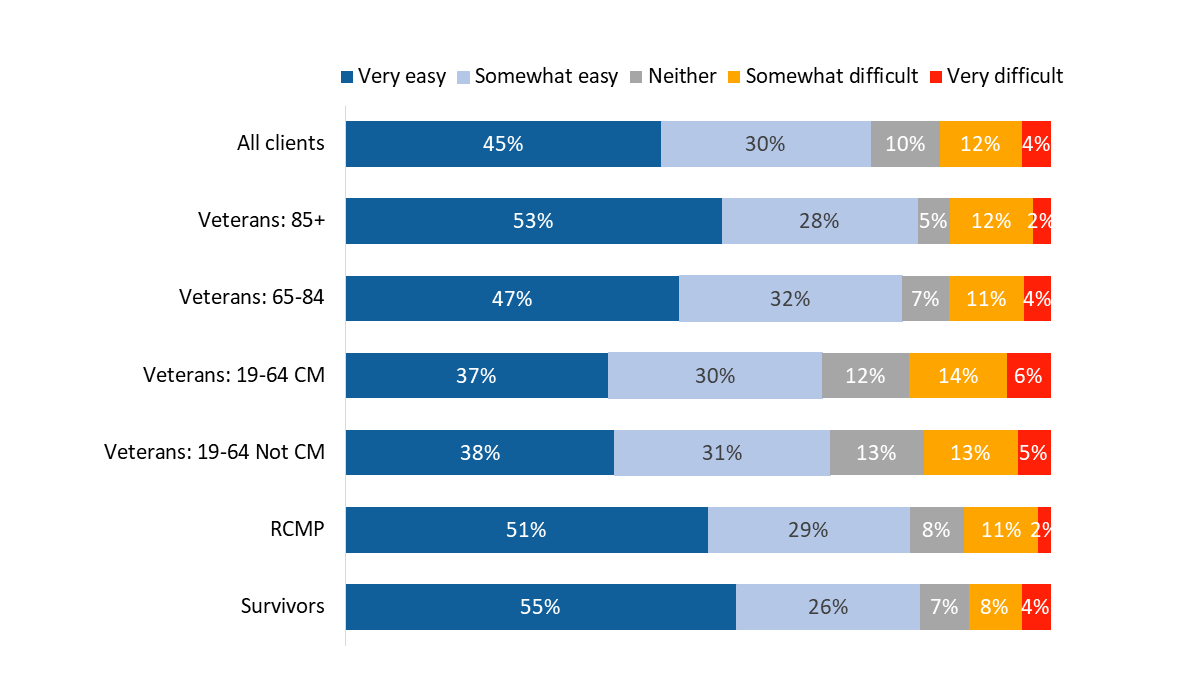
| Very easy | Somewhat easy | Neither | Somewhat difficult | Very difficult | |
| Survivors | 55% | 26% | 7% | 8% | 4% |
| RCMP | 51% | 29% | 8% | 11% | 2% |
| Veterans: 19-64 Not CM | 38% | 31% | 13% | 13% | 5% |
| Veterans: 19-64 CM | 37% | 30% | 12% | 14% | 6% |
| Veterans: 65-84 | 47% | 32% | 7% | 11% | 4% |
| Veterans: 85+ | 53% | 28% | 5% | 12% | 2% |
| All clients | 45% | 30% | 10% | 12% | 4% |
CO_Q01. Thinking about your experience with VAC over the past 12 months, how easy or difficult was it to communicate with VAC? Base: n=3,572; all respondents, excluding “don’t know” and refused.
Those released from service between 2019 and 2024 (70%) were less likely than those released between 2014 and 2018 (76%) to say it was somewhat or very easy to communicate with VAC. Indigenous respondents (36%) were less likely than non-Indigenous respondents (46%) to find it very easy to communicate with the department.
Nearly three-quarters of respondents (73%) assessed VAC’s ability to communicate in a timely manner positively (41% described it as good and 32% as very good). The remaining respondents were evenly divided between those describing VAC’s ability in this regard as neither poor nor good and those describing it as poor (13% each). Respondents’ views on the timeliness of VAC’s communication have not changed in any significant way since 2022, when 68% agreed that VAC communicated with them in a timely manner.
Veterans between the ages of 19 and 64 (64%) were less likely than other respondents to provide a positive assessment of VAC’s ability to communicate in a timely manner, while Survivors (89%) and Veterans aged 85+ (89%) were the most likely to do so.
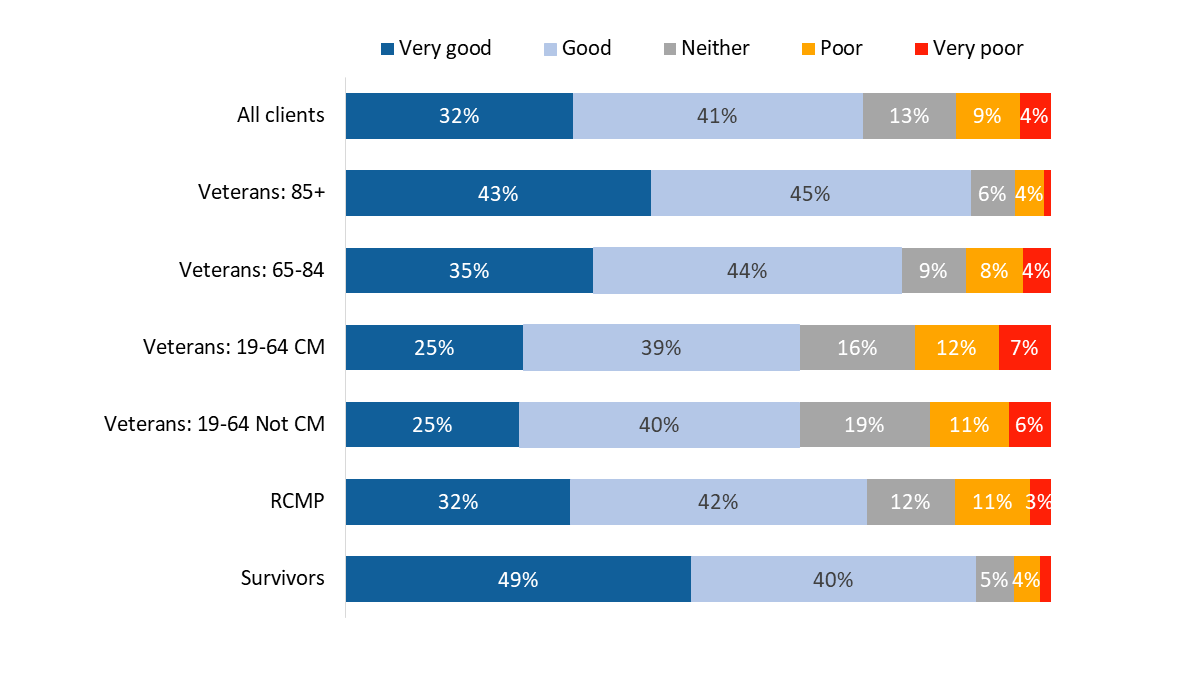
| Very good | Good | Neither | Poor | Very poor | |
| Survivors | 49% | 40% | 5% | 4% | 2% |
| RCMP | 32% | 42% | 12% | 11% | 3% |
| Veterans: 19-64 Not CM | 25% | 40% | 19% | 11% | 6% |
| Veterans: 19-64 CM | 25% | 39% | 16% | 12% | 7% |
| Veterans: 65-84 | 35% | 44% | 9% | 8% | 4% |
| Veterans: 85+ | 43% | 45% | 6% | 4% | 1% |
| All clients | 32% | 41% | 13% | 9% | 4% |
*Values of 2% or less are not displayed in the graph.
CO_Q02. How would you rate VAC’s ability to communicate in a timely manner? Base: all respondents; n=3,695, excluding “don’t know” and “refused”.
Those who are not Veterans (82% versus 70% of Veterans) and those released from service between 2014 and 2018 (75% versus 65% of those released between 2019 and 2024) were more likely to provide a positive assessment of VAC’s ability to communicate in a timely manner.
Consistent with the 2022 VNCS, nearly two-thirds (64%) of respondents said they have used My VAC Account during the past 12 months. Among those who did (n=2,355), a large majority described My VAC Account as a good way to do each of the following: communicate with VAC through secure messaging (92%), check the status of applications (86%), find out about VAC benefits and services (84%), and get VAC news (78%).
As depicted in Figure 10, there are differences in perceptions by type of respondent, although most of these differences are not statistically significant. Differences that are statistically significant include the following:
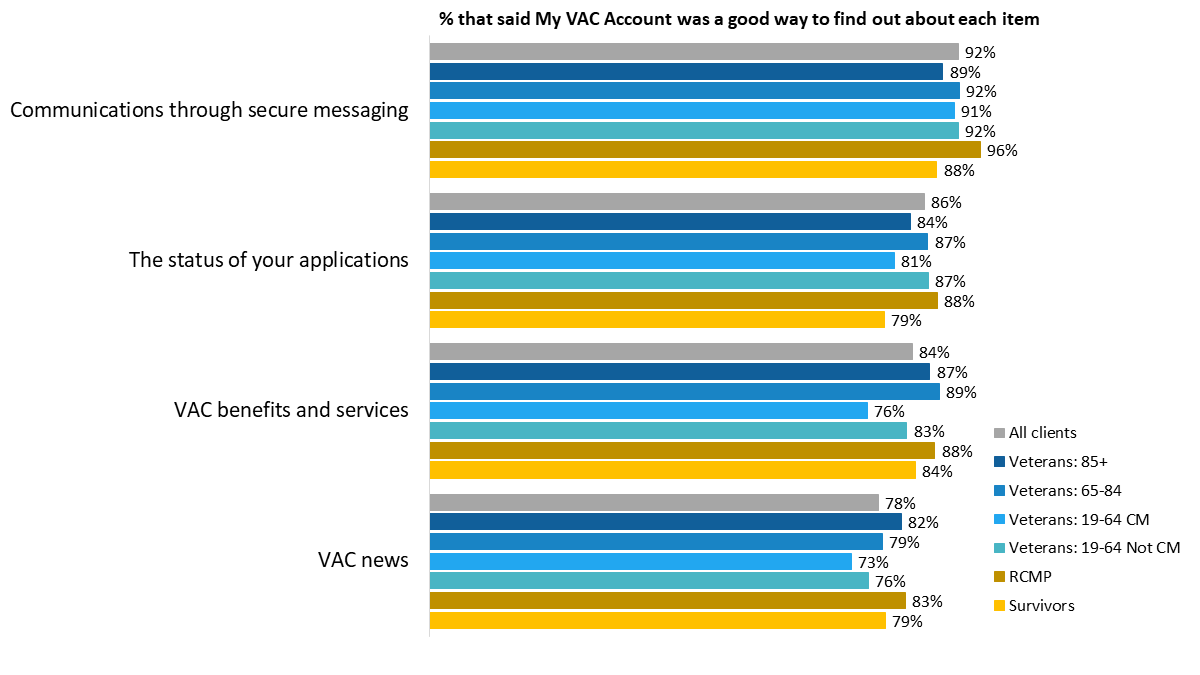
| All clients | Veterans: 85+ | Veterans: 65-84 | Veterans: 19-64 CM | Veterans: 19-64 Not CM | RCMP | Survivors | |
| VAC news | 78% | 82% | 79% | 73% | 76% | 83% | 79% |
| VAC benefits and services | 84% | 87% | 89% | 76% | 83% | 88% | 84% |
| The status of your applications | 86% | 84% | 87% | 81% | 87% | 88% | 79% |
| Communications through secure messaging | 92% | 89% | 92% | 91% | 92% | 96% | 88% |
CO_Q06_1-4. When you used My VAC Account, was it a good way to find out about….? Base: n=1,844 to 2,174; respondents who used My VAC Account in the last 12 months, excluding “don’t know” and “refused”.
Those who are not Veterans were more likely than Veterans to say that My VAC Account is a good way to: find out about VAC benefits and services (87% versus 83% of Veterans), get VAC news (82% versus 76%), and communicate securely with VAC (95% versus 92%).
Individuals who have not used My VAC Account in the past 12 months (n=1,317) were asked why they do not use this service. The most commonly given reason, identified by one-third of respondents, was lack of need (33%; up from 21% in 2022). Following this, approximately two in 10 mentioned the perceived complexity of the technology (21%) and their preference for traditional methods (18%).
Additional reasons offered for not using My VAC Account included lack of access to a computer or the internet (12%), lack of awareness about the service until now (9%), not being registered for the service (8%), lack of interest (6%), lack of clarity about the advantages of the service (5%), and losing one’s password (3%). All other reasons were mentioned by very small numbers and included, for example, security and privacy concerns, vision impairment or another disability, and loss of one’s identification, among others.
One noteworthy change since 2022 is the proportion of respondents who said they did not know about My VAC Account. In 2022, 24% of those who did not use My VAC Account attributed this to not knowing about the service. This year, only 9% of respondents said they did not know about My VAC Account until they were asked to participate in the survey.
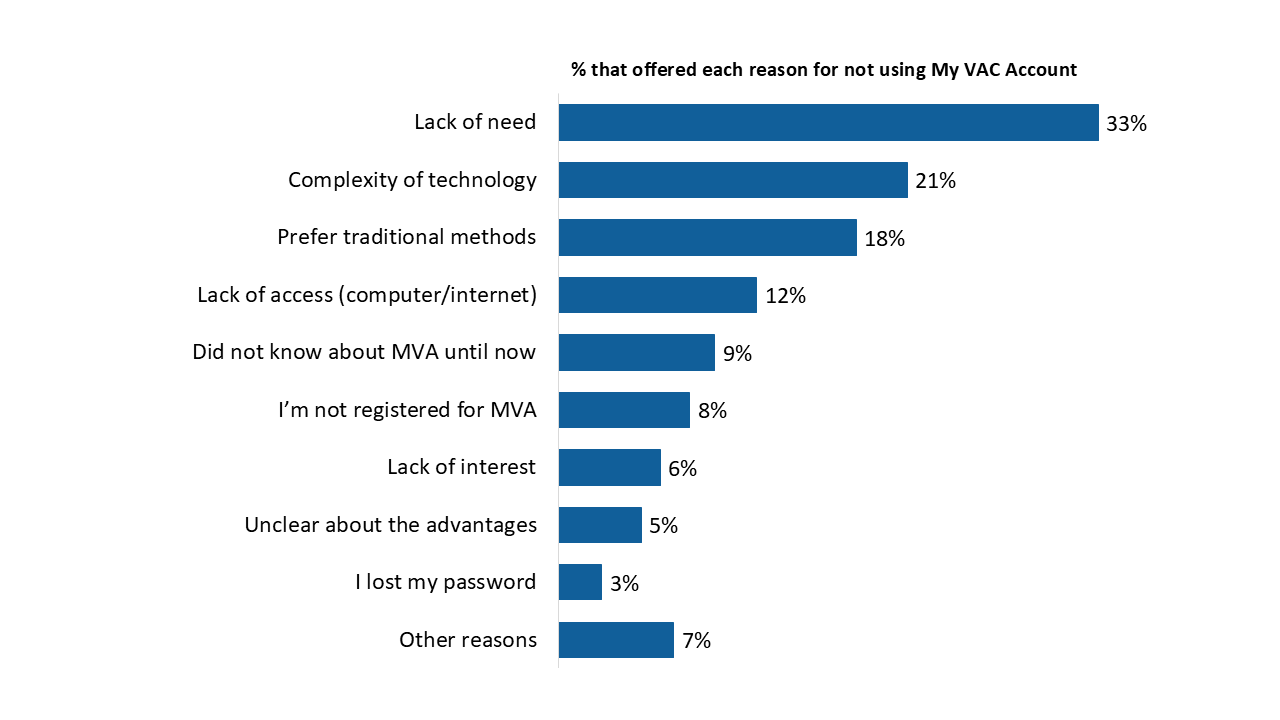
| Reason | |
| Other reasons | 7% |
| I lost my password | 3% |
| Unclear about the advantages | 5% |
| Lack of interest | 6% |
| I’m not registered for MVA | 8% |
| Did not know about MVA until now | 9% |
| Lack of access (computer/internet) | 12% |
| Prefer traditional methods | 18% |
| Complexity of technology | 21% |
| Lack of need | 33% |
CO_Q07. Why don't you use My VAC Account? Base: n=1,317; respondents who have used MyVAC in the last 12 months, excluding “don’t know” and “refused”.
The reasons for not using My VAC Account cannot be presented by type of respondent due to small counts.
The questions in this section were asked of individuals who applied for a service or benefit in the past 12 months. This included n=1,990 individuals or 52% of respondents.
The majority of respondents who applied for a service or benefit in the past 12 months said the overall application process was somewhat (39%) or very (22%) easy. Conversely, just over one-quarter (27%) considered the process somewhat or very difficult. The rest (12%) were neutral, saying that the process was neither easy nor difficult.
Veterans between the ages of 19 and 64 who are case managed were less likely than others to view the application process as somewhat or very easy (53%, compared to 72% of Survivors and 70% of Veterans aged 65+).
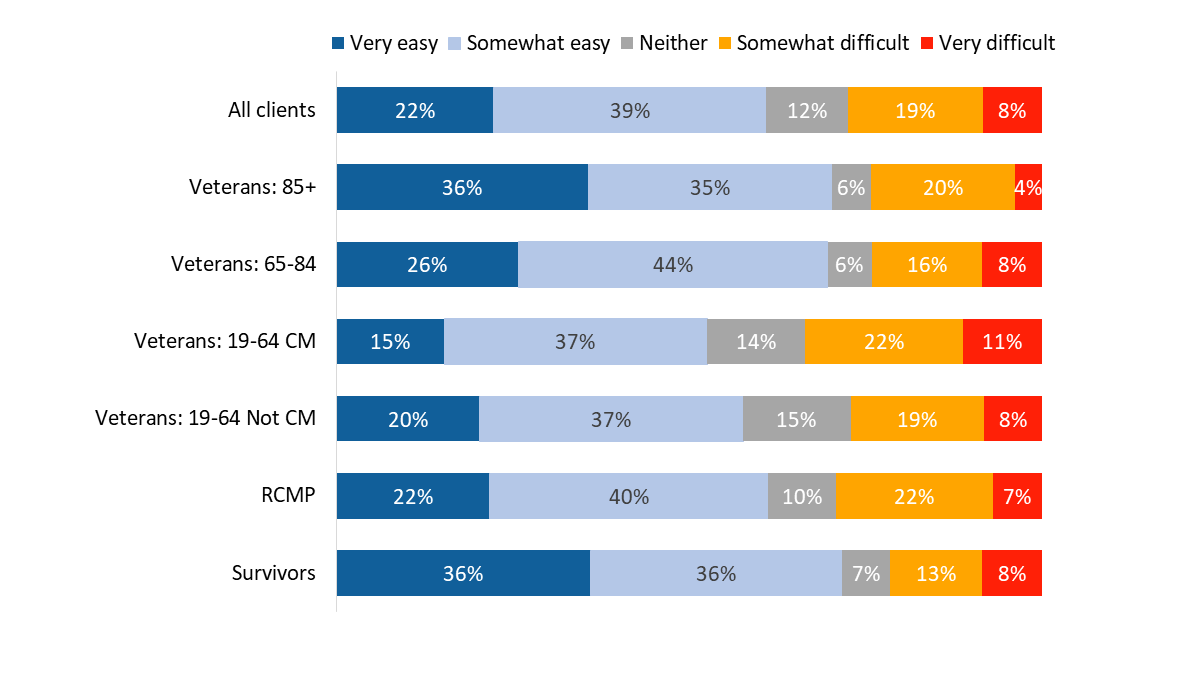
| Very easy | Somewhat easy | Neither | Somewhat difficult | Very difficult | |
| Survivors | 36% | 36% | 7% | 13% | 8% |
| RCMP | 22% | 40% | 10% | 22% | 7% |
| Veterans: 19-64 Not CM | 20% | 37% | 15% | 19% | 8% |
| Veterans: 19-64 CM | 15% | 37% | 14% | 22% | 11% |
| Veterans: 65-84 | 26% | 44% | 6% | 16% | 8% |
| Veterans: 85+ | 36% | 35% | 6% | 20% | 4% |
| All clients | 22% | 39% | 12% | 19% | 8% |
XP_Q02. How easy or difficult was the overall application process? Base: n=1,937; respondents who applied for a service or benefit, excluding “don’t know” and “refused”.
Indigenous respondents (47%) were less likely than non-Indigenous respondents (62%) to find the overall application process somewhat or very easy.
When asked to rate the ease or difficulty of aspects of the application process, respondents who had applied for a service or benefit in the past 12 months generally found these aspects of the process to be somewhat or very easy.
As Figure 13 shows, nearly eight in 10 (79%) respondents said it was easy to understand the recent letter they received from VAC, including 41% who said it was very easy. In 2022, a greater proportion of respondents (55%) found it very easy to understand VAC’s most recent letter.
Smaller majorities indicated that submitting the required information (66%) and finding the information needed (61%) were easy, though more respondents found these tasks to be “somewhat” rather than “very” easy to complete.

| Very easy | Somewhat easy | Neither difficult nor easy | Somewhat difficult | Very difficult | |
| Finding the required information | 22% | 39% | 11% | 20% | 8% |
| Submitting the required information | 27% | 39% | 11% | 16% | 6% |
| Understanding the most recent letter | 41% | 38% | 9% | 10% | 3% |
XP_Q01-3, CO_Q03. How easy or difficult was: …? Base: n= 1,869-1,924; respondents who applied for a service or benefit, excluding “don’t know” and “refused”.
Case managed Veterans aged 19-64 (69%) were less likely than other respondents to have found it easy to understand a recent letter they received in relation to an application.

| Survivors | 84% |
| RCMP | 83% |
| Veterans: 19-64 Not CM | 75% |
| Veterans: 19-64 CM | 69% |
| Veterans: 65-84 | 86% |
| Veterans: 85+ | 87% |
| All clients | 78% |
XP_Q03. How easy or difficult was: Understanding the most recent letter you received from VAC? Base: n=1,869; respondents who applied for a service or benefit, excluding “don’t know” and “refused”.
Those who are not Veterans (83% versus 77% of Veterans) and those released from service between 2014 and 2018 (81% versus 73% of those released between 2019 and 2024) were more likely to say it was easy to understand the most recent letter they received from VAC. Indigenous respondents (69%) were less likely than non-Indigenous respondents (80%) to find this easy.
Survivors (78%) and Veterans aged 85+ (77%) were more likely than other Veterans (68% of those aged 65-84, 64% of non-case managed Veterans, and 62% of case managed Veterans) to feel that it was somewhat or very easy to submit the required information during the application process for a service or benefit.
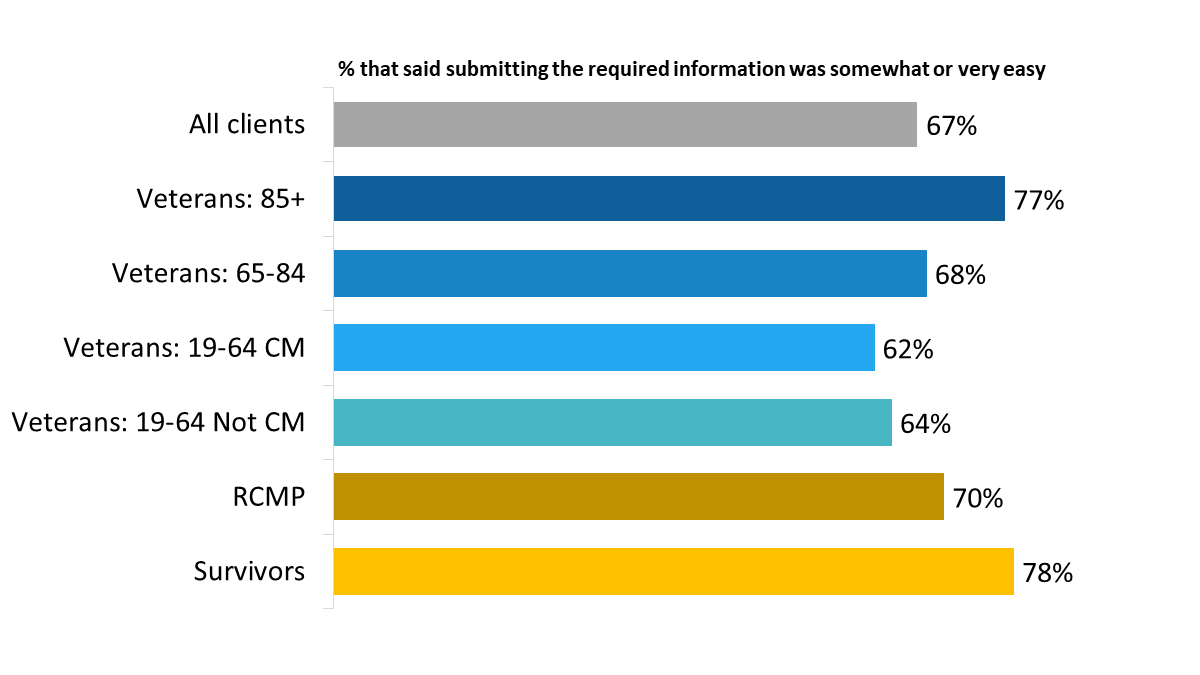
| Survivors | 78% |
| RCMP | 70% |
| Veterans: 19-64 Not CM | 64% |
| Veterans: 19-64 CM | 62% |
| Veterans: 65-84 | 68% |
| Veterans: 85+ | 77% |
| All clients | 67% |
CO_Q03. How easy or difficult was: Submitting the required information to VAC when applying for your service or benefit? Base: n=1,920; respondents who applied for a service or benefit, excluding “don’t know” and “refused”.
Those who are not Veterans (72% versus 65% of Veterans) were more likely to say it was easy to submit the required information to VAC when applying for their service or benefit. Indigenous respondents (56%) were less likely than non-Indigenous respondents (68%) say it was somewhat or very easy to submit the required information.
Case managed Veterans (49%) and non-case managed Veterans (55%) were less likely than other type of respondents to feel that it was somewhat or very easy to find the information required when applying for a service or benefit.
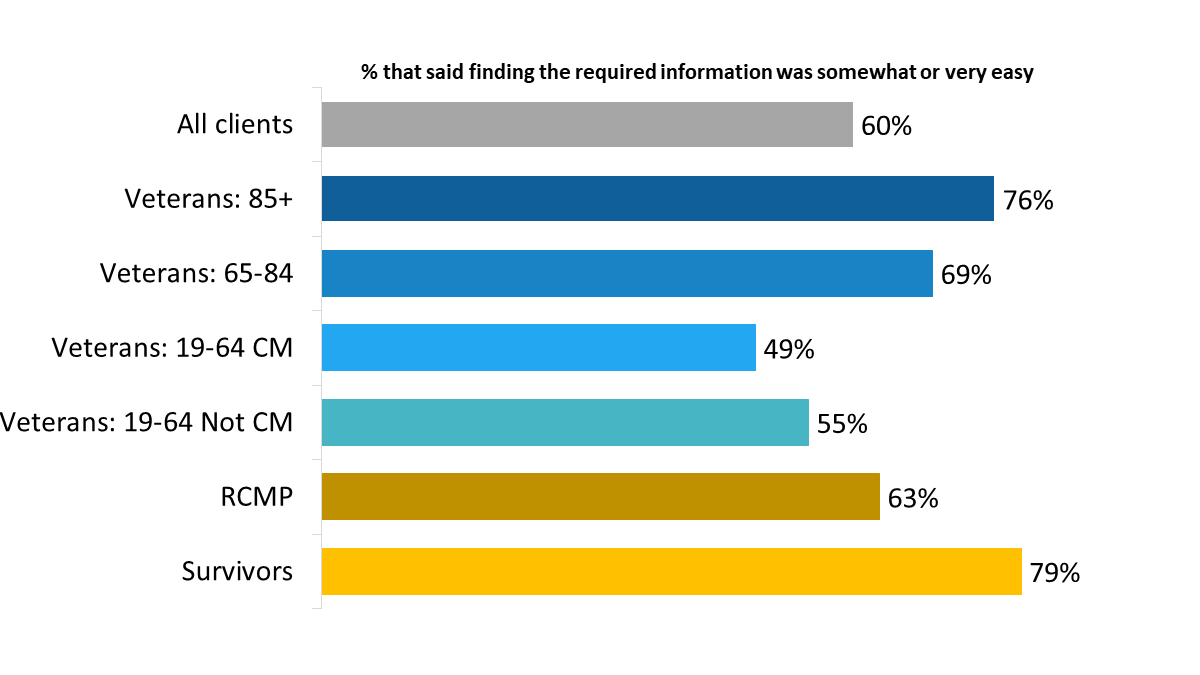
| Survivors | 79% |
| RCMP | 63% |
| Veterans: 19-64 Not CM | 55% |
| Veterans: 19-64 CM | 49% |
| Veterans: 65-84 | 69% |
| Veterans: 85+ | 76% |
| All clients | 60% |
XP_Q01. How easy or difficult was: Finding the information you needed to apply for a service or benefit? Base: n=1,924; respondents who applied for a service or benefit, excluding “don’t know” and “refused”.
Those who are not Veterans (67% versus 59% of Veterans) and those released from service between 2014 and 2018 (64% versus 53% of those released between 2019 and 2024) were more likely to say it was easy to find the information they needed to apply for a service or benefit. Indigenous respondents (50%) were less likely than non-Indigenous respondents (62%) to say it was somewhat or very easy to find the required information.
Respondents who indicated they applied for a service or benefit in the past 12 months identified various parts of the application process that could be improved. Leading the way was providing more frequent updates on the status of applications (30%) and simplifying the forms (27%), followed by providing access to the information needed to apply (25%) and clearer explanations regarding decisions (23%). Areas identified less often, but with some frequency, included improving the speed with which applications are processed (15%), asking for the same information only once, rather than multiple times throughout the application (13%), and providing access to a representative (8%).
Other areas that respondents felt could be improved were mentioned by small proportions, as depicted in Figure 17. Responses grouped in the “other” category included having more helpful staff, facilitating access to forms, simplifying the submission of forms online, for example.
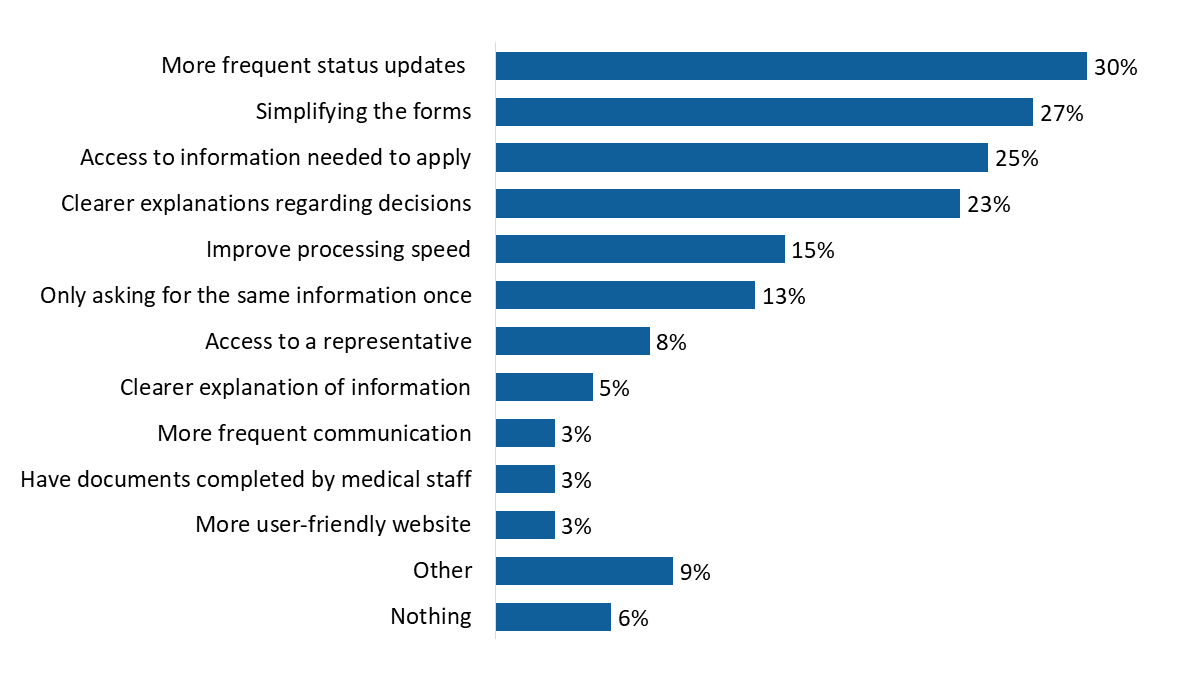
| Nothing | 6% |
| Other | 9% |
| More user-friendly website | 3% |
| Have documents completed by medical staff | 3% |
| More frequent communication | 3% |
| Clearer explanation of information | 5% |
| Access to a representative | 8% |
| Only asking for the same information once | 13% |
| Improve processing speed | 15% |
| Clearer explanations regarding decisions | 23% |
| Access to information needed to apply | 25% |
| Simplifying the forms | 27% |
| More frequent status updates | 30% |
OP_Q06. Which parts of the application process could be improved? [Multiple responses accepted] Base: n=1,450; respondents who applied for a service or benefit, excluding “don’t know” and “refused”.
As depicted in Figure 18, there are several differences by type of respondent in the parts of the application process identified for improvement. These include:
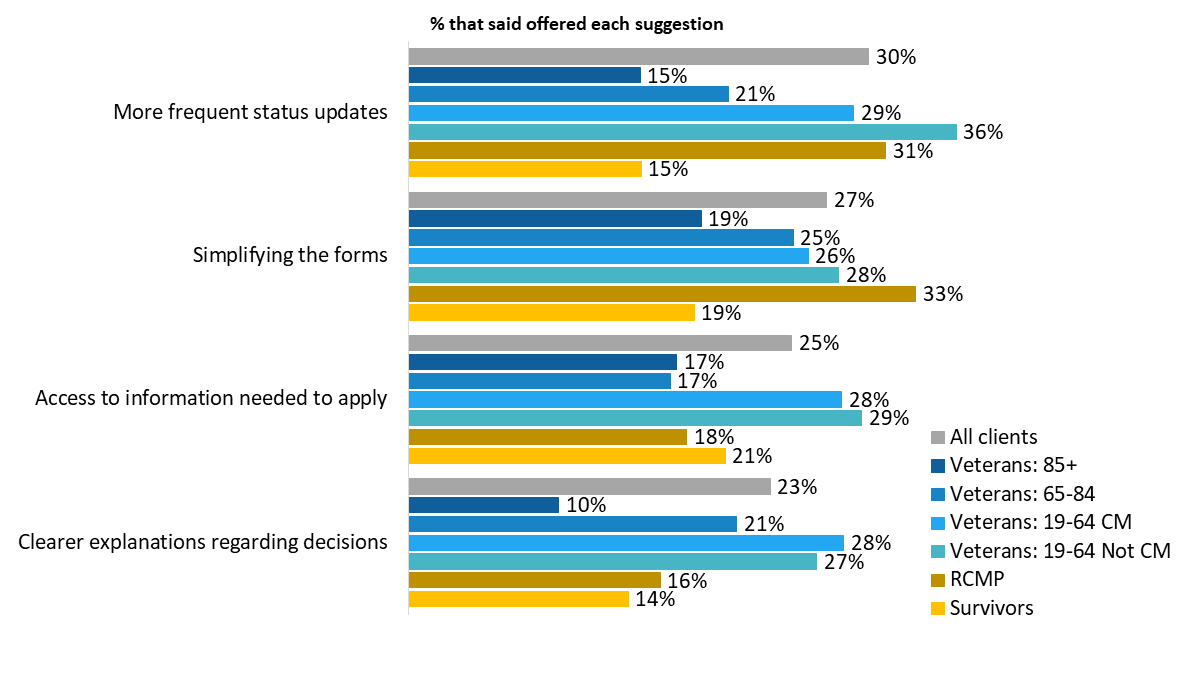
| All clients | Veterans: 85+ | Veterans: 65-84 | Veterans: 19-64 CM | Veterans: 19-64 Not CM | RCMP | Survivors | |
| Clearer explanations regarding decisions | 23% | 10% | 21% | 28% | 27% | 16% | 14% |
| Access to information needed to apply | 25% | 17% | 17% | 28% | 29% | 18% | 21% |
| Simplifying the forms | 27% | 19% | 25% | 26% | 28% | 33% | 19% |
| More frequent status updates | 30% | 15% | 21% | 29% | 36% | 31% | 15% |
OP_Q06. Which parts of the application process could be improved? [Multiple responses accepted] Base: n=1,450; respondents who applied for a service or benefit, excluding “don’t know” and “refused”.
The questions in this section were asked of all survey respondents (n=3,842).
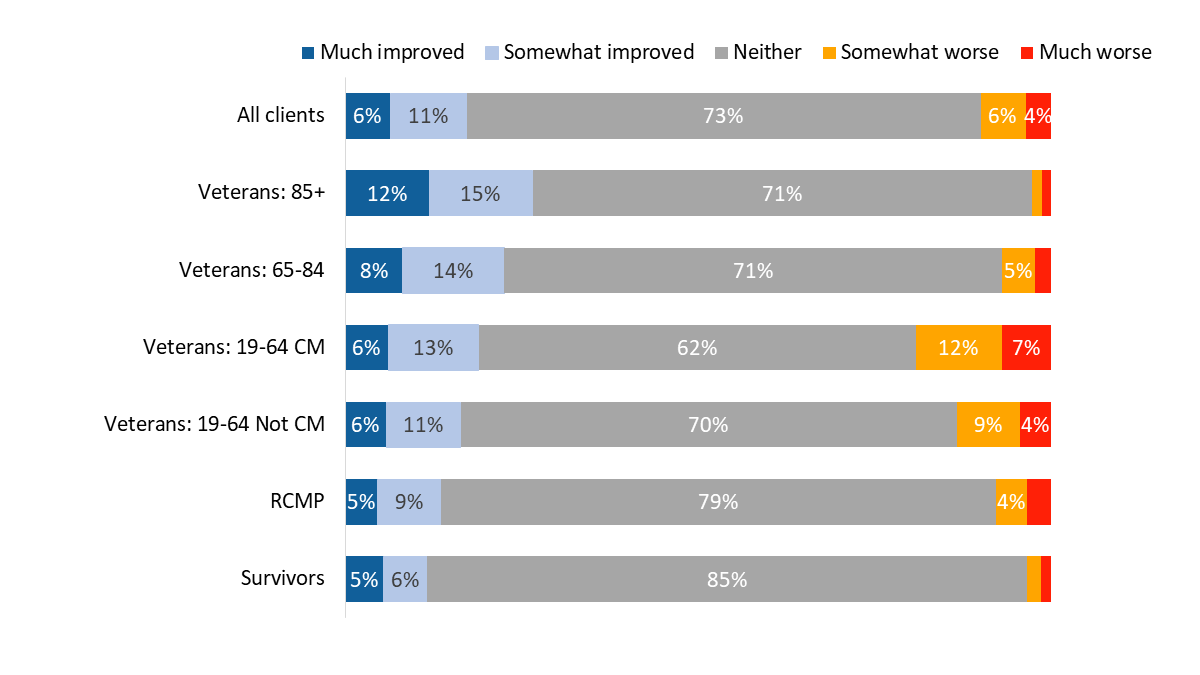
Nearly three-quarters of respondents (73%) said that VAC service has neither improved nor gotten worse in the past 12 months. Among those who think VAC service has changed over this period, close to two in 10 (17%) were of the opinion that service has improved and one in 10 (10%) felt that service has worsened over the past 12 months.
Perceptions varied by group. Veterans aged 85+ (27%), followed by Veterans 65-84 (22%) were more likely than members of the RCMP (14%) and Survivors (12%) to report that VAC service has improved over the past 12 months. Case managed Veterans (19%) were the most likely to report that VAC service has gotten worse over this period.
| Much improved | Somewhat improved | Neither | Somewhat worse | Much worse | |
| Survivors | 5% | 6% | 85% | 2% | 1% |
| RCMP | 5% | 9% | 79% | 4% | 3% |
| Veterans: 19-64 Not CM | 6% | 11% | 70% | 9% | 4% |
| Veterans: 19-64 CM | 6% | 13% | 62% | 12% | 7% |
| Veterans: 65-84 | 8% | 14% | 71% | 5% | 2% |
| Veterans: 85+ | 12% | 15% | 71% | 1% | 1% |
| All clients | 6% | 11% | 73% | 6% | 4% |
*Values of 3% or less are not displayed in the graph.
XP_Q012. Over the past 12 months, how has VAC service changed? Base: n=3,317; all respondents, excluding “don’t know” and “refused”.
Veterans (12% versus 5% of those who are not Veterans) and those released from service between 2019 and 2024 (14% versus 10% of those released between 2014 and 2018) were more likely to say that VAC service has gotten worse over the past 12 months.
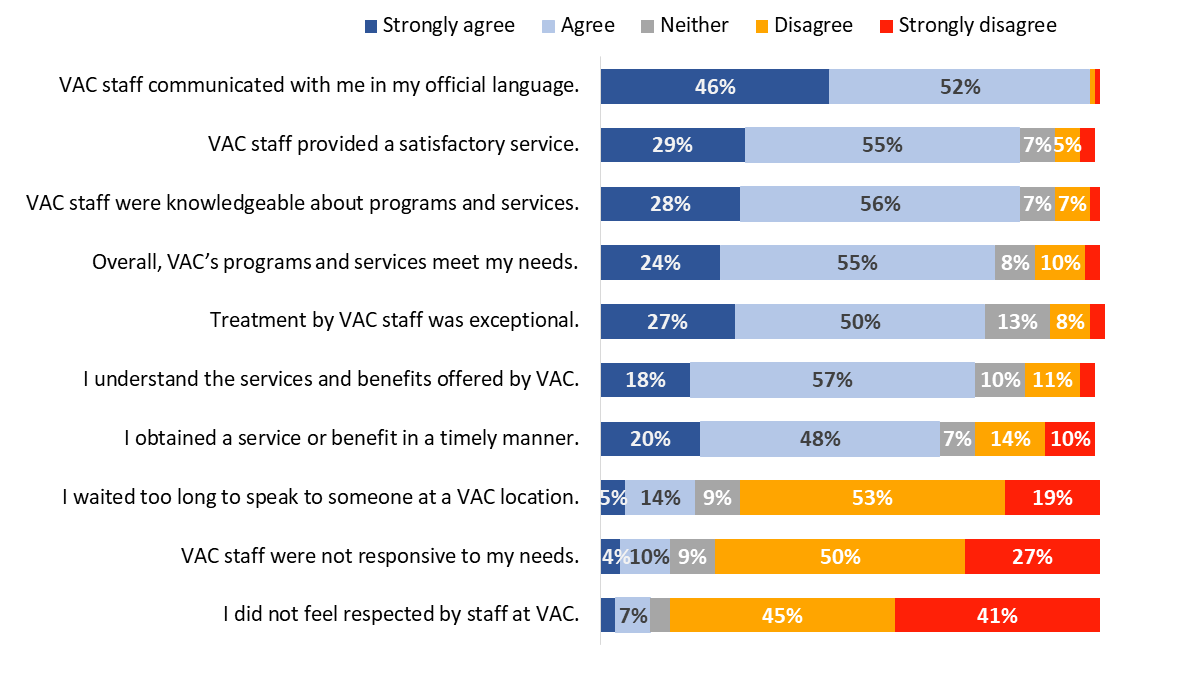
Thinking about the service they received from VAC during the past 12 months, respondents were asked how much they agree or disagree with the following statements:
Respondents provided positive impressions of the service they received from VAC during the past 12 months, though impressions tended to be moderate, not strongly positive.
There was near unanimity that VAC staff communicated in their official language of choice. Ninety-eight percent of respondents agreed that this was the case, including 46% who strongly agreed. In addition, a substantial majority felt respected by the staff at VAC (86% disagreed with the statement: “I did not feel respected by staff at VAC”), agreed that VAC staff provided a satisfactory service (84%), and felt that VAC staff were knowledgeable about programs and services (84%). Nearly eight in 10 (79%) also agreed that VAC’s programs and services meet their needs.
Approximately three-quarters agreed that treatment by VAC staff was exceptional (77%), that VAC staff were responsive to their needs (77% disagreed with the statement: “VAC staff were not responsive to my needs”), and that they understand the services and benefits offered by VAC (75%).
Fewer respondents, but still majorities, felt that they did not wait too long for service at a VAC location (72% disagreed with the statement: “I had to wait too long to speak to someone at a VAC location”) and that they obtained a service or benefit in a timely manner (68%).
| Strongly agree | Agree | Neither | Disagree | Strongly disagree | |
| I did not feel respected by staff at VAC. | 3% | 7% | 4% | 45% | 41% |
| VAC staff were not responsive to my needs. | 4% | 10% | 9% | 50% | 27% |
| I waited too long to speak to someone at a VAC location. | 5% | 14% | 9% | 53% | 19% |
| I obtained a service or benefit in a timely manner. | 20% | 48% | 7% | 14% | 10% |
| I understand the services and benefits offered by VAC. | 18% | 57% | 10% | 11% | 3% |
| Treatment by VAC staff was exceptional. | 27% | 50% | 13% | 8% | 3% |
| Overall, VAC’s programs and services meet my needs. | 24% | 55% | 8% | 10% | 3% |
| VAC staff were knowledgeable about programs and services. | 28% | 56% | 7% | 7% | 2% |
| VAC staff provided a satisfactory service. | 29% | 55% | 7% | 5% | 3% |
| VAC staff communicated with me in my official language. | 46% | 52% | 0% | 1% | 1% |
Values of 3% or less are not labelled in the graph.
XP_Q04-17. Thinking about the service you received from VAC during the past 12 months: …? Base: All respondents; n= 2,881-3,659, excluding “don’t know” and “refused”.
Compared to 2022, fewer respondents expressed strong agreement/disagreement with all aspects of the service provided by VAC.
While impressions of aspects of VAC’s service were positive overall, there were differences observed between groups for many of the aspects of service assessed in the survey. Figures 21 to 31 present the results for each statement for each of the groups.
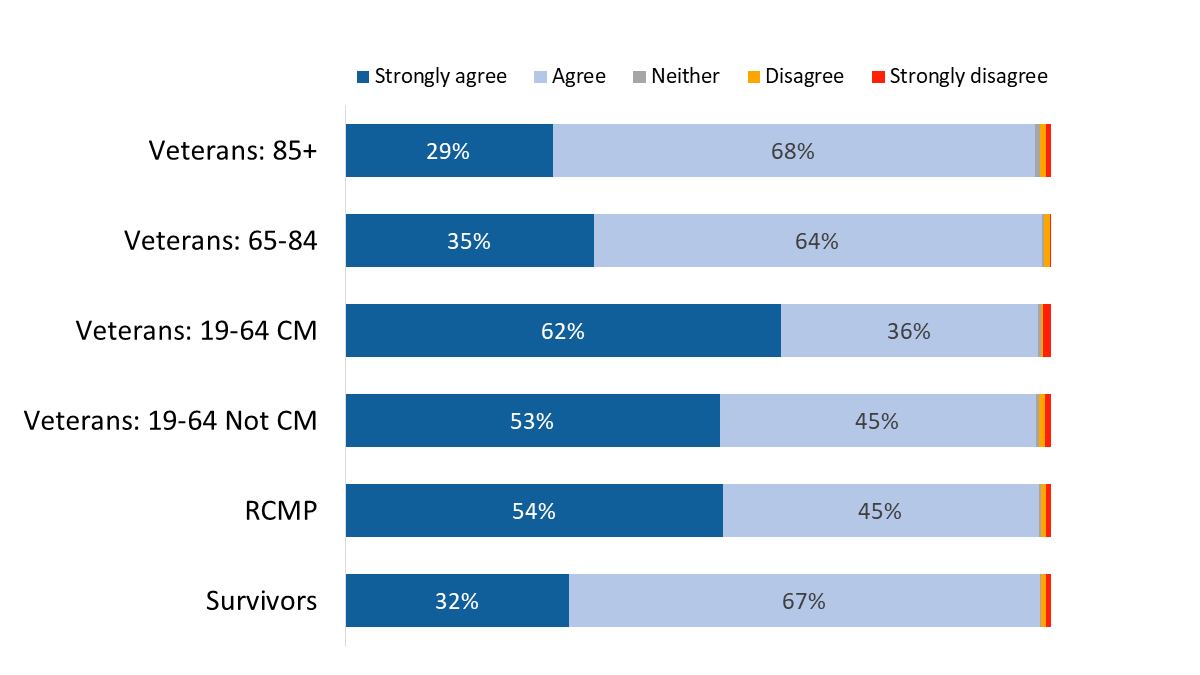
Veterans 19-64 who are case managed (62%), followed by members of the RCMP (54%) and Veterans 19-64 who are not case managed (53%) were more likely than other respondents to strongly agree that VAC communicated with them in their official language.
| Strongly agree | Agree | Neither | Disagree | Strongly disagree | |
| Survivors | 32% | 67% | 0% | 1% | 1% |
| RCMP | 54% | 45% | 0% | 1% | 1% |
| Veterans: 19-64 Not CM | 53% | 45% | 0% | 1% | 1% |
| Veterans: 19-64 CM | 62% | 36% | 0% | 0% | 1% |
| Veterans: 65-84 | 35% | 64% | 0% | 1% | 0% |
| Veterans: 85+ | 29% | 68% | 1% | 1% | 1% |
Values of 1% are not labelled in the graph.
XP_Q11. Thinking about the service you received from VAC during the past 12 months, do you agree/disagree: VAC staff communicated with me in the official language of my choice. Base: n=3,605; all respondents, excluding “don’t know” and “refused”.
RCMP (37%) and Veterans 19-64 who are case managed (34%) were more likely than other respondents to strongly agree that VAC provided a satisfactory service.
| Strongly agree | Agree | Neither | Disagree | Strongly disagree | |
| Survivors | 23% | 66% | 7% | 3% | 2% |
| RCMP | 37% | 50% | 6% | 6% | 2% |
| Veterans: 19-64 Not CM | 27% | 53% | 10% | 7% | 4% |
| Veterans: 19-64 CM | 34% | 45% | 9% | 6% | 6% |
| Veterans: 65-84 | 28% | 60% | 4% | 5% | 2% |
| Veterans: 85+ | 27% | 65% | 3% | 3% | 1% |
Values of 2% or less are not labelled in the graph.
XP_Q04. Thinking about the service you received from VAC during the past 12 months, do you agree/disagree: VAC staff provided a satisfactory service. Base: n=3,451; all respondents, excluding “don’t know” and “refused”.
Those who are not Veterans (88% versus 83% of Veterans) and those released from service between 2014 and 2018 (85% versus 80% of those released between 2019 and 2024) were more likely to agree that VAC staff provided a satisfactory service.
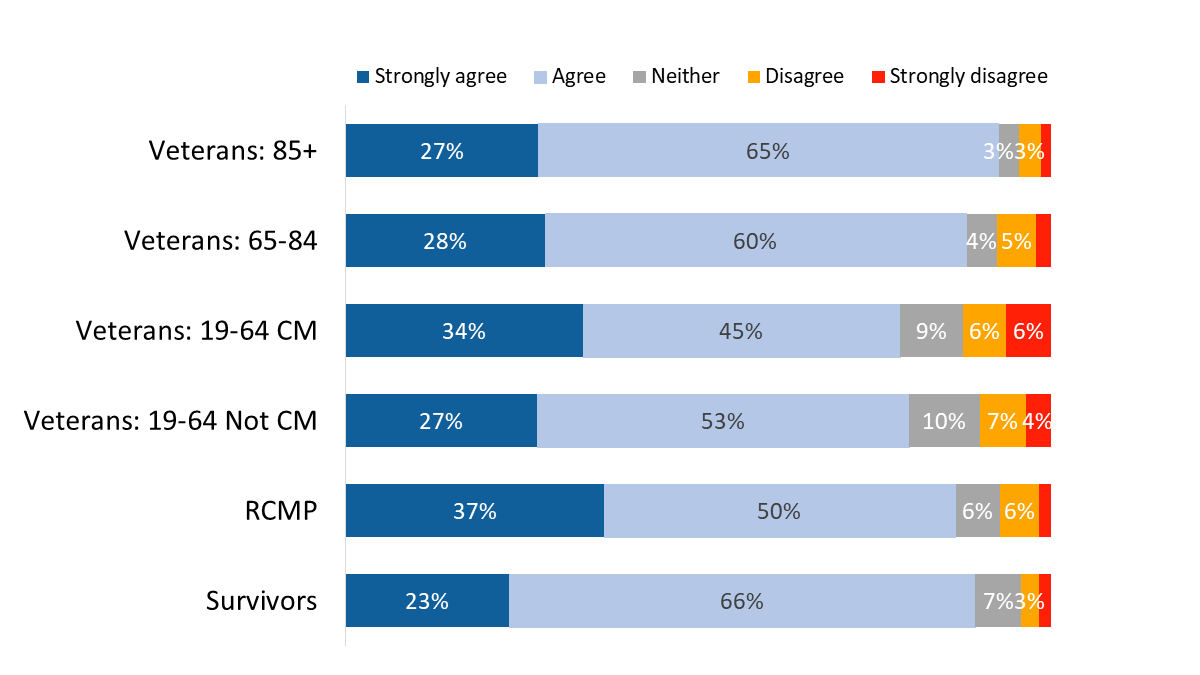
RCMP (34%) were more likely than most other respondents to strongly agree that VAC staff were knowledgeable about the programs and services. At the other end of the scale, case managed Veterans (13%), followed by Veterans who are not case managed (11%) were more likely to express disagreement with this statement.
| Strongly agree | Agree | Neither | Disagree | Strongly disagree | |
| Survivors | 25% | 65% | 3% | 6% | 1% |
| RCMP | 34% | 52% | 6% | 6% | 1% |
| Veterans: 19-64 Not CM | 27% | 51% | 11% | 7% | 3% |
| Veterans: 19-64 CM | 31% | 48% | 8% | 10% | 3% |
| Veterans: 65-84 | 27% | 62% | 4% | 5% | 2% |
| Veterans: 85+ | 27% | 65% | 4% | 4% | 0% |
Values of 2% or less are not labelled in the graph.
XP_Q05. Thinking about the service you received from VAC during the past 12 months, do you agree/disagree: VAC staff were knowledgeable about the programs and services I inquired about. Base: n=3,301; all respondents, excluding “don’t know” and “refused”.
Those who are not Veterans (88% versus 82% of Veterans), men who are Veterans (83% versus 78% of women Veterans) and those released from service between 2014 and 2018 (85% versus 78% of those released between 2019 and 2024) were more likely to agree that VAC staff were knowledgeable about the programs and services they inquired about.
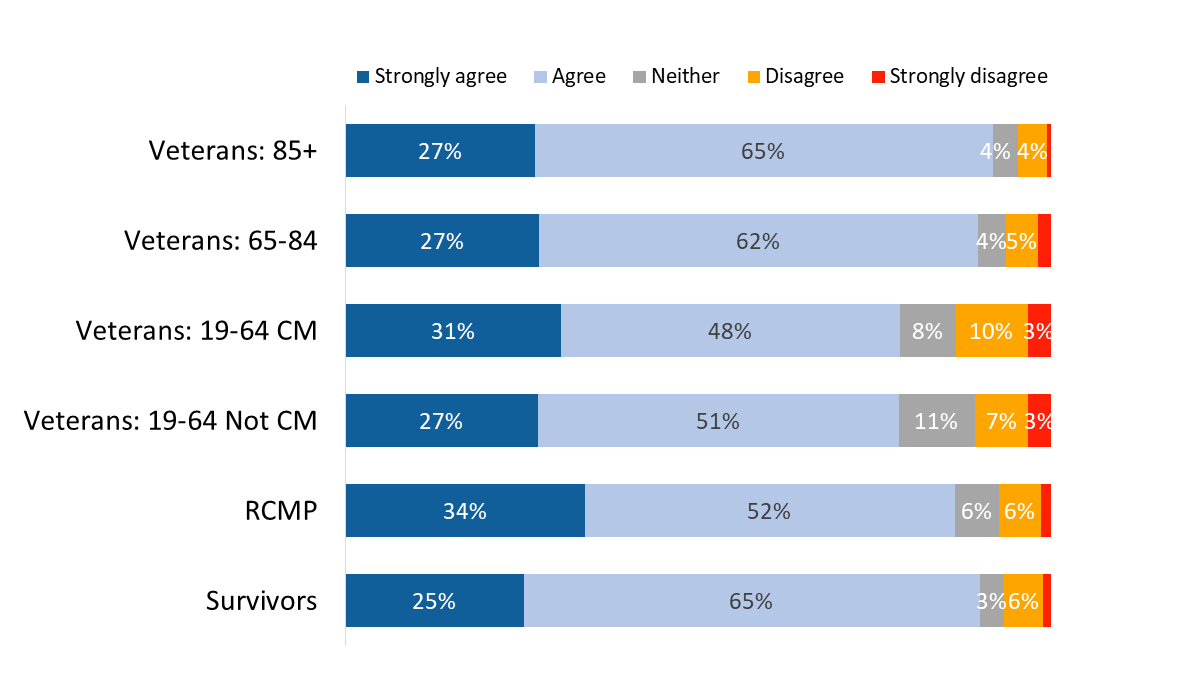
Veterans aged 85+ (92%) were the most likely to agree that VAC’s programs and services met their needs, although members of the RCMP (32%) were the most likely to strongly agree.

| Strongly agree | Agree | Neither | Disagree | Strongly disagree | |
| Survivors | 25% | 61% | 7% | 5% | 2% |
| RCMP | 32% | 53% | 6% | 7% | 2% |
| Veterans: 19-64 Not CM | 21% | 49% | 13% | 13% | 4% |
| Veterans: 19-64 CM | 21% | 51% | 9% | 12% | 7% |
| Veterans: 65-84 | 23% | 59% | 5% | 10% | 3% |
| Veterans: 85+ | 24% | 68% | 3% | 4% | 1% |
Values of 2% or less are not labelled in the graph.
XP_Q17. Thinking about the service you received from VAC during the past 12 months, do you agree/disagree: Overall, VAC’s programs and services meet my needs. Base: n=3,623; all respondents, excluding “don’t know” and “refused”.
Those who are not Veterans (85% versus 75% of Veterans), men who are Veterans (76% versus 70% of women Veterans) and those released from service between 2014 and 2018 (80% versus 75% of those released between 2019 and 2024) were more likely to agree that VAC’s programs and services meet their needs. Respondents from racialized population groups(18%) were more likely to disagree, indicating that the department’s programs and services do not meet their needs.
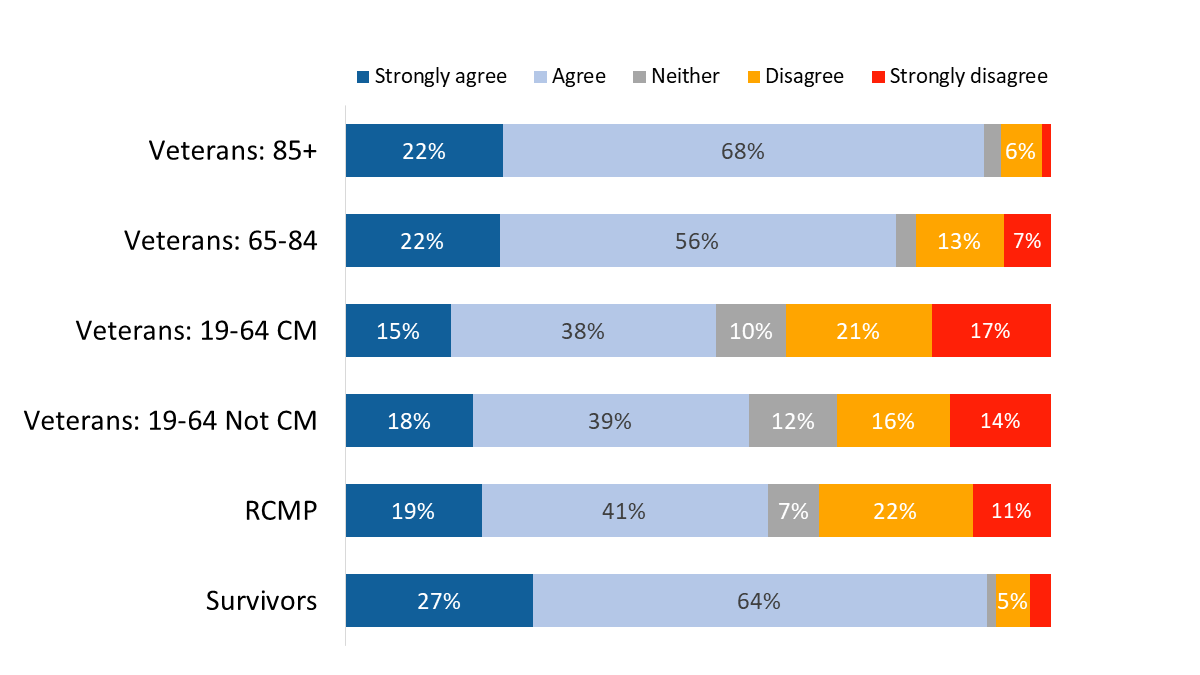
Veterans aged 19-64 were less likely than older Veterans, Survivors, and members of the RCMP to agree that treatment by VAC staff was exceptional.
| Strongly agree | Agree | Neither | Disagree | Strongly disagree | |
| Survivors | 23% | 63% | 5% | 7% | 2% |
| RCMP | 33% | 49% | 11% | 6% | 1% |
| Veterans: 19-64 Not CM | 25% | 43% | 18% | 10% | 3% |
| Veterans: 19-64 CM | 32% | 40% | 15% | 9% | 5% |
| Veterans: 65-84 | 26% | 56% | 10% | 7% | 2% |
| Veterans: 85+ | 23% | 65% | 5% | 5% | 1% |
Values of 2% or less are not labelled in the graph.
XP_Q07. Thinking about the service you received from VAC during the past 12 months, do you agree/disagree: Treatment by VAC staff was exceptional. Base: n=3,440; all respondents, excluding “don’t know” and “refused”.
Those who are not Veterans (84% versus 74% of Veterans) and those released from service between 2014 and 2018 (78% versus 70% of those released between 2019 and 2024) were more likely to agree that treatment by VAC staff was exceptional.
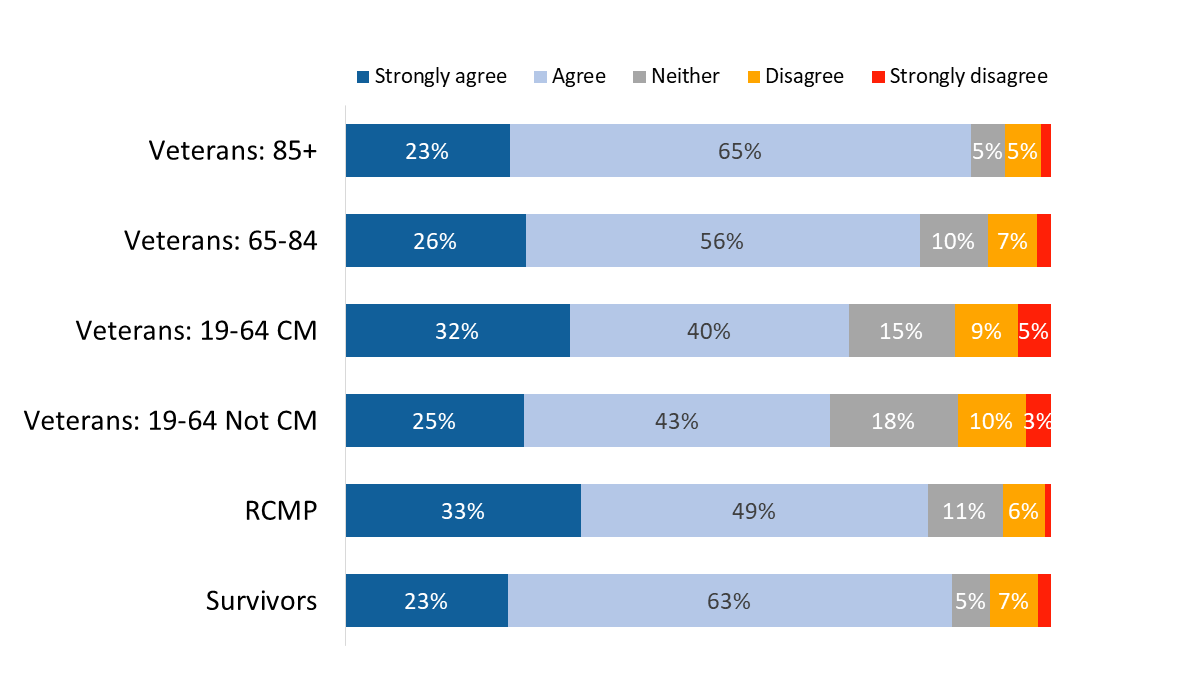
Once again, Veterans aged 19-64 were less likely than older Veterans, Survivors, and members of the RCMP to feel that they understand the services and benefits offered by VAC.
| Strongly agree | Agree | Neither | Disagree | Strongly disagree | |
| Survivors | 15% | 70% | 4% | 9% | 3% |
| RCMP | 22% | 58% | 7% | 10% | 2% |
| Veterans: 19-64 Not CM | 19% | 49% | 14% | 14% | 3% |
| Veterans: 19-64 CM | 17% | 48% | 17% | 13% | 5% |
| Veterans: 65-84 | 17% | 65% | 7% | 9% | 2% |
| Veterans: 85+ | 19% | 68% | 5% | 7% | 2% |
Values of 2% or less are not labelled in the graph.
XP_Q15. Thinking about the service you received from VAC during the past 12 months, do you agree/disagree: I understand the services and benefits offered by Veterans Affairs Canada. Base: n=3,659; all respondents, excluding “don’t know” and “refused”.
Those who are not Veterans (83% versus 73% of Veterans) and those released from service between 2014 and 2018 (78% versus 68% of those released between 2019 and 2024) were more likely to agree that they understand the services and benefits offered by VAC. Respondents from racialized population groups (19%) were more likely to disagree, signalling that they do not understand the services and benefits offered by VAC.
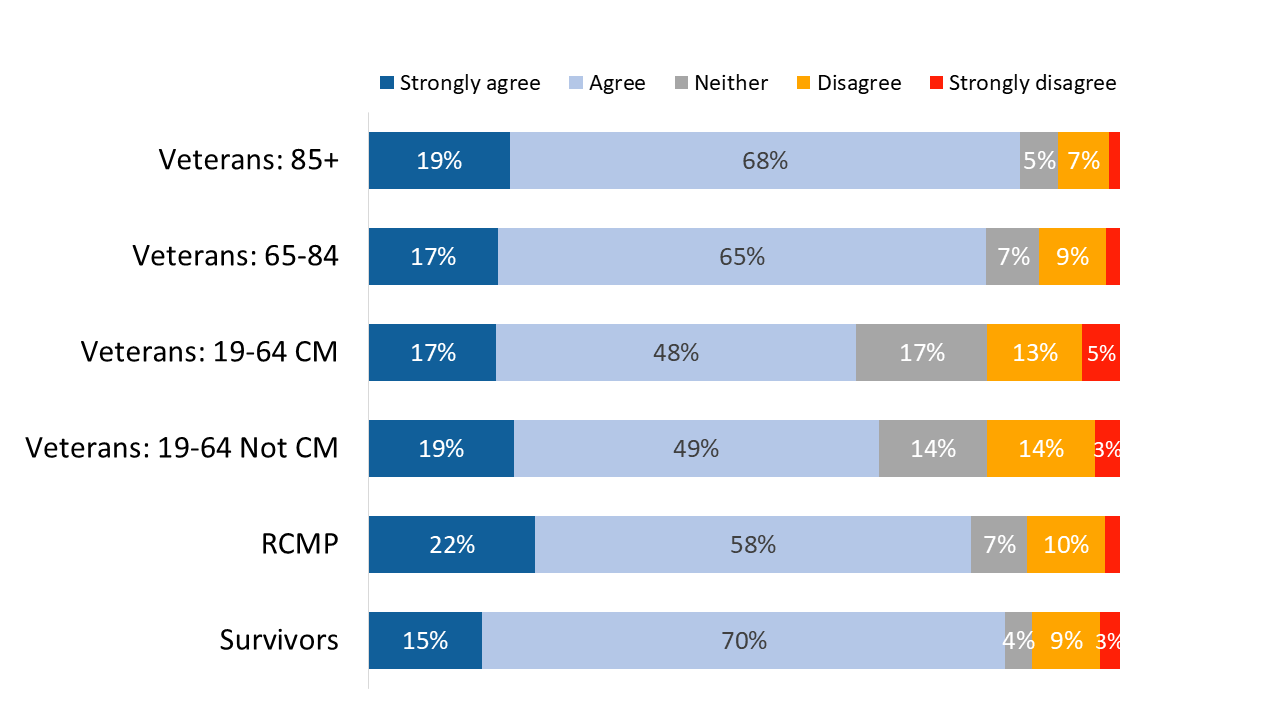
Survivors (91%) and Veterans aged 85+ (90%) were the most likely to report having obtained a service or benefit in a timely manner. Conversely, case managed Veterans (38%), followed by members of the RCMP (33%) and Veterans who are not case managed (30%) were more likely to disagree with this statement, suggesting that a service or benefit was not received in a timely manner.
| Strongly agree | Agree | Neither | Disagree | Strongly disagree | |
| Survivors | 27% | 64% | 1% | 5% | 3% |
| RCMP | 19% | 41% | 7% | 22% | 11% |
| Veterans: 19-64 Not CM | 18% | 39% | 12% | 16% | 14% |
| Veterans: 19-64 CM | 15% | 38% | 10% | 21% | 17% |
| Veterans: 65-84 | 22% | 56% | 3% | 13% | 7% |
| Veterans: 85+ | 22% | 68% | 2% | 6% | 1% |
Values of 3% or less are not labelled in the graph.
XP_Q13. Thinking about the service you received from VAC during the past 12 months, do you agree/disagree: I obtained a service or benefit in a timely manner. Base: n=3,490; all respondents, excluding “don’t know” and “refused”.
Those who are not Veterans (77% versus 64% of Veterans) and those released from service between 2014 and 2018 (73% versus 52% of those released between 2019 and 2024) were more likely to agree that they obtained a service or benefit in a timely manner.
Non-case managed Veterans (69%), followed by case managed Veterans (66%) were less likely than other respondents to disagree with this statement.

| Strongly agree | Agree | Neither | Disagree | Strongly disagree | |
| Survivors | 4% | 13% | 5% | 62% | 17% |
| RCMP | 4% | 9% | 9% | 50% | 28% |
| Veterans: 19-64 Not CM | 6% | 14% | 12% | 49% | 20% |
| Veterans: 19-64 CM | 9% | 13% | 12% | 45% | 21% |
| Veterans: 65-84 | 5% | 15% | 7% | 56% | 17% |
| Veterans: 85+ | 3% | 16% | 6% | 58% | 16% |
XP_Q10. Thinking about the service you received from VAC during the past 12 months, do you agree/disagree: I had to wait too long to speak to someone at a VAC location. Base: n=2,881; all respondents, excluding “don’t know” and “refused”.
Those who are not Veterans (79% versus 70% of Veterans) and those released from service between 2014 and 2018 (74% versus 66% of those released between 2019 and 2024) were more likely to disagree that they waited too long to speak to someone at a VAC location.
As has been the case with other aspects of service, non-case managed, and case managed Veterans (72% each) were less likely than other respondents to disagree with this statement.
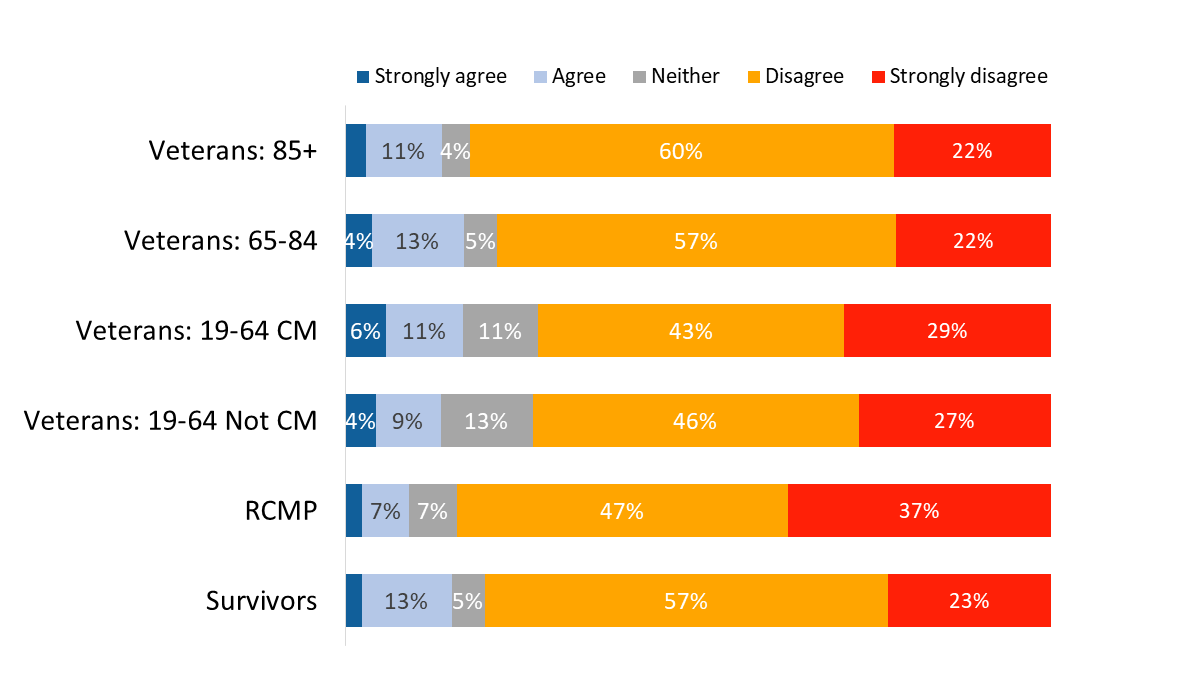
| Strongly agree | Agree | Neither | Disagree | Strongly disagree | |
| Survivors | 2% | 13% | 5% | 57% | 23% |
| RCMP | 2% | 7% | 7% | 47% | 37% |
| Veterans: 19-64 Not CM | 4% | 9% | 13% | 46% | 27% |
| Veterans: 19-64 CM | 6% | 11% | 11% | 43% | 29% |
| Veterans: 65-84 | 4% | 13% | 5% | 57% | 22% |
| Veterans: 85+ | 3% | 11% | 4% | 60% | 22% |
Values of 3% or less are not labelled in the graph.
XP_Q09. Thinking about the service you received from VAC during the past 12 months, do you agree/disagree: VAC staff were not responsive to my needs. Base: n=3,382; all respondents, excluding “don’t know” and “refused”.
RCMP were the most likely to provide a positive assessment of VAC staff, with 93% saying theydisagree with the statement.
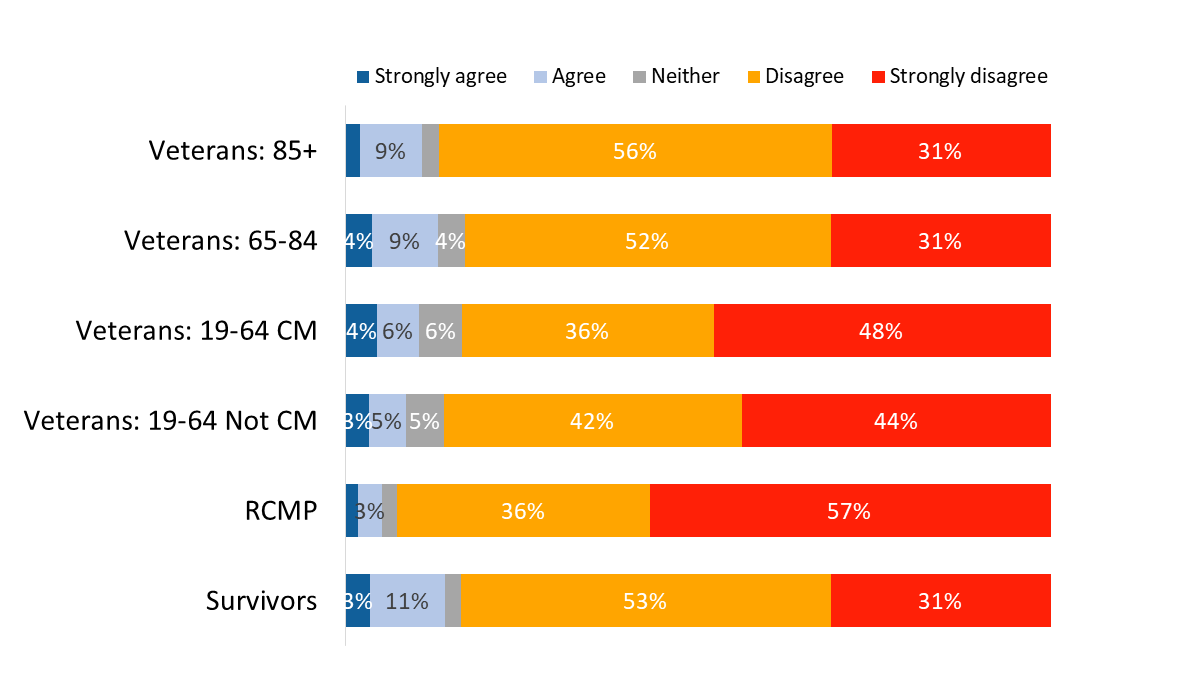
| Strongly agree | Agree | Neither | Disagree | Strongly disagree | |
| Survivors | 3% | 11% | 2% | 53% | 31% |
| RCMP | 2% | 3% | 2% | 36% | 57% |
| Veterans: 19-64 Not CM | 3% | 5% | 5% | 42% | 44% |
| Veterans: 19-64 CM | 4% | 6% | 6% | 36% | 48% |
| Veterans: 65-84 | 4% | 9% | 4% | 52% | 31% |
| Veterans: 85+ | 2% | 9% | 2% | 56% | 31% |
Values of 2% or less are not labelled in the graph.
XP_Q08. Thinking about the service you received from VAC during the past 12 months, do you agree/disagree: I did not feel respected by staff at VAC. Base: n=3,437; all respondents, excluding “don’t know” and “refused”.
With a focus on the past twelve months, just over three-quarters of survey respondents (77%) expressed satisfaction with the quality of VAC service delivery (one-third expressing strong satisfaction). The rest were almost equally divided between those who were neither satisfied nor dissatisfied (12%) and those who expressed some degree of dissatisfaction (11%). While overall satisfaction levels remain the same as 2022, this year fewer respondents are very satisfied with the quality of service delivery (34% in 2024 versus 43% in 2022).
Dissatisfaction was highest among Veterans aged 19-64: 18% of case managed Veterans and 15% of Veterans who are not case managed were dissatisfied with VAC’s service delivery.
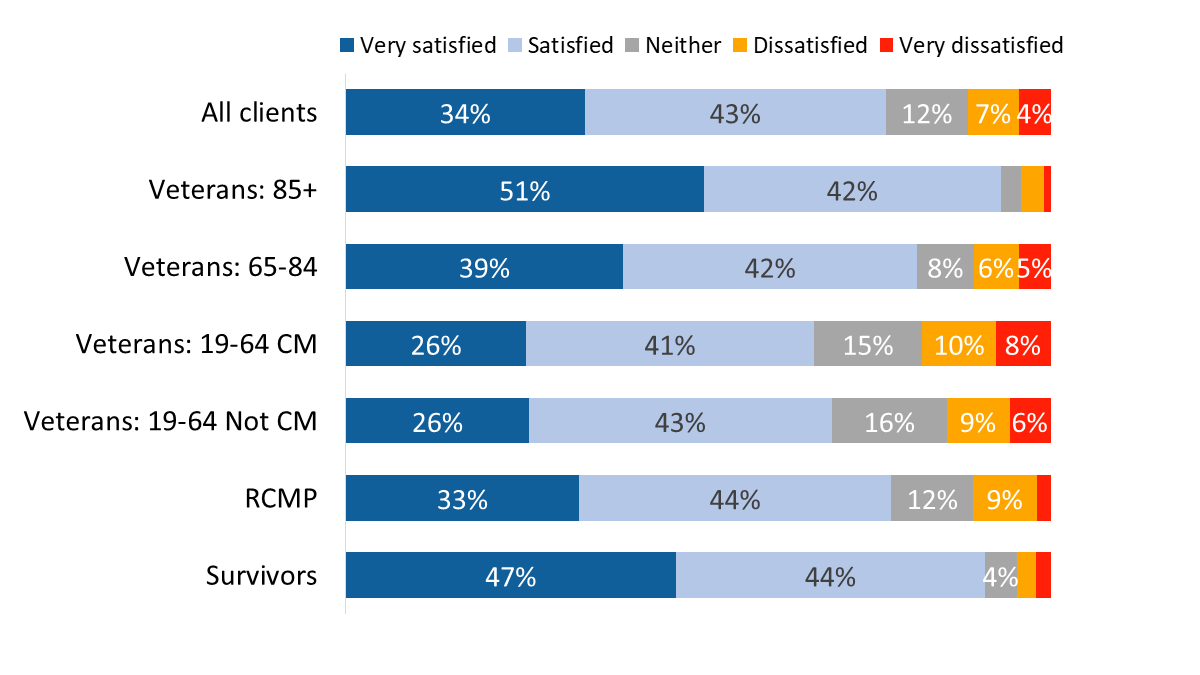
| Very satisfied | Satisfied | Neither | Dissatisfied | Very dissatisfied | |
| Survivors | 47% | 44% | 4% | 3% | 2% |
| RCMP | 33% | 44% | 12% | 9% | 2% |
| Veterans: 19-64 Not CM | 26% | 43% | 16% | 9% | 6% |
| Veterans: 19-64 CM | 26% | 41% | 15% | 10% | 8% |
| Veterans: 65-84 | 39% | 42% | 8% | 6% | 5% |
| Veterans: 85+ | 51% | 42% | 3% | 3% | 1% |
| All clients | 34% | 43% | 12% | 7% | 4% |
Values of 3% or less are not labelled in the graph.
XP_Q14PIP. Still focusing on the past 12 months, how satisfied are you with the quality of service delivery? Base: n=3,617; all respondents, excluding “don’t know” and “refused”.
Satisfaction with VAC’s quality of service delivery was higher among those who are not Veterans (84% versus 74% of Veterans), men who are Veterans (75% versus 69% of women Veterans), and those released from service between 2014 and 2018 (79% versus 68% of those released between 2019 and 2024). Respondents from racialized population groups (16%) were more likely to express dissatisfaction with the quality of service delivery.
Results were similar on the question of satisfaction with the quality of VAC’s programs and services. Over three-quarters said they were satisfied (47%) or very satisfied (31%), while 12% were neither satisfied nor dissatisfied and 10% expressed some degree of dissatisfaction. Satisfaction was highest among Veterans aged 85+ (92%) while dissatisfaction was highest among case managed Veterans (15%).
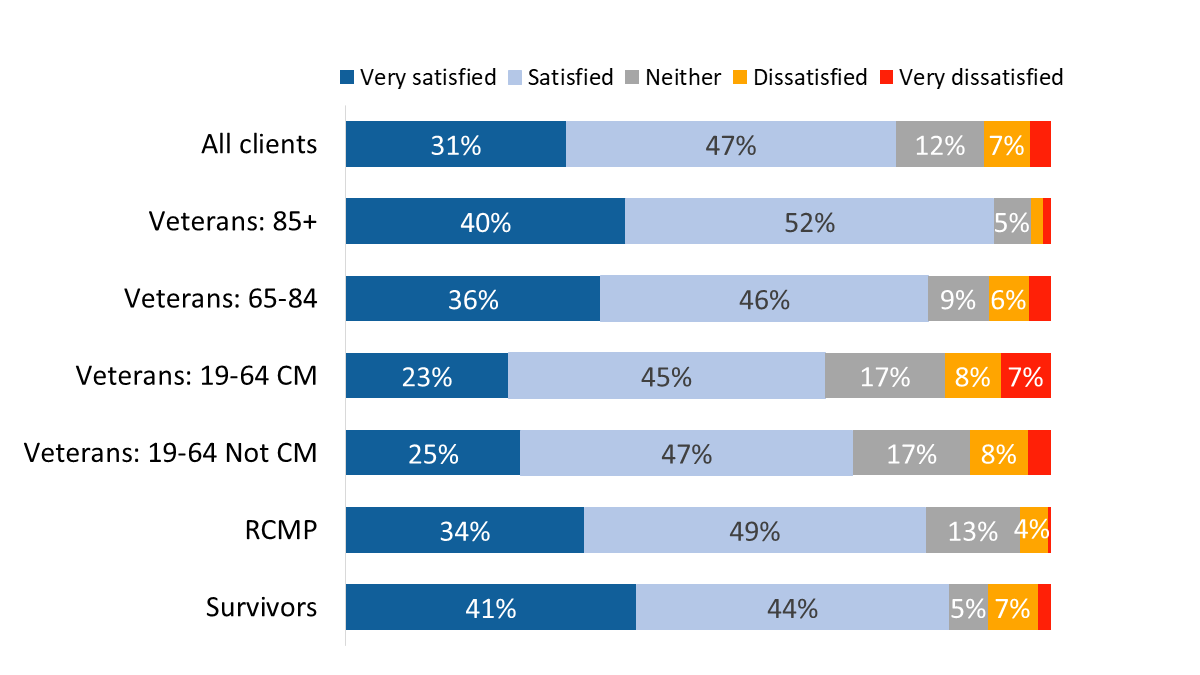
| Very satisfied | Satisfied | Neither | Dissatisfied | Very dissatisfied | |
| Survivors | 41% | 44% | 5% | 7% | 2% |
| RCMP | 34% | 49% | 13% | 4% | 0% |
| Veterans: 19-64 Not CM | 25% | 47% | 17% | 8% | 3% |
| Veterans: 19-64 CM | 23% | 45% | 17% | 8% | 7% |
| Veterans: 65-84 | 36% | 46% | 9% | 6% | 3% |
| Veterans: 85+ | 40% | 52% | 5% | 2% | 1% |
| All clients | 31% | 47% | 12% | 7% | 3% |
Values of 3% or less are not labelled in the graph.
XP_Q16. How satisfied are you with the quality of VAC's programs and services offered? Base: n=3,609; all respondents, excluding “don’t know” and “refused”.
Satisfaction with the quality of VAC's programs and services was higher among those who are not Veterans (84% versus 76% of Veterans) and those who were released from service between 2014 and 2018 (80% versus 74% of those released between 2019 and 2024). Respondents from racialized population groups (15%) were also more likely to express dissatisfaction with the quality of VAC’s programs and services.
Questions in this section were asked only of individuals who had a case plan for 90 days or more at the time of the survey. In all, 699 Veterans (or 18% of the sample) were asked these questions. The vast majority of these respondents (92%; up from 82% in 2022) said they currently have a case manager who works with them to obtain services (6% said they do not and 2% did not know).
Three-quarters (75%) of respondents who have a case plan expressed satisfaction with Case Management Services, including 40% who are very satisfied. The rest were almost evenly divided between those expressing neither satisfaction nor dissatisfaction (12%) and those expressing some degree of dissatisfaction (13%).
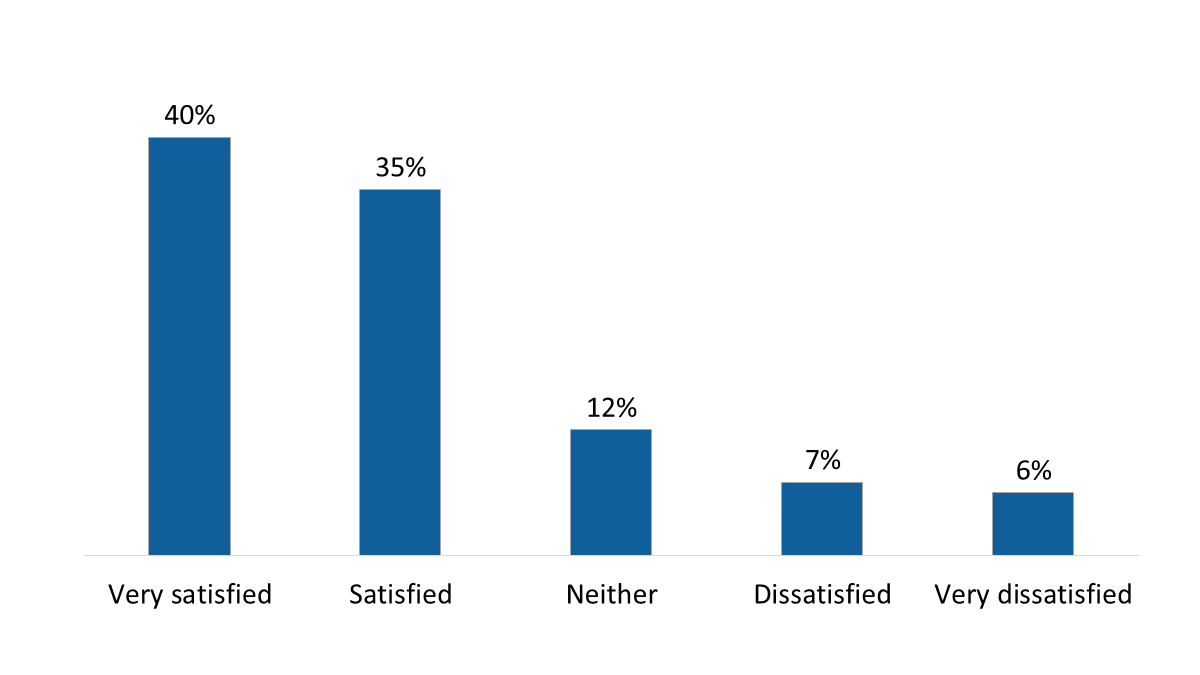
| Very dissatisfied | 6% |
| Dissatisfied | 7% |
| Neither | 12% |
| Satisfied | 35% |
| Very satisfied | 40% |
SP_Q17. Overall, how satisfied are you with Case Management Services? Base: n=688; respondents who have a case plan, excluding “don’t know” and “refused”.
Those who said they have a case manager were asked how much they agree or disagree with the following statements:
Most assessed Case Management Services positively in each of these areas, though the size of the majority providing such assessments varied by issue. A substantial majority agreed that their case manager responded to their calls in a reasonable amount of time (86%), that Case Management Services were beneficial to them (84%), and that they were assigned a case manager in a reasonable amount of time (83%). Approximately eight in 10 respondents said they are happy with the working relationship they have with their current case manager (81% disagreed with the statement: “I am not happy with the working relationship I have with my current case manager”) and agreed that their case plan goals were relevant (79%).
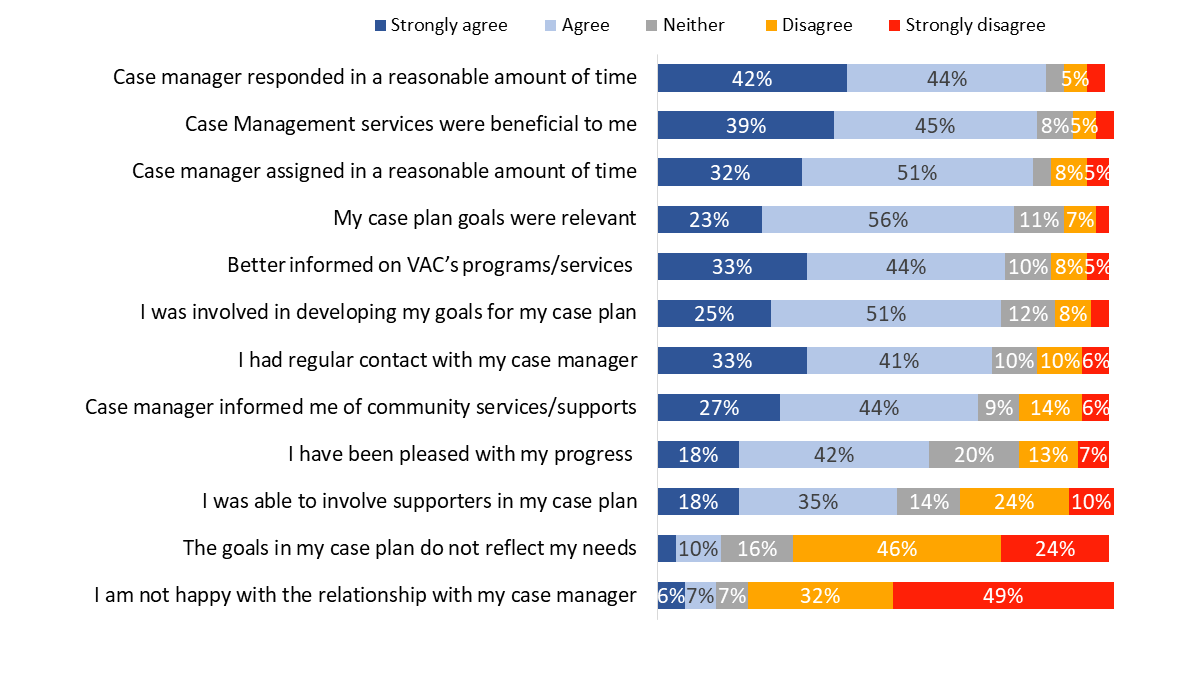
| Strongly agree | Agree | Neither | Disagree | Strongly disagree | |
| I am not happy with the relationship with my case manager | 6% | 7% | 7% | 32% | 49% |
| The goals in my case plan do not reflect my needs | 4% | 10% | 16% | 46% | 24% |
| I was able to involve supporters in my case plan | 18% | 35% | 14% | 24% | 10% |
| I have been pleased with my progress | 18% | 42% | 20% | 13% | 7% |
| Case manager informed me of community services/supports | 27% | 44% | 9% | 14% | 6% |
| I had regular contact with my case manager | 33% | 41% | 10% | 10% | 6% |
| I was involved in developing my goals for my case plan | 25% | 51% | 12% | 8% | 4% |
| Better informed on VAC’s programs/services | 33% | 44% | 10% | 8% | 5% |
| My case plan goals were relevant | 23% | 56% | 11% | 7% | 3% |
| Case manager assigned in a reasonable amount of time | 32% | 51% | 4% | 8% | 5% |
| Case Management services were beneficial to me | 39% | 45% | 8% | 5% | 4% |
| Case manager responded in a reasonable amount of time | 42% | 44% | 4% | 5% | 4% |
Values of 4% or less are not labelled in the graph.
SP_Q03-16 Thinking about your experience with Case Management services, do you strongly disagree, disagree, neither disagree nor agree, agree or strongly agree with the following statements? Base: n=488-630; respondents with a case manager, excluding “don’t know” and “refused”.
Approximately three-quarters agreed that in working with their case manager, they became better informed on how to access VAC’s programs and services that they needed (77%), that they were involved in developing their goals for their case plan (76%), and that they had regular contact with their case manager to discuss if they were reaching their goals (74%). Seven in 10 agreed that their case manager informed them of services and supports in their community that could help them (71%) and disagreed that the goals in their case plan do not reflect their needs (70%). Smaller majorities agreed that they have been pleased with their progress towards achieving their goals (60%) and that they had the opportunity to involve family and other supporters in the development of their case plan (53%).
Surveyed case management individuals were most likely to disagreed that they had the opportunity to involve family and other supporters in the development of their case plan (34%), that they have been pleased with progress towards achieving their goals (20%), and that their case manager informed them of services and supports in their community that could help them (20%).
Compared to 2022, respondents’ assessments of Case Management Services are more positive in several areas. Specifically, more respondents agreed with the following statements in 2024:
With that said, across many of the service dimensions assessed, the intensity of respondents’ satisfaction has declined in 2024. Compared to 2022, fewer respondents strongly agreed or strongly disagreed with the service-related statements. Instead, they provided a moderate assessment of VAC’s performance in these areas (i.e., agree or disagree).
Two-thirds of respondents who currently have a case manager indicated that their life is somewhat improved (38%) or much improved (29%) as a result of Case Management Services. Just over one-quarter (26%) were of the opinion that their life has remained about the same, and 7% believe that their life is worse as a result of Case Management Services.
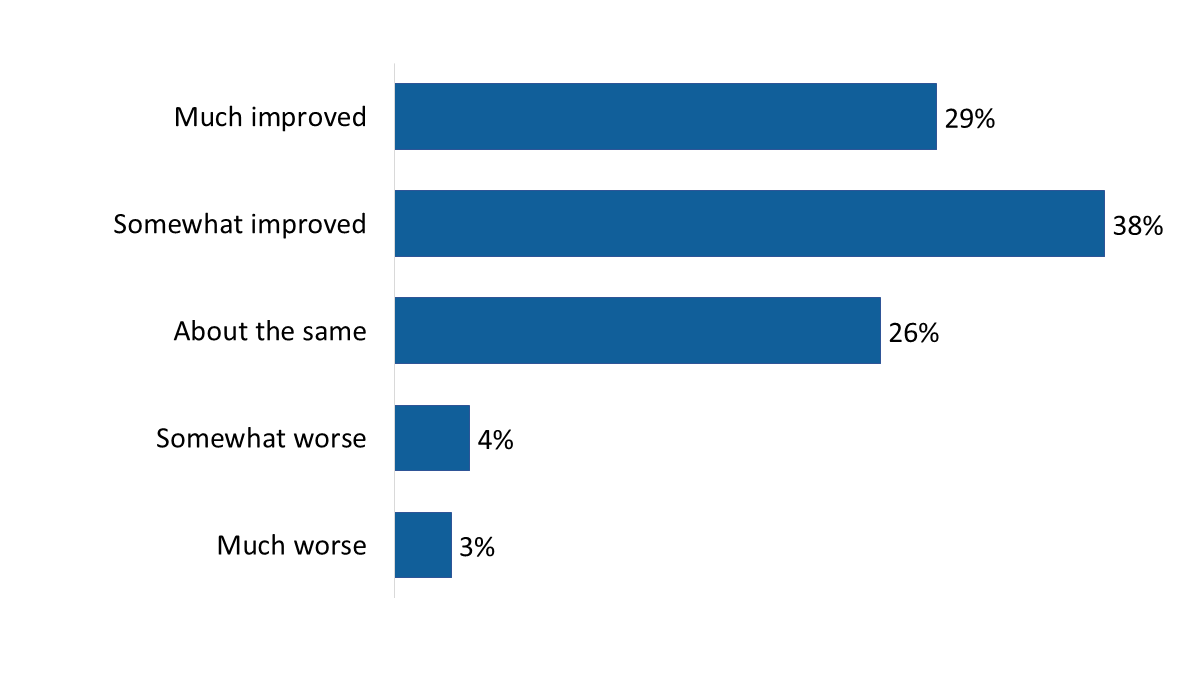
| Much worse | 3% |
| Somewhat worse | 4% |
| About the same | 26% |
| Somewhat improved | 38% |
| Much improved | 29% |
SP_Q16. How has your life changed as a result of Case Management services? Base: n=626; respondents with a case manager, excluding “don’t know” and “refused”.
Questions in this section were asked of individuals in receipt of funding for home care services through the Veterans Independence Program (VIP). The benefits through the VIP are only available to Veterans and Survivors. This included n=2,118 (or 55%) survey respondents.
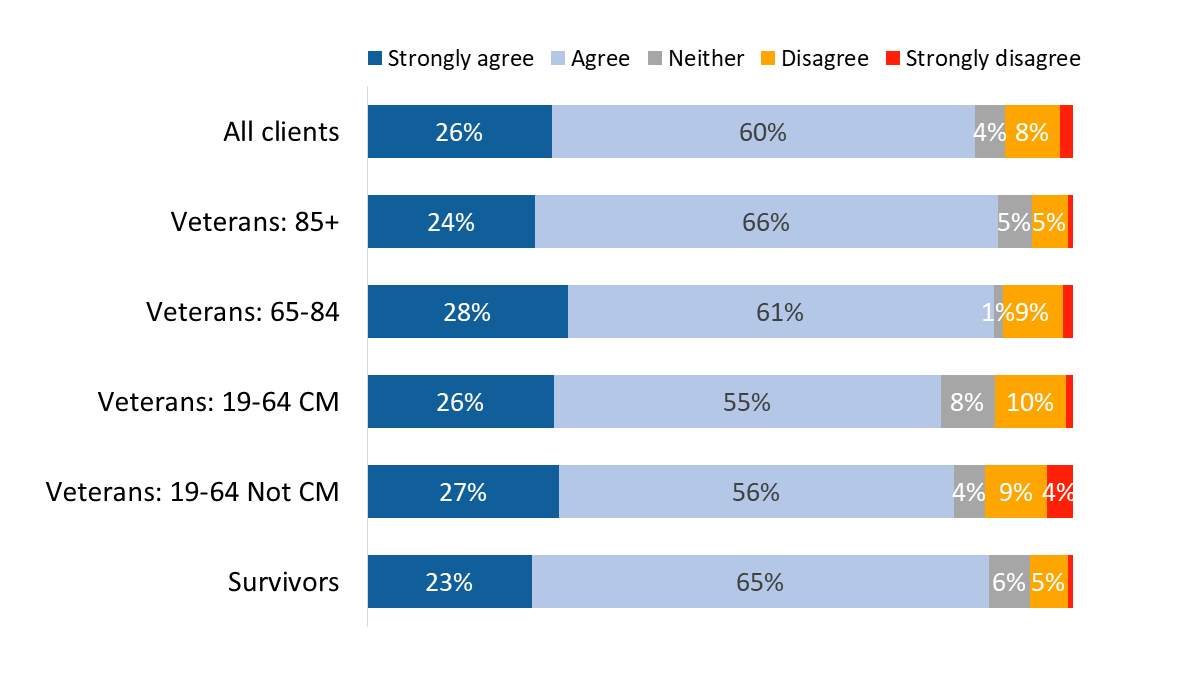
More than eight in 10 (84%) respondents in receipt of VIP benefits agreed that VIP meets their needs. Agreement, however, was more likely to be moderate than strong, with 29% agreeing strongly compared to over half (55%) reporting moderate agreement. Few (10%) did not feel that VIP is meeting their needs (and 5% were neutral).
While overall assessments of VAC in this area are similar to those reported in 2022, the intensity of respondents’ assessments of VIP have declined this year: 29% strongly agreed that VIP meets their needs compared to 55% in 2022.
Older Veterans were more likely than Veterans aged 19-64 to agree that VIP meets their needs—specifically, 91% of Veterans aged 85+ and 89% of Veterans aged 65-84 agreed with the statement, “VIP meets my needs” compared to 80% of Veterans 19-64 years of age.
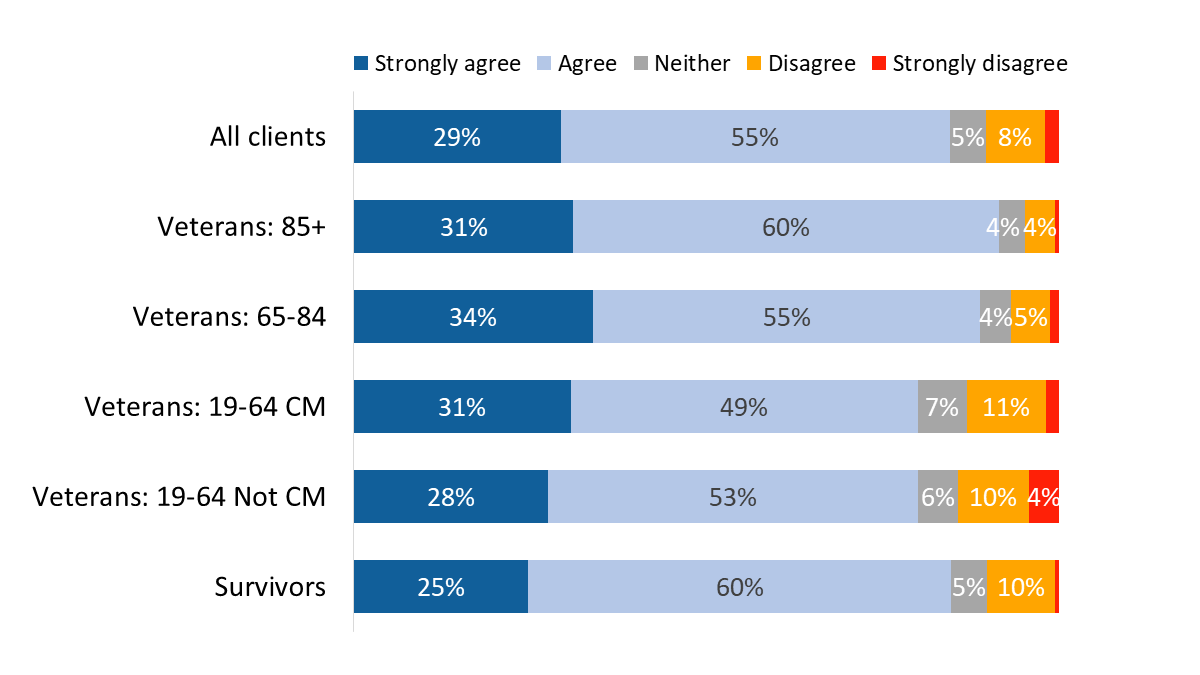
| Strongly agree | Agree | Neither | Disagree | Strongly disagree | |
| Survivors | 25% | 60% | 5% | 10% | 0% |
| Veterans: 19-64 Not CM | 28% | 53% | 6% | 10% | 4% |
| Veterans: 19-64 CM | 31% | 49% | 7% | 11% | 2% |
| Veterans: 65-84 | 34% | 55% | 4% | 5% | 1% |
| Veterans: 85+ | 31% | 60% | 4% | 4% | 0% |
| All clients | 29% | 55% | 5% | 8% | 2% |
Values of 3% or less are not labelled in the graph.
VI_Q04. Agree/Disagree with the following about VIP: Veterans Independence Program meets my needs. Base: n=2,064; respondents in receipt of benefits, excluding “don’t know” and “refused”.
Veterans who were released from service between 2014 and 2018 (86%) were more likely than those released between 2019 and 2024 (80%) to agree that the VIP meets their needs.
Ninety-four percent of respondents in receipt of VIP benefits agreed that they rely on these services to help them remain in their home and community, including 42% who strongly agreed that this is the case. Very few disagreed (3%) or were neutral (3%).
While overall assessments of VAC in this area are similar to those reported in 2022, the intensity of respondents’ assessments of VIP have declined this year: fewer than half (42%) strongly agreed that they rely on VIP to help stay in their home and community compared to three-quarters (75%) who expressed strong agreement in 2022.
Non-case managed Veterans 19-64 (92%) and case managed Veterans 19-64 (89%) were less likely than older Veterans and Survivors to agree that they rely on VIP services to help them remain in their home and community.
| Strongly agree | Agree | Neither | Disagree | Strongly disagree | |
| Survivors | 38% | 57% | 1% | 3% | 1% |
| Veterans: 19-64 Not CM | 44% | 48% | 5% | 2% | 1% |
| Veterans: 19-64 CM | 42% | 47% | 7% | 3% | 1% |
| Veterans: 65-84 | 43% | 53% | 1% | 3% | 0% |
| Veterans: 85+ | 42% | 54% | 2% | 2% | 0% |
| All clients | 42% | 52% | 3% | 2% | 1% |
Values of 3% or less are not labelled in the graph.
VI_Q02. Agree/Disagree with the following about VIP: I rely on VIP services to help me remain in my home and community. Base: n=2,036; respondents in receipt of benefits, excluding “don’t know” and “refused”.
Veterans who were released from service between 2014 and 2018 (95%) were more likely than those released between 2019 and 2024 (88%) to rely on VIP services to help them remain in their home and community.
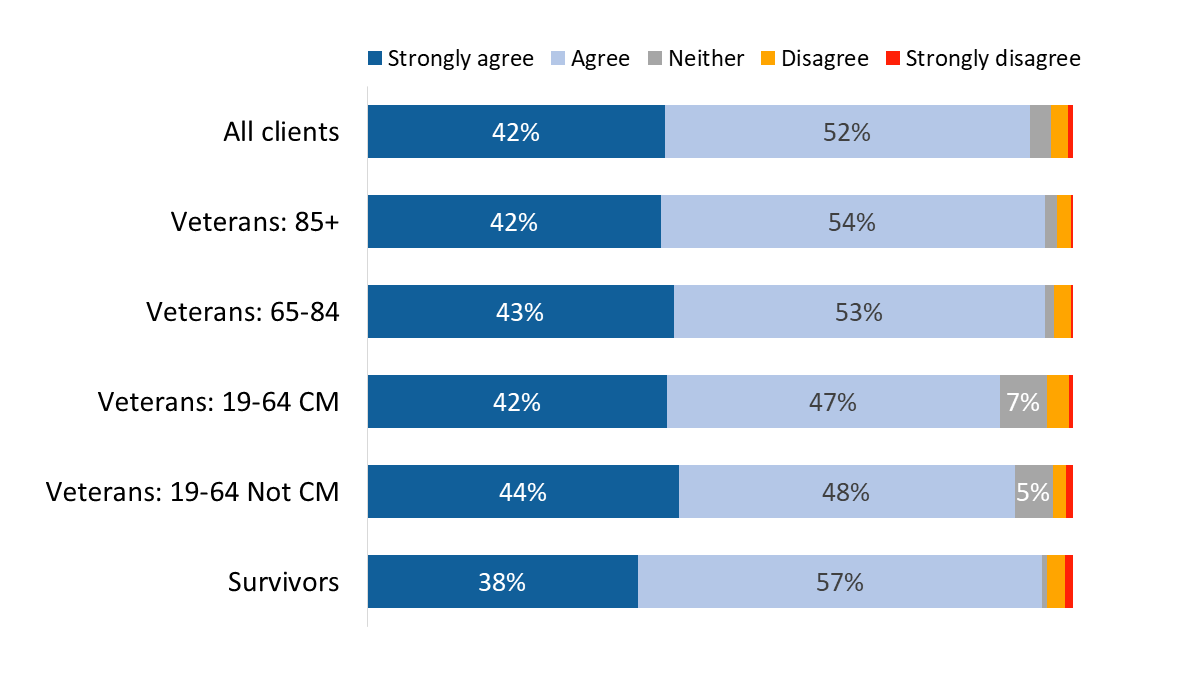
Eighty-six percent of respondents in receipt of VIP benefits agreed that they have been able to find service providers to help them with the VIP services they need, although only one-quarter (26%; down from 65% in 2022) strongly agreed that this is the case.
Once again, agreement was lower among Veterans between the ages of 19 and 64, both those who are case managed (81%) and those who are not (83%).
| Strongly agree | Agree | Neither | Disagree | Strongly disagree | |
| Survivors | 23% | 65% | 6% | 5% | 1% |
| Veterans: 19-64 Not CM | 27% | 56% | 4% | 9% | 4% |
| Veterans: 19-64 CM | 26% | 55% | 8% | 10% | 1% |
| Veterans: 65-84 | 28% | 61% | 1% | 9% | 1% |
| Veterans: 85+ | 24% | 66% | 5% | 5% | 1% |
| All clients | 26% | 60% | 4% | 8% | 2% |
Values of 3% or less are not labelled in the graph.
VI_Q03. Agree/Disagree with the following about VIP: I have been able to find service providers to help me with the VIP services I need. Base: n=2,020; respondents in receipt of benefits, excluding “don’t know” and “refused”.
Respondents who disagreed that they have been able to find service providers to help them with the VIP services they need (n=171) were asked to identify the main reason why. The most frequently mentioned reason, identified by just over one-third of eligible respondents (36%), was insufficient funding amounts.
Following insufficient funding, two in 10 mentioned local providers’ lack of availability (22%) and a lack of service providers near them (21%). Smaller numbers identified not knowing who to call (8%), as well as reasons grouped in the “other” category, including, for example, lack of direct billing and lack of need/awarenessFootnote 1 of the program.
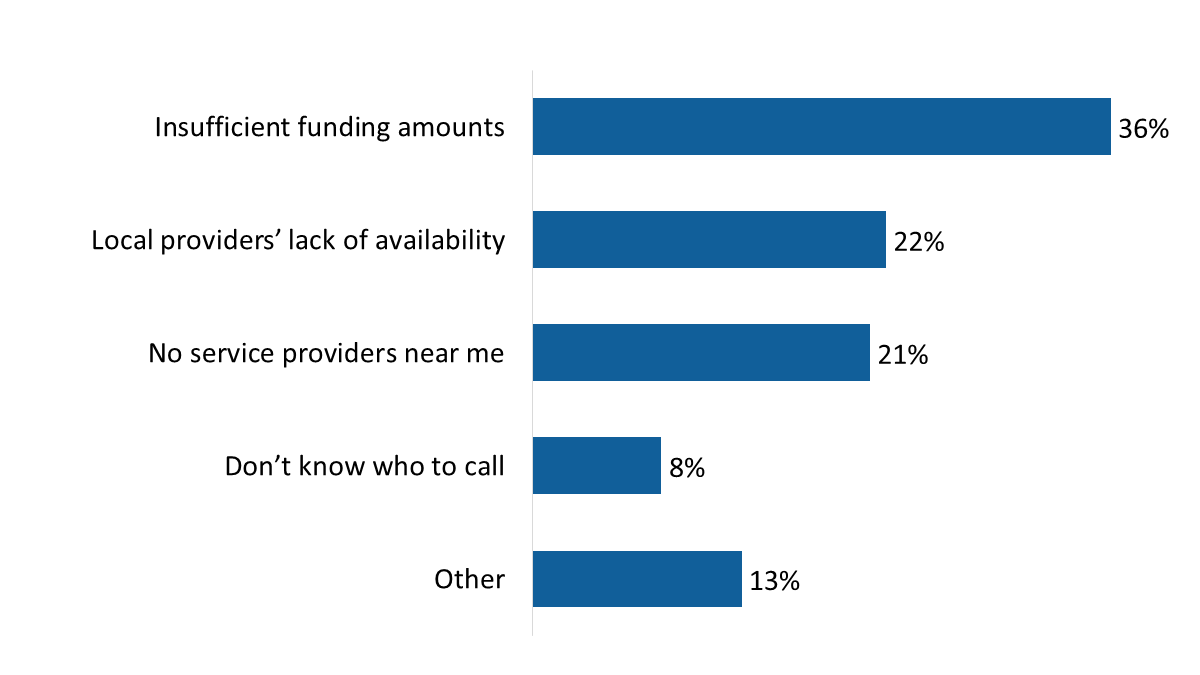
| Other | 13% |
| Don’t know who to call | 8% |
| No service providers near me | 21% |
| Local providers’ lack of availability | 22% |
| Insufficient funding amounts | 36% |
VI_Q06. What is the main reason that you have not been able to find service providers for VIP? Base: n=171; respondents in receipt of benefits, who have not been able to find service providers, excluding “don’t know” and “refused”.
All respondents in receipt of VIP benefits were asked for suggestions to improve the program. The most frequently identified suggestion for improving VIP was to increase the funding amounts for individual benefits and services (29%). This was followed at a distance by expanding the types of benefits and services covered by the program (17%). Other suggestions were identified infrequently and can be found in Figure 40.

| Don’t know | 38% |
| Nothing | 10% |
| Other | 2% |
| Expand benefits and services to spouses/widows | 1% |
| Access to an assigned case worker | 1% |
| More helpful staff/representatives | 1% |
| Access to details about benefits and services | 3% |
| Access to service providers | 3% |
| More frequent communication | 3% |
| Index funding amounts/keep up with inflation | 4% |
| Decrease approval and/or funding wait times | 6% |
| Simplify the process to receive benefits and services | 6% |
| Expand the types of benefits and services covered | 17% |
| Increase funding amounts for individual benefits and services | 29% |
VI_Q05. How could VIP be improved? Base: n=2,083; respondents in receipt of benefits.
Notably, the largest proportion of respondents said they did not know how to improve the VIP (38%) while one in 10 (10%) reported that nothing needs improvement.
Veterans 19-64 were more likely than other respondents to suggest increased funding and expansion of the types of benefits and services covered under the program.
Veterans (33% versus 16% of non-Veterans) and those who were released from service between 2019 and 2024 (41% versus 31% of those released between 2014 and 2018) to suggest increased funding amounts for individual benefits and services.
Questions in this section were asked of individuals in the Treatment Benefit Program. This included n=2,445 (or 64%) of respondents. The Treatment Benefits Program is only available to Veterans and RCMP and it provides coverage for selected healthcare services.
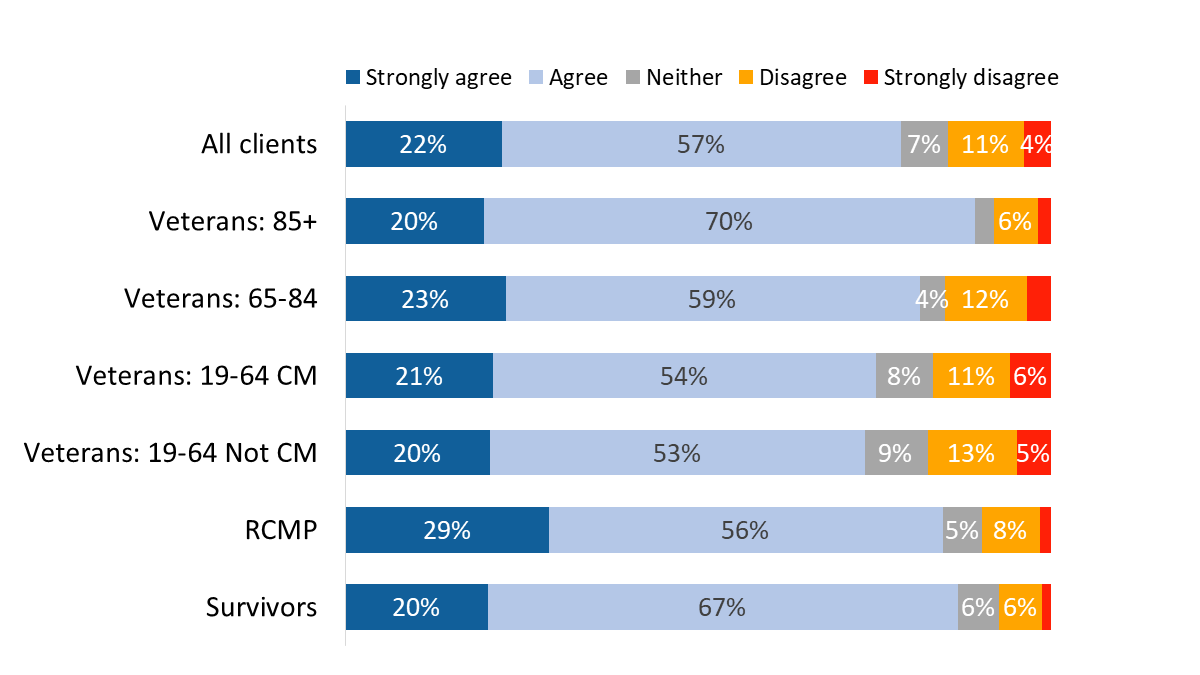
Most eligible respondents (78%) expressed satisfaction with the Treatment Benefits Program, although they were more likely to be moderately (49%) not strongly (29%) satisfied with the program. Satisfaction was higher among Veterans aged 85+ (90%) and members of the RCMP (88%) and lower among case managed (70%) and non-case managed (74%) Veterans between the ages of 19 and 64 years.
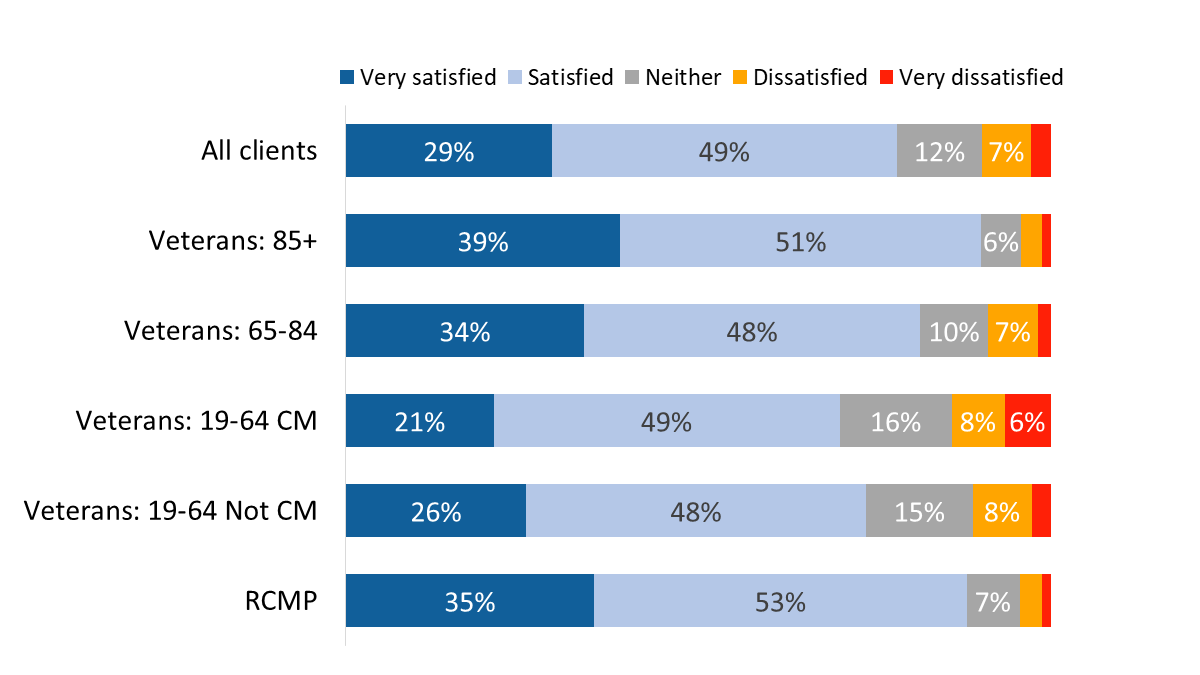
| Very satisfied | Satisfied | Neither | Dissatisfied | Very dissatisfied | |
| RCMP | 35% | 53% | 7% | 3% | 1% |
| Veterans: 19-64 Not CM | 26% | 48% | 15% | 8% | 3% |
| Veterans: 19-64 CM | 21% | 49% | 16% | 8% | 6% |
| Veterans: 65-84 | 34% | 48% | 10% | 7% | 2% |
| Veterans: 85+ | 39% | 51% | 6% | 3% | 1% |
| All clients | 29% | 49% | 12% | 7% | 3% |
Values of 3% or less are not labelled in the graph.
TR_Q06. Overall, how satisfied are you with the Treatment Benefits program? Base: n=2,253; respondents in receipt of benefits, excluding “don’t know” and “refused”.
Satisfaction was higher among RCMP (88% versus 77% of Veterans), men who are Veterans (78% versus 72% of women Veterans), and those who were released from service between 2014 and 2018 (80% versus 74% of those released between 2019 and 2024).
Underscoring overall satisfaction with the program, 79% agreed that the Treatment Benefits Program meets their needs. Once again, assessments of the program tended to be moderate, with over half (56%) agreeing and fewer (23%) expressing strong agreement. This is in contrast to 2022 when more respondents strongly agree (43% versus 23% in 2024).
Veterans aged 85+ (86%), RCMP (87%), and Veterans aged 65-84 (83%) were more likely than Veterans between the ages of 19 and 64 years (72% who are case managed and 74% who are not case managed) to agree that the program meets their needs.
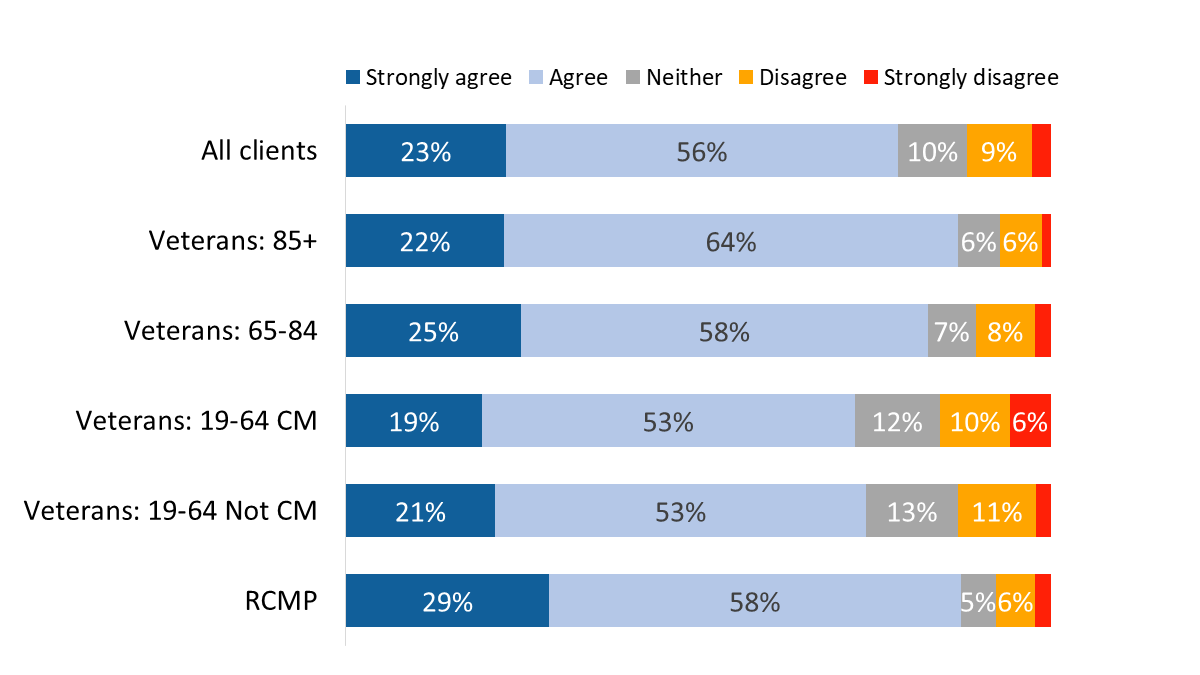
| Strongly agree | Agree | Neither | Disagree | Strongly disagree | |
| RCMP | 29% | 58% | 5% | 6% | 2% |
| Veterans: 19-64 Not CM | 21% | 53% | 13% | 11% | 2% |
| Veterans: 19-64 CM | 19% | 53% | 12% | 10% | 6% |
| Veterans: 65-84 | 25% | 58% | 7% | 8% | 2% |
| Veterans: 85+ | 22% | 64% | 6% | 6% | 1% |
| All clients | 23% | 56% | 10% | 9% | 3% |
Values of 3% or less are not labelled in the graph.
TR_Q03. Agree/Disagree with the following statements about the Treatment Benefits: The Treatment Benefits Program meets my needs. Base: n=2,144; respondents in receipt of benefits, excluding “don’t know” and “refused”.
The following subgroups were more likely to agree that the Treatment Benefits Program meets their needs: RCMP (87% versus 77% of Veterans), men who are Veterans (79% versus 71% of women Veterans), and those who were released from service between 2014 and 2018 (80% versus 71% of those released between 2019 and 2024).
Seventy-seven percent of respondents said that the time it took to get reimbursed for treatment benefits and services was reasonable (23% agreed strongly and 54% agreed). In 2022, more respondents strongly agreed (46% versus 23% in 2024) that the reimbursement time was reasonable.
Veterans aged 85+ (87%) and Veterans aged 65-84 (81%) were more likely than Veterans 19 to 64 years (70% who are case managed and 75% who are not case managed) to agree that they were reimbursed in a reasonable amount of time.
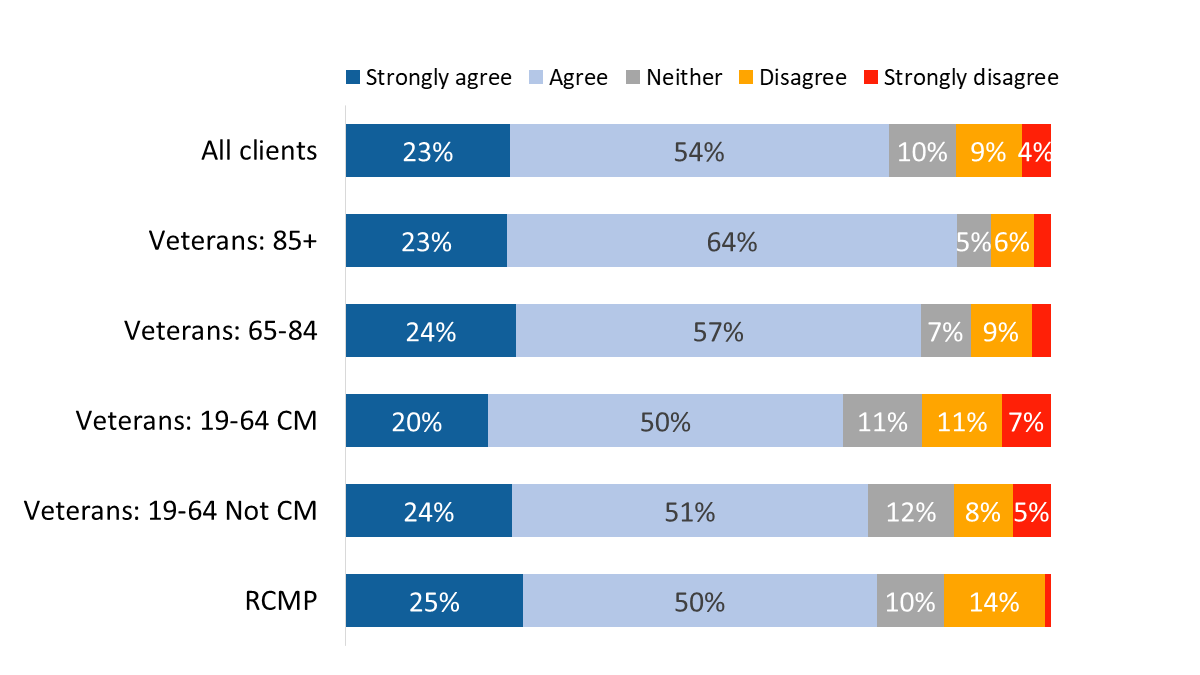
| Strongly agree | Agree | Neither | Disagree | Strongly disagree | |
| RCMP | 25% | 50% | 10% | 14% | 1% |
| Veterans: 19-64 Not CM | 24% | 51% | 12% | 8% | 5% |
| Veterans: 19-64 CM | 20% | 50% | 11% | 11% | 7% |
| Veterans: 65-84 | 24% | 57% | 7% | 9% | 3% |
| Veterans: 85+ | 23% | 64% | 5% | 6% | 2% |
| All clients | 23% | 54% | 10% | 9% | 4% |
Values of 3% or less are not labelled in the graph.
TR_Q02. Agree/Disagree with the following statements about the Treatment Benefits: The time it took to get reimbursed for treatment benefits and services was reasonable Base: n=1,934; respondents in receipt of benefits, excluding “don’t know” and “refused”.
Indigenous respondents (67%) were less likely than non-Indigenous respondents (78%) to agree that the time it took to get reimbursed for treatment benefits and services was reasonable.
A substantial majority of respondents in the Treatment Benefit Program (85%) said they were able to access the treatment benefits they needed. Compared to Veterans aged 85+ (9%), case managed Veterans (18%), non-case managed Veterans (16%) and Veterans 65-84 (16%) were more likely to have not been able to access the treatment benefits they needed.
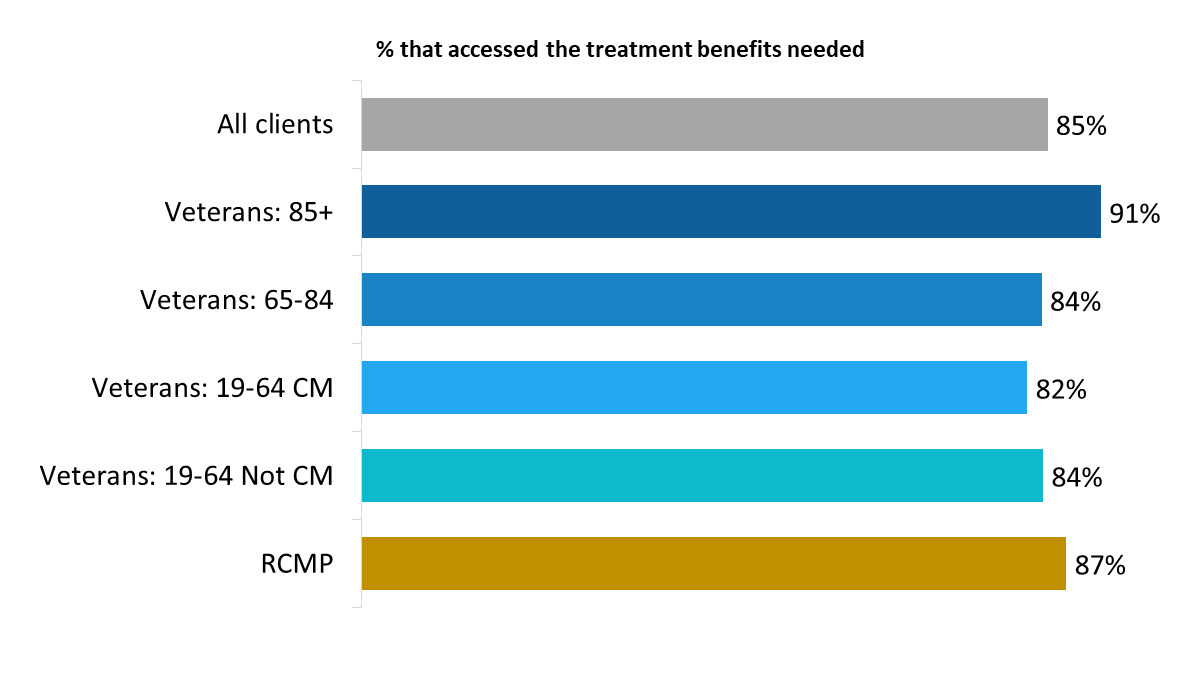
| RCMP | 87% |
| Veterans: 19-64 Not CM | 84% |
| Veterans: 19-64 CM | 82% |
| Veterans: 65-84 | 84% |
| Veterans: 85+ | 91% |
| All clients | 85% |
TR_Q04. Were you able to access the treatment benefits you needed? Base: n=2,130; respondents in receipt of benefits, excluding “don’t know” and “refused”.
Men who are Veterans (86% versus 77% of women Veterans) and those who were released from service between 2014 and 2018 (85% versus 71% of those released between 2019 and 2024) were more likely to have accessed the treatment benefits they need.
Respondents who said they were not able to access the treatment benefits they needed most often attributed this to a benefit and/or service not being approved by VAC (42%), followed by the wait time to access treatment benefits being too long (28%). These are the same reasons mentioned with the greatest frequency in 2022.

| Other | 13% |
| Unaware of benefits available | 7% |
| Accessing benefits is too complex | 8% |
| Poor service from provider(s) | 11% |
| No health care providers located near me | 11% |
| Unsure where to receive assistance | 12% |
| Had to pay out of pocket | 18% |
| Wait time to access benefits is too long | 28% |
| Benefit/service not approved by VAC | 42% |
TR_Q05. Why haven’t you been able to access the benefits you needed? Base: n=281; respondents who have not been able to access treatment benefits, excluding “don’t know” and “refused”.
Additional reasons included having to pay out of pocket (18%), uncertainty about where to receive assistance (12%), poor service from providers and no health care providers located near them (11% each), the perception that accessing benefits is too complex (8%), and lack of awareness of available benefits (7%).
Questions in this section were asked of individuals in the Disability Benefits Program. This included n=3,646 individuals (or 95% of the respondents). The Disability Benefits program compensates for economic and non-economic effects of service-related disability, critical injuries, and death.
Seven in 10 respondents in the Disability Benefits Program said they are satisfied (46%) or very satisfied (24%) with the program. The rest were equally divided between those who said they are neither satisfied nor dissatisfied (15%) and those who expressed some degree of dissatisfaction (15%). Satisfaction was higher among Veterans aged 85+ (87%) and Survivors (84%) and lower among Veterans aged 19 to 64 years (60%).

| Very satisfied | Satisfied | Neither | Dissatisfied | Very dissatisfied | |
| Survivors | 38% | 46% | 9% | 4% | 3% |
| RCMP | 29% | 51% | 11% | 9% | 1% |
| Veterans: 19-64 Not CM | 17% | 43% | 20% | 15% | 5% |
| Veterans: 19-64 CM | 16% | 44% | 21% | 12% | 6% |
| Veterans: 65-84 | 29% | 47% | 11% | 9% | 3% |
| Veterans: 85+ | 37% | 50% | 7% | 6% | 1% |
| All clients | 24% | 46% | 15% | 11% | 4% |
Values of 3% or less are not labelled in the graph.
DB_Q04 Overall, how satisfied are you with the Disability Benefits program? Base: n=3,385; respondents in receipt of disability in-pay or entitlement benefits, excluding “don’t know” and “refused”.
Satisfaction was higher among non-Veterans (81% versus 66% of Veterans) and those who were released from service between 2014 and 2018 (73% versus 61% of those released between 2019 and 2024). Respondents from racialized population groups (23%) were more likely to be dissatisfied with the Disability Benefits program.
A majority (79%; up from 69% in 2022) expressed agreement that the disability benefits received from VAC recognize their service-related disability, though agreement was more likely to be moderate than strong with just 22% strongly agreeing (compared to 43% in 2022). Among the rest, 15% disagreed that the benefits recognize their service-related disability and 7% were neutral, neither agreeing nor disagreeing.
Case managed Veterans (75%) and non-case managed Veterans (73%) were less likely than other respondents to agree that these benefits recognize their service-related disability:
| Strongly agree | Agree | Neither | Disagree | Strongly disagree | |
| Survivors | 20% | 67% | 6% | 6% | 1% |
| RCMP | 29% | 56% | 5% | 8% | 1% |
| Veterans: 19-64 Not CM | 20% | 53% | 9% | 13% | 5% |
| Veterans: 19-64 CM | 21% | 54% | 8% | 11% | 6% |
| Veterans: 65-84 | 23% | 59% | 4% | 12% | 3% |
| Veterans: 85+ | 20% | 70% | 3% | 6% | 2% |
| All clients | 22% | 57% | 7% | 11% | 4% |
Values of 3% or less are not labelled in the graph.
DB_Q02PIP. Agree/Disagree with the following statements about the Disability Benefits program: The disability benefits I receive from VAC recognize my service-related disability. Base: n=3,159; respondents in receipt of disability in-pay or entitlement benefits, excluding “don’t know” and “refused”.
The following subgroups were more likely to agree that the disability benefits they receive from VAC recognize their service-related disability: non-Veterans (85% versus 77% of Veterans) and those who were released from service between 2014 and 2018 (81% versus 74% of those released between 2019 and 2024).
Fewer respondents agreed that disability benefits compensate them for the effects of their service-related disability. Two-thirds (67%) feel compensated, while nearly one-quarter (22%) disagreed that such benefits compensate them for the effects of their service-related disability. The rest (10%) were neutral, neither agreeing nor disagreeing. The proportion of respondents strongly agreeing (17%) that their disability benefits compensate them for the effects of their service-related disability is lower than it was in 2022 (35%).
Veterans aged 85+ (88%) were the most likely to agree that disability benefits compensate for their service-related disability. In contrast, Veterans 19-64 (29%) and case managed Veterans (27%) were more likely than other respondents to feel that these benefits do not compensate for the effects of their service-related disability.
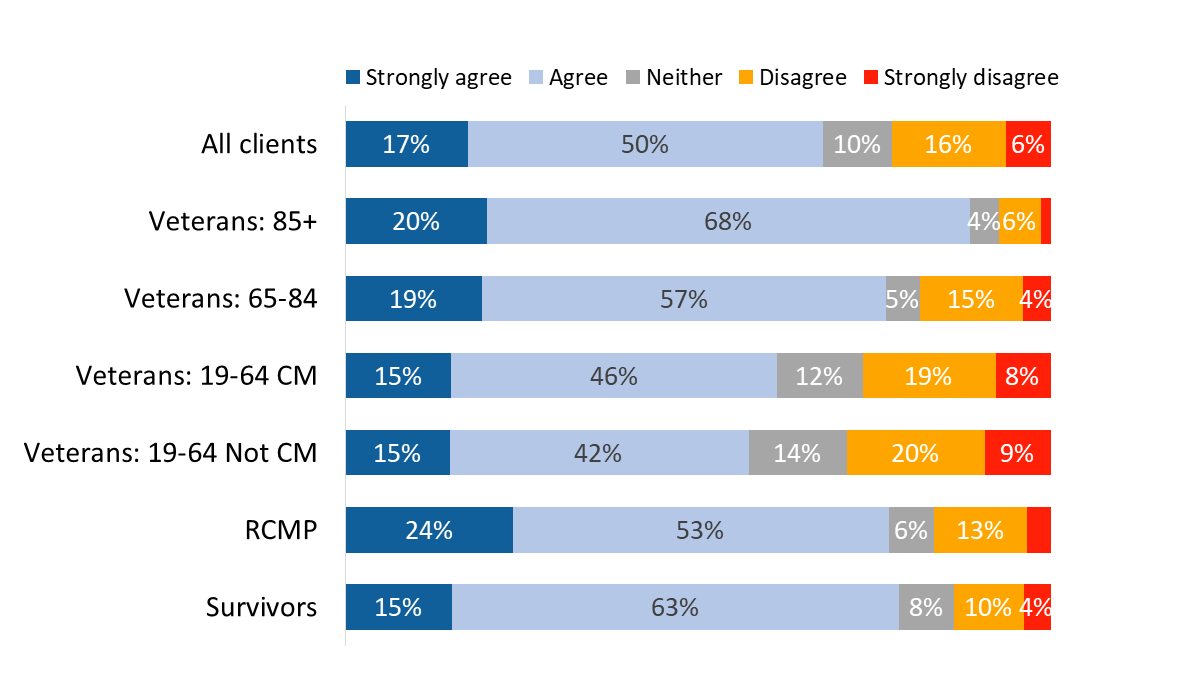
| Strongly agree | Agree | Neither | Disagree | Strongly disagree | |
| Survivors | 15% | 63% | 8% | 10% | 4% |
| RCMP | 24% | 53% | 6% | 13% | 3% |
| Veterans: 19-64 Not CM | 15% | 42% | 14% | 20% | 9% |
| Veterans: 19-64 CM | 15% | 46% | 12% | 19% | 8% |
| Veterans: 65-84 | 19% | 57% | 5% | 15% | 4% |
| Veterans: 85+ | 20% | 68% | 4% | 6% | 1% |
| All clients | 17% | 50% | 10% | 16% | 6% |
Values of 3% or less are not labelled in the graph.
DB_Q03PIP. Agree/Disagree with the following statements about the Disability Benefits program: The disability benefits I receive from VAC compensate me for the effects of my service-related disability. Base: n=3,183; respondents in receipt of disability in-pay or entitlement benefits, excluding “don’t know” and “refused”.
The following subgroups were more likely to agree that the disability benefits they receive from VAC compensate them for the effects of my service-related disability: non-Veterans (77% versus 65% of Veterans) and those who were released from service between 2014 and 2018 (72% versus 62% of those released between 2019 and 2024). Respondents from racialized population groups (28%) were more likely to disagree, indicating that the benefits they receive do not compensate for the effects of their service-related disability.
Questions in this section were asked of individuals in the VAC Rehabilitation Services and Vocational Assistance Program (Rehabilitation Program). This included n=562 individuals (or 15% of respondents). The program provides personalized support to assist Veterans and their families with the transition to life after service, including access to medical, psycho-social and vocational services.
As Figure 49 shows, most respondents agreed that the level of participation expected of them was realistic (78%) and that they understood what was expected of them through their rehabilitation plan (76%). Over two-thirds agreed that their participation in the program has helped improve their quality of life (69%) and has been beneficial to their family or other people who support them (69%). Assessments of the Rehabilitation Program were moderately positive, however, as opposed to strongly positive, with fewer respondents reporting that they strongly agreed.
Views were mixed as to whether participation in Rehabilitation Services has helped respondents prepare to re-enter the workforce. The largest proportion of respondents (41%) disagreed that participation has helped them prepare to re-enter the workforce, while one-third (33%) agreed that it has and just over one-quarter (26%) were neutral.
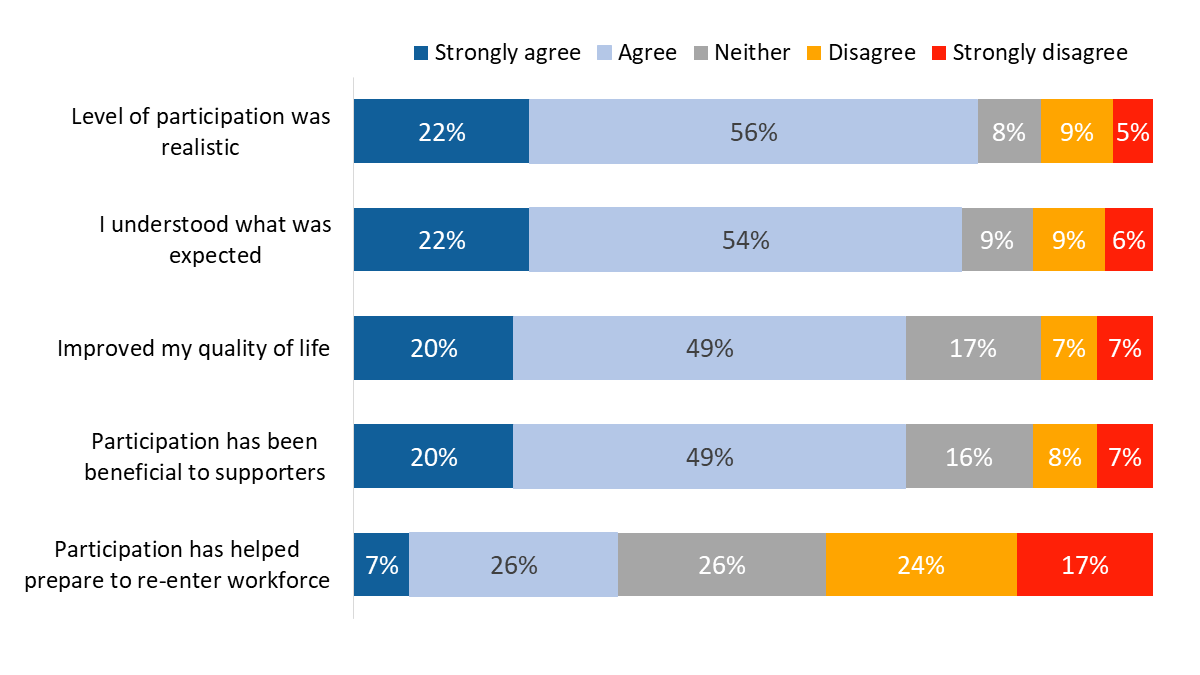
| Strongly agree | Agree | Neither | Disagree | Strongly disagree | |
| Participation has helped prepare to re-enter workforce | 7% | 26% | 26% | 24% | 17% |
| Participation has been beneficial to supporters | 20% | 49% | 16% | 8% | 7% |
| Improved my quality of life | 20% | 49% | 17% | 7% | 7% |
| I understood what was expected | 22% | 54% | 9% | 9% | 6% |
| Level of participation was realistic | 22% | 56% | 8% | 9% | 5% |
RE_Q02-Q05, Q08. Agree/Disagree with the following statements about the VAC Rehabilitation Services and Vocational Assistance program. Base: n=422-529; respondents in the Rehabilitation Program, excluding “don’t know” and “refused”.
Eligible respondents were asked in which of the following areas their participation in Rehabilitation Services had a positive impact on their functionality:
Most identified five areas positively impacted by their participation in Rehabilitation Services, though the size of the majority varied by area. A positive impact was most likely to be seen in the area of financial security (73%), followed by mental functioning (70%), and family relationships (69%). Smaller majorities identified a positive impact in physical functioning (63%), personal productivity (61%), and social adjustment (55%). In two areas, fewer than half the respondents said their participation in Rehabilitation Services has had a positive impact on their functionality: community participation (42%) and employment (24%).
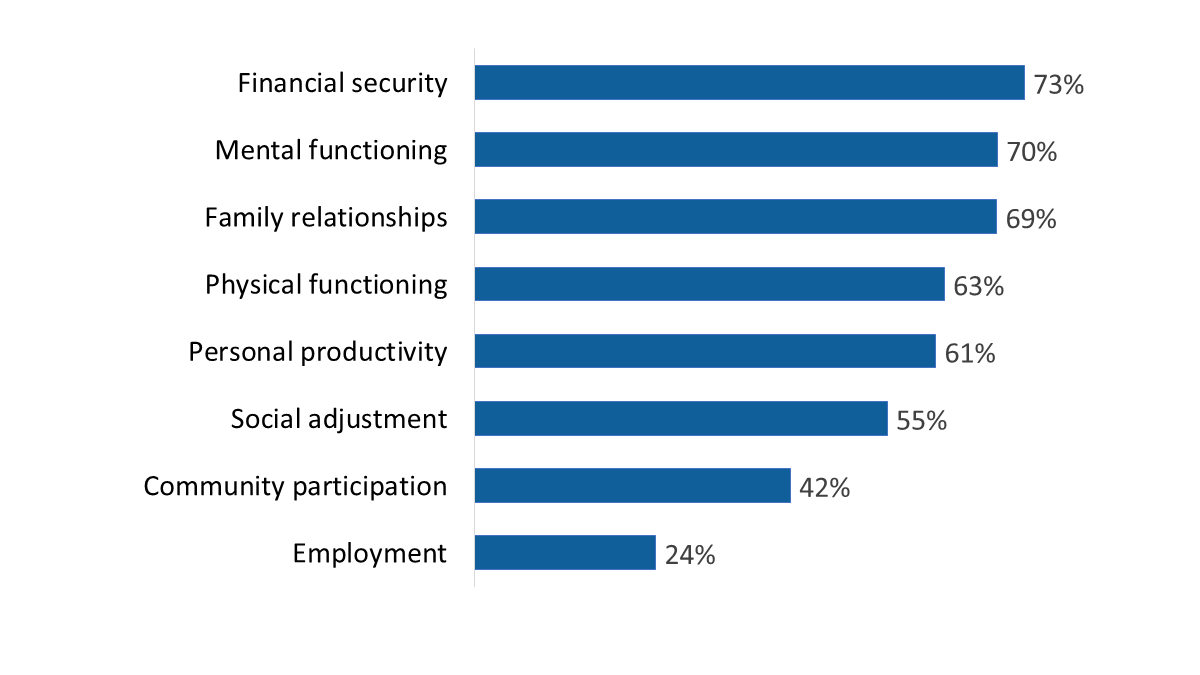
| Employment | 24% |
| Community participation | 42% |
| Social adjustment | 55% |
| Personal productivity | 61% |
| Physical functioning | 63% |
| Family relationships | 69% |
| Mental functioning | 70% |
| Financial security | 73% |
RE_Q06_1-8. In which of the following areas has your participation in rehabilitation services had a positive impact on your functionality? Base: n=359-477; respondents in the Rehabilitation Program, excluding “don’t know” and “refused”.
Asked in an open-ended way if there are any other areas in which participation in Rehabilitation Services has had a positive impact on their functionality, over three-quarters (78%) said no. Areas in which a positive impact was seen included mental health (10%), physical health (8%), and connectedness to community services (2%).
Eligible respondents were then asked in which of these same areas their participation in Rehabilitation Services had a negative impact on their functionality:
Negative impacts on functionality were most likely to be identified in the areas of mental functioning and employment (29% each). A Figure 51 shows, the proportion of respondents who identified a negative impact in other areas ranged from 18% in the area of community participation to 24% in the areas of physical functioning and personal productivity.
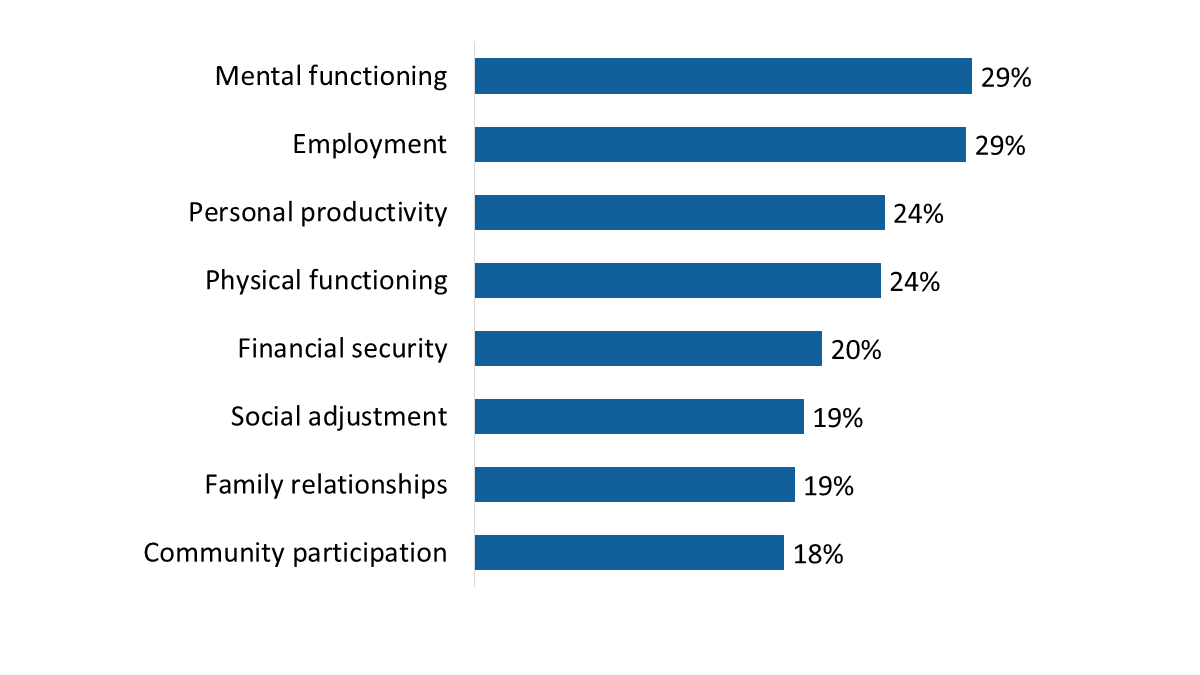
| Community participation | 18% |
| Family relationships | 19% |
| Social adjustment | 19% |
| Financial security | 20% |
| Physical functioning | 24% |
| Personal productivity | 24% |
| Employment | 29% |
| Mental functioning | 29% |
RE_Q07_1-8. In which of the following areas has your participation in rehabilitation services had a negative impact on your functionality? Base: n=362-476; respondents in the Rehabilitation Program, excluding “don’t know” and “refused”.
Asked in an open-ended way if there are any other areas in which participation in Rehabilitation Services has had a negative impact on their functionality, the vast majority (92%) said no. Areas in which a negative impact was seen included physical limitations (3%), wait times for care that are too long (3%), and increased stress/anxiety (2%).
Questions in this section were asked of individuals eligible for the Education and Training Benefit (ETB). This included n=33 surveyed individuals (or less than 1% of respondents). The ETB is a taxable benefit that provides funding to support education and training opportunities for those who have been released from the Canadian Armed Forces.
Extreme caution should be exercised when interpreting results in this section given the very small sample size.
Over half of those eligible to receive the Education and Training Benefit (55%) said they are currently receiving it.
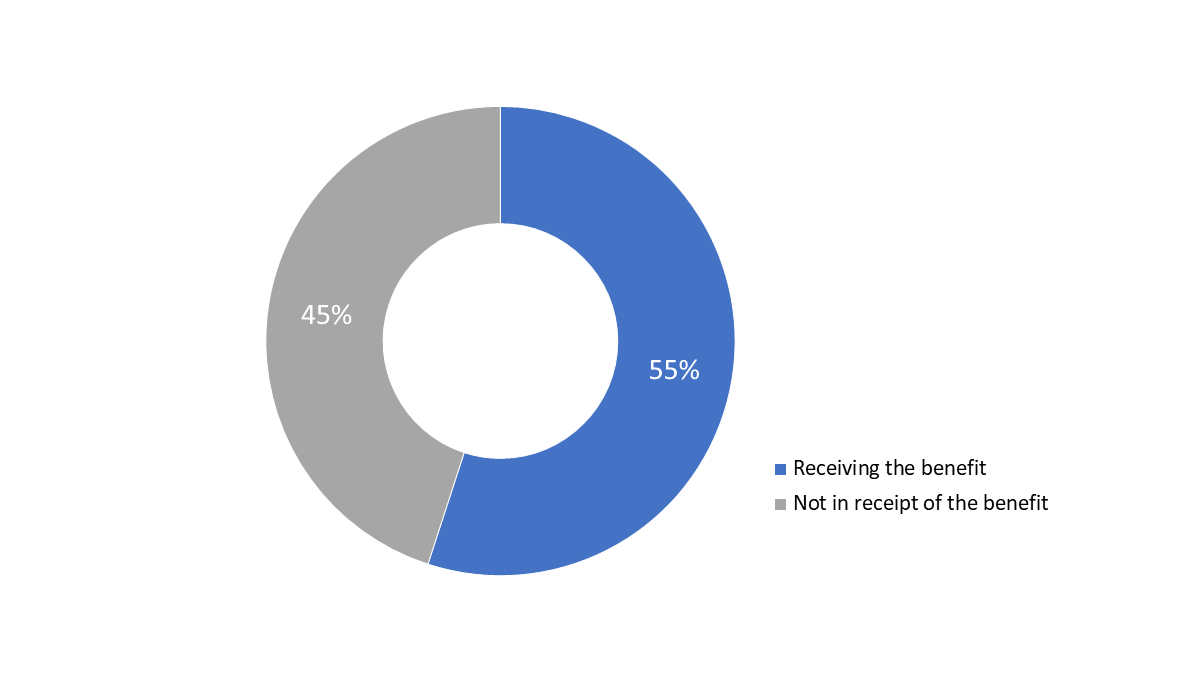
| Receiving the benefit | 55% |
| Not in receipt of the benefit | 45% |
ET_Q01. Have you received, or are you receiving, the Education and Training Benefit? Base: n=33; respondents in receipt of the Education and Training Benefit, excluding “don’t know” and “refused”.
Those in receipt of the Education and Training Benefit identified the following as their main goal when participating: education, employment, and a sense of purpose. Most of those receiving the benefit expressed satisfaction with it.
The questions in this section were asked of all respondents (n=3,842).
Close to two-thirds of respondents said they have little familiarity (26%) or no familiarity (37%) with the Office of the Veterans Ombud. Conversely, just over one-third are at least somewhat familiar with the office. Specifically, 23% said they are somewhat familiar and 14% said they are familiar or very familiar with the office. Veterans aged 85+ (45%) and Survivors (43%) were more likely than other respondents to be not at all familiar with the Office of the Veterans Ombud:
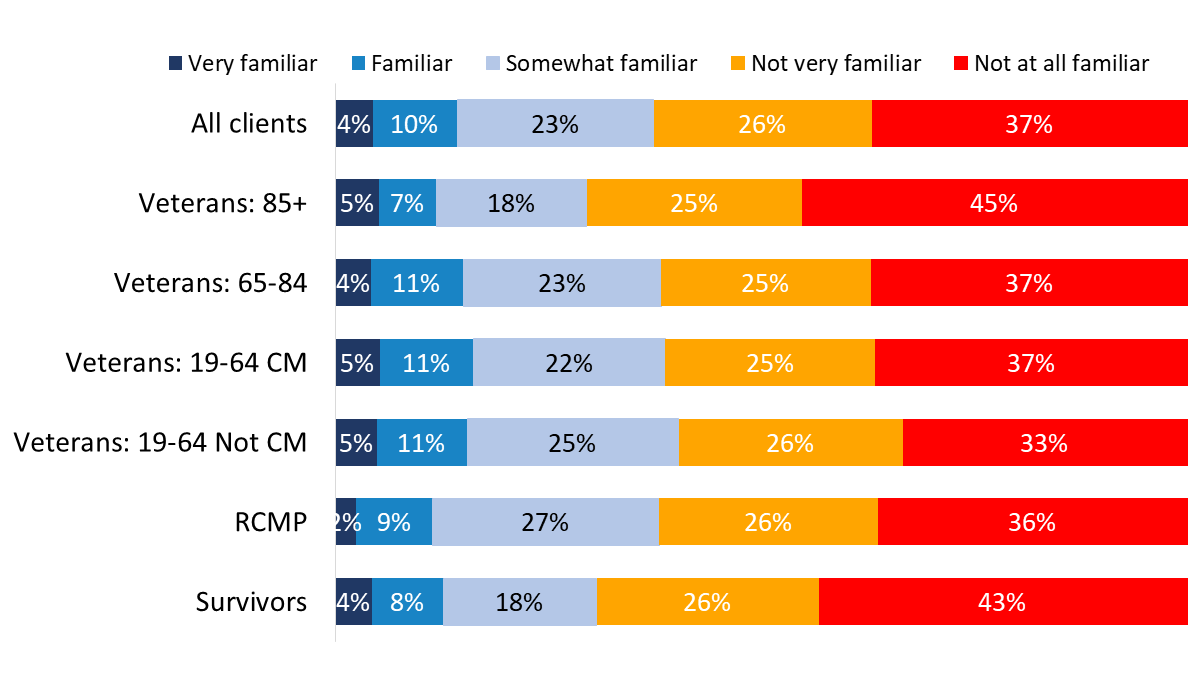
| Very familiar | Familiar | Somewhat familiar | Not very familiar | Not at all familiar | |
| Survivors | 4% | 8% | 18% | 26% | 43% |
| RCMP | 2% | 9% | 27% | 26% | 36% |
| Veterans: 19-64 Not CM | 5% | 11% | 25% | 26% | 33% |
| Veterans: 19-64 CM | 5% | 11% | 22% | 25% | 37% |
| Veterans: 65-84 | 4% | 11% | 23% | 25% | 37% |
| Veterans: 85+ | 5% | 7% | 18% | 25% | 45% |
| All clients | 4% | 10% | 23% | 26% | 37% |
VO_Q01. How familiar are you with the services of the Office of the Veterans Ombud? Base: n=3,718; all respondents, excluding “don’t know” and “refused”.
Respondents were informed that the role of the Office of the Veterans Ombud is to review complaints and challenge the policies and decisions of Veterans Affairs Canada where it finds individual or systemic unfairness. Following this, they were asked to what extent they agree or disagree with the following statement about the office: “I understand the purpose and the role of the Office of the Veterans Ombud”.
In response, over half (57%) said they agreed with the statement, and a further 14% said they strongly agreed with it. The rest were divided between those who disagreed with the statement (17%) and those who neither agreed nor disagreed with it (13%). Survivors (77%), Veterans 85+ (76%) and Veterans 65-84 (75%) were more likely than Veterans 19-64 who are case managed (67%), Veterans 19-64 who are not case managed (67%) and RCMP (69%) to indicate that they understand the purpose and role of the Office of the Veterans Ombud.
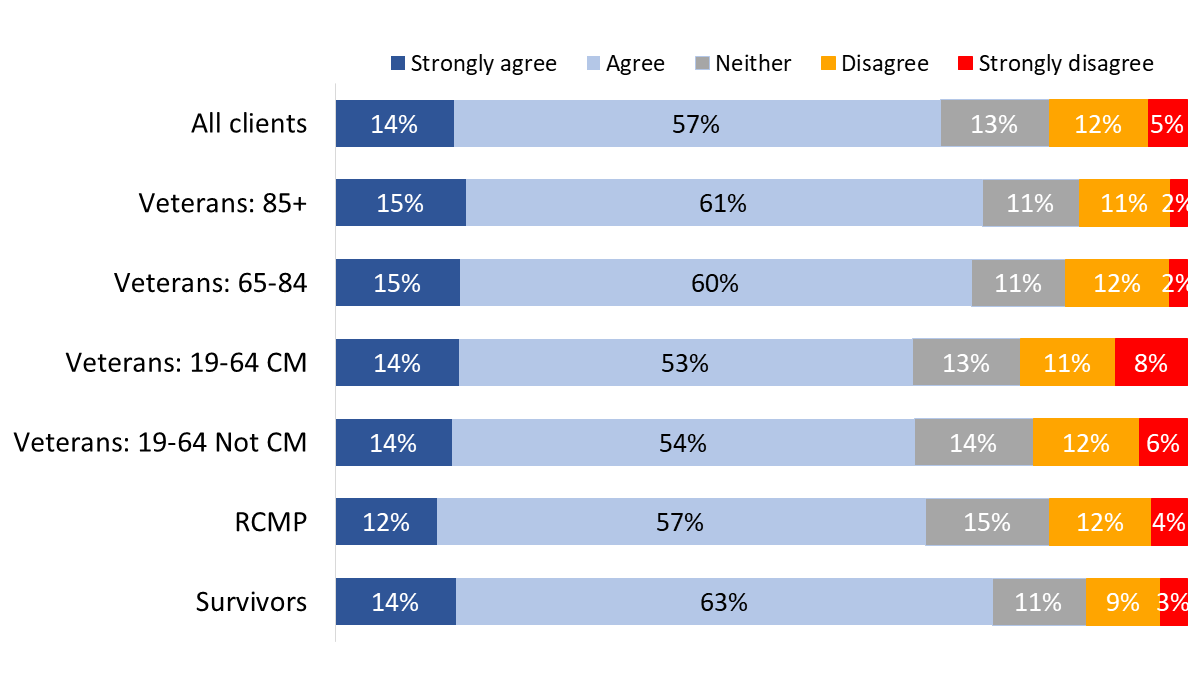
| Strongly agree | Agree | Neither | Disagree | Strongly disagree | |
| Survivors | 14% | 63% | 11% | 9% | 3% |
| RCMP | 12% | 57% | 15% | 12% | 4% |
| Veterans: 19-64 Not CM | 14% | 54% | 14% | 12% | 6% |
| Veterans: 19-64 CM | 14% | 53% | 13% | 11% | 8% |
| Veterans: 65-84 | 15% | 60% | 11% | 12% | 2% |
| Veterans: 85+ | 15% | 61% | 11% | 11% | 2% |
| All clients | 14% | 57% | 13% | 12% | 5% |
VO_Q02. To what extent do you agree or disagree with the following about the Office: I understand the purpose and the role of the Office of the Veterans Ombud. Base: n=3,345; all respondents, excluding “don’t know” and “refused”.
Respondents from racialized population groups (63%) were less likely to say they understand the purpose and role of the Office of the Veterans Ombud.
Just over three-quarters of respondents (76%) said that they would contact the Office of the Veterans Ombud if they have a complaint about VAC. The rest were almost equally divided between those who said they might do this (13%) and those who said they would not (11%). RCMP (80%) were more likely than case managed Veterans (73%) to say they would contact the Office of the Veterans Ombud.
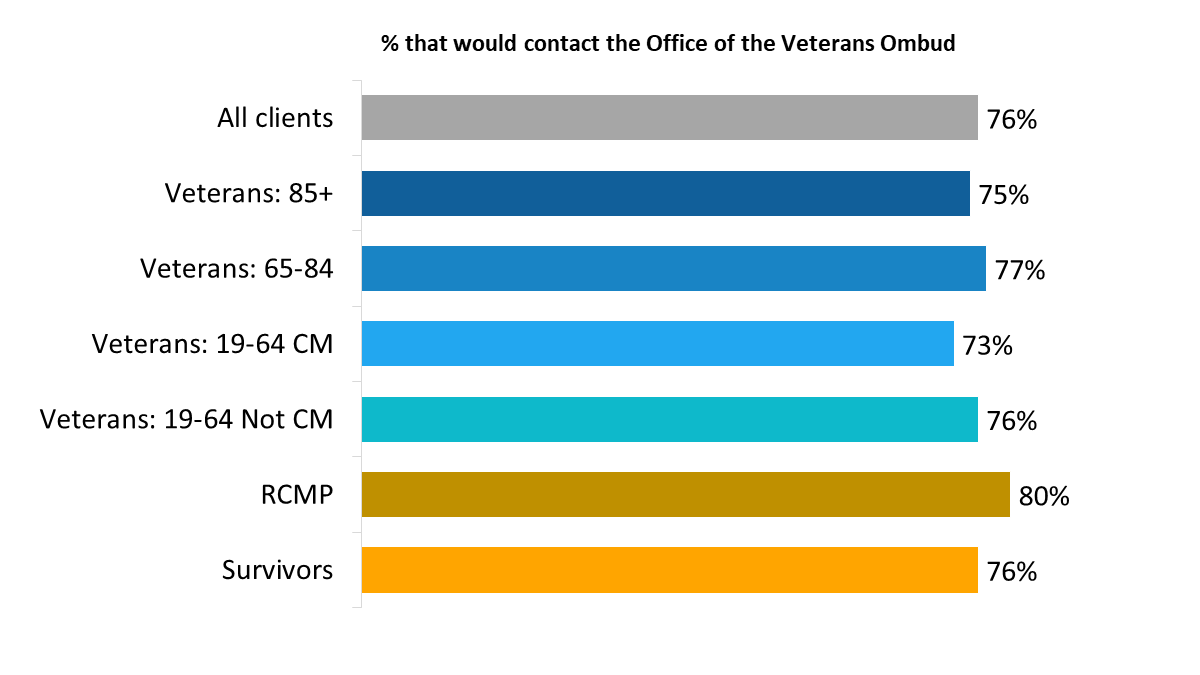
| Survivors | 76% |
| RCMP | 80% |
| Veterans: 19-64 Not CM | 76% |
| Veterans: 19-64 CM | 73% |
| Veterans: 65-84 | 77% |
| Veterans: 85+ | 75% |
| All clients | 76% |
VO_Q03. Would you contact the Office of the Veterans Ombud if you have a complaint about VAC? Base: n=3,483; all respondents, excluding “don’t know” and “refused”.
The questions in this section were asked of all survey respondents (n=3,842).
Respondents were asked whether they strongly disagree, disagree, neither disagree nor agree, agree, or strongly agree with the following statements VAC’s recognition and commemorative initiatives:
Most respondents agreed with all three statements, with agreement more likely to be moderate than strong. Respondents were most likely to agree with two statements: that they are satisfied with the way VAC’s commemorative initiatives honour those who served and preserve the memory of their achievements and sacrifices (74%), and that these initiatives raise awareness of the diverse population of Veterans who served both at home and abroad (70%). A smaller majority (60%) agreed that VAC’s recognition initiatives raise awareness of modern conflicts. Respondents who did not agree with these statements were more likely to say they neither agree nor disagree with them than to say they disagree with them.
As has been the case with other areas assessed, case managed Veterans (64%) and Veterans 19 to 64 years old age (63%) were less likely than other respondents to offer a positive assessment of the way VAC’s commemorative initiatives honour those who served our country and preserve the memory of their achievements and sacrifices.

| Strongly agree | Agree | Neither | Disagree | Strongly disagree | |
| Survivors | 24% | 66% | 5% | 3% | 2% |
| RCMP | 18% | 58% | 20% | 2% | 1% |
| Veterans: 19-64 Not CM | 19% | 44% | 24% | 10% | 5% |
| Veterans: 19-64 CM | 17% | 47% | 23% | 8% | 6% |
| Veterans: 65-84 | 24% | 59% | 7% | 7% | 2% |
| Veterans: 85+ | 19% | 69% | 7% | 4% | 0% |
| All clients | 20% | 54% | 16% | 7% | 3% |
Values of 3% or less are not labelled in the graph.
CI_Q02A. Agree/Disagree with the following statement about VAC's recognition and commemorative initiatives: “I am satisfied with the way VAC’s commemorative initiatives honour those who served our country and preserve the memory of their achievements and sacrifices.” Base: n=3,167; all respondents, excluding “don’t know” and “refused”.
Non-Veterans (84% versus 70% of Veterans) and those who were released from service between 2014 and 2018 (76% versus 61% of those released between 2019 and 2024) were more likely to be satisfied with the way VAC’s commemorative initiatives honour those who served our country and preserve the memory of their achievements and sacrifices.
Perceptions of VAC’s recognition initiatives to raise awareness of modern conflicts were more positive among Veterans 85+ (78%), Survivors (74%) and Veterans 65-84 (71%).
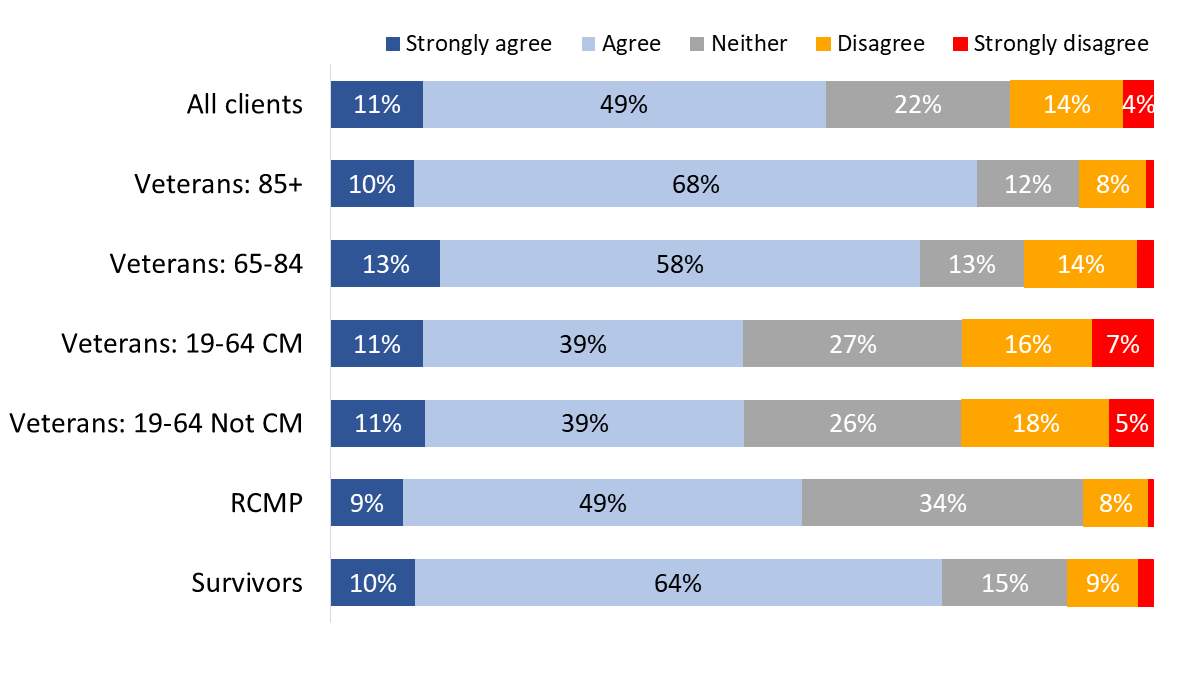
| Strongly agree | Agree | Neither | Disagree | Strongly disagree | |
| Survivors | 10% | 64% | 15% | 9% | 2% |
| RCMP | 9% | 49% | 34% | 8% | 1% |
| Veterans: 19-64 Not CM | 11% | 39% | 26% | 18% | 5% |
| Veterans: 19-64 CM | 11% | 39% | 27% | 16% | 7% |
| Veterans: 65-84 | 13% | 58% | 13% | 14% | 2% |
| Veterans: 85+ | 10% | 68% | 12% | 8% | 1% |
| All clients | 11% | 49% | 22% | 14% | 4% |
Values of 3% or less are not labelled in the graph.
CI_Q02B. Agree/Disagree with the following statement about VAC's recognition and commemorative initiatives: “VAC’s recognition initiatives raise awareness of modern conflicts”. Base: n=3,003; all respondents, excluding “don’t know” and “refused”.
Non-Veterans (66% versus 58% of Veterans), men who are Veterans (60% versus 50% of women Veterans) and those who were released from service between 2014 and 2018 (63% versus 46% of those released between 2019 and 2024) were more likely to agree that VAC’s recognition initiatives raise awareness of modern conflicts.
Once again, perceptions of VAC’s recognition initiatives focused on diverse populations were more positive among Survivors (85%), Veterans 85+ (84%), and Veterans 65-84 (79%).
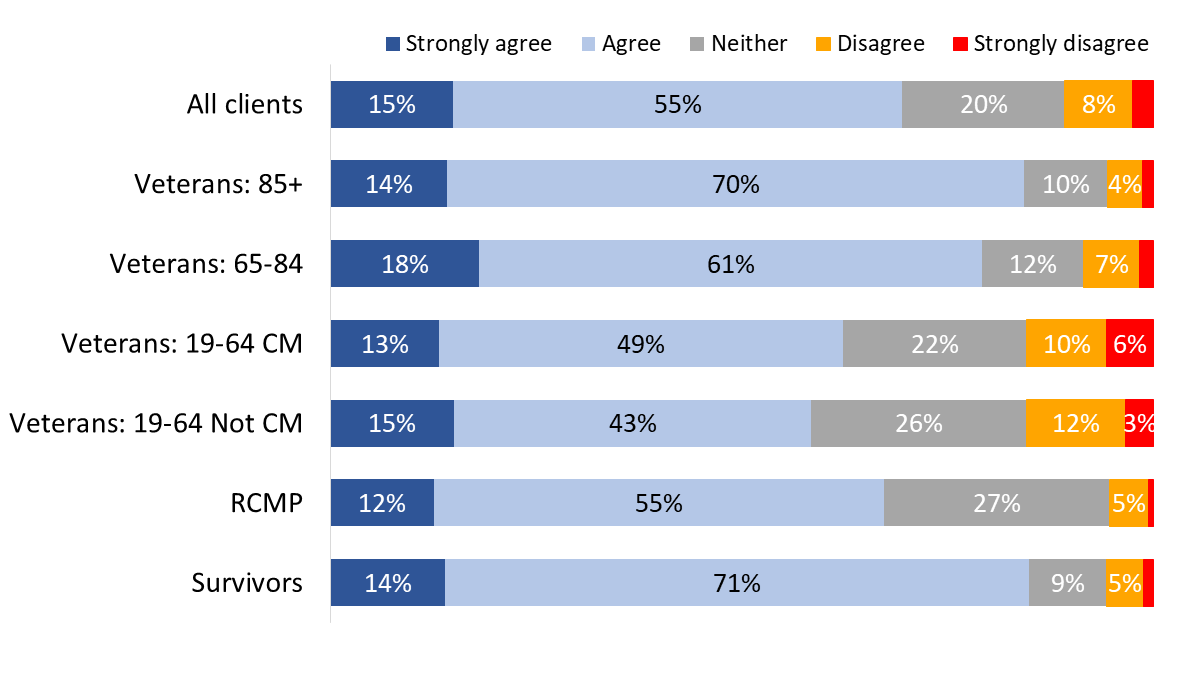
| Strongly agree | Agree | Neither | Disagree | Strongly disagree | |
| Survivors | 14% | 71% | 9% | 5% | 1% |
| RCMP | 12% | 55% | 27% | 5% | 1% |
| Veterans: 19-64 Not CM | 15% | 43% | 26% | 12% | 3% |
| Veterans: 19-64 CM | 13% | 49% | 22% | 10% | 6% |
| Veterans: 65-84 | 18% | 61% | 12% | 7% | 2% |
| Veterans: 85+ | 14% | 70% | 10% | 4% | 1% |
| All clients | 15% | 55% | 20% | 8% | 3% |
Values of 3% or less are not labelled in the graph.
CI_Q02C. Agree/Disagree with the following statement about VAC's recognition and commemorative initiatives: “VAC’s commemoration and recognition initiatives raise awareness of the diverse population of Veterans who served both at home and abroad”. Base: n=3,347; all respondents, excluding “don’t know” and “refused”.
Asked what types of commemorative initiatives they are likely to engage or take part in over the next year, the most frequently given response, and the only one identified by a majority, was Remembrance Day (62%). This was followed, in descending order of frequency, by wearing a poppy (36%), participating in a commemorative ceremony in their community (28%), and observing a moment of silence (24%). Other activities were mentioned by fewer than one in 10 respondents and can be found in Figure 59. Notably, two in 10 (21%) did not specify anything they were likely to do.
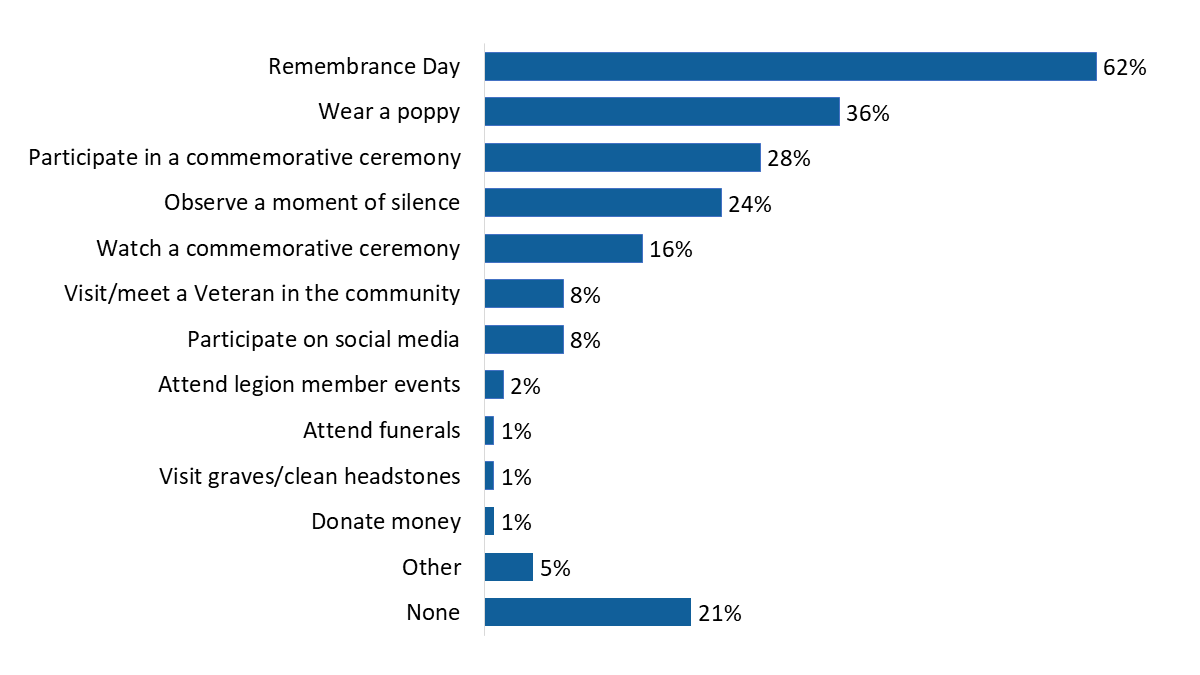
| None | 21% |
| Other | 5% |
| Donate money | 1% |
| Visit graves/clean headstones | 1% |
| Attend funerals | 1% |
| Attend legion member events | 2% |
| Participate on social media | 8% |
| Visit/meet a Veteran in the community | 8% |
| Watch a commemorative ceremony | 16% |
| Observe a moment of silence | 24% |
| Participate in a commemorative ceremony | 28% |
| Wear a poppy | 36% |
| Remembrance Day | 62% |
CI_Q03. Over the next year, what types of commemorative initiatives are you likely to engage or take part in? Base: n=3,529; all respondents, excluding “don’t know” and “refused”.
Respondents from racialized population groups were less likely to say they will wear a poppy (24%), observe a moment of silence (16%), or watch a commemorative ceremony virtually on or TV (9%).
The questions in this section were asked of all survey respondents (n=3,842).
Respondents were asked whether they strongly disagree, disagree, neither disagree nor agree, agree, or strongly agree with the following statements about VAC’s Funeral and Burial Program:
In response, a substantial majority (81%; up from 68% in 2022) indicated that they were satisfied that the estates of Veterans have access to financial assistance through VAC’s Funeral and Burial Program, and almost as many (77%; up from 68% in 2022) indicated that they were satisfied with the program that provides funding for funerals and burials to eligible Veterans. In both cases, satisfaction was more likely to be moderate than strong. On both issues, respondents who did not express satisfaction were more likely to say they were neither satisfied nor dissatisfied than to express dissatisfaction.
Veterans 85+ (89%), Survivors (87%), and Veterans 65-84 (86%) were more likely than Veterans 19-64 (74% of those who are case managed and 77% of those who are not case managed) and RCMP (75%) to be satisfied that the estates of Veterans have access to financial assistance through VAC´s Funeral and Burial Program.
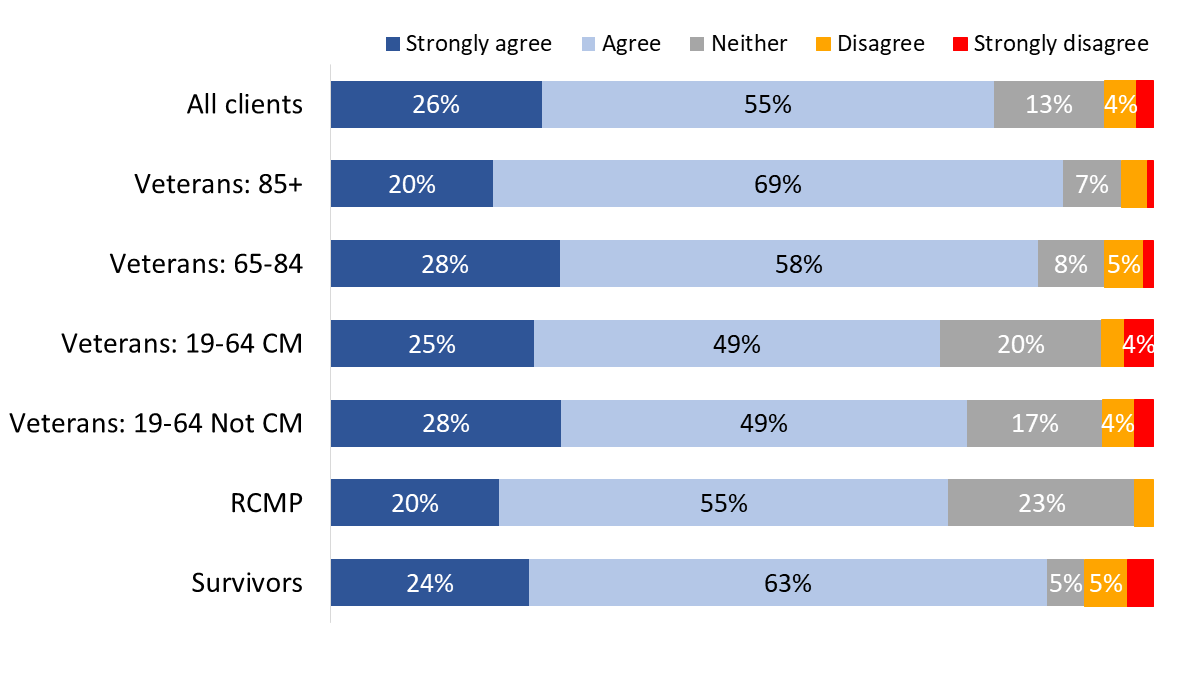
| Strongly agree | Agree | Neither | Disagree | Strongly disagree | |
| Survivors | 24% | 63% | 5% | 5% | 3% |
| RCMP | 20% | 55% | 23% | 2% | |
| Veterans: 19-64 Not CM | 28% | 49% | 17% | 4% | 2% |
| Veterans: 19-64 CM | 25% | 49% | 20% | 3% | 4% |
| Veterans: 65-84 | 28% | 58% | 8% | 5% | 1% |
| Veterans: 85+ | 20% | 69% | 7% | 3% | 1% |
| All clients | 26% | 55% | 13% | 4% | 2% |
Values of 3% or less are not labelled in the graph.
FB_Q02A Agree/Disagree with the statement about Funeral and Burial Program: “I am satisfied that the estates of Veterans have access to financial assistance through VAC´s Funeral and Burial Program”. Base: n=2,887; all respondents; all respondents, excluding “don’t know” and “refused”.
Veterans 85+ (89%), Survivors (87%), and Veterans 65-84 (84%) were more likely than Veterans 19-64 and RCMP to be satisfied with the program that provides funding for funerals and burials to eligible Veterans.
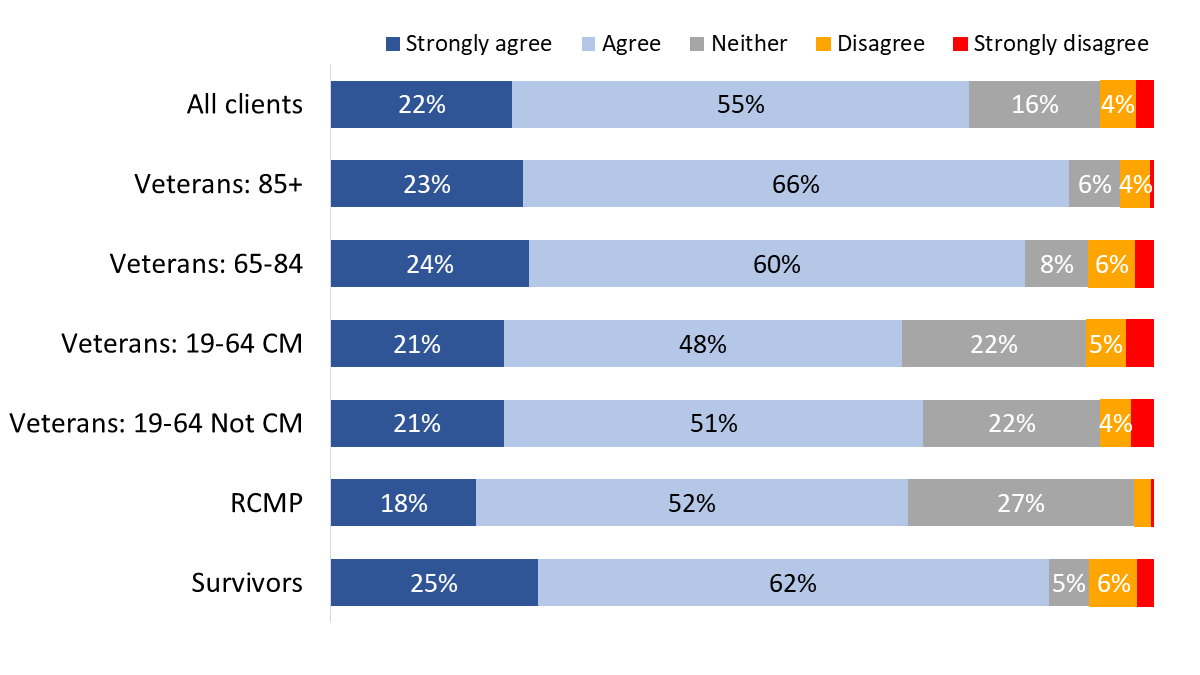
| Strongly agree | Agree | Neither | Disagree | Strongly disagree | |
| Survivors | 25% | 62% | 5% | 6% | 2% |
| RCMP | 18% | 52% | 27% | 2% | 0% |
| Veterans: 19-64 Not CM | 21% | 51% | 22% | 4% | 3% |
| Veterans: 19-64 CM | 21% | 48% | 22% | 5% | 3% |
| Veterans: 65-84 | 24% | 60% | 8% | 6% | 2% |
| Veterans: 85+ | 23% | 66% | 6% | 4% | 0% |
| All clients | 22% | 55% | 16% | 4% | 2% |
Values of 3% or less are not labelled in the graph.
FB_Q02B Agree/Disagree with the statement about Funeral and Burial Program: “I am satisfied with the program that provides funding for funerals and burials to eligible Veterans”. Base: n=2,824; all respondents; all respondents, excluding “don’t know” and “refused”.
The questions in this section were asked of all survey respondents(n=3,842).
One-third of respondents indicated that in the past 12 months their main activity has been working at a job or business. Among this group, the largest proportions said they work in the public sector (37%) and the regular force (34%). The only other sector identified with any frequency was the private sector (15%). Smaller numbers said they are self-employed or entrepreneurs (7%), work in the reserve force (5%), or work in the non-profit sector (2%).
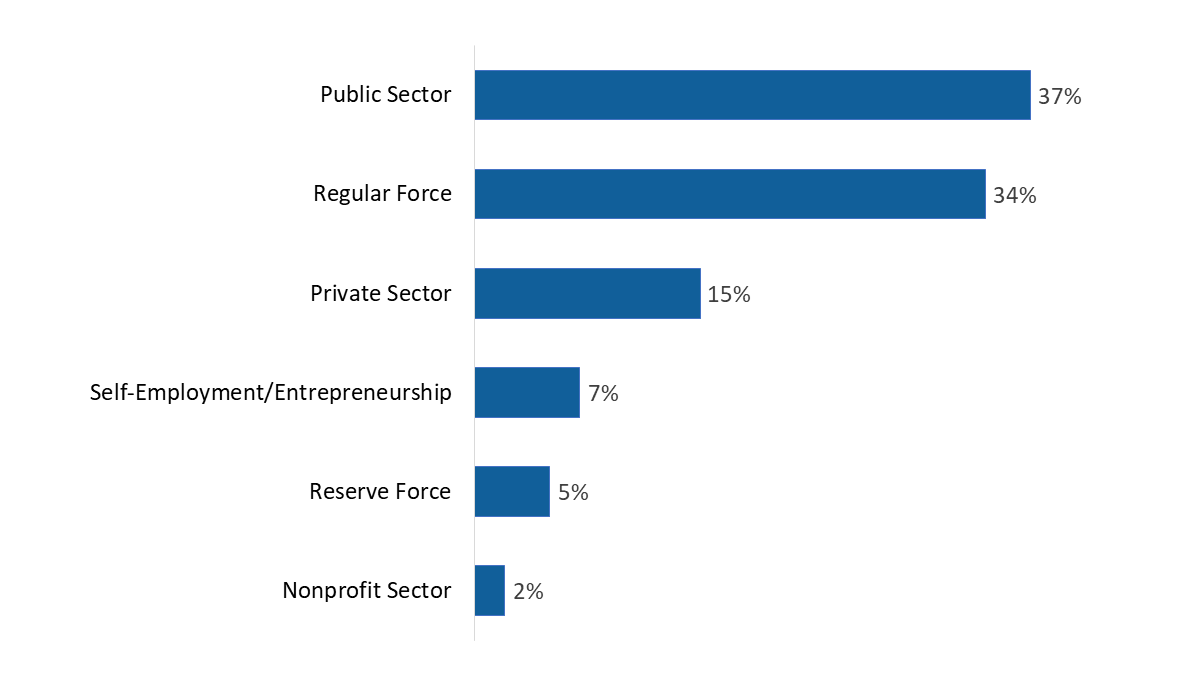
| Nonprofit Sector | 2% |
| Reserve Force | 5% |
| Self-Employment/Entrepreneurship | 7% |
| Private Sector | 15% |
| Regular Force | 34% |
| Public Sector | 37% |
WB_Q12B. Which of the following best reflects the sector in which you work? Base: n=957; respondents who worked in the last 12 months, excluding “don’t know” and “refused”.
The majority of respondents whose main activity over this period has not been working described themselves as retired (62%). Others described their main activity as dealing with a long-term illness (10%), being involved in hobbies/personal interests/recreation (9%), volunteering (5%), doing household work or going to physiotherapy/rehabilitation/medical appointments (4% each), and going to school, caring for children, and providing non-child-related care (2% each).
All respondents were asked how satisfied or dissatisfied they are with the following aspects of their life:
A majority expressed satisfaction with all these aspects of their lives, with the degree of satisfaction more likely to be moderate than strong.
Respondents were most likely to express satisfaction with their housing (89%) and their neighbourhood (88%), with a substantial majority also expressing satisfaction with their relationships with family members (82%) and friends (80%; up from 71% in 2022). In addition, nearly three-quarters expressed satisfaction with their financial situation (74%; up from 61% in 2022) and life in general (74%).
Over two-thirds (70%) expressed satisfaction with their main job or activity, while approximately two-thirds expressed satisfaction with their leisure activities (67%; up from 52% in 2022 and comparable to the 65% reported in 2020) and their overall well-being (65%; up from 56% in 2022 and similar to 2020 when 69% were satisfied with their main job or activity).
The proportion of respondents expressing dissatisfaction with these aspects of their lives ranged from 6% to 21% and were highest in relation to leisure activities and overall well-being (21% each).
Figures 63 to 71 present the ratings for each area, overall and for each group.
Satisfaction with their main job or activity was higher among Veterans aged 85+ (86%), Survivors (83%), and Veterans aged 65-84 (82%).
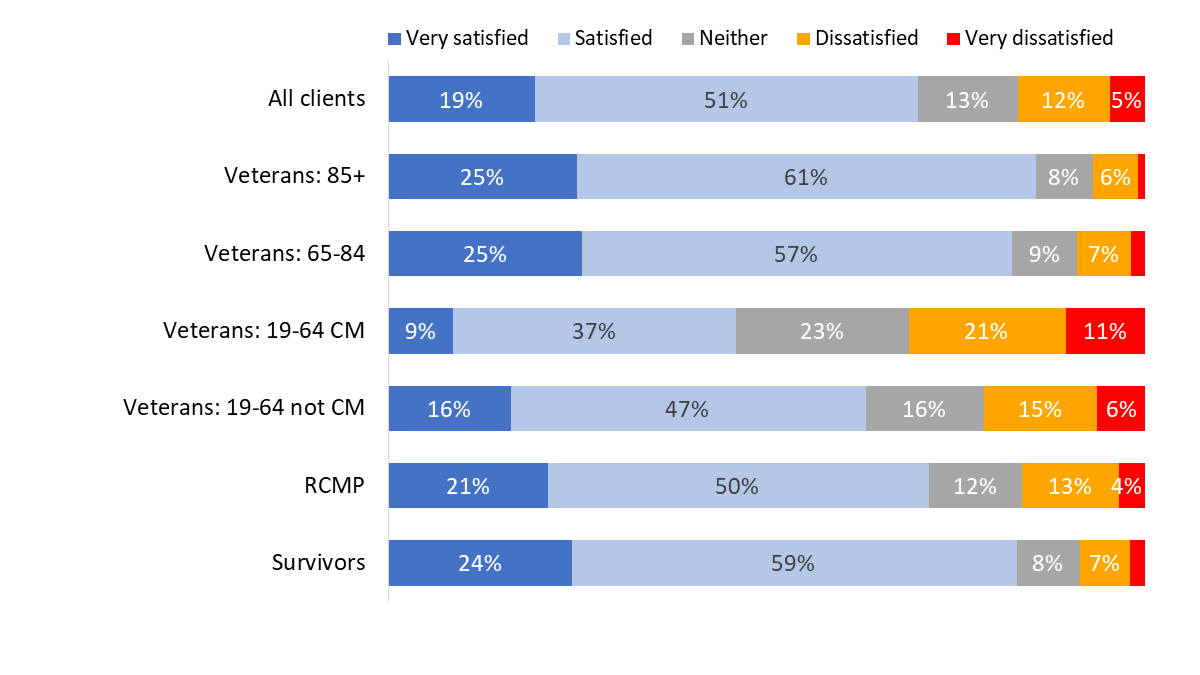
| Very satisfied | Satisfied | Neither | Dissatisfied | Very dissatisfied | |
| Survivors | 24% | 59% | 8% | 7% | 2% |
| RCMP | 21% | 50% | 12% | 13% | 4% |
| Veterans: 19-64 not CM | 16% | 47% | 16% | 15% | 6% |
| Veterans: 19-64 CM | 9% | 37% | 23% | 21% | 11% |
| Veterans: 65-84 | 25% | 57% | 9% | 7% | 2% |
| Veterans: 85+ | 25% | 61% | 8% | 6% | 1% |
| All clients | 19% | 51% | 13% | 12% | 5% |
Values of 3% or less are not labelled in the graph.
WB_Q02. How satisfied you are with each of the following aspects of your life...your main job or activity. Base: n=3,420; all respondents, excluding “don’t know” and “refused”.
Non-Veterans (77% versus 67% of Veterans) and those who were released from service between 2014 and 2018 (73% versus 59% of those released between 2019 and 2024) were more likely to be satisfied with their main job and activity. Indigenous respondents (62%) were less likely than non-Indigenous respondents (75%) to express satisfaction with this aspect of their life.
Satisfaction with life in general was higher among Veterans aged 85+ (89%), Survivors (87%), and Veterans aged 65-84 (85%).
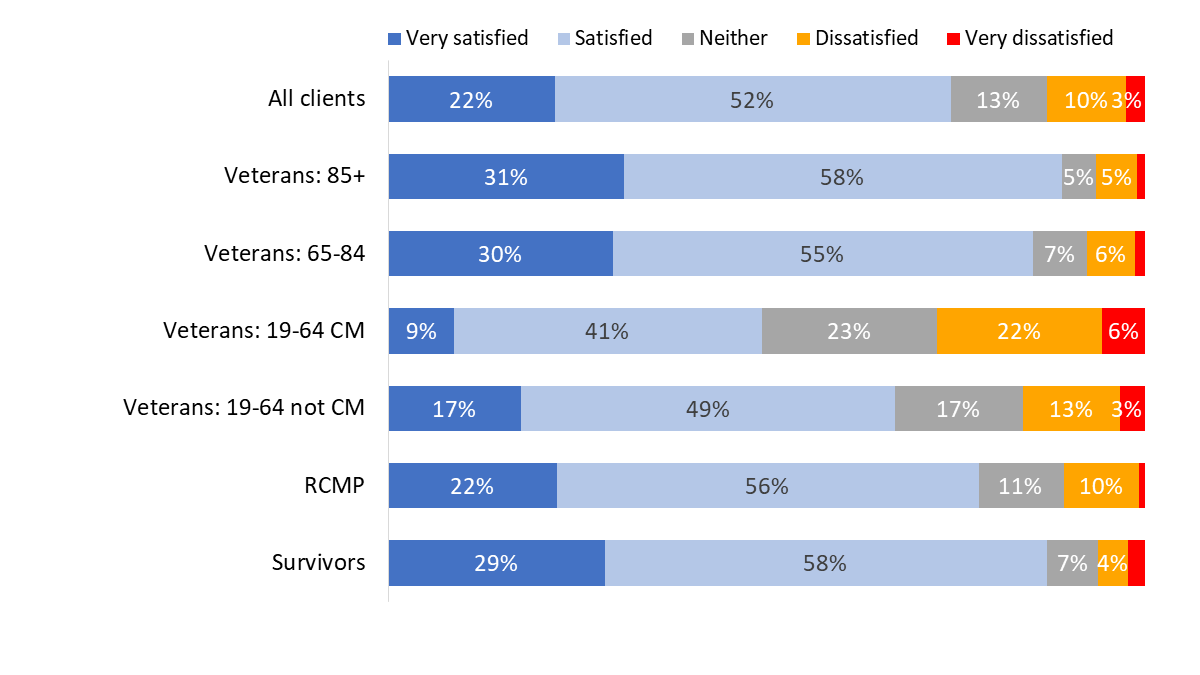
| Very satisfied | Satisfied | Neither | Dissatisfied | Very dissatisfied | |
| Survivors | 29% | 58% | 7% | 4% | 2% |
| RCMP | 22% | 56% | 11% | 10% | 1% |
| Veterans: 19-64 not CM | 17% | 49% | 17% | 13% | 3% |
| Veterans: 19-64 CM | 9% | 41% | 23% | 22% | 6% |
| Veterans: 65-84 | 30% | 55% | 7% | 6% | 1% |
| Veterans: 85+ | 31% | 58% | 5% | 5% | 1% |
| All clients | 22% | 52% | 13% | 10% | 3% |
Values of 2% or less are not labelled in the graph.
WB_Q01. How satisfied you are with each of the following aspects of your life...life in general. Base: n=3,764; all respondents, excluding “don’t know” and “refused”.
Non-Veterans (83% versus 71% of Veterans) and those who were released from service between 2014 and 2018 (76% versus 62% of those released between 2019 and 2024 were more likely to be satisfied with life in general.
The same pattern is reflected when respondents were asked about satisfaction with their leisure activities. Veterans aged 85+ (82%), Survivors (81%), and Veterans aged 65-84 (79%) were more likely than other respondents to be satisfied.
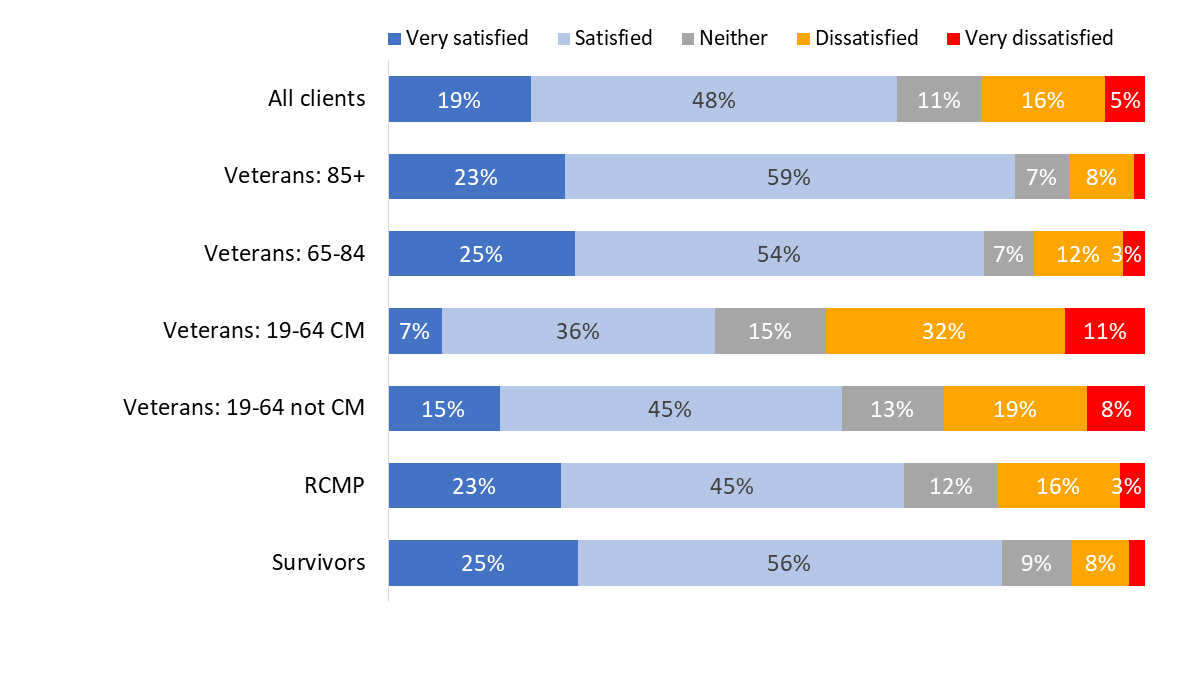
| Very satisfied | Satisfied | Neither | Dissatisfied | Very dissatisfied | |
| Survivors | 25% | 56% | 9% | 8% | 2% |
| RCMP | 23% | 45% | 12% | 16% | 3% |
| Veterans: 19-64 not CM | 15% | 45% | 13% | 19% | 8% |
| Veterans: 19-64 CM | 7% | 36% | 15% | 32% | 11% |
| Veterans: 65-84 | 25% | 54% | 7% | 12% | 3% |
| Veterans: 85+ | 23% | 59% | 7% | 8% | 2% |
| All clients | 19% | 48% | 11% | 16% | 5% |
Values of 2% or less are not labelled in the graph.
WB_Q03. How satisfied you are with each of the following aspects of your life... your leisure activities. Base: n=3,676; all respondents, excluding “don’t know” and “refused”.
Satisfaction with their leisure activities was higher among non-Veterans (75% versus 64% of Veterans) and those who were released from service between 2014 and 2018 (70% versus 55% of those released between 2019 and 2024). Indigenous respondents (50%) were less likely than non-Indigenous respondents (68%) to express satisfaction with this aspect of their life.
Satisfaction with one’s financial situation was highest among Veterans aged 85+ (90%), while Veterans between the ages of 19 and 64 were more likely to express dissatisfaction with their financial situation (21% of those who are case managed, and 18% of those who are not case managed).
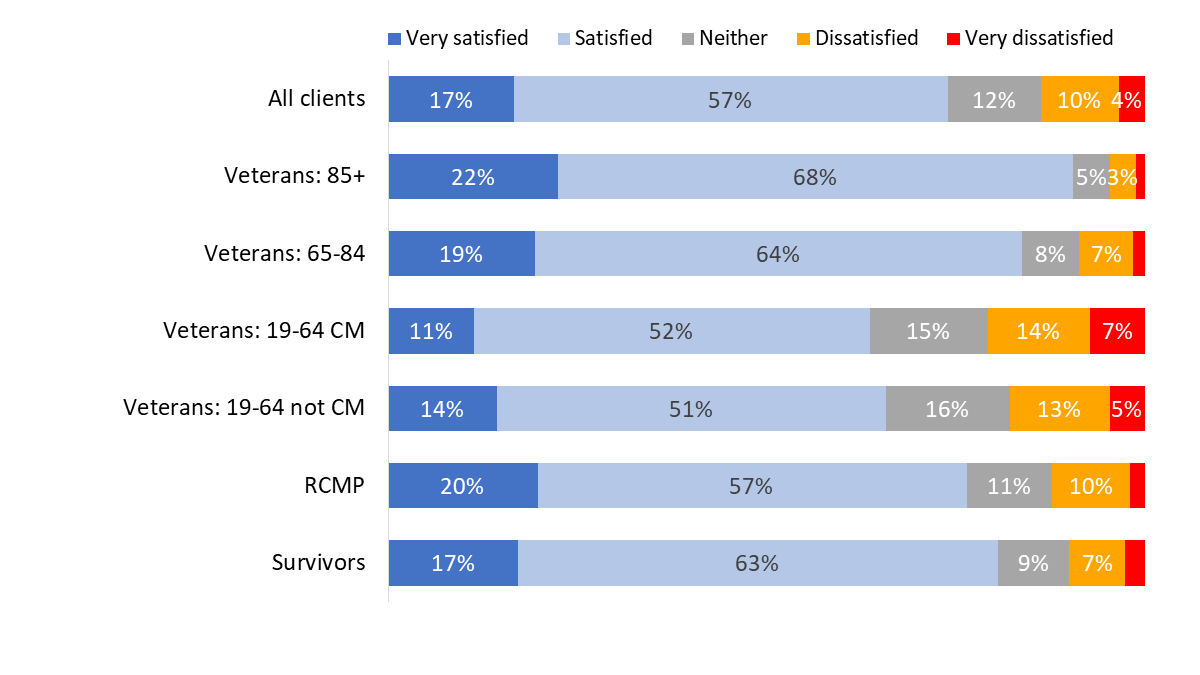
| Very satisfied | Satisfied | Neither | Dissatisfied | Very dissatisfied | |
| Survivors | 17% | 63% | 9% | 7% | 3% |
| RCMP | 20% | 57% | 11% | 10% | 2% |
| Veterans: 19-64 not CM | 14% | 51% | 16% | 13% | 5% |
| Veterans: 19-64 CM | 11% | 52% | 15% | 14% | 7% |
| Veterans: 65-84 | 19% | 64% | 8% | 7% | 2% |
| Veterans: 85+ | 22% | 68% | 5% | 3% | 1% |
| All clients | 17% | 57% | 12% | 10% | 4% |
Values of 2% or less are not labelled in the graph.
WB_Q04. How satisfied you are with each of the following aspects of your life…your financial situation. Base: n=3,758; all respondents, excluding “don’t know” and “refused”.
Non-Veterans (79% versus 72% of Veterans) and those who were released from service between 2014 and 2018 (77% versus 67% of those released between 2019 and 2024) were more likely to say they are satisfied with their financial situation. Indigenous respondents (20% versus 14% of non-Indigenous respondents) and respondents from racialized population groups (21% versus 13% of other respondents) were more likely to express dissatisfaction with this aspect of their life.
Once again, satisfaction with one’s overall well-being is highest among Veterans aged 85+ (84%), followed by Survivors (81%) and Veterans aged 65-84 (77%). Case managed Veterans between the ages of 19 and 64 (37%) were most likely to be dissatisfied with this aspect of their life.
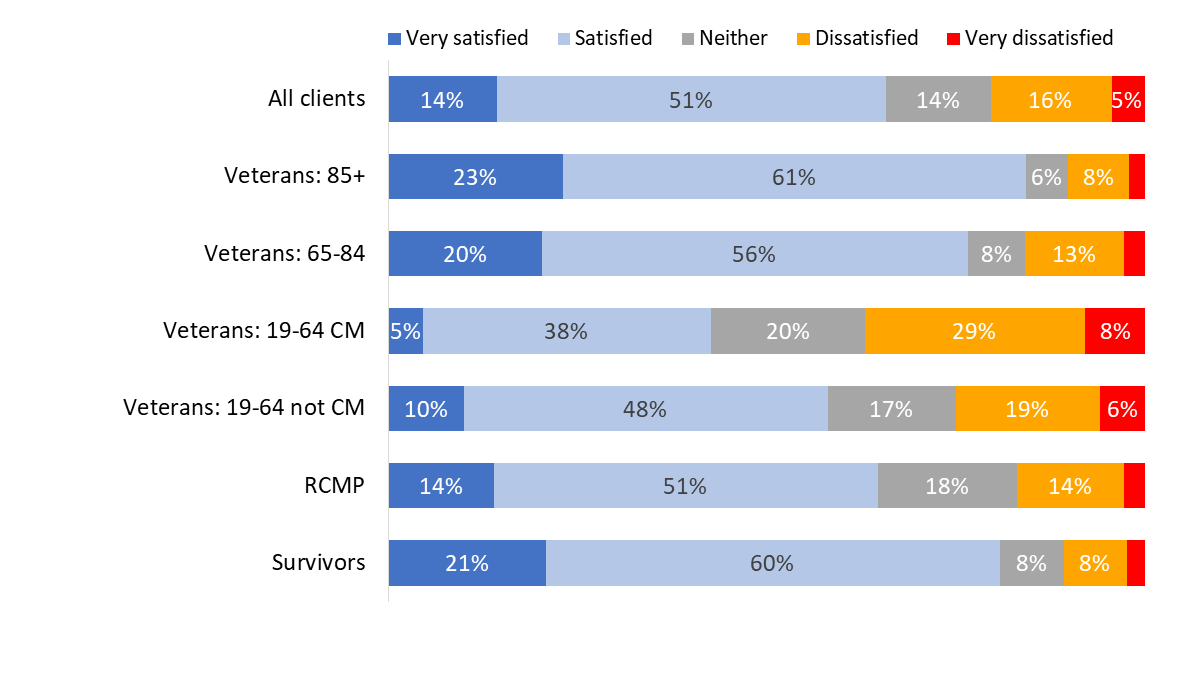
| Very satisfied | Satisfied | Neither | Dissatisfied | Very dissatisfied | |
| Survivors | 21% | 60% | 8% | 8% | 3% |
| RCMP | 14% | 51% | 18% | 14% | 3% |
| Veterans: 19-64 not CM | 10% | 48% | 17% | 19% | 6% |
| Veterans: 19-64 CM | 5% | 38% | 20% | 29% | 8% |
| Veterans: 65-84 | 20% | 56% | 8% | 13% | 3% |
| Veterans: 85+ | 23% | 61% | 6% | 8% | 2% |
| All clients | 14% | 51% | 14% | 16% | 5% |
Values of 3% or less are not labelled in the graph.
WB_Q05. How satisfied you are with each of the following aspects of your life…your overall well-being. Base: n=3,754; all respondents, excluding “don’t know” and “refused”.
Non-Veterans (73% versus 63% of Veterans) and those who were released from service between 2014 and 2018 (69% versus 51% of those released between 2019 and 2024) were more likely to be satisfied with their overall well-being. Indigenous respondents (31%) were more likely than non-Indigenous respondents (20%) to express dissatisfaction with their overall well-being.
Veterans aged 85+ (95%), followed by Survivors (91%) and Veterans aged 65-84 (90%) were more likely than case managed Veterans aged 19-64 (66%), Veterans 19-64 who are not case managed (77%), and RCMP (83%) to be satisfied with their relationships with other family members. Case managed Veterans (20%) were the most likely to express dissatisfaction with this aspect of their life.
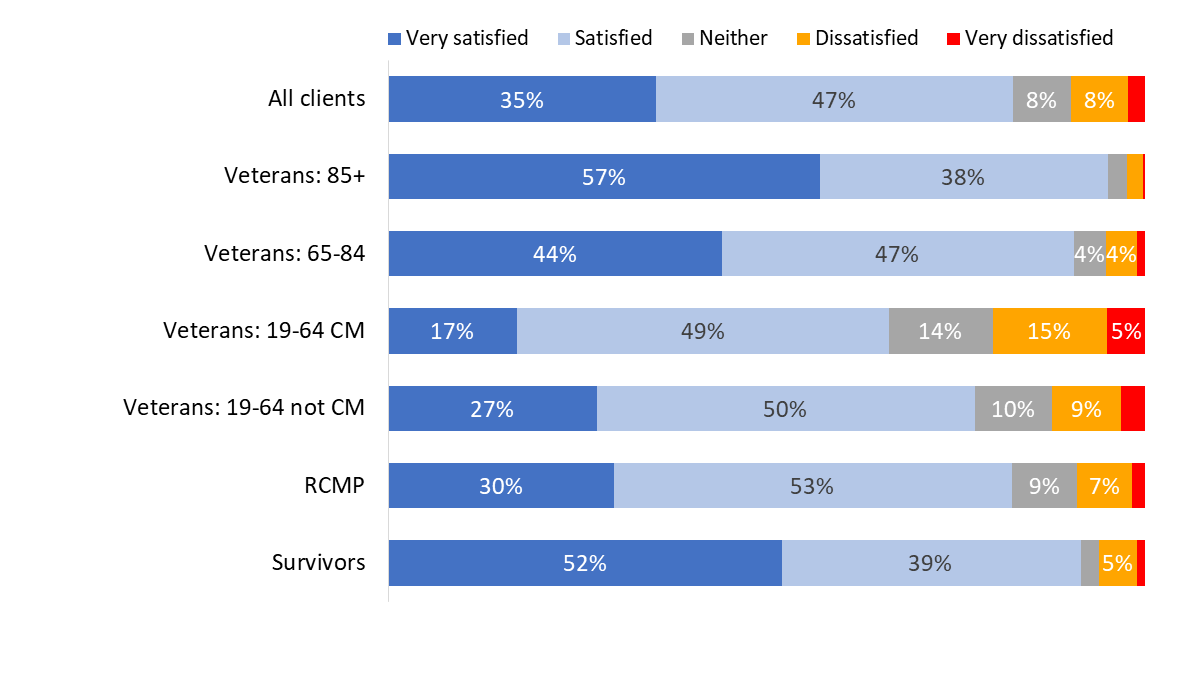
| Very satisfied | Satisfied | Neither | Dissatisfied | Very dissatisfied | |
| Survivors | 52% | 39% | 2% | 5% | 1% |
| RCMP | 30% | 53% | 9% | 7% | 2% |
| Veterans: 19-64 not CM | 27% | 50% | 10% | 9% | 3% |
| Veterans: 19-64 CM | 17% | 49% | 14% | 15% | 5% |
| Veterans: 65-84 | 44% | 47% | 4% | 4% | 1% |
| Veterans: 85+ | 57% | 38% | 3% | 2% | 0% |
| All clients | 35% | 47% | 8% | 8% | 2% |
Values of 3% or less are not labelled in the graph.
WB_Q06. How satisfied you are with each of the following aspects of your life… your relationships with other family members. Base: n=3,730; all respondents, excluding “don’t know” and “refused”.
Continuing the pattern, non-Veterans (87% versus 81% of Veterans) and those who were released from service between 2014 and 2018 (84% versus 75% of those released between 2019 and 2024) were also more likely to be satisfied with their relationships with other family members. Indigenous respondents (18%) were more likely than non-Indigenous respondents (9%) to express dissatisfaction with this aspect of their life.
Satisfaction with their relationships with friends was highest among Veterans aged 85+ (96%), followed by Survivors (91%) and Veterans aged 65-84 (89%). Case managed Veterans (25%) were the most likely to express dissatisfaction with this aspect of their life.
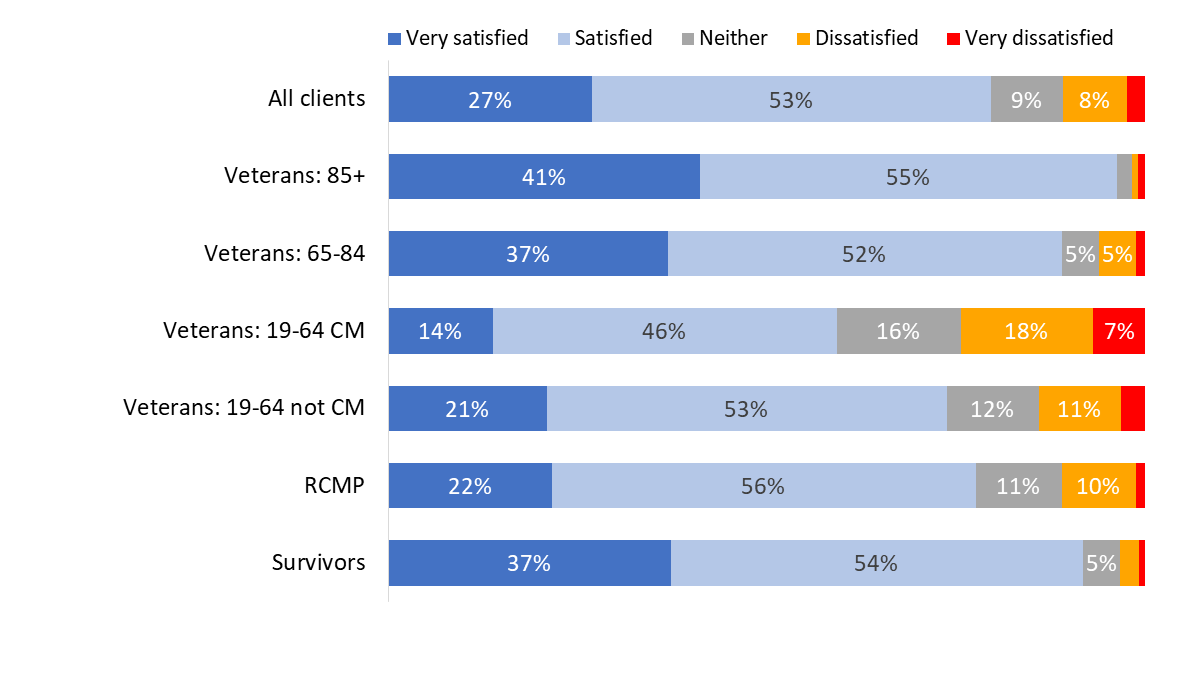
| Very satisfied | Satisfied | Neither | Dissatisfied | Very dissatisfied | |
| Survivors | 37% | 54% | 5% | 3% | 1% |
| RCMP | 22% | 56% | 11% | 10% | 1% |
| Veterans: 19-64 not CM | 21% | 53% | 12% | 11% | 3% |
| Veterans: 19-64 CM | 14% | 46% | 16% | 18% | 7% |
| Veterans: 65-84 | 37% | 52% | 5% | 5% | 1% |
| Veterans: 85+ | 41% | 55% | 2% | 1% | 1% |
| All clients | 27% | 53% | 9% | 8% | 3% |
Values of 3% or less are not labelled in the graph.
WB_Q07. How satisfied you are with each of the following aspects of your life… your relationships with friends. Base: n=3,721; all respondents, excluding “don’t know” and “refused”.
The likelihood of being satisfied with their friendships was higher among non-Veterans (85% versus 77% of Veterans) and those who were released from service between 2014 and 2018 (82% versus 68% of those released between 2019 and 2024). Indigenous respondents (21%) were more likely than non-Indigenous respondents (10%) to express dissatisfaction with their relationships with friends.
Satisfaction with their housing situation was highest among Veterans aged 85+ (96%), followed by Veterans aged 65-84 (94%) and Survivors (93%). Case managed Veterans aged 19 to 64 (13%), followed by non-case managed Veterans between the ages of 19 and 64 (9%) were the most likely to express dissatisfaction with this aspect of their life.
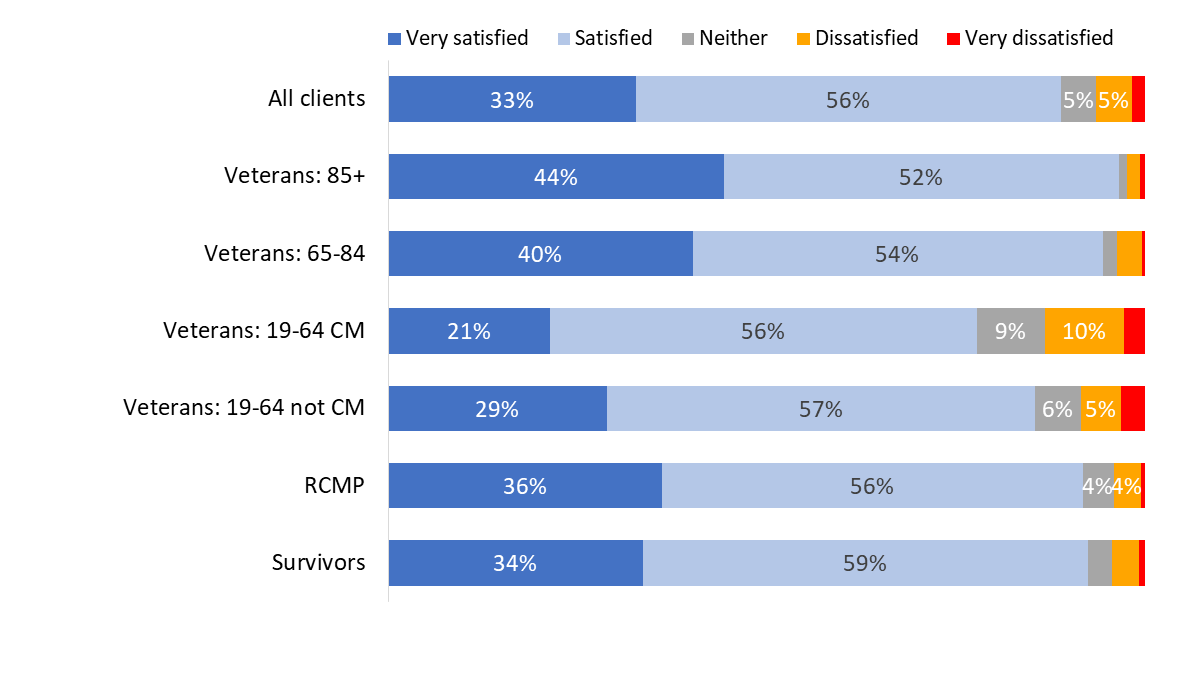
| Very satisfied | Satisfied | Neither | Dissatisfied | Very dissatisfied | |
| Survivors | 34% | 59% | 3% | 3% | 1% |
| RCMP | 36% | 56% | 4% | 4% | 1% |
| Veterans: 19-64 not CM | 29% | 57% | 6% | 5% | 3% |
| Veterans: 19-64 CM | 21% | 56% | 9% | 10% | 3% |
| Veterans: 65-84 | 40% | 54% | 2% | 3% | 1% |
| Veterans: 85+ | 44% | 52% | 1% | 2% | 1% |
| All clients | 33% | 56% | 5% | 5% | 2% |
Values of 3% or less are not labelled in the graph.
WB_Q08. How satisfied you are with each of the following aspects of your life… your housing. Base: n=3,783; all respondents, excluding “don’t know” and “refused”.
Non-Veterans (92% versus 87% of Veterans) and those who were released from service between 2014 and 2018 (92% versus 82% of those released between 2019 and 2024) were also more likely to be satisfied with their housing. Indigenous respondents (82% versus 89% of non-Indigenous respondents) and respondents from racialized population groups (83% versus 89% of other respondents) were less likely to express satisfaction with their housing.
Case managed Veterans aged 19-64 (11%) were the most likely to express dissatisfaction with their neighbourhood.
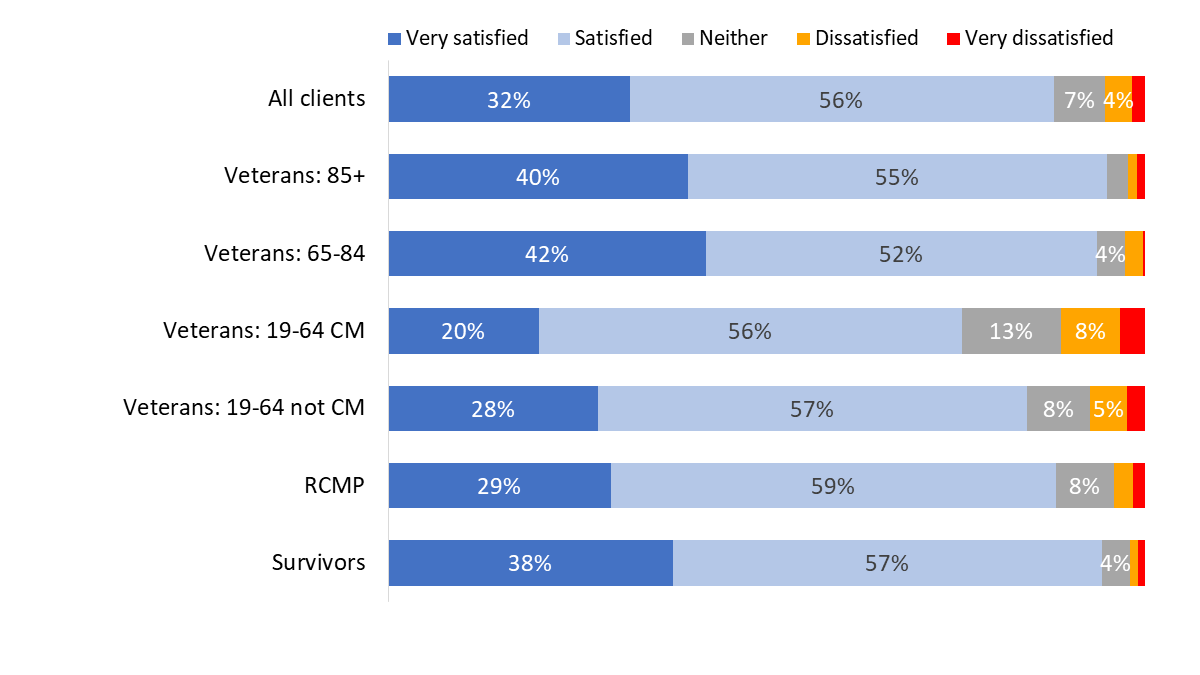
| Very satisfied | Satisfied | Neither | Dissatisfied | Very dissatisfied | |
| Survivors | 38% | 57% | 4% | 1% | 1% |
| RCMP | 29% | 59% | 8% | 3% | 2% |
| Veterans: 19-64 not CM | 28% | 57% | 8% | 5% | 3% |
| Veterans: 19-64 CM | 20% | 56% | 13% | 8% | 3% |
| Veterans: 65-84 | 42% | 52% | 4% | 2% | 0% |
| Veterans: 85+ | 40% | 55% | 3% | 1% | 1% |
| All clients | 32% | 56% | 7% | 4% | 2% |
Values of 3% or less are not labelled in the graph.
WB_Q09. How satisfied you are with each of the following aspects of your life… your neighbourhood. Base: n=3,760; all respondents, excluding “don’t know” and “refused”.
Non-Veterans (91% versus 86% of Veterans) and those who were released from service between 2014 and 2018 (90% versus 80% of those released between 2019 and 2024) were also more likely to be satisfied with their neighbourhood. Indigenous respondents (80%) were less likely than non-Indigenous respondents (88%) to be satisfied with their neighbourhood.
Respondents were asked how they would characterize their health and mental health in general, using the following scale: poor, fair, good, very good, excellent. In response, nearly half characterized their health in positive terms, describing it as good (33%) or very good/excellent (16%). The largest single proportion (36%) characterized their health as fair, while 15% characterized it as poor.
Veterans aged 19-64 were more likely than others to rate their health as fair or poor (67% of case managed Veterans and 56% of Veterans who are not case managed).
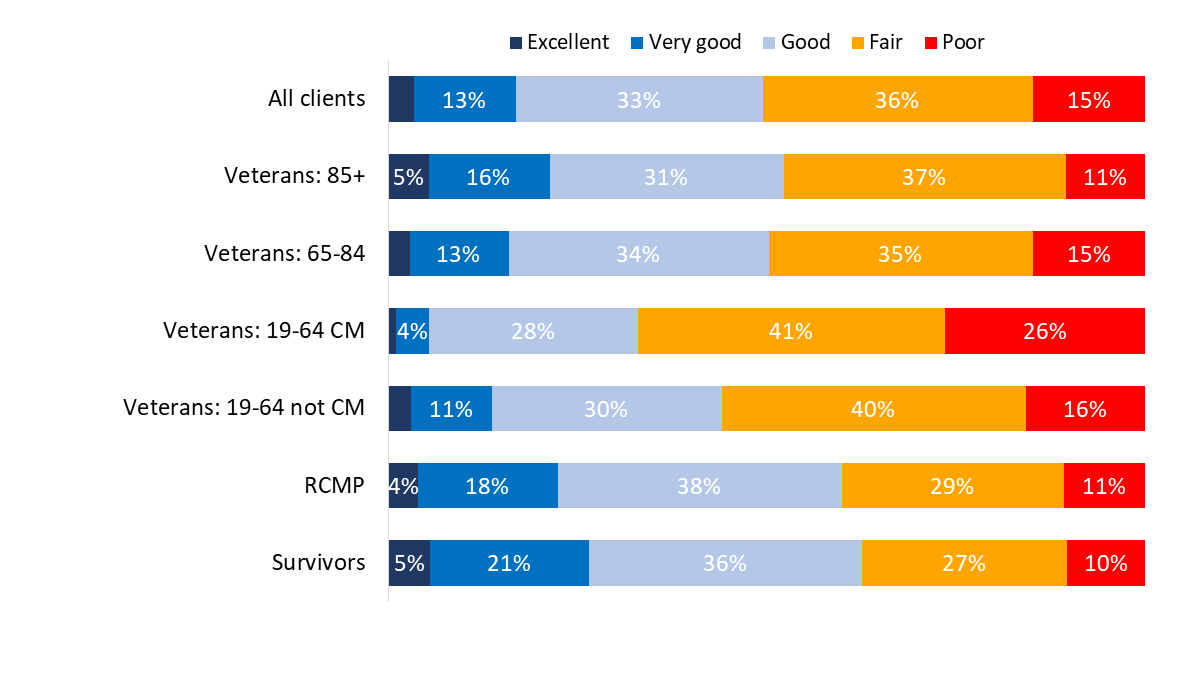
| Excellent | Very good | Good | Fair | Poor | |
| Survivors | 5% | 21% | 36% | 27% | 10% |
| RCMP | 4% | 18% | 38% | 29% | 11% |
| Veterans: 19-64 not CM | 3% | 11% | 30% | 40% | 16% |
| Veterans: 19-64 CM | 1% | 4% | 28% | 41% | 26% |
| Veterans: 65-84 | 3% | 13% | 34% | 35% | 15% |
| Veterans: 85+ | 5% | 16% | 31% | 37% | 11% |
| All clients | 3% | 13% | 33% | 36% | 15% |
Values of 3% or less are not labelled in the graph.
WB_Q10. In general, would you say your health is poor, fair, good, very good or excellent? Base: n=3802; all respondents, excluding “don’t know” and “refused”.
Indigenous respondents were less likely to characterize their health as good to excellent (10% versus 17% of non-Indigenous respondents) and more likely to describe it as fair to poor (66% versus 50% of non-Indigenous respondents).
When it came to their mental health, just over half the survey respondents characterized it in positive terms, describing it as good (29%) or very good/excellent (25%). Here as well, the largest single proportion (30%) characterized it as fair, while 14% characterized it as poor.
Case managed Veterans aged 19-64 (77%), Veterans aged 19-64 who are not case managed (58%), and RCMP (52%) were more likely than other respondents to rate their mental health as fair or poor.
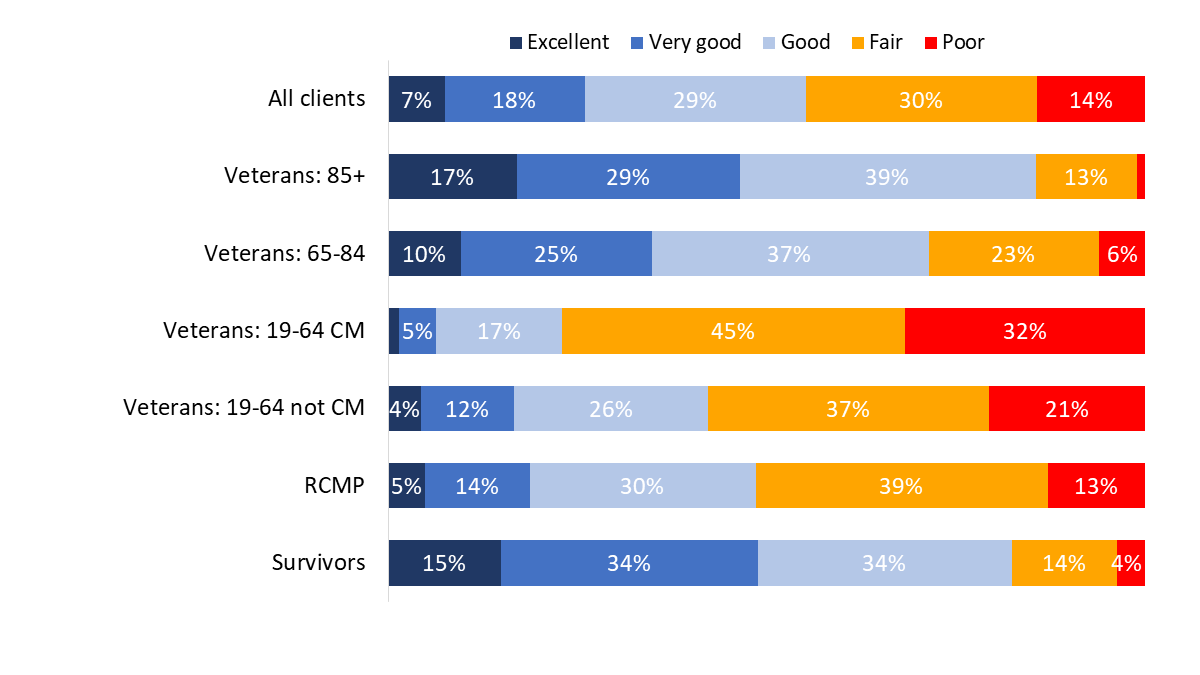
| Excellent | Very good | Good | Fair | Poor | |
| Survivors | 15% | 34% | 34% | 14% | 4% |
| RCMP | 5% | 14% | 30% | 39% | 13% |
| Veterans: 19-64 not CM | 4% | 12% | 26% | 37% | 21% |
| Veterans: 19-64 CM | 1% | 5% | 17% | 45% | 32% |
| Veterans: 65-84 | 10% | 25% | 37% | 23% | 6% |
| Veterans: 85+ | 17% | 29% | 39% | 13% | 1% |
| All clients | 7% | 18% | 29% | 30% | 14% |
Values of 3% or less are not labelled in the graph.
WB_Q11. In general, would you say your mental health is poor, fair, good, very good or excellent? Base: n=3,787; all respondents, excluding “don’t know” and “refused”.
Indigenous respondents were less likely to characterize their mental health as good to excellent (17% versus 27% of non-Indigenous respondents) and more likely to describe it as fair to poor (63% versus 44% of non-Indigenous respondents).
Respondents were asked whether they strongly disagree, disagree, neither disagree nor agree, agree, or strongly agree with the following statements about their well-being:
Responses suggest that most respondents tend to be positive about their well-being. The vast majority agreed that they live in a safe neighbourhood (93%) and that they are happy living with the person or people that they live with or happy living on their own (91%). A substantial majority (83%; up from 69% in 2022) indicated that they interact with other people at least once a day, while approximately three-quarters agreed that they have a purpose in life (77%; up from 64% in 2022), and have savings set aside for an unplanned expense (73%; up from 59% in 2022).
Smaller majorities agreed that their spirituality gives them a feeling of security (59%; up from 47% in 2022) and described themselves as physically active (56%; up from 41% in 2022), while just over half (51%; up from 38% in 2022 and similar to the 47% reported in 2020) indicated that they belong to at least one community group. In addition, nearly two-thirds (64%) disagreed that they need help preparing meals, and over half disagreed that they would move to a different house if they could (59%) and that they often feel down, depressed, or hopeless (54%).
That being said, sizeable minorities expressed a different lived reality in relation some of these indicators. Nearly half (45%) indicated that they do not belong to any community group. Approximately one-third agreed that they would move to a better home if they could (34%), agreed that they often feel down, depressed, or hopeless (31%), and disagreed that they are physically active (31%). In addition, over one-quarter (28%) agreed that they need help preparing meals, while nearly one-quarter (24%) disagreed that their spirituality gives them a feeling of security. Finally, one-in-five (21%) disagreed that they have savings set aside for an unplanned expense.
Across most of these well-being indicators, non-Veterans (compared to Veterans) were more likely than to provide positive assessments.
Figures 74 to 84 present the ratings for each area, overall and for each group.
Case managed Veterans aged 19-64 (58%) were the least likely to agree that they have a purpose in life and the most likely to disagree (23%) with this statement.
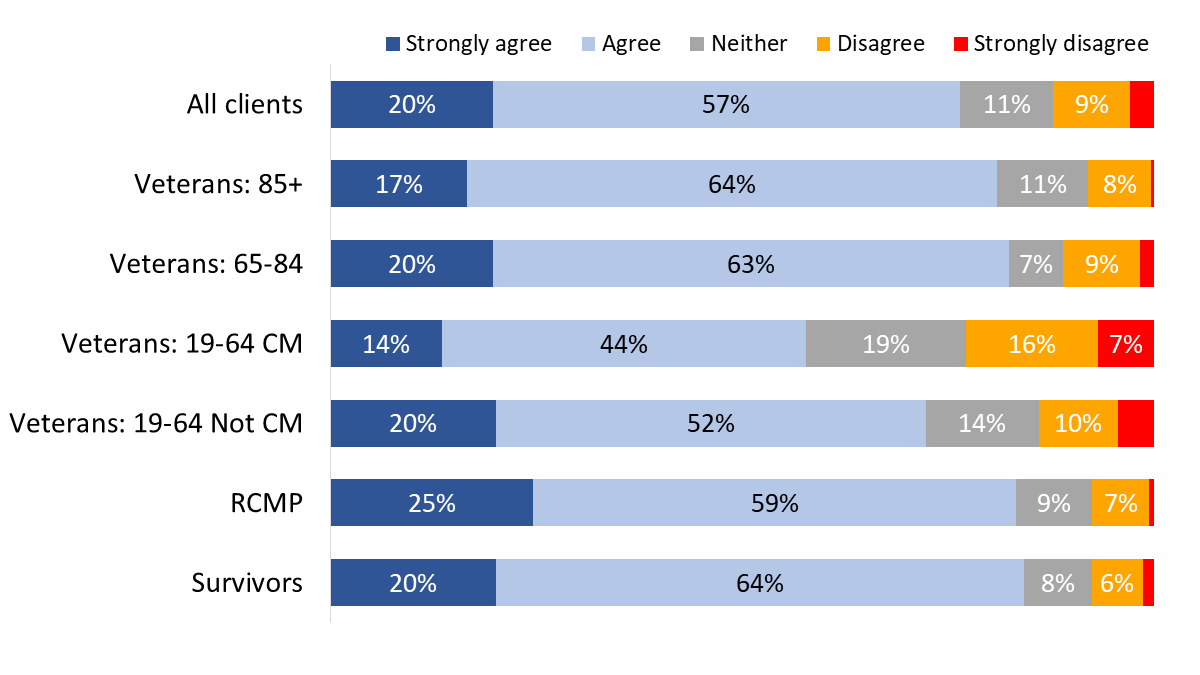
| Strongly agree | Agree | Neither | Disagree | Strongly disagree | |
| Survivors | 20% | 64% | 8% | 6% | 1% |
| RCMP | 25% | 59% | 9% | 7% | 1% |
| Veterans: 19-64 Not CM | 20% | 52% | 14% | 10% | 4% |
| Veterans: 19-64 CM | 14% | 44% | 19% | 16% | 7% |
| Veterans: 65-84 | 20% | 63% | 7% | 9% | 2% |
| Veterans: 85+ | 17% | 64% | 11% | 8% | 0% |
| All clients | 20% | 57% | 11% | 9% | 3% |
Values of 3% or less are not labelled in the graph.
WB_Q013. Agree/Disagree with the following statements about your well-being: I have a purpose in life. Base: n=3,694, all respondents, excluding “don’t know” and “refused”.
Indigenous respondents (69%) were less likely than non-Indigenous respondents (77%) to agree that they have a purpose in life.
RCMP (69%) were the most likely to describe themselves as physically active while case managed Veterans between the ages of 19 and 64 (42%) were the most likely to disagree with the statement: I would describe myself as physically active.
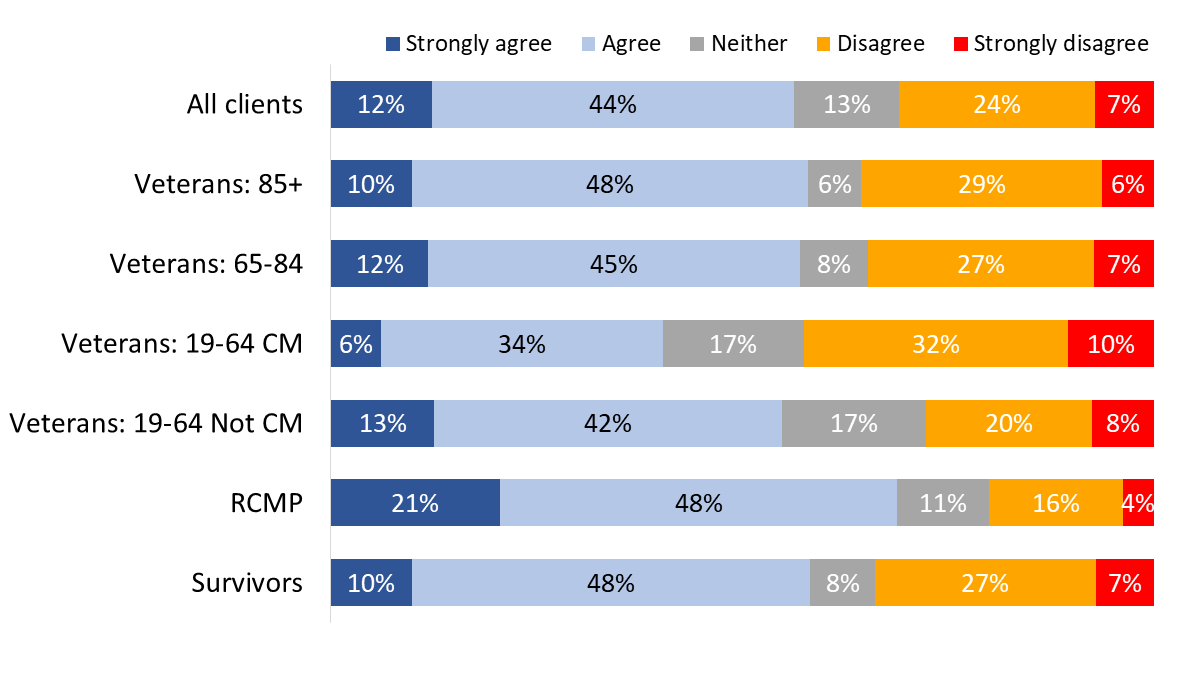
| Strongly agree | Agree | Neither | Disagree | Strongly disagree | |
| Survivors | 10% | 48% | 8% | 27% | 7% |
| RCMP | 21% | 48% | 11% | 16% | 4% |
| Veterans: 19-64 Not CM | 13% | 42% | 17% | 20% | 8% |
| Veterans: 19-64 CM | 6% | 34% | 17% | 32% | 10% |
| Veterans: 65-84 | 12% | 45% | 8% | 27% | 7% |
| Veterans: 85+ | 10% | 48% | 6% | 29% | 6% |
| All clients | 12% | 44% | 13% | 24% | 7% |
WB_Q015. Agree/Disagree with the following statements about your well-being: I would describe myself as physically active. Base: n=3,782, all respondents, excluding “don’t know” and “refused”.
Indigenous respondents (48%) were less likely than non-Indigenous respondents (57%) to describe themselves as physically active.
Survivors (90%), Veterans aged 85+ (86%) and RCMP (86%) were more likely than case managed Veterans (73%) to agree with the statement:“I interact with other people at least once a day”.
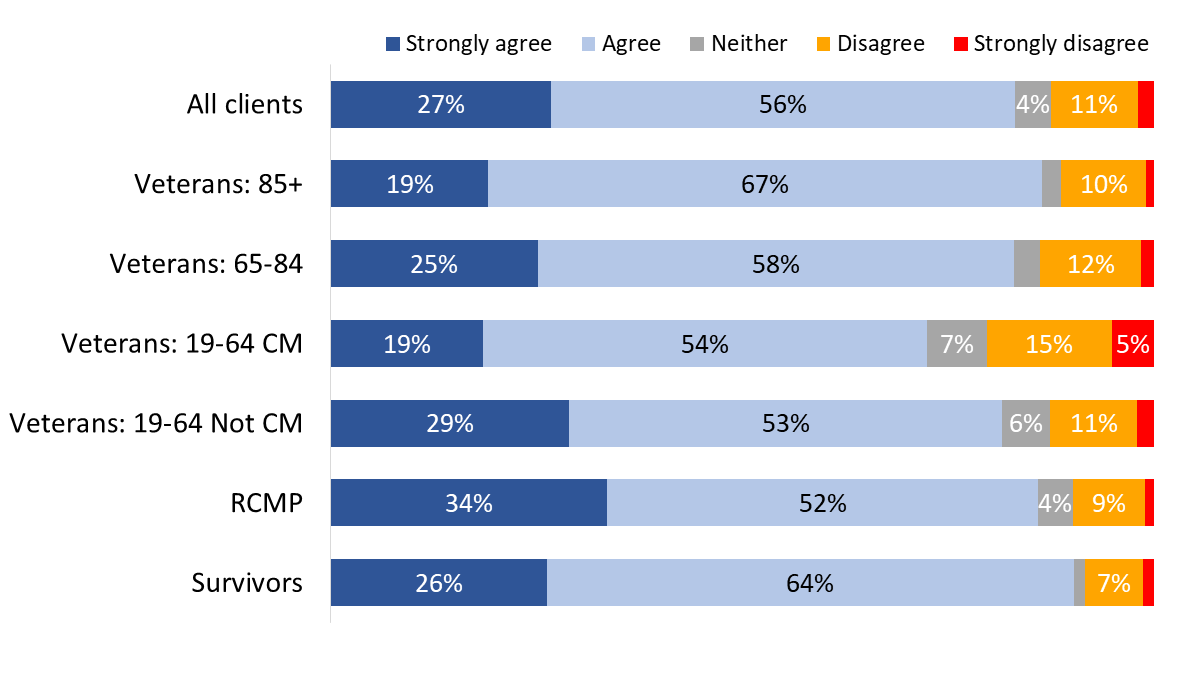
| Strongly agree | Agree | Neither | Disagree | Strongly disagree | |
| Survivors | 26% | 64% | 1% | 7% | 1% |
| RCMP | 34% | 52% | 4% | 9% | 1% |
| Veterans: 19-64 Not CM | 29% | 53% | 6% | 11% | 2% |
| Veterans: 19-64 CM | 19% | 54% | 7% | 15% | 5% |
| Veterans: 65-84 | 25% | 58% | 3% | 12% | 2% |
| Veterans: 85+ | 19% | 67% | 2% | 10% | 1% |
| All clients | 27% | 56% | 4% | 11% | 2% |
Values of 3% or less are not labelled in the graph.
WB_Q017. Agree/Disagree with the following statements about your well-being: I interact with other people at least once a day. Base: n=3,797; all respondents, excluding “don’t know” and “refused”.
Indigenous respondents (75%) were less likely than non-Indigenous respondents (84%) to say they interact with other people at least once a day.
Survivors (84%) and Veterans aged 85+ (77%) were more likely than other respondents to agree that their spirituality gives them a feeling of security. Case managed Veterans (36%) were the most likely to disagree about their spirituality.
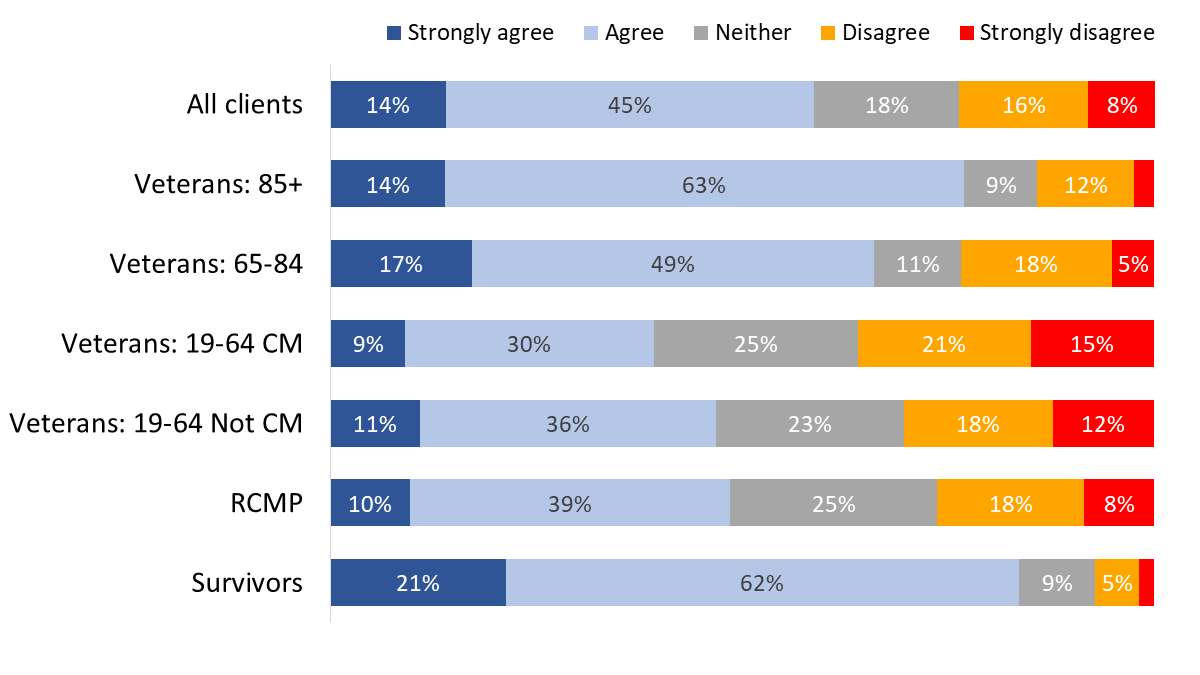
| Strongly agree | Agree | Neither | Disagree | Strongly disagree | |
| All clients | 14% | 45% | 18% | 16% | 8% |
| Veterans: 85+ | 14% | 63% | 9% | 12% | 2% |
| Veterans: 65-84 | 17% | 49% | 11% | 18% | 5% |
| Veterans: 19-64 CM | 9% | 30% | 25% | 21% | 15% |
| Veterans: 19-64 Not CM | 11% | 36% | 23% | 18% | 12% |
| RCMP | 10% | 39% | 25% | 18% | 8% |
| Survivors | 21% | 62% | 9% | 5% | 2% |
Values of 3% or less are not labelled in the graph.
WB_Q018. Agree/Disagree with the following statements about your well-being: My spirituality gives me a feeling of security. Base: n=3,067; all respondents, excluding “don’t know” and “refused”.
Respondents from racialized population groups (72%) were more likely than other respondents (57%) to say their spirituality gives them a feeling of security.
Case managed Veterans aged 19-64 (57%) were the most likely to disagree that they belong to at least one community group. In contrast, Veterans aged 85+ (67%), Survivors (60%), and Veterans 65-84 (59%) were more likely to agree.

| Strongly agree | Agree | Neither | Disagree | Strongly disagree | |
| Survivors | 10% | 50% | 2% | 32% | 6% |
| RCMP | 12% | 38% | 4% | 36% | 10% |
| Veterans: 19-64 Not CM | 9% | 36% | 5% | 35% | 14% |
| Veterans: 19-64 CM | 9% | 30% | 4% | 38% | 19% |
| Veterans: 65-84 | 15% | 44% | 3% | 33% | 5% |
| Veterans: 85+ | 13% | 54% | 3% | 26% | 4% |
| All clients | 11% | 40% | 4% | 34% | 11% |
WB_Q019. Agree/Disagree with the following statements about your well-being: I belong to at least one community group. Base: n=3,554; all respondents, excluding “don’t know” and “refused”.
Agreement that they are happy living with the people they live with or living alone was higher among Veterans aged 85+ (97%) and aged 65-84 (95%), as well as Survivors (95%), compared to Veterans aged 19-64.
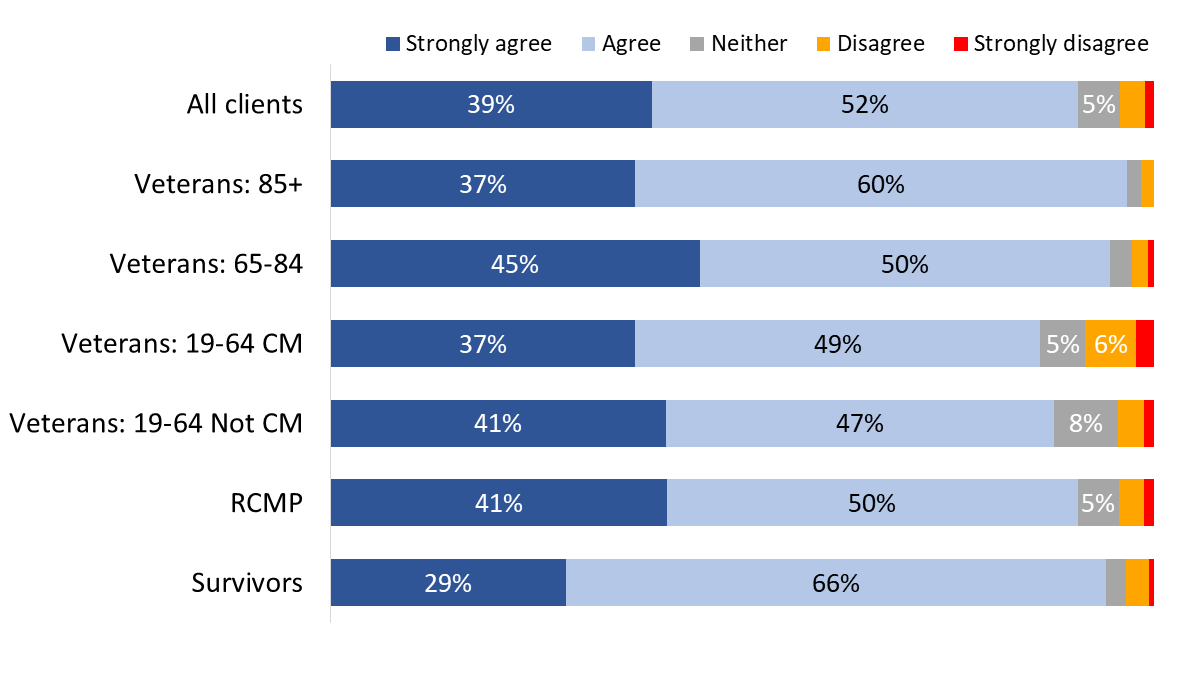
| Strongly agree | Agree | Neither | Disagree | Strongly disagree | |
| Survivors | 29% | 66% | 2% | 3% | 1% |
| RCMP | 41% | 50% | 5% | 3% | 1% |
| Veterans: 19-64 Not CM | 41% | 47% | 8% | 3% | 1% |
| Veterans: 19-64 CM | 37% | 49% | 5% | 6% | 2% |
| Veterans: 65-84 | 45% | 50% | 3% | 2% | 1% |
| Veterans: 85+ | 37% | 60% | 2% | 2% | |
| All clients | 39% | 52% | 5% | 3% | 1% |
Values of 3% or less are not labelled in the graph.
WB_Q020. Agree/Disagree with the following statements about your well-being: I am happy living with the person or people that I live with or happy living on my own. Base: n=3,749; all respondents, excluding “don’t know” and “refused”.
Case managed Veterans aged 19-64 (56%) were the most likely to agree that they often feel down, depressed, or hopeless.
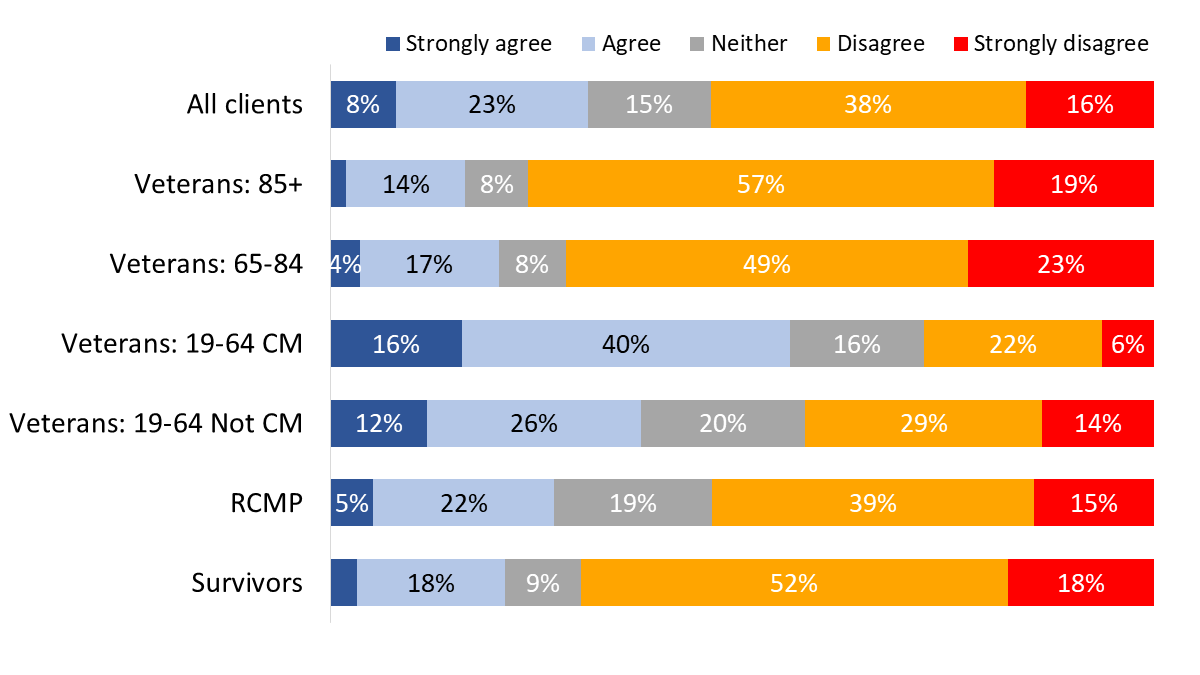
| Strongly agree | Agree | Neither | Disagree | Strongly disagree | |
| Survivors | 3% | 18% | 9% | 52% | 18% |
| RCMP | 5% | 22% | 19% | 39% | 15% |
| Veterans: 19-64 Not CM | 12% | 26% | 20% | 29% | 14% |
| Veterans: 19-64 CM | 16% | 40% | 16% | 22% | 6% |
| Veterans: 65-84 | 4% | 17% | 8% | 49% | 23% |
| Veterans: 85+ | 2% | 14% | 8% | 57% | 19% |
| All clients | 8% | 23% | 15% | 38% | 16% |
Values of 3% or less are not labelled in the graph.
WB_Q022. Agree/Disagree with the following statements about your well-being: I often feel down, depressed, or hopeless. Base: n=3,718; all respondents, excluding “don’t know” and “refused”.
Indigenous respondents (43%) were more likely than non-Indigenous respondents (30%) to say they often feel down, depressed, or hopeless.
Veterans aged 85+ (43%) were the most likely to agree that they need help preparing meals while RCMP (14%) were the least likely to agree that they need help.
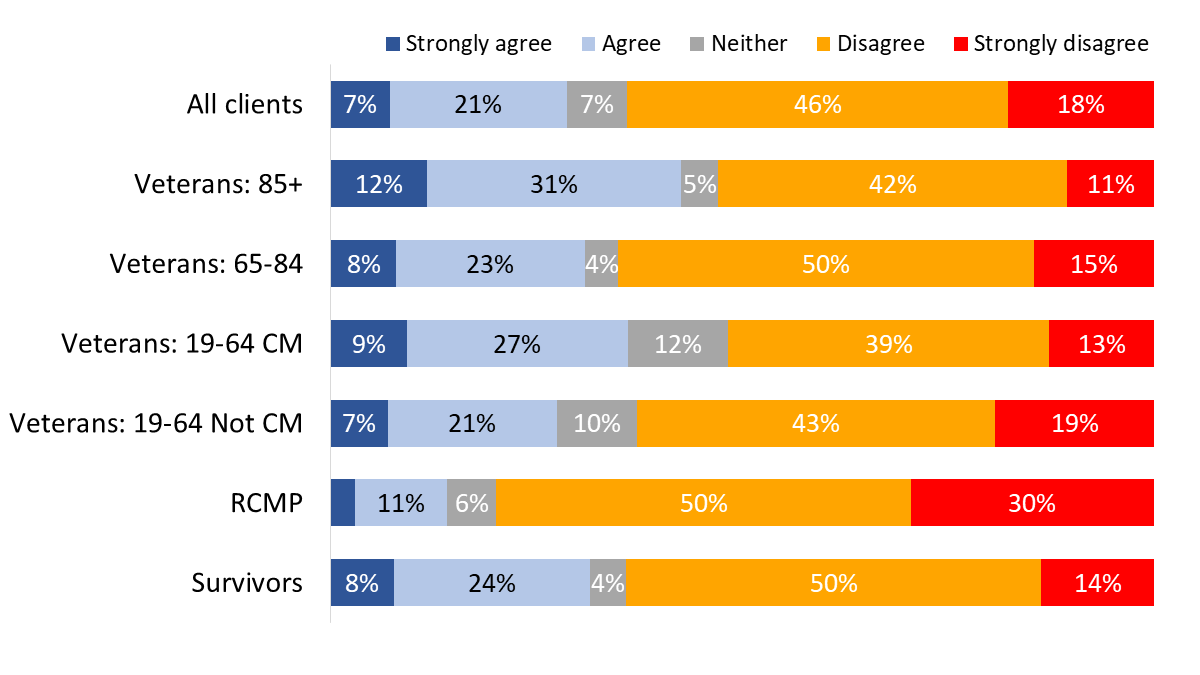
| Strongly agree | Agree | Neither | Disagree | Strongly disagree | |
| Survivors | 8% | 24% | 4% | 50% | 14% |
| RCMP | 3% | 11% | 6% | 50% | 30% |
| Veterans: 19-64 Not CM | 7% | 21% | 10% | 43% | 19% |
| Veterans: 19-64 CM | 9% | 27% | 12% | 39% | 13% |
| Veterans: 65-84 | 8% | 23% | 4% | 50% | 15% |
| Veterans: 85+ | 12% | 31% | 5% | 42% | 11% |
| All clients | 7% | 21% | 7% | 46% | 18% |
Values of 3% or less are not labelled in the graph.
WB_Q024. Agree/Disagree with the following statements about your well-being: I need help preparing meals. Base: n=3,667; all respondents, excluding “don’t know” and “refused”.
Veterans aged 85+ (87%) were the most likely to have savings set aside for an unplanned expense while Veterans aged 19-64 were the least likely to have savings set aside.
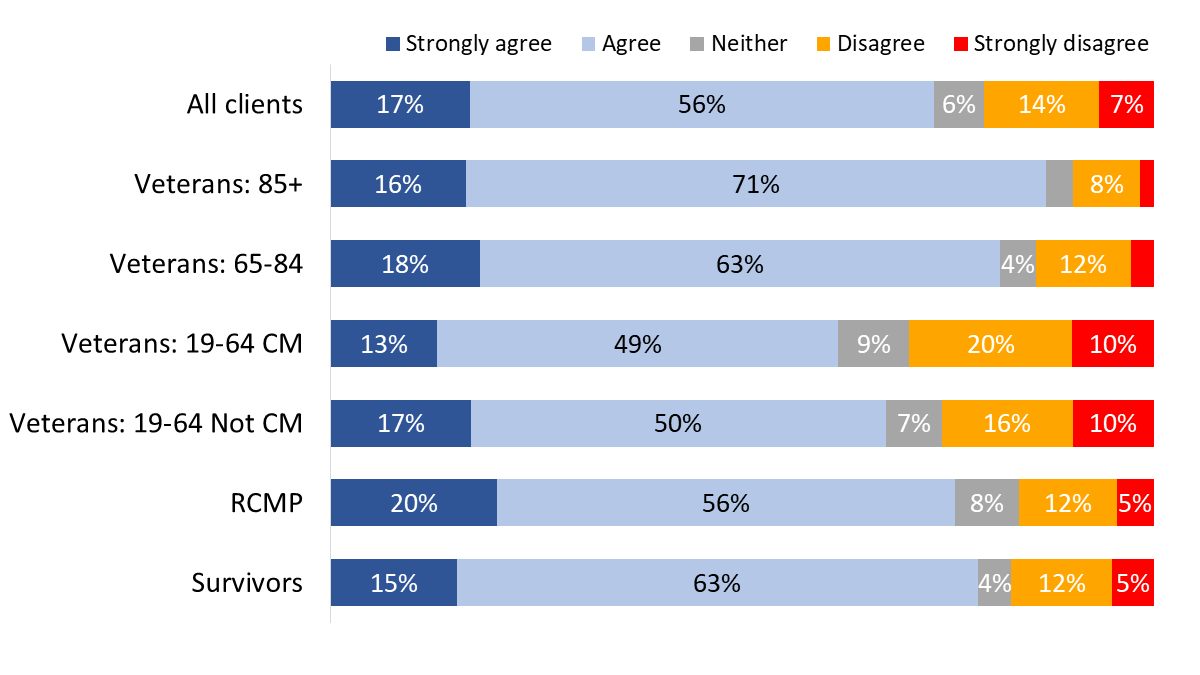
| Strongly agree | Agree | Neither | Disagree | Strongly disagree | |
| Survivors | 15% | 63% | 4% | 12% | 5% |
| RCMP | 20% | 56% | 8% | 12% | 5% |
| Veterans: 19-64 Not CM | 17% | 50% | 7% | 16% | 10% |
| Veterans: 19-64 CM | 13% | 49% | 9% | 20% | 10% |
| Veterans: 65-84 | 18% | 63% | 4% | 12% | 3% |
| Veterans: 85+ | 16% | 71% | 3% | 8% | 2% |
| All clients | 17% | 56% | 6% | 14% | 7% |
Values of 3% or less are not labelled in the graph.
WB_Q026. Agree/Disagree with the following statements about your well-being: I have savings set aside for an unplanned expense. Base: n=3,688; all respondents, excluding “don’t know” and “refused”.
Indigenous respondents (62% versus 74% of non-Indigenous respondents) and respondents from racialized population groups (64% versus 74% of other respondents) were less likely to say they have savings set aside for an unplanned expense.
Case managed (49%) and non-case managed Veterans (43%) were more likely than others to say they would move to a better home if they could.
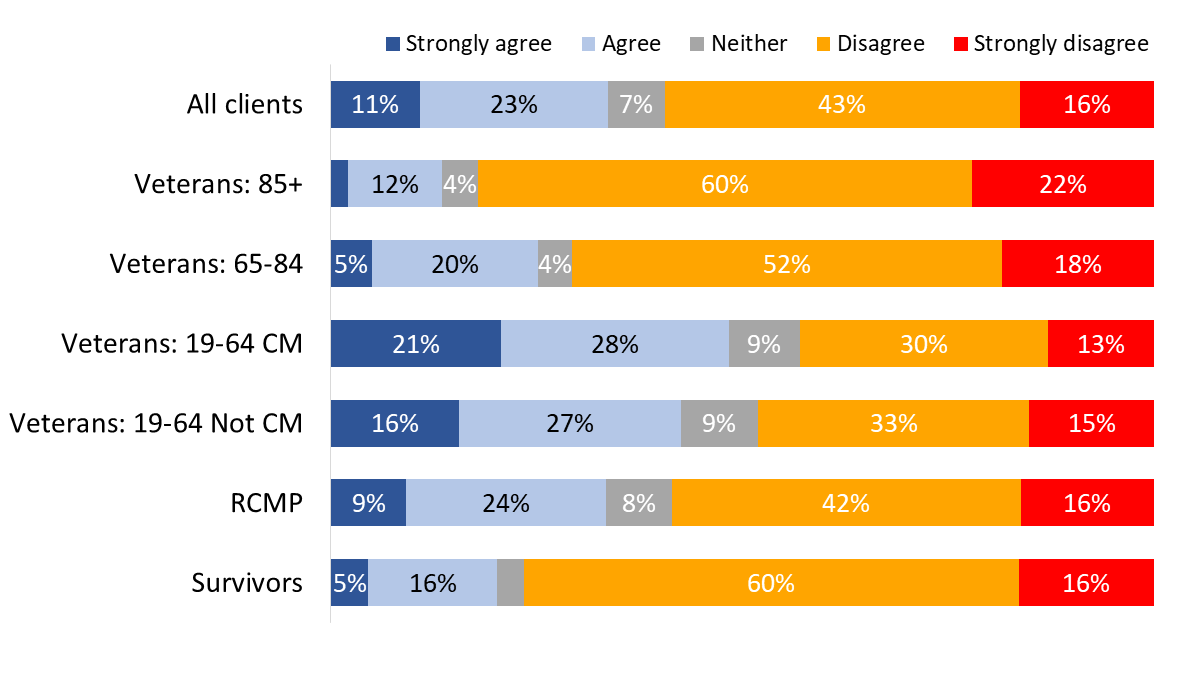
| Strongly agree | Agree | Neither | Disagree | Strongly disagree | |
| Survivors | 5% | 16% | 3% | 60% | 16% |
| RCMP | 9% | 24% | 8% | 42% | 16% |
| Veterans: 19-64 Not CM | 16% | 27% | 9% | 33% | 15% |
| Veterans: 19-64 CM | 21% | 28% | 9% | 30% | 13% |
| Veterans: 65-84 | 5% | 20% | 4% | 52% | 18% |
| Veterans: 85+ | 2% | 12% | 4% | 60% | 22% |
| All clients | 11% | 23% | 7% | 43% | 16% |
Values of 3% or less are not labelled in the graph.
WB_Q028. Agree/Disagree with the following statements about your well-being: I would move to a better home if I could. Base: n=3,685; all respondents, excluding “don’t know” and “refused”.
Indigenous respondents (45% versus 33% of non-Indigenous respondents) and respondents from racialized population groups (45% versus 32% of other respondents) were more likely to say they would move to a better home.
Non-case managed (90%) and case managed Veterans (88%) were less likely than other respondents to say they live in a safe neighbourhood.
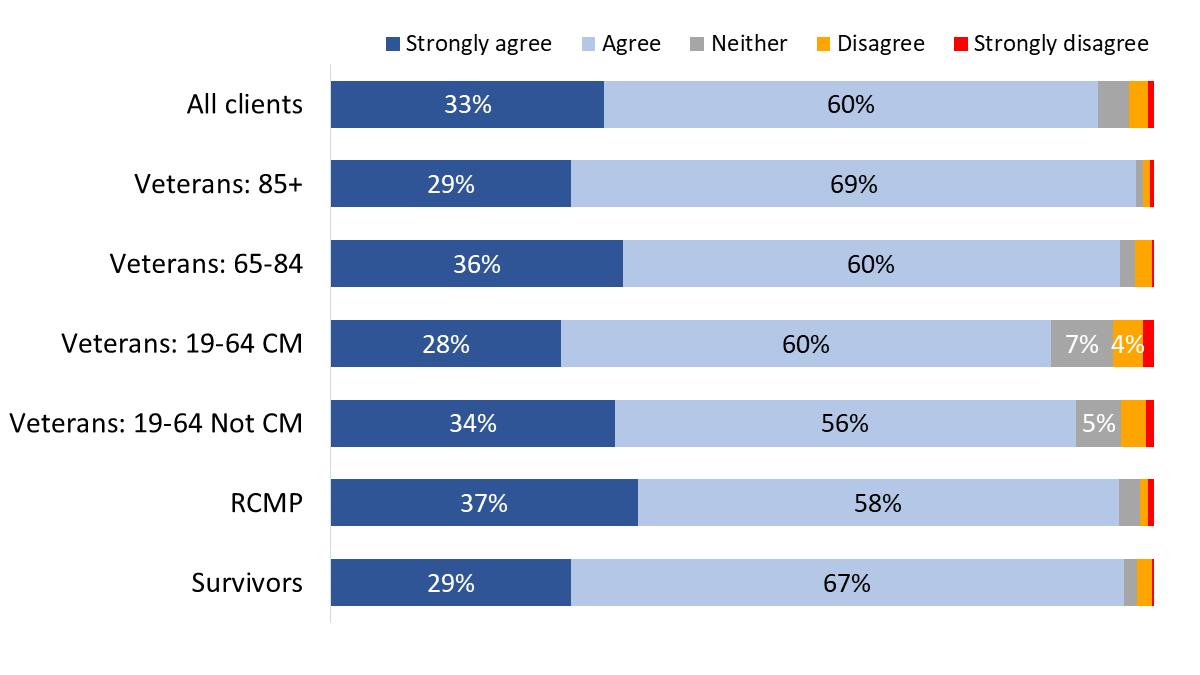
| Strongly agree | Agree | Neither | Disagree | Strongly disagree | |
| Survivors | 29% | 67% | 2% | 2% | 0% |
| RCMP | 37% | 58% | 3% | 1% | 1% |
| Veterans: 19-64 Not CM | 34% | 56% | 5% | 3% | 1% |
| Veterans: 19-64 CM | 28% | 60% | 7% | 4% | 1% |
| Veterans: 65-84 | 36% | 60% | 2% | 2% | 0% |
| Veterans: 85+ | 29% | 69% | 1% | 1% | 0% |
| All clients | 33% | 60% | 4% | 2% | 1% |
Values of 3% or less are not labelled in the graph.
WB_Q029. Agree/Disagree with the following statements about your well-being: I live in a safe neighbourhood. Base: n=3,790; all respondents, excluding “don’t know” and “refused”.
Indigenous respondents (84%) were less likely than non-Indigenous respondents (94%) to say they live in a safe neighbourhood.
Veterans and RCMP who were released from service between 2014 and 2024 were asked how much they agree or disagree with the following statement: “Overall, I experienced a smooth transition from DND/CAF or RCMP programs and benefits to VAC programs and benefits”.
In response, a small majority (53%) agreed that their transition was smooth, though agreement was far more likely to be moderate than strong. On the other hand, a sizeable minority (30%) expressed disagreement with this statement, and the rest (17%) neither agreed nor disagreed with it.
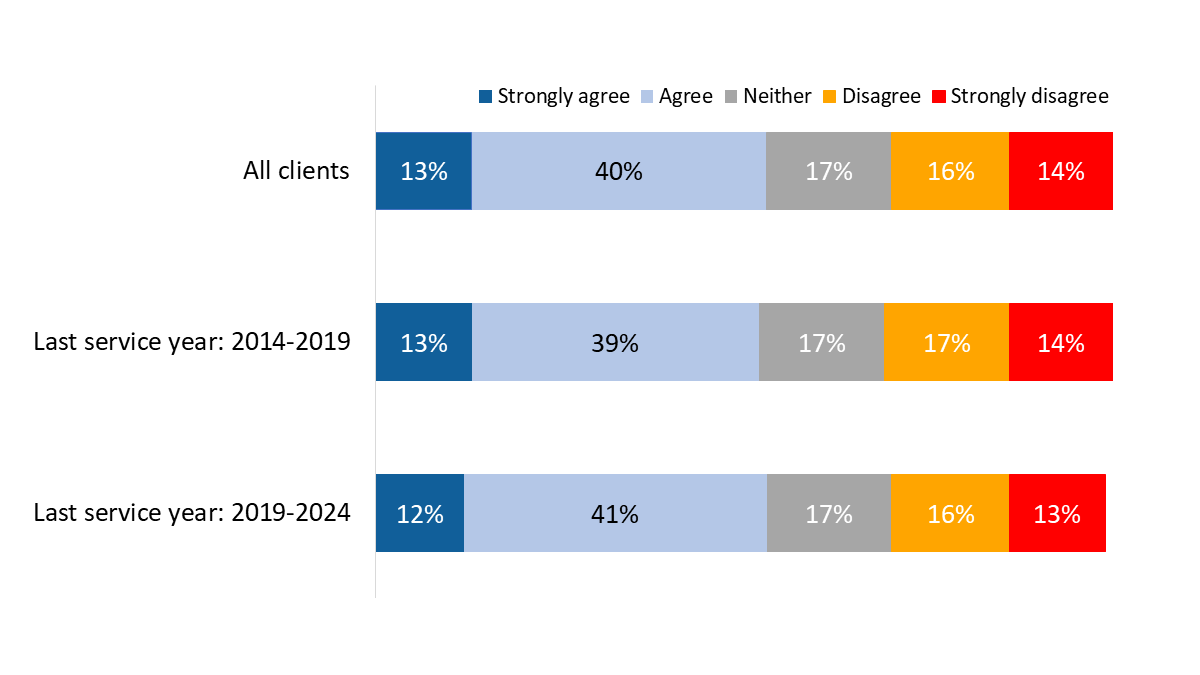
| All clients | Last service year: 2014-2019 | Last service year: 2019-2024 | |
| Strongly disagree | 14% | 14% | 13% |
| Disagree | 16% | 17% | 16% |
| Neither | 17% | 17% | 17% |
| Agree | 40% | 39% | 41% |
| Strongly agree | 13% | 13% | 12% |
WB_Q35B. How much do you agree or disagree with the following statement: Overall, I experienced a smooth transition from DND/CAF or RCMP programs and benefits to VAC programs and benefits. Base: n=977; Veterans and RCMP with a last service date between 2014 and 2024, excluding “don’t know” and “refused”.
Veterans and RCMP who were released from service between 2014 and 2024 were asked how much they agree or disagree with the statement: “I have transitioned well from military service to life after service”.
In response, a small majority (53%) agreed that they transitioned well, though agreement was more likely to be moderate than strong. On the other hand, one-third (33%) expressed disagreement with this statement, and 15% neither agreed nor disagreed with it.
Compared to 2022, the proportion of respondents who said that their transition was smooth is similar (53% in 2024 versus 59% in 2022), but in 2024 far fewer agreed strongly that this is the case (14% versus 39% in 2022).
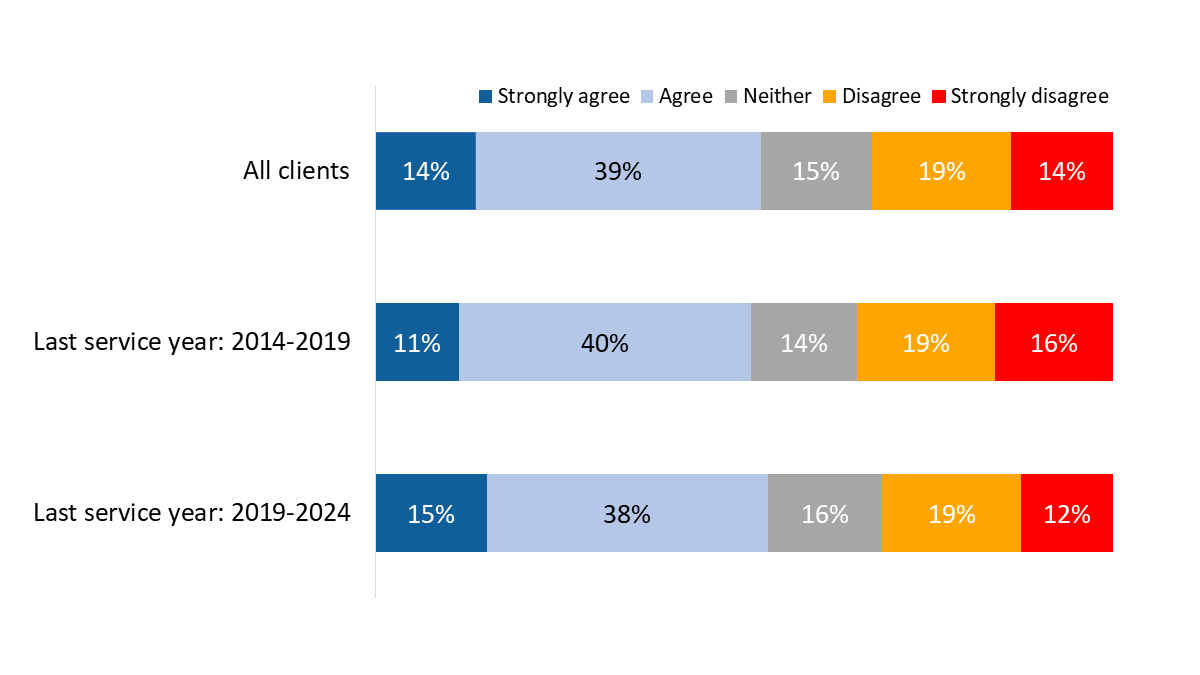
| All clients | Last service year: 2014-2019 | Last service year: 2019-2024 | |
| Strongly disagree | 14% | 16% | 12% |
| Disagree | 19% | 19% | 19% |
| Neither | 15% | 14% | 16% |
| Agree | 39% | 40% | 38% |
| Strongly agree | 14% | 11% | 15% |
WB_Q32. How much do you agree or disagree with the following statement: I have transitioned well from military service to life after service. Base: n=875; Veterans and RCMP with a last service date between 2014 and 2024, excluding “don’t know” and “refused”.
Respondents who disagreed that they transitioned well from military service to life after service (33% Veterans and RCMP with a last service date between 2014 and 2024 or 7% of all survey respondents) were asked in which of the following areas the transition did not go well:
A majority of these respondents indicated that their transition from military service to life after service did not go well in four of these areas. This included their health (64%), their sense of purpose (60%), their cultural and social environment (53%), and their sense of belonging to their community (52%). In the remaining areas, sizeable minorities indicated that their transition did not go well. This included their life skills and preparedness (49%), their financial security (46%), and their housing and physical environment (39%).
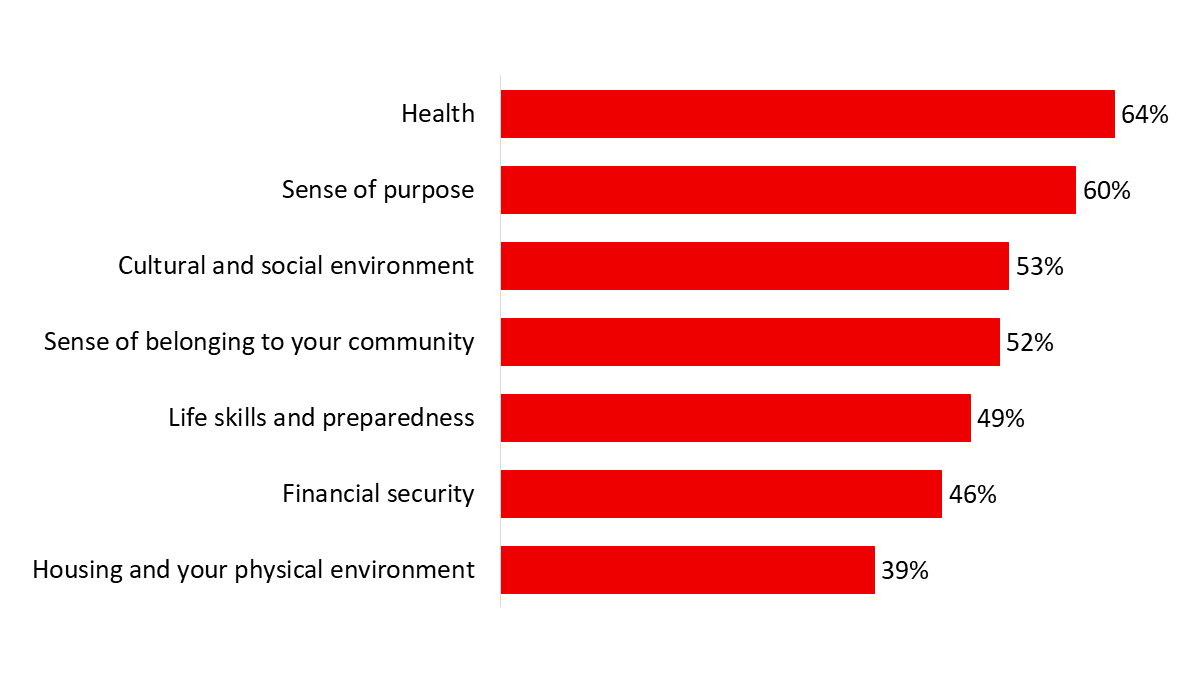
| Housing and your physical environment | 39% |
| Financial security | 46% |
| Life skills and preparedness | 49% |
| Sense of belonging to your community | 52% |
| Cultural and social environment | 53% |
| Sense of purpose | 60% |
| Health | 64% |
WB_Q32A_1-7. In which of the following areas has the transition from military service to life after service not gone well? [Multiple responses accepted] Base: n=374-396; those who did not agree that they transition well to civilian life, excluding “don’t know” and “refused”.
For their part, respondents whoagreedthat they transitioned well from military service to life after service were asked in which of these same areas the transition went well. Most said they transitioned well in each of these areas, but the size of the majority varied by area.
The vast majority said they transitioned well in terms of their housing and physical environment (95%), their life skills and preparedness (93%), and their financial security (90%). Substantial majorities also said they transitioned well in terms of their cultural and social environment (83%) and their sense of purpose (82%). Three-quarters (75%) said they transitioned well in terms of their sense of belonging to their community, and over two-thirds (69%) said they transitioned well in terms of their health.
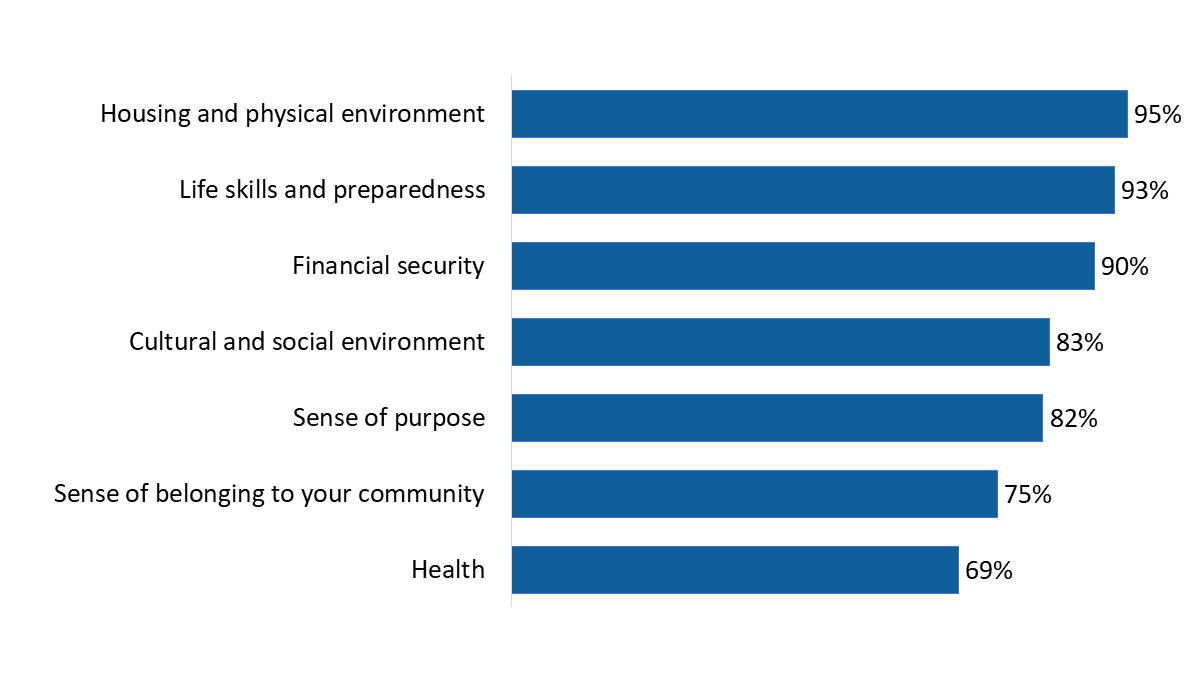
| Health | 69% |
| Sense of belonging to your community | 75% |
| Sense of purpose | 82% |
| Cultural and social environment | 83% |
| Financial security | 90% |
| Life skills and preparedness | 93% |
| Housing and physical environment | 95% |
WB_Q32B_1-7. In which of the following areas has the transition from military service to life after service gone well: [Multiple responses accepted] Base: n=374-396; those who agreed that they transition well to civilian life, excluding “don’t know” and “refused”.
Just over three-quarters of respondents (77%) said they have a family doctor. Veterans aged 85+ (92%) were the most likely to report having a family doctor, while Veterans aged 19-64 were less likely to have a family doctor.

| Survivors | 88% |
| RCMP | 86% |
| Veterans: 19-64 Not CM | 64% |
| Veterans: 19-64 CM | 61% |
| Veterans: 65-84 | 88% |
| Veterans: 85+ | 92% |
| All clients | 77% |
WB_Q33. Do you have a family doctor? Base: n=3,793; all respondents, excluding “don’t know” and “refused”.
In contrast, relatively few (18%) reported having a nurse practitioner. Veterans aged 85+ (25%), Survivors (25%) and Veterans aged 65-84 (21%) were more likely than younger Veterans and RCMP to have a nurse practitioner.
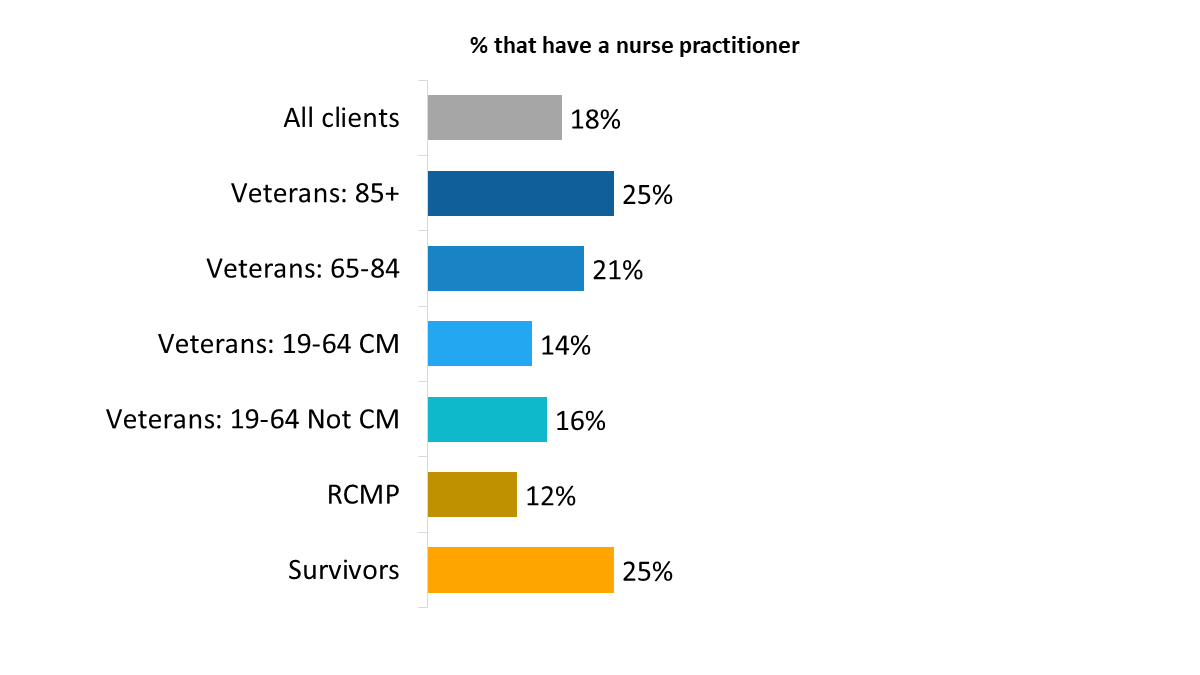
| Survivors | 25% |
| RCMP | 12% |
| Veterans: 19-64 Not CM | 16% |
| Veterans: 19-64 CM | 14% |
| Veterans: 65-84 | 21% |
| Veterans: 85+ | 25% |
| All clients | 18% |
WB_Q34. Do you have a nurse practitioner? Base: n=3,693; all respondents, excluding “don’t know” and “refused”.
Eighteen percent of respondents have neither a family doctor nor a nurse practitioner.
The following graphs present demographic data for survey respondents. All data have been weighted by age, sex, and type of respondent using proportions from the population file.
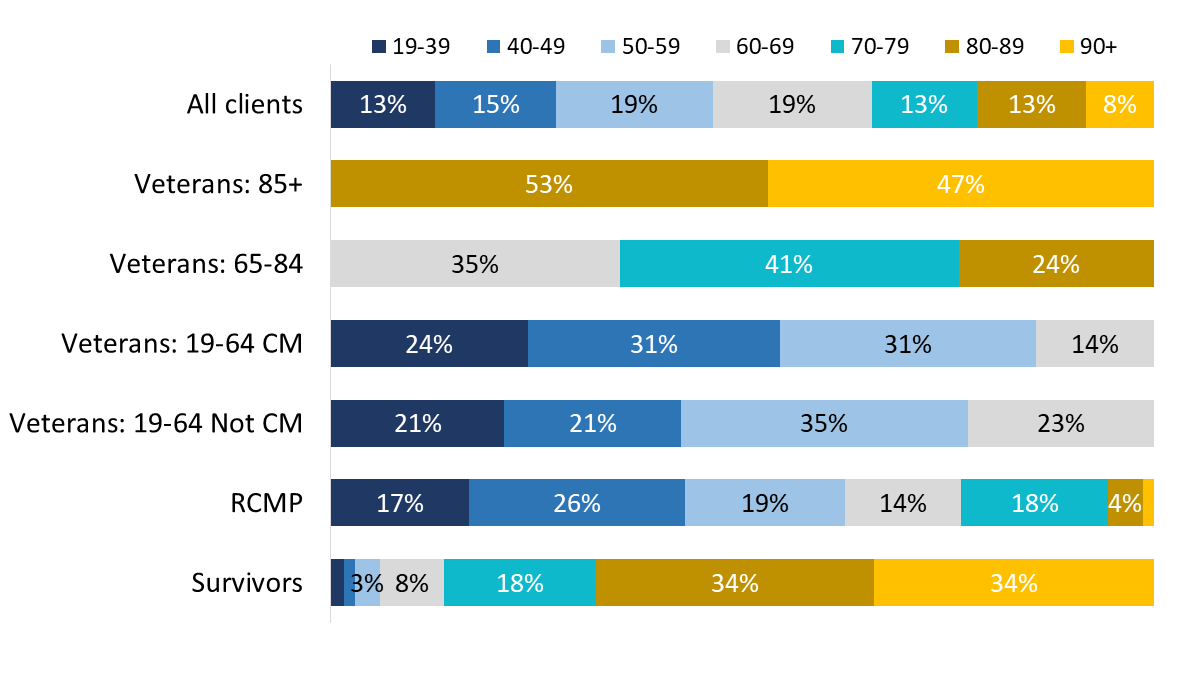
| 19-39 | 40-49 | 50-59 | 60-69 | 70-79 | 80-89 | 90+ | |
| Survivors | 2% | 1% | 3% | 8% | 18% | 34% | 34% |
| RCMP | 17% | 26% | 19% | 14% | 18% | 4% | 1% |
| Veterans: 19-64 Not CM | 21% | 21% | 35% | 23% | 0% | 0% | 0% |
| Veterans: 19-64 CM | 24% | 31% | 31% | 14% | 0% | 0% | 0% |
| Veterans: 65-84 | 0% | 0% | 0% | 35% | 41% | 24% | 0% |
| Veterans: 85+ | 0% | 0% | 0% | 0% | 0% | 53% | 47% |
| All clients | 13% | 15% | 19% | 19% | 13% | 13% | 8% |
Values of 2% or less are not labelled in the graph.
Sample variable. Base: n=3,804; all respondents.
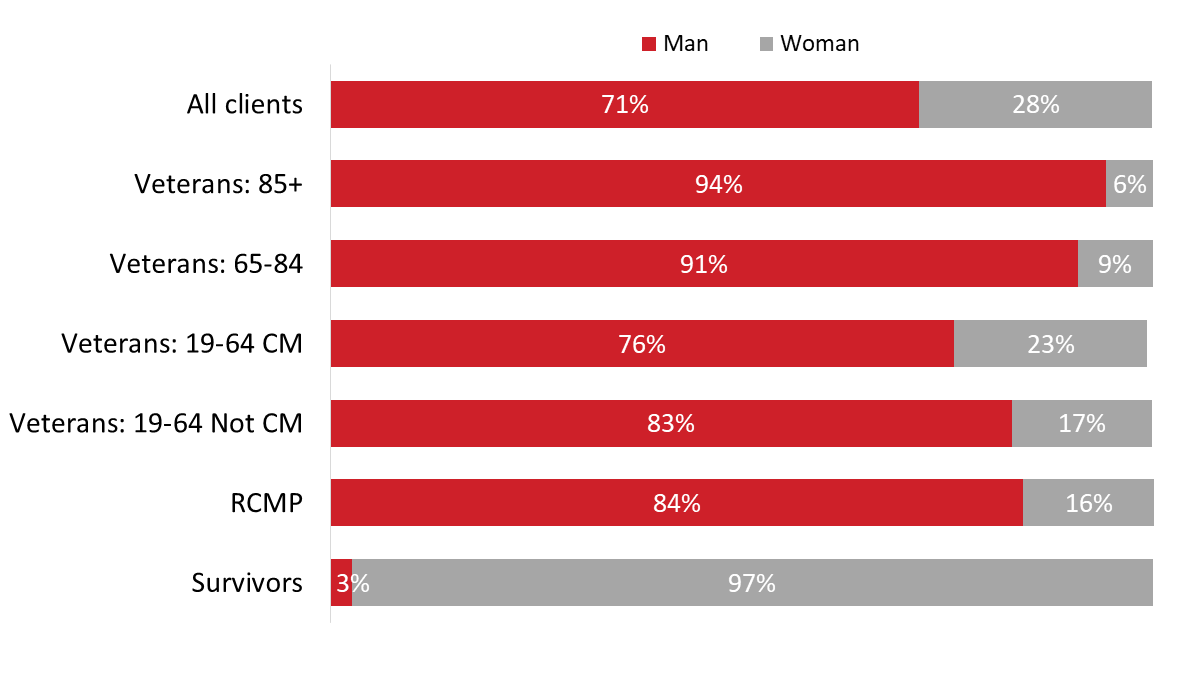
| Man | Woman | |
| Survivors | 3% | 97% |
| RCMP | 84% | 16% |
| Veterans: 19-64 Not CM | 83% | 17% |
| Veterans: 19-64 CM | 76% | 23% |
| Veterans: 65-84 | 91% | 9% |
| Veterans: 85+ | 94% | 6% |
| All clients | 71% | 28% |
DE_Q01. What is your gender? Base: n=3,804; all respondents, excluding “don’t know” and “refused”.
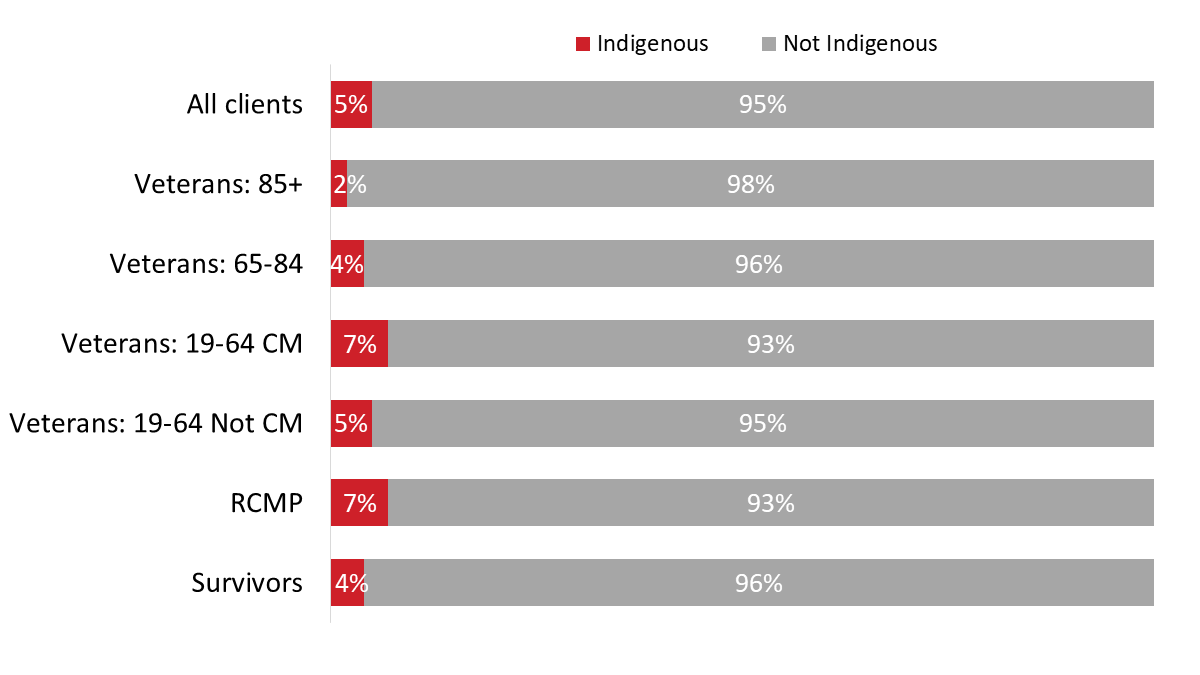
| Indigenous | Not Indigenous | |
| Survivors | 4% | 96% |
| RCMP | 7% | 93% |
| Veterans: 19-64 Not CM | 5% | 95% |
| Veterans: 19-64 CM | 7% | 93% |
| Veterans: 65-84 | 4% | 96% |
| Veterans: 85+ | 2% | 98% |
| All clients | 5% | 95% |
DE_Q03. Are you an Indigenous person, that is: First Nations, Métis, or Inuk (Inuit)? Base: n=3,767; all respondents, excluding “don’t know” and “refused”.
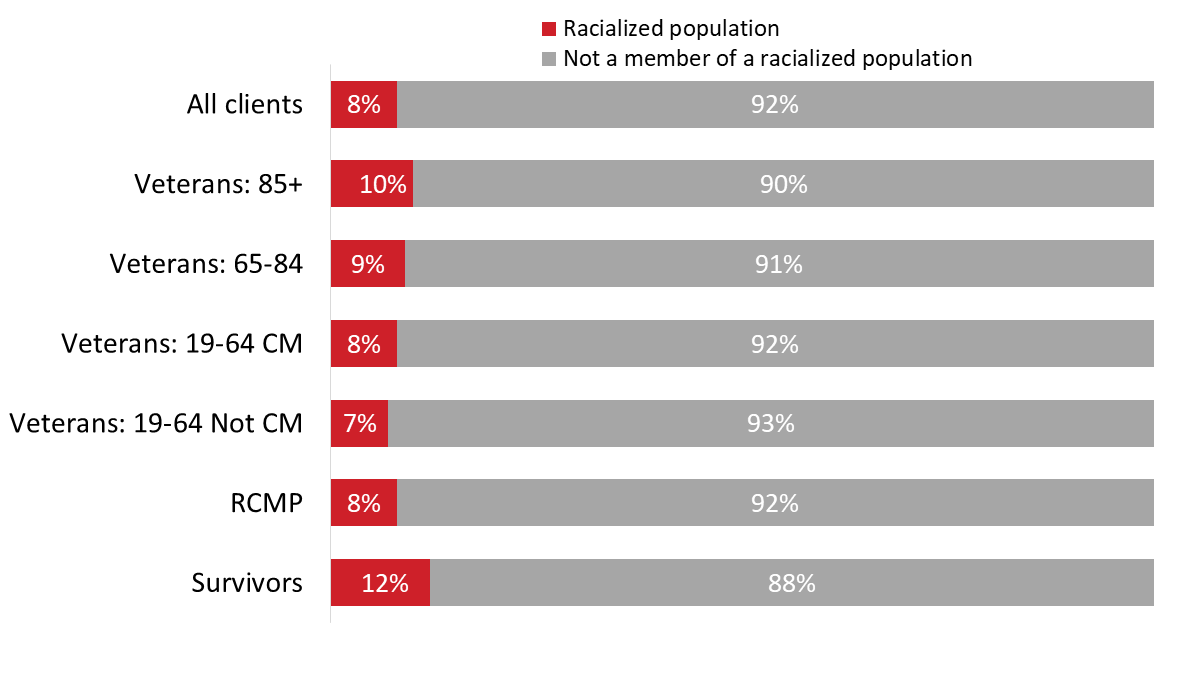
| Racialized population | Not a member of a racialized population | |
| Survivors | 12% | 88% |
| RCMP | 8% | 92% |
| Veterans: 19-64 Not CM | 7% | 93% |
| Veterans: 19-64 CM | 8% | 92% |
| Veterans: 65-84 | 9% | 91% |
| Veterans: 85+ | 10% | 90% |
| All clients | 8% | 92% |
DE_Q02. Do you identify with a racialized population group? Base: n=3,743; all respondents, excluding “don’t know” and “refused”.
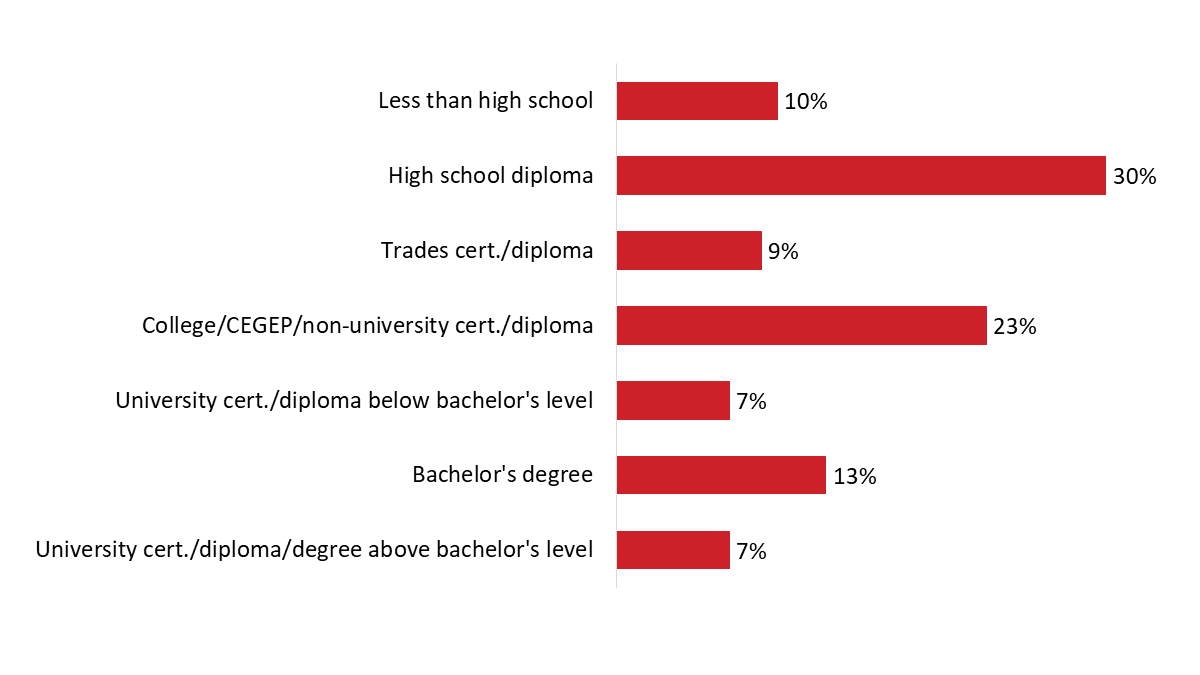
| University cert./diploma/degree above bachelor's level | 7% |
| Bachelor's degree | 13% |
| University cert./diploma below bachelor's level | 7% |
| College/CEGEP/non-university cert./diploma | 23% |
| Trades cert./diploma | 9% |
| High school diploma | 30% |
| Less than high school | 10% |
DE_Q04. What is the highest level of education that you have completed? Base: n=3,780; all respondents, excluding “don’t know” and “refused”.

| Veterans: 85+ | Veterans: 65-84 | Veterans: 19-64 CM | Veterans: 19-64 Not CM | RCMP | Survivors | |
| University cert./diploma/degree above bachelor's level | 6% | 8% | 7% | 8% | 5% | 5% |
| Bachelor's degree | 8% | 10% | 11% | 12% | 27% | 10% |
| University cert./diploma below bachelor's level | 8% | 6% | 8% | 6% | 11% | 6% |
| College/CEGEP/non-university cert./diploma | 8% | 19% | 29% | 25% | 25% | 23% |
| Trades cert./diploma | 7% | 11% | 10% | 11% | 4% | 8% |
| High school diploma | 29% | 29% | 31% | 34% | 26% | 28% |
| Less than high school | 33% | 17% | 4% | 4% | 2% | 21% |
DE_Q04. What is the highest level of education that you have completed? Base: n=3,780; all respondents, excluding “don’t know” and “refused”.
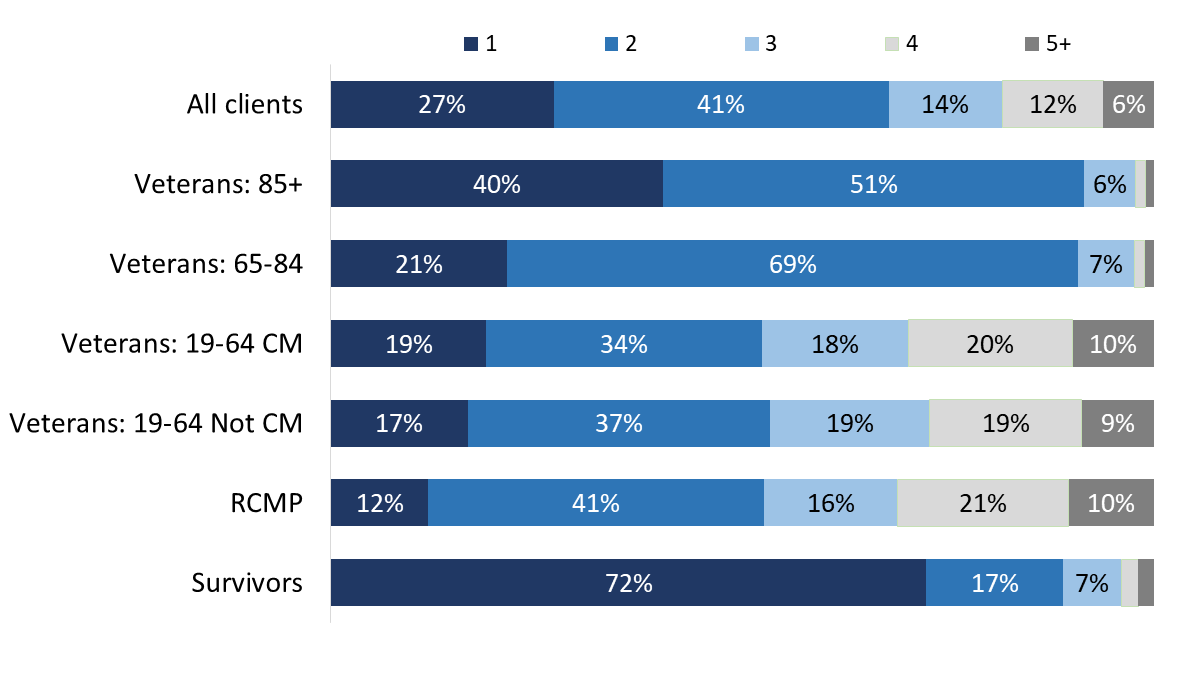
| 1 | 2 | 3 | 4 | 5+ | |
| Survivors | 72% | 17% | 7% | 2% | 2% |
| RCMP | 12% | 41% | 16% | 21% | 10% |
| Veterans: 19-64 Not CM | 17% | 37% | 19% | 19% | 9% |
| Veterans: 19-64 CM | 19% | 34% | 18% | 20% | 10% |
| Veterans: 65-84 | 21% | 69% | 7% | 1% | 1% |
| Veterans: 85+ | 40% | 51% | 6% | 1% | 1% |
| All clients | 27% | 41% | 14% | 12% | 6% |
Values of 3% or less are not labelled in the graph.
DE_Q05. Including yourself, how many people usually live in your household? Base: n=3,781; all respondents, excluding “don’t know” and “refused”.
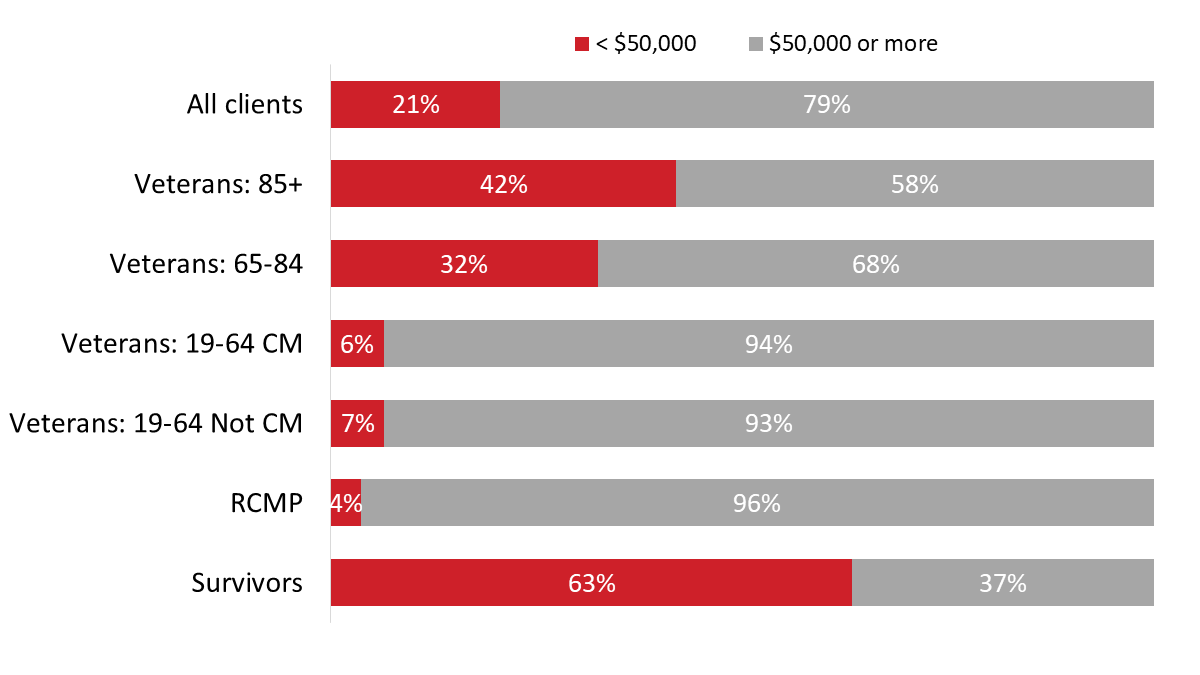
| < $50,000 | $50,000 or more | |
| Survivors | 63% | 37% |
| RCMP | 4% | 96% |
| Veterans: 19-64 Not CM | 7% | 93% |
| Veterans: 19-64 CM | 6% | 94% |
| Veterans: 65-84 | 32% | 68% |
| Veterans: 85+ | 42% | 58% |
| All clients | 21% | 79% |
DE_Q06. What is your best estimate of total household income received by all household members, from all sources, before taxes and deductions, during the year ending December 31st, 2023? Base: n=2,953; all respondents, excluding “don’t know” and “refused”.
| Type of respondent | Total No. of Surveys |
Target No. of Surveys |
|---|---|---|
| Veterans 85+ | 504 | 480 |
| Veterans 65-84 | 679 | 660 |
| Veterans 19-64 (case managed)* | 680 | 675 |
| Veterans 19-64 (not case managed)* | 972 | 945 |
| RCMP** | 404 | 400 |
| Survivors | 603 | 590 |
| Total | 3,842 | 3,750 |
*This includes Veterans and still-serving CAF members.
** This includes still-serving and retired members.2. Questionnaire
| Type of respondent | Sample Size | Margin of error |
|---|---|---|
| Veterans 85+ | 504 | ±4.4% |
| Veterans 65-84 | 679 | ±3.8% |
| Veterans 19-64 (case managed)* | 680 | ±3.8% |
| Veterans 19-64 Not (not case managed)* | 972 | ±3.1% |
| RCMP** | 404 | ±4.9% |
| Survivors | 603 | ±4.0% |
*This includes Veterans and still-serving CAF members.
** This includes still-serving and retired members.
| Sex | % Unweighted |
% Weighted |
|---|---|---|
| Male | 72% | 72% |
| Female | 27% | 27% |
| Age | % Unweighted |
% Weighted |
|---|---|---|
| Under 30 | 1% | 2% |
| 30-34 | 3% | 2% |
| 35-39 | 5% | 4% |
| 40-44 | 6% | 7% |
| 45-49 | 6% | 7% |
| 50-54 | 9% | 7% |
| 55-59 | 11% | 9% |
| 60-64 | 12% | 10% |
| 65-69 | 9% | 11% |
| 70-74 | 7% | 8% |
| 75-79 | 7% | 6% |
| 80-84 | 7% | 7% |
| 85+ | 18% | 7% |
| Type of respondent | % Unweighted |
% Weighted |
|---|---|---|
| Veterans 85+ | 13% | 6% |
| Veterans 65-84 | 18% | 18% |
| Veterans 19-64 (case managed)* | 18% | 10% |
| Veterans 19-64 (not case managed)* | 25% | 36% |
| RCMP** | 11% | 13% |
| Survivors | 16% | 16% |
*This includes Veterans and still-serving CAF members.
** This includes still-serving and retired members.
***Interviews will begin in the client’s preferred spoken language as indicated by the sample file.***
INTRO1. Hello/bonjour, may I speak to [INSERT CLIENT’S NAME FROM LIST]?
INTRO2. My name is ___________. I’m calling on behalf of Phoenix SPI, a Canadian public opinion research company, to invite you to participate in the 2024 Veterans Affairs Canada National Client Survey. Would you prefer to continue in English or French? / Préférez-vous continuer en anglais ou en français?
REQPART. Veterans Affairs Canada is always trying to improve its service offerings and your feedback would be extremely helpful. If you agree to participate, your feedback would be completely voluntary, totally anonymous, and confidential. The information you provide will be administered according to the requirements of the Privacy Act, the Access to Information Act, and any other pertinent legislation. Your participation will not affect the benefits or services you receive. The survey takes about 20 minutes to complete online and about 30 minutes to complete by phone. Should you have any questions about the survey, I can give you a contact person within Veterans Affairs Canada. Are you willing to participate?
MODE. How would you like to complete the survey? READ LIST.
CELL_1. Have I reached you today on a landline or cellphone?
CELL_2. [IF CELL_1=02] Are you able to safely speak with me right now?
EMAIL_1. To complete the survey online, may I please have your email address? We’ll send you a link to complete the survey online when you have time.
INTERVIEWER NOTE: If questioned about why emails are needed, say: “We need your email address so we can send you the survey link.”
IF PAPER IS REQUESTED FOR ACCESSIBILITY NEEDS, RECORD MAILING ADDRESS AND LET THE RESPONDENT KNOW TO EXPECT THE SURVEY BY MAIL.
DVS1. I’m so sorry to hear. On behalf of Phoenix SPI and Veterans Affairs Canada, please accept our deepest sympathies. We strive to keep our records up to date, but these situations do unfortunately happen. We understand that this must be a very stressful time. Have you notified Veterans Affairs Canada of [CLIENT NAME]’s passing?
DVS1A. Would you like the toll-free telephone number for the National Contact Centre Network to notify Veterans Affairs Canada of [CLIENT NAME]’s passing?
DVS1AA. Here’s the number: INSERT NUMBER. SKIP TO DVS2.
DVS1B. Would you like us to notify Veterans Affairs Canada?
DVS1B. Ok, we can do this for you. I just need your permission to share this information with Veterans Affairs Canada. Do I have your permission?
DVS1C. Thank you. We will notify Veterans Affairs Canada today. Once again, I’m sorry for intruding during this difficult time. Our sincerest condolences for you and your family’s loss. TERMINATE CALL.
DVS2. Ok. I’m sorry for intruding during this difficult time. Once again, I would like to offer our condolences. TERMINATE CALL.
IF THE INDIVIDUAL SOUNDS DISTRESSED, OFFER AT ANY TIME:
DVS3. Grief affects us all differently. The Veterans Affairs Canada Assistance line is available 24/7 and provides help for personal difficulties that a family member or caregiver may be experiencing, like the loss of a loved one. Would you like the contact information?
DVS3A. The telephone number 1-800-268-7708. TERMINATE CALL.
IF YOU ARE CONCERNED ABOUT THE SAFETY OF THE INDIVIDUAL OR THOSE AROUND THIS PERSON, USE THE DISTRESS AND WELL-BEING SCRIPT.
INTERVIEWER + PROGRAMMING NOTES:
IF A RESPONDENT WOULD LIKE TO SPEAK WITH SOMEONE FROM VAC, SAY: You may call Veterans Affairs Canada's National Contact Centre Network toll-free line at 1-866-522-2122. Alternatively, you may contact the project authority, Jacqueline Smith, A/Senior Operations Manager, Business Intelligence Unit, at 613-217-4231 or email: jacqueline.smith@veterans.gc.ca.
A RESPONDENT THE LEGITIMACY OF THIS SURVEY, SAY: This survey is registered with the Canadian Research Insights Council’s survey validation system. The registration number is: 20240531-PH056. The website address for the survey validation system is:
https://www.canadianresearchinsightscouncil.ca/rvs/home/.
IF ASKED HOW WE OBTAINED THE CLIENT’S NAME, SAY: Your name was provided by VAC as someone in receipt of, or who has applied to receive, benefits or services within the last 12 months.
SCALES: Read scales fully when introducing each battery of statements. Repeat the scale as needed when reading each item in the list.
CAWI:
IF A RESPONDENT SHOWS SIGNS OF DISTRESS: Refer to the distress and well-being script and protocols.
[ALL]
Throughout the remainder of the interview, I will refer to Veterans Affairs Canada as ‘VAC’. Please note this call may be recorded for quality and training purposes.
OP_Q01. During the past 12 months, did you have any contact with VAC? This could be contact initiated by you or by VAC.
[DO NOT READ]
OP_Q02. [IF OP_Q01=1] How have you been in contact with VAC in the past 12 months?
[DO NOT READ; ACCEPT MULTIPLE RESPONSES; RECORD FIRST MENTION]
OP_Q04. In general, how do you prefer to interact with VAC?
[DO NOT READ; ACCEPT 1 RESPONSE ONLY]
During the past 12 months, did you….
OP_Q05. …apply for a service or benefit?
OP_Q07. …receive a letter from VAC? [INTERVIEWER NOTE: In this context, a letter details whether clients will receive a benefit or service. This is not a general correspondence/letter from VAC.]
[DO NOT READ]
[ALL]
Thinking about your experience with VAC over the past 12 months,
CO_Q01. How easy or difficult was it to communicate with VAC? Was it …?
[READ]
[DO NOT READ]
CO_Q02. How would you rate VAC’s ability to communicate in a timely manner? Would you say it’s …?
[READ]
[DO NOT READ]
My VAC Account allows you to do business online securely with Veterans Affairs Canada.
CO_Q05. [IF OP_Q02 DOES NOT EQUAL 05] Have you used My VAC Account in the past 12 months?
[DO NOT READ]
CO_Q06. [IF CO_Q05=1 OR OP_Q02=5] When you used My VAC Account, was it a good way to find out about…?
[READ; RANDOMIZE]
RECORD OPTIONS FOR EACH:
[DO NOT READ]
CO_Q07 [IF CO_Q05=2] Why don’t you use My VAC Account?
[DO NOT READ UNLESS PROMPTING IS NEEDED. REMIND THE RESPONDENT NOT TO DISCLOSE ANY IDENTIFIABLE INFORMATION ABOUT THEMSELVES OR OTHERS, IF NEEDED. ACCEPT ALL THAT APPLY.]
[ALL]
XP_Q012. Over the past 12 months, how has VAC service changed, if at all? Is it…
[READ]
[DO NOT READ]
[IF OP_Q05=1] Earlier, you mentioned you applied for a service or benefit in the past 12 months. Were each of the following very difficult, somewhat difficult, neither difficult nor easy, somewhat easy or very easy? The first one is [READ STATEMENT].
[REPEAT SCALE AS NEEDED]
XP_Q02. The overall application process.
XP_Q01. Finding the information you needed to apply for a service or benefit.
XP_Q03. Understanding the most recent letter you received from VAC.
CO_Q03. Submitting the required information to VAC when applying for your service or benefit.
[DO NOT READ]
OP_Q06. [IF OP_Q05 =1] Which, if any, parts of the application process could be improved?
[DO NOT READ; ACCEPT MULTIPLE RESPONSES]
Thinking about the service you received from VAC during the past 12 months, do you strongly disagree, disagree, neither disagree nor agree, agree, or strongly agree with the following statements? If something does not apply to you, please just say so.
[READ]
XP_Q04. VAC staff provided a satisfactory service.
[RANDOMIZE XP_Q05-15] [REPEAT SCALE AS NEEDED]
XP_Q05. VAC staff were knowledgeable about the programs and services I inquired about.
XP_Q07. Treatment by VAC staff was exceptional.
XP_Q08. I did not feel respected by staff at VAC.
XP_Q09. VAC staff were not responsive to my needs.
XP_Q10. I had to wait too long to speak to someone at a VAC location.
XP_Q11. VAC staff communicated with me in the official language of my choice.
XP_Q13. I obtained a service or benefit in a timely manner.
XP_Q15. I understand the services and benefits offered by Veterans Affairs Canada.
XP_Q17. Overall, VAC’s programs and services meet my needs.
[DO NOT READ]
Still focusing on the past 12 months,
XP_Q14PIP. How satisfied are you with the quality of service delivery? Are you?
[READ]
[DO NOT READ]
XP_Q16. How satisfied are you with the quality of VAC’s programs and services offered? Are you?
[DO NOT READ UNLESS NEEDED]
[DO NOT READ]
If [CM] = ‘Y’
INTERVIEWER NOTE: These items will be linked to clients’ data file and only clients who have had a case plan for 90 days or more will respond to these items.
A case manager helps Veterans and former RCMP members set goals and find the services they need to overcome a challenge in their life.
SP_Q02. Do you currently have a case manager who works with you to obtain services?
[DO NOT READ]
[IF SP_Q02=1, ASK SP_Q03-SP_Q16] Thinking about your experience with Case Management services, do you strongly disagree, disagree, neither disagree nor agree, agree or strongly agree with the following statements? If something does not apply to you, please just say so. [RANDOMIZE SP_Q03-14; REPEAT SCALE AS NEEDED].
[READ]
SP_Q03. I was assigned a case manager in a reasonable amount of time.
SP_Q04. I am not happy with the working relationship I have with my current case manager.
SP_Q05. The goals in my case plan do not reflect my needs.
SP_Q06. I was involved in developing my goals for my case plan.
SP_Q07. I had the opportunity to involve family and other supporters in the development of my case plan.
SP_Q08. I had regular contact with my case manager to discuss if I was reaching my goals.
SP_Q09. I have been pleased with my progress towards achieving my goals.
SP_Q10. In working with my case manager, I became better informed on how to access VAC’s programs and services that I needed.
SP_Q11. My case manager informed me of services and supports in my community that could help me.
SP_Q12. My case manager responded to my calls in a reasonable amount of time.
SP_Q13. My case plan goals were relevant.
SP_Q14. Case Management services were beneficial to me.
[DO NOT READ]
SP_Q16. How has your life changed as a result of Case Management services? Is it …?
[READ]
[DO NOT READ]
SP_Q17. Overall, how satisfied are you with Case Management Services?
[READ]
[DO NOT READ]
[IF (VIP STATUS) = ‘In Receipt of Benefits’]
The Veterans Independence Program or VIP* offers funding for housekeeping, grounds maintenance, and other home care support services that help people to remain independent at home.
INTERVIEWER NOTE: *Pronounced V-I-P.
Do you strongly disagree, disagree, neither disagree nor agree, agree or strongly agree with the following statements about VIP? If something does not apply to you, please just say so. The first one is [READ STATEMENT]? [REPEAT SCALE AS NEEDED].
VI_Q04. Veterans Independence Program meets my needs.
VI_Q02. I rely on VIP services to help me remain in my home and community.
VI_Q03. I have been able to find service providers to help me with the VIP services I need.
[DO NOT READ]
VI_Q06. [IF VI_Q03 = 1 OR 2] What is the main reason that you have not been able to find service providers for VIP?
[DO NOT READ UNLESS PROMPTING IS NEEDED. REMIND THE RESPONDENT NOT TO DISCLOSE ANY IDENTIFIABLE INFORMATION ABOUT THEMSELVES OR OTHERS, IF NEEDED. ACCEPT 1 RESPONSE ONLY.]
VI_Q05. How, if at all, could VIP be improved?
[DO NOT READ UNLESS PROMPTING IS NEEDED. REMIND THE RESPONDENT NOT TO DISCLOSE ANY IDENTIFIABLE INFORMATION ABOUT THEMSELVES OR OTHERS, IF NEEDED. ACCEPT MULTIPLE RESPONSES.]
[IF (TREATMENT) = ‘YES’]
INTERVIEWER NOTE: If you qualify for the Treatment Benefits Program, you will receive a VAC healthcare card. This healthcare card provides coverage for such things as home health or hospital services, nursing services, appointments with specialists (such as physiotherapists, audiologists, and mental health providers), medical equipment, prosthetics, and prescriptions. The extent of your coverage will depend on a number of factors, including how you qualified, your health needs and your individual circumstances.
Health care benefits and services for eligible recipients are paid for by VAC’s Treatment Benefits Program.
Do you strongly disagree, disagree, neither disagree nor agree, agree or strongly agree with the following statements about the Treatment Benefits Program? If something does not apply to you, please just say so. The first one is [READ STATEMENT]? [REPEAT SCALE AS NEEDED].
TR_Q02. The time it took to get reimbursed for treatment benefits and services was reasonable.
TR_Q03. The Treatment Benefits Program meets my needs.
[DO NOT READ]
TR_Q04. Were you able to access the treatment benefits you needed?
[DO NOT READ]
TR_Q05. [IF TR_Q04 = 2] Why haven’t you been able to access the benefits you needed? [DO NOT READ UNLESS PROMPTING IS NEEDED. ACCEPT MULTIPLE RESPONSES]
TR_Q06. Overall, how satisfied are you with the Treatment Benefits program? Are you…
[READ]
[DO NOT READ]
[IF [DP Status] = ‘In-Pay’ or ‘Entitlement Only’]
INTERVIEWER NOTE: A disability benefit is a tax-free, financial payment to support your well-being. The amount you receive depends on the degree to which your condition is related to your service (entitlement) and the severity of your condition, including its impact on your quality of life (assessment).
The Disability Benefits program compensates for economic and non-economic effects of service-related disability, critical injuries, and death.
Do you strongly disagree, disagree, neither disagree nor agree, agree or strongly agree with the following statements about the Disability Benefits program? If something does not apply to you, please just say so. The first one is [READ STATEMENT]? [REPEAT SCALE AS NEEDED].
DB_Q02PIP. The disability benefits I receive from VAC recognize my service-related disability.
DB_Q03PIP. The disability benefits I receive from VAC compensate me for the effects of my service-related disability.
[DO NOT READ]
DB_Q04 Overall, how satisfied are you with the Disability Benefits program? Are you…
[READ]
[DO NOT READ]
[IF [Rehab] = ‘Y’ OR IF [Voc Rehab] = ‘Active’ OR ‘In Pay’]
INTERVIEWER NOTE: Rehabilitation services can improve your health and help you adjust to life at home, in your community or at work. Depending on your circumstances and needs, it may include treatment and therapies to overcome or cope with a service-related illness or injury.
The VAC Rehabilitation Services and Vocational Assistance Program provides services such as medical, psycho-social, and vocational rehabilitation to aid in Veterans’ re-establishment in life after service.
Do you strongly disagree, disagree, neither disagree nor agree, agree or strongly agree with the following statements about the program? If something does not apply to you, please just say so. The first one is [READ STATEMENT]? [REPEAT SCALE AS NEEDED].
[RANDOMIZE]
RE_Q02. My participation in VAC’s Rehabilitation Services and Vocational Assistance Program has helped improve my quality of life.
RE_Q03. The level of participation in rehabilitation services that was expected of me was realistic.
RE_Q04. I understood what was expected of me through my rehabilitation plan.
RE_Q05. My participation in rehabilitation services has been beneficial to my family or other people who support me.
RE_Q08. My participation in rehabilitation services has helped me prepare to re-enter the workforce.
[DO NOT READ]
RE_Q06. In which of the following areas has your participation in rehabilitation services had a positive impact on your functionality?
[READ; RANDOMIZE]
RECORD OPTIONS FOR EACH:
[DO NOT READ]
RE_Q06_B. Are there any other areas in which your participation has had a positive impact on your functionality?
[DO NOT READ]
RE_Q07 In which of the following areas has participation in rehabilitation services had a negative impact on your functionality?
[READ; RANDOMIZE]
RECORD OPTIONS FOR EACH:
[DO NOT READ]
RE_Q07_B. Are there any other areas in which your participation has had a negative impact on your functionality?
[DO NOT READ]
IF [ETBEligible = Y].
The Education and Training Benefit is a taxable benefit offered to eligible veterans to recognize their military service and to provide them financial help to attend college, university, technical school, or take short-term courses like career development workshops.
ET_Q01. Have you received, or are you receiving, the Education and Training Benefit?
[DO NOT READ]
ET_Q02. What was your main goal when participating in the Education and Training Benefit? Was it…?
[READ LIST. ACCEPT 1 RESPONSE].
[DO NOT READ]
ET_Q03 Overall, how satisfied are you with the Education and Training Benefit? Are you?
[READ]
[DO NOT READ]
[ALL]
VO_Q01. How familiar are you with the services of the Office of the Veterans Ombud? Are you?
[READ]
[DO NOT READ]
The role of the Office of the Veterans Ombud is to review complaints and challenge the policies and decisions of Veterans Affairs Canada where it finds individual or systemic unfairness. Do you strongly disagree, disagree, neither disagree nor agree, agree or strongly agree with the following statement about the Office -- [READ STATEMENT]?
VO_Q02. I understand the purpose and the role of the Office of the Veterans Ombud.
[DO NOT READ]
VO_Q03. Would you contact the Office of the Veterans Ombud if you have a complaint about VAC?
[ALL]
Moving on to VAC’s recognition and commemorative initiatives, which include: ceremonies, learning resources, funding for community projects and cemetery and Veterans’ grave maintenance.
Do you strongly disagree, disagree, neither disagree nor agree, agree or strongly agree with the following statements about VAC’s recognition and commemorative initiatives? The first one is [READ STATEMENT]? [REPEAT SCALE AS NEEDED; ACCEPT 97-99 IMMEDIATELY IF THE RESPONDENT INDICATES THEY CAN’T ANSWER].
CI_Q02A. I am satisfied with the way VAC’s commemorative initiatives honour those who served our country and preserve the memory of their achievements and sacrifices.
CI_Q02B. VAC’s recognition initiatives raise awareness of modern conflicts.
CI_Q02C. VAC’s commemoration and recognition initiatives raise awareness of the diverse population of Veterans who served both at home and abroad.
[DO NOT READ]
CI_Q03. Over the next year, what types of commemorative initiatives are you likely to engage or take part in?
[DO NOT READ UNLESS PROMPTING IS NEEDED; ACCEPT MULTIPLE RESPONSES]
VAC’s Funeral and Burial Program provides financial assistance for funeral, burial, and grave marking services for Veterans whose deaths are attributable to their military service and for Veterans who have insufficient funds.
Do you strongly disagree, disagree, neither disagree nor agree, agree or strongly agree with the following statements about the Funeral and Burial Program? The first one is [READ STATEMENT]? [REPEAT SCALE ONLY IF NEEDED; ACCEPT 97-99 IMMEDIATELY IF THE RESPONDENT INDICATES THEY CAN’T ANSWER].
FB_Q02A. I am satisfied that the estates of Veterans have access to financial assistance through VAC’s Funeral and Burial Program.
FB_Q02B. I am satisfied with the program that provides funding for funerals and burials to eligible Veterans.
[DO NOT READ]
You’re almost finished the survey. We appreciate your time.
WB_Q12a. In the past 12 months was your main activity working at a job or business?
WB_Q12. [If WB_Q12a = 2]. During the past 12 months, what was your main activity?
[DO NOT READ UNLESS PROMPTING IS NEEDED. ACCEPT 1 RESPONSE ONLY]
[DO NOT READ]
WB_Q12b. [IF WB_Q12a= 1] Which of the following best reflects the sector in which you work?
[DO NOT READ]
For this next set of questions, please tell me how satisfied you are with each of the following aspects of your life. The first one is [READ]. Are you very dissatisfied, dissatisfied, neither dissatisfied nor satisfied, satisfied, very satisfied?
[RANDOMIZE] [REPEAT SCALE AS NEEDED]
WB_Q02… your main job or activity?
WB_Q01… life in general?
WB_Q03… your leisure activities?
WB_Q04… your financial situation?
WB_Q05… your overall wellbeing?
WB_Q06… your relationships with other family members? [IF ASKED, SAY: family members include spouse, children, and relatives etc.]
WB_Q07… your relationships with friends?
WB_Q08… your housing?
WB_Q09…your neighbourhood?
WB_Q10. In general, would you say your health is…
[READ]
[DO NOT READ]
WB_Q11. What about your mental health? In general, would you say it is…
[READ]
[DO NOT READ]
The following questions focus on well-being. Please tell me how much you agree or disagree with the following statements. If something does not apply to you, please just say so. The first one is [READ STATEMENT]. Do you strongly disagree, disagree, neither disagree nor agree, agree or strongly agree?
[RANDOMIZE WB_Q13 THRU Q29]
WB_Q13. I have a purpose in life.
WB_Q15. I would describe myself as physically active.
WB_Q17. I interact with other people at least once a day.
WB_Q18. My spirituality gives me a feeling of security.
WB_Q19. I belong to at least one community group.
WB_Q20. I am happy living with the person or people that I live with or happy living on my own.
WB_Q22. I often feel down, depressed, or hopeless.
WB_Q24. I need help preparing meals.
WB_Q26. I have savings set aside for an unplanned expense.
WB_Q28. I would move to a better home if I could.
WB_Q29. I live in a safe neighbourhood.
[DO NOT READ]
[DO NOT ASK IF STATA =6, Survivors] WB_Q35a What was the year of your most recent release from military service or retirement from RCMP?
[DO NOT ASK IF STATA =6, Survivors OR IF THE YEAR GIVEN AT WB_Q35b IS 2013 OR EARLIER] WB_Q35b How much do you agree or disagree with the following statement: Overall, I experienced a smooth transition from DND/CAF or RCMP programs and benefits to VAC programs and benefits. Do you…?
[READ]
[DO NOT READ]
[IF CLIENT TYPE = VETERAN OR VIOR; IF RCMP AND SURVIVORS SKIP WB_Q32, A, B; ALSO SKIP IF THE YEAR GIVEN AT WB_Q35b IS 2013 OR EARLIER.]
Using the same scale, how much do you agree or disagree with the statement:
WB_Q32 I have transitioned well from military service to life after service?
[REPEAT SCALE IF NEEDED]
[DO NOT READ]
WB_Q32a. [IF WB_Q32 = 1,2,3] In which of the following areas has the transition from military service to life after service not gone well?
[READ; RANDOMIZE]
RECORD OPTIONS FOR EACH:
[DO NOT READ]
WB_Q32b. [IF WB_Q32 = 4,5] In which of the following areas has the transition from military service to life after service gone well?
[READ; RANDOMIZE]
RECORD OPTIONS FOR EACH:
[DO NOT READ]
Do you have…
WB_Q33. a family doctor?
WB_Q34. a nurse practitioner?
[DO NOT READ]
CATI:
IF WBQ11=1 OR 2 AND WBQ22=4 OR 5, READ:
We are nearing the end of the survey, and I’d like to take a moment to remind you that the VAC Assistance line is available 24/7 by calling 1-800-268-7708 or TTD/TTY number is 1-800-567-5803. The VAC assistance line provides help for mental health or personal difficulties that a Veteran, RCMP or family member or are giver is experiencing. It provides you up to 20 hours of psychological support for any given issue that you may be facing.
INTERVIEWER NOTE: IF THE PERSON ASKS FOR A CONTACT AT VAC AND IS NOT SHOWING SIGNS OF IMMEDIATE DANGER: PROVIDE THE PROJECT AUTHORITY’S NUMBER: “Would you like to contact the project authority, Jacqueline Smith, A/Senior Operations Manager, Business Intelligence Unit to discuss any help that VAC may be able to provide? She can be reached 613-217-4231 or jacqueline.smith@veterans.gc.ca?”
CAWI: SHOW FOR ALL.
We are nearing the end of the survey, and we wanted to share with you a service called The VAC Assistance line, which is available 24/7 by calling 1-800- 268-7708 or TTD/TTY number is 1-800-567-5803. The VAC assistance line provides help for mental health or personal difficulties that a Veteran, RCMP or family member/caregiver is experiencing. It provides you up to 20 hours of psychological support for any given issue that you may be facing.
I have a few last questions for background and statistical purposes. Please remember that your responses to these and other questions are voluntary and will be administered in accordance with applicable privacy legislation.
DE_Q01. What is your gender?
[READ]
[DO NOT READ]
DE_Q03. Are you an Indigenous person, that is: First Nations, Métis, or Inuk (Inuit)?
[DO NOT READ]
DE_Q02. Do you identify with a racialized population group?
Racialized groups include, among others, South Asian, Chinese, Black, Filipino, Arab, Latin American, Southeast Asian, West Asian, Korean and Japanese.
[DO NOT READ]
DE_Q04. What is the highest level of education that you have completed?
[DO NOT READ; PROBE TO CLARIFY IF UNCERTAIN WHICH RESPONSE ALIGNS WITH THE RESPONDENT’S ANSWER]
[DO NOT READ]
DE_Q05. Including yourself, how many people usually live in your household?
Reminding you that all your answers will remain confidential, what is your best estimate of total household income received by all household members, from all sources, before taxes and deductions, during the year ending December 31st, 2023?
DE_Q06. Is it less than $50,000 or at least $50,000
[DO NOT READ]
DE_Q07. [IF DE_Q06=1] Is it?
[READ UNTIL A RESPONSE IS SELECTED]
DE_Q07. [IF DE_Q06=2] Is it?
[READ UNTIL A RESPONSE IS SELECTED]
To help VAC improve programs and services, we would like to align your survey information with other information VAC has in your file. This information is protected by the Privacy Act, is confidential and will be stored on VAC’s secure servers.
INTERVIEWER NOTE – READ IF NEEDED: Once again, the information you provided will remain confidential. You will not be identified in the results provided to VAC and your responses will not affect any benefits or services you receive. The information will not be recorded in your client notes or file.
CL_Q01. For further analysis within VAC, do we have your permission to share your confidential survey data?
[READ IF NEEDED: If you say no to this further analysis, VAC will not receive access to this data directly, and instead your anonymous data will only be included in the aggregate totals of Phoenix SPI’s report.]
[DO NOT READ]
CL_Q02. Are you interested in participating in similar projects conducted by VAC in the future? For example, focus groups or interviews.
[DO NOT READ]
[READ IF NEEDED: Once again, the information you provided will remain confidential. You will not be identified in the results provided to VAC and your responses will not affect any benefits or services you receive. The information will not be recorded in your client notes or file.]
Thank you so much for completing our survey. Your information will help VAC better assist Veterans and their families. Thank you again and thank you for your service to Canada. Have a great day. Good-bye.