|
|
|
|
|
|||||||
|
|
Budget 2001 - Budget Plan
- Table of Contents - Previous - Next -
Annex 5
Canada's Financial Performance in an International Context
Introduction and Overview
- This annex compares Canada’s financial position with that of the other Group of Seven (G-7) countries (United States, United Kingdom, France, Germany, Japan and Italy).
- Two factors tend to complicate international comparisons: differences in accounting methods among countries, which affect the comparability of data, and differences in financial responsibilities among levels of government within countries. For this reason, the standardized System of National Accounts definitions and data, which are fairly uniform among countries, are used for international comparisons. The Organisation for Economic Co-operation and Development (OECD) produces a complete series of estimates based on this system. The data presented in this annex are based on the OECD’s June and November 2001 Economic Outlook publications and, as such, do not include any data revisions since then.
- Between 1992 and 2000 Canada made the most dramatic improvement in its financial situation among the G-7 countries. Over this period Canada recorded a turnaround of more than 12 percentage points in its financial balance as a share of gross domestic product (GDP), compared to 4.5 percentage points for the G-7 countries as a whole.
- In 2000 Canada’s surplus was estimated at 3.2 per cent of GDP, compared to an average deficit of 0.1 per cent for the G-7 countries.
- As a result, Canada achieved the sharpest decline in the net debt-to-GDP ratio among the G-7 countries over the past five years.
- On the basis of comparable budget-based data, the Canadian federal government achieved a surplus in 1996-97, one year earlier than the U.S. federal government. In 2000-01 the Canadian federal financial surplus stood at 1.8 per cent of GDP, compared to a surplus of 1.3 per cent in the U.S.
Canada’s financial balance has improved significantly compared to the G-7 average
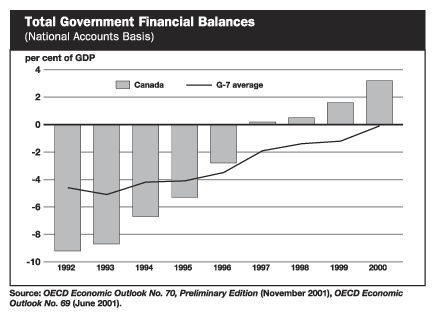
- Canada’s total government[1] financial balance has improved substantially since the early 1990s.
- The total government deficit peaked at 9.2 per cent of GDP in 1992, compared to the G-7 average deficit-to-GDP ratio of 4.6 per cent that same year.
- By 1997, however, financial improvements at all levels of government enabled Canada’s total government sector to post a surplus.
- In 2000 Canada’s surplus reached 3.2 per cent of GDP, compared to an average deficit of 0.1 per cent in the G-7 countries.
Canada has achieved the most dramatic reversal in the financial balance of any G-7 country
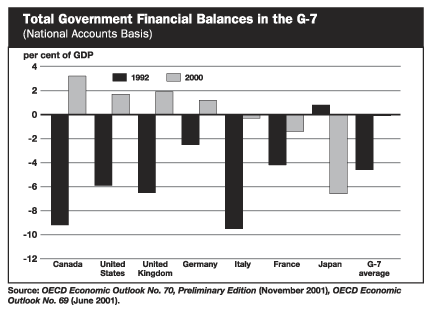
- Canada made the largest financial improvement of the G-7 countries from 1992 to 2000. In 1992 Canada had the second highest deficit in the G-7 in relation to GDP, whereas it posted the highest financial surplus relative to GDP in 2000.
- Over this period Canada’s financial balance registered a turnaround of more than 12 percentage points.
Canada’s program spending as a share of GDP has been brought in line with the G-7 average
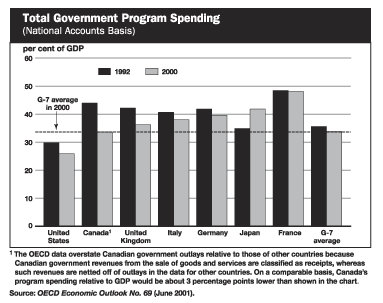
- The rapid turnaround in Canada’s financial position, as a percentage of GDP, is attributable in large part to a sharp reduction in program spending.
- Between 1992 and 2000 Canada’s total government program spending as a share of GDP was reduced by 10.4 percentage points, more than in any other G-7 country.
- In relation to the size of the economy, Canada’s program spending is now slightly below the G-7 average, while in 1992 it was well above the G-7 average.
Canada has recorded the sharpest decline in the net debt-to-GDP ratio among the G-7 countries
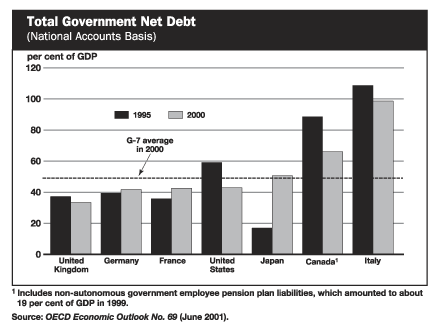
- When comparing Canada’s net debt-to-GDP ratio with those of other countries, it is important to note that the Canadian data include government employee pension liabilities. This overstates Canada’s debt position relative to countries that have large unfunded liabilities for such pensions, which are not included in the National Accounts measure of government debt. Among the G-7 countries, only U.S. debt data are strictly comparable with those of Canada.
- Canada has achieved the sharpest decline in the net debt-to-GDP ratio over the last five years. Between 1995 and 2000 the ratio fell 22.5 percentage points. However, Canada’s debt burden remains above the G-7 average.
Canada-United States Federal Comparison
- This section compares the financial situation of the Canadian federal government with that of the U.S. federal government using budget-based data.
- In making such comparisons, it is important to note that there are fundamental differences in the accounting practices and responsibilities of the Canadian and U.S. federal governments. For example, the public pension plan is considered part of the federal sector in the U.S., whereas the Canada Pension Plan is not part of the Canadian federal sector.
- That being said, a reasonable comparison of the two countries’ financial situations May be made using the financial requirements/source of the Canadian federal government (rather than the budgetary balance) and the U.S. federal unified budget balance. This primarily compares the financial situation in both countries on a cash basis of accounting.
- On this basis, both countries have achieved significant improvements since the early 1990s, moving from a deficit to a surplus position. The Canadian federal government achieved a surplus in 1996-97, one year earlier than the U.S. federal government.
- Similarly, Canadian federal market debt (rather than net public debt) is the most appropriate measure of debt to be compared with U.S. federal debt held by the public. Both countries have registered a significant decline in the market debt-to-GDP ratio since the mid-1990s.
Canada recorded a financial surplus one year earlier than the U.S.
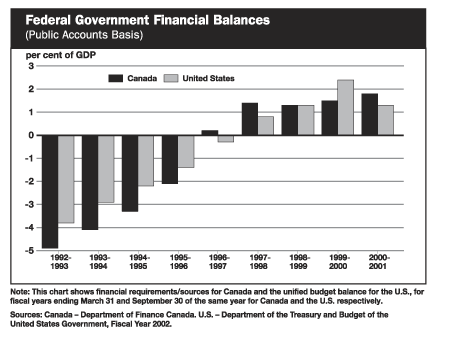
- In the early 1990s both Canada and the U.S. had significant deficits at the federal level. The Canadian federal deficit peaked at 4.9 per cent of GDP in 1992-93, compared to a deficit of 3.8 per cent in the U.S.
- However, both countries achieved a significant turnaround over the past decade, with the Canadian federal government recording a financial surplus in 1996-97, one year earlier than the U.S.
- In 2000-01 the Canadian federal financial surplus reached 1.8 per cent of GDP, slightly higher than the U.S. surplus of 1.3 per cent of GDP.
The market debt-to-GDP ratio has been significantly reduced in both countries
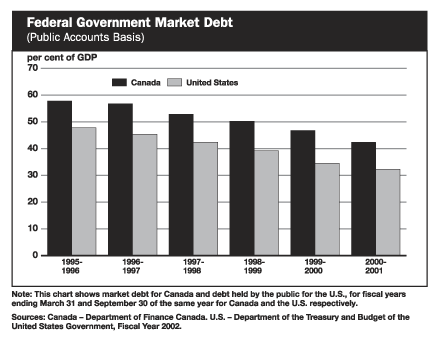
- For debt comparisons, the comparable measures are market debt for Canada and publicly held debt for the U.S.
- While the Canadian federal market debt-to-GDP ratio remains above that of the U.S., both countries have achieved a marked decline in the debt ratio since the mid-1990s. In fact, the ratio has been reduced by 15.5 percentage points in both countries since 1995-96.
[1] Includes federal, provincial-territorial and local governments as well as the Canada Pension Plan and Quebec Pension Plan. [Return]
- Table of Contents - Previous - Next -
| Last Updated: 2001-12-10 |
|
||||