
![]()
Budget 2004 - Budget Plan
- Table of Contents - Previous
- Next -
Chapter 3
Sound Financial Management
Highlights
- The Government is committed to sound financial management. This includes maintaining a prudent approach to budget planning, controlling spending and improving expenditure efficiency and oversight.
- After accounting for the fiscal impact of proposed new spending initiatives and tax cuts, this budget projects balanced budgets or better in 200304the seventh consecutive balanced budget, the first time this has happened since Confederationand in each of the next two fiscal years.
- The 2004 budget maintains the annual $3-billion Contingency Reserve and restores $1 billion in economic prudence in 200405 and 200506 to provide greater assurance that the rolling two-year balanced budget targets will be met. The Contingency Reserveif not needed to deal with unforeseen circumstanceswill go each and every year to reduce federal debt.
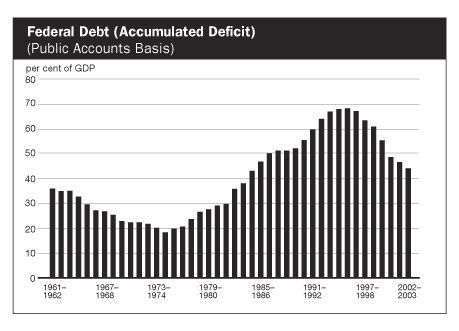
- The federal debt (accumulated deficit) as a percentage of gross domestic product (GDP) is projected to fall to 42 per cent in 200304, down from its peak of 68.4 per cent in 199596. With the commitment to balanced budgets in each of the next two fiscal years, it is forecast to decline to about 38 per cent in 200506.
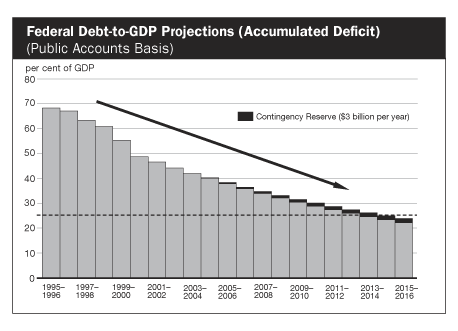
- To keep the federal debt-to-GDP ratio on a downward track so that the Government of Canada will be in a better position to address pressures resulting from an aging population, the Government is setting an objective of reducing the federal debt-to-GDP ratio to 25 per cent within 10 years.
- To help institute a new management approach in the Government of Canada, this budget implements $1 billion in annual reallocation from current spending in 200405 and beyond. The Cabinet Committee on Expenditure Review has been mandated to conduct a fundamental review of all programs with the goal of generating savings every year, building over time to at least $3 billion annually within four years. These savings will be reinvested in the priorities of Canadians while improving government management.
- The Government is also implementing significant new measures to strengthen financial management and accountability. These include re-establishing the Office of the Comptroller General of Canada and strengthening the mandates of departmental comptrollers and internal audit.
- Program expenses are expected to increase by 7.6 per cent in 200304, in part reflecting higher health-related spending and the March 2004 agricultural assistance package. They are projected to grow by an average of 4.4 per cent over the next two fiscal years, which would be no faster than projected economic growth. As a per cent of GDP, program expenses are projected to remain below 12 per cent over the 200304 to 200506 period.
- Budgetary revenues are estimated at 14.9 per cent of GDP in 200304the lowest level since the early 1960s. This largely reflects the impact of the Governments Five-Year Tax Reduction Plan. This ratio is expected to continue to decline in 200405, reflecting the impact of the final stage of the Five-Year Tax Reduction Plan. In 200506 the ratio is expected to fall to 14.7 per cent, reflecting the tax reductions proposed in this and the 2003 budget.
- The Government intends to sell its remaining shares in Petro-Canada in 200405. Based on an average of recent prices and the book value of this investment, it is expected to provide approximately $2 billion in net budgetary revenues.
Introduction
Sound fiscal management has been at the core of the Governments economic strategy over the past 10 years. This strategy has put an end to almost three decades of chronic deficits and replaced them with six consecutive years of budgetary surplusesan achievement unique among the Group of Seven (G-7) countries. With this budget, a surplus is also expected for 200304, making it the seventh annual consecutive surplus, an accomplishment unparalleled since Confederation. Prudent planning has brought Canadas debt-to-GDP ratio from the second highest level in the G-7 in the mid-1990s to the second lowest level in 2003. According to the Organisation for Economic Co-operation and Development (OECD), Canada is expected to have the lowest debt-to-GDP ratio among G-7 countries in 2004. Canadas fiscal management has been strongly endorsed by the OECD and the International Monetary Fund (IMF).
Since the Government recorded its first budget surplus in 199798, Canada has led the G-7 in job creation and real GDP growth. The Governments fiscal credibility allowed monetary policy to support the economy during the global slowdown in 2001 and to cope with a series of significant shocks that hit the Canadian economy in 2003.
The Government is committed to maintaining sound fiscal management. The 2004 budget maintains the annual $3-billion Contingency Reserve in 200405 and 200506. If it is not needed to deal with unforeseen circumstances, it will be used to reduce the debt. The budget also restores economic prudence to provide greater assurance that the rolling two-year balanced budget targets will be met.
In order to keep federal debt as a percentage of GDP on a downward track so that the Government of Canada will be better prepared to cope with the pressures resulting from population aging, the Government is setting the objective of reducing the federal debt-to-GDP ratio to 25 per cent within the next 10 years. Maintaining balanced budgets or better and using the Contingency Reserve to reduce debt, coupled with sustained economic growth, should make this objective attainable within 10 years. As a result, debt-servicing costs will absorb a smaller share of revenues, thereby freeing up resources to address the rising costs of programs on which the elderly population depends.
On December 16, 2003, the Government of Canada announced that new approaches to expenditure management and control would be implemented. The Prime Minister directed the President of the Treasury Board to complete the commitment in the 2003 budget to reallocate $1 billion of spending annually from existing programs in 200405 and beyond. This has been done. This is a step toward an extensive review of all government spending by the Cabinet Committee on Expenditure Review. The committee is to submit its first set of recommendations to the Prime Minister in the fall of 2004. These measures will be complemented by initiatives led by the President of the Treasury Board to strengthen comptrollership and improve public sector management and accountability.
This chapter provides projections for the Government of Canadas finances for 200304 and the next two fiscal years of the budget plan. It updates the fiscal projections contained in the November 2003 Economic and Fiscal Update for:
- The impact of the revised economic outlook, reflecting consultations with the private sector economic advisory group following the release of the fourth-quarter National Income and Expenditure Accounts on February 27, 2004.
- Recent financial developments.
- The impact of the spending and revenue measures proposed in this budget.
Approach to Fiscal Planning
The Governments approach to budget planning involves a number of important elements.
The first element involves using private sector economic forecasters for budget-planning purposes.
- The Department of Finance conducts surveys of private sector economic forecasters. In total, about 20 forecasters are surveyed on a regular basis, usually following the release of the quarterly National Income and Expenditure Accounts by Statistics Canada.
- Each fall and prior to the budget, the Department of Finance conducts extensive consultations with an economic advisory group, which includes the chief economists of Canadas major chartered banks and leading economic forecasting firms, to determine the economic assumptions appropriate for fiscal planning. The group was recently expanded to ensure representation from all regions of the country.
The second element involves using these economic assumptions to develop status quo fiscal projections for the regular fall Economic and Fiscal Update.
- Major private sector economic forecasting firms develop detailed fiscal projections, on a National Accounts basis, based on current tax and spending policies. These forecasts are then translated into Public Accounts projections, in consultation with the private sector economic forecasting firms, and presented in the fall Economic and Fiscal Update.
The third element involves updating the status quo projections presented in the fall Economic and Fiscal Update for the budget and adjusting these projections for prudence.
- Based on the most recent survey of private sector economic forecasters and the most recent financial results, the fiscal projections are updated by the Department of Finance.
- While the fall Economic and Fiscal Update presents fiscal projections over five years for the purposes of public debate on policy options, the budget plan covers only the current fiscal year and the next two years.
- Fiscal projections are adjusted for the Contingency Reserve and economic prudence to derive the fiscal surpluses for budget-planning purposes. The annual $3-billion Contingency Reserve is set aside to guard against unforeseen circumstances. If not needed to protect the fiscal targets against unforeseen developments, it goes to reducing the federal debt (accumulated deficit). Economic prudence has often been built in to provide further assurance against falling back into deficit. If the economic prudence is not needed, it can be directed to tax cuts, increased spending in priority areas or further debt reduction.
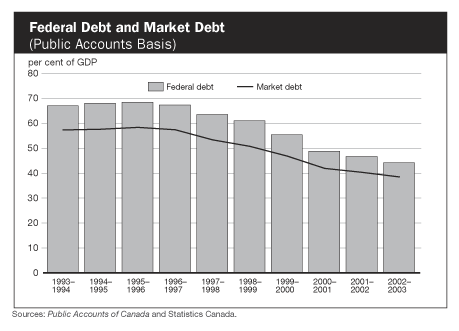
In its recent report on Canada, the IMF noted that "Canadas fiscal framework has yielded considerable success." The Government has put an end to 27 consecutive years of deficits. The federal debt (accumulated deficit) has been reduced by $52.3 billion over the past six years and, coupled with sustained economic growth, the federal debt-to-GDP ratio has been reduced from a post World War II peak of 68.4 per cent in 199596 to 44.2 per cent in 200203.
Canada is the only G-7 country expected to maintain a financial surplus
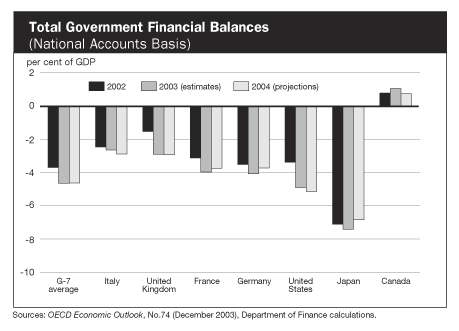
The strength of Canadas fiscal progress was demonstrated during the global economic slowdown that began in 2001, when all G-7 countries experienced considerable pressure on their finances. Canada was the only G-7 country to record a surplus in 2002 and is expected to be the only one to post a total government surplus in 2003. And according to the latest OECD forecast, Canada is expected to be the only G-7 country to be in surplus in 2004.
Canada has achieved the largest decline in the debt burden among the G-7 countries
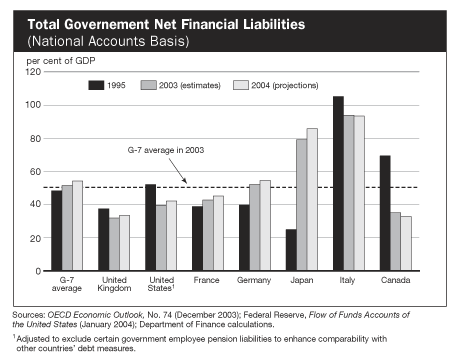
Since the mid-1990s Canadas total government sector has achieved the largest decline in the debt burden of the G-7 countries. Between 1995 and 2003 the net debt-to-GDP ratio was reduced by 34.3 percentage points. As a result, Canadas total government debt burden has moved from being the second highest in the G-7 to the second lowest in 2003. And according to the OECD, Canadas debt burden is expected to be the lowest in the G-7 in 2004.
Maintaining a Prudent Approach
Prudence is included in the budget plan to absorb the fiscal impact of short- and longer-term economic and other shocks. It provides a buffer to protect the annual balanced budget targets against the impact of possible negative economic developments. During periods of economic slowdown and/or shocks, such as those witnessed in 2003, this prudence can be drawn down to offset the impact of weaker economic growth on government revenues and expenses and to protect the annual balanced budget targets. This allows the automatic stabilizers to operate, thereby providing support to the economy, while protecting the balanced budget target.
Prudence also gives the Government the fiscal capacity to respond to emergency needs without having to reverse previous budget initiatives or going back into deficit. During 2003 there were a number of unexpected shocks that affected Canadians and required special assistance by the Government of Canada. Funding of $330 million was provided to the province of Ontario in the fight against severe acute respiratory syndrome (SARS). Assistance of $1 billion was provided in March 2004 to the agricultural sector. Funding was provided to Nova Scotia and British Columbia to compensate for some of the costs related to natural disasters in those provinces. Additional funding was also provided to National Defence to support Canadas expanded commitments in Afghanistan.
In the November 2003 Economic and Fiscal Update, responding to changed economic circumstances, the Contingency Reserve was reduced to $2.3 billion and the economic prudence was fully used. For 200405 and beyond, the Contingency Reserve was maintained but there was no economic prudence left in either 200405 or 200506.
In this budget the Contingency Reserve is set at $1.9 billion for 200304. This is after the $1-billion agricultural assistance package announced in March 2004. Thereafter the normal Contingency Reserve of $3 billion is maintained. If it is not needed for unexpected events, it will go each and every year towards debt reduction. As well, with this budget economic prudence of $1 billion is restored for both 200405 and 200506.
Setting a Goal for Lowering the Debt-to-GDP Ratio
The achievement of six consecutive annual budgetary surpluses, coupled with sustained economic growth, has resulted in a substantial reduction in the federal debt-to-GDP ratiofrom a post World War II peak of 68.4 per cent in 199596 to 44.2 per cent in 200203.
Nevertheless, the federal debt-to-GDP ratio remains well above average levels observed in the 1970s. A high debt burden leaves any country vulnerable to fluctuations in global interest rates. A high debt burden also means that a large portion of the revenue that the Government collects from taxpayers must go towards debt service payments rather than to fund valued programs and services, reduce taxes or reduce the stock of debt.
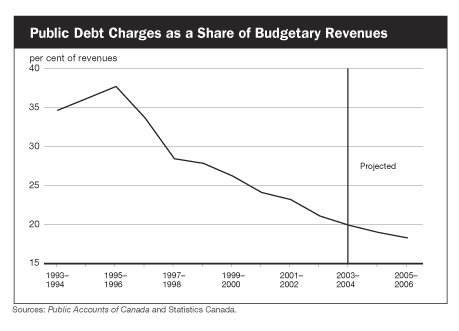
While public debt charges as a percentage of budgetary revenues have come down significantly from the peak of 37.6 per cent observed in the first half of the 1990s, they remain relatively high today. Federal debt charges still consumed 21 cents of every dollar of revenue in 200203, compared to 11 cents 30 years ago. These revenues, which are going to service the debt, are not available to fund priorities of Canadians such as health and education.
Reducing the debt burden, and hence the burden of interest charges on public debt, is made even more necessary in light of the economic and fiscal pressures that are going to result from population aging. The aging of the population will reduce the employment-to-population ratio over the coming decades, which in turn will slow the growth of government revenue. Simultaneously, the growing proportion of the population that is elderly will put pressure on government programs such as health care and pension benefits.
To ensure that the federal debt burden continues to fall, the Government of Canada is setting an objective of reducing the debt-to-GDP ratio to 25 per cent within the next 10 years. This will bring the federal debt-to-GDP ratio back to where it was in the mid-1970s. It will also bring public debt charges as a per cent of revenues down to 12 per cent within 10 years, freeing up resources for other priorities.
Controlling Spending and Improving Expenditure Efficiency
Sound financial management means more than simply avoiding deficits and reducing debt. It also means managing tax dollars well and responsibly and delivering cost-effective and efficient government services. On December 16, 2003, the Government of Canada launched an extensive set of measures to review government spending and control costs. Led by the President of the Treasury Board, this effort will implement effective management and oversight practices throughout the Government, ensuring it has the flexibility to meet the priorities of Canadians.
Controlling Spending
On December 16, 2003, the Government announced that new approaches to expenditure management and control would be implemented. Immediate measures included a freeze on major capital projects, a freeze on reclassifications, a limit on the rate of growth of the public service, and a detailed scrutiny of every expenditure.
These immediate measures helped to launch the Governments efforts to find substantial and ongoing sustainable savings, as well as new management oversight systems, as described below.
Reallocation and Efficiency ImprovementsSecuring the $1 billion
The 2003 budget committed to reallocate $1 billion from existing program expenses to fund part of the new initiatives announced in that budget. In October 2003 the then President of the Treasury Board announced that the savings for 200304 had been realized.
The President of the Treasury Board has completed the reallocation exercise and secured the savings for 200405 and beyond. As a result, reductions have been made to every portfolio, with the exception of those agencies reporting directly to Parliament. Previously approved departmental funding levels will be reduced by $1 billion in 200405 and ongoing, consistent with the commitment made in last years budget. This follows a careful review of spending by the Treasury Board. Reductions to departmental funding levels will be reflected in the revised Main Estimates that the President of the Treasury Board plans to table next fiscal year. Examples of programs eliminated or reduced include: the cancellation of the Sponsorship Program, the cancellation of the Canada History Centre, cuts to VIA Rails capital program, reductions to professional services budgets and advertising programs, and the deferral of some new building projects in Ottawa.
Reallocation and Efficiency Improvementsthe Cabinet Committee on Expenditure Review
The Government is taking additional actions to institute a new management culture in the Government of Canada. A new Cabinet Committee on Expenditure Review, chaired by the President of the Treasury Board, has been established with a mandate to conduct a fundamental review of all programs and expenditures.
The committee will assess existing program spending against a number of specific tests:
- The public interest testwhether the program area or activity continues to serve the public interest.
- The role of government testwhether there is a legitimate and necessary role for government.
- The federalism testwhether the current role of the federal government is appropriate.
- The partnership testwhether activities should or could be transferred in whole or in part to the private/voluntary sector.
- The value for money testwhether Canadians are getting the value for their tax dollar.
- The efficiency testwhether and how the efficiency of the program or activity could be improved.
- The affordability test.
The committee has also been tasked with examining other issues that contribute to government expenses, including compensation, procurement, capital assets, corporate and administrative services, information management, service delivery infrastructure, professional services, federal institutional governance and legal services.
The purpose of these reviews is to ensure that spending remains under control, that government programs are closely aligned with the evolving priorities of Canadians, and that they are delivered in an efficient and cost-effective manner. These reviews will be ongoing and will help foster a new management culture in government. The committee is to submit its first set of recommendations to the Prime Minister in the fall of 2004.
These reviews will generate savings every year, building to at least $3 billion in annual ongoing savings within four years. These savings are intended for reinvestment in the priorities of Canadians, including investments in modern public management. However, the expected savings will not be committed until they are realized.
Stronger Financial Management and Accountability
The Government is undertaking significant new initiatives to strengthen financial management, oversight and accountability in departments and agencies.
Under the leadership of the President of the Treasury Board, the Government will:
- Re-establish the Office of the Comptroller General of Canada to rigorously oversee all aspects of government spending.
- Appoint professionally accredited comptrollers to sign off on all new spending initiatives in every government department.
- Reorganize and bolster the internal audit function on a government-wide basis to ensure comprehensive audit programs, based on sound risk analysis of all departmental activities, with the authority to delve into every corner of every portfolio, no matter how small or seemingly "special." The results of these internal audits will be posted upon their completion.
- Introduce modern, real-time information systems to track all spending and provide appropriate tools for effective scrutiny and decision making. This will include the automatic electronic public disclosure of every contract entered into by the Government of Canada for amounts over $10,000, with limited exceptions such as national security.
- Introduce new corporate governance rules for Crown corporations and require that their five-year special audits, conducted by the Auditor General of Canada, be tabled in Parliament and posted on their Web sites.
Taken together, these measures will enhance scrutiny, improve administration and increase oversight and accountability. Further information of these new financial management and accountability measures is available on the Treasury Board of Canada Secretariat Web site at www.tbs-sct.gc.ca.
Fiscal Outlook Before the Measures Proposed in the 2004 Budget
Table 3.1 shows the impact of changes in the financial results to date and of the revised economic outlook on the fiscal projections presented in the November 2003 Economic and Fiscal Update. These updated projections are on a status quo basisthat is, before including any of the measures proposed in this budget.
In the November 2003 Economic and Fiscal Update, based on the fiscal results for the first five months of 200304 and after accounting for the policies announced since the February 2003 budget in response to the shocks that hit the economy in 2003, the budgetary surplus for 200304 was estimated at $2.3 billion. This amount was allocated to the Contingency Reserve. Based on the average of the four private sector economic forecasting firms, the budgetary surplus was forecast at $3.0 billion for both 200405 and 200506. These surpluses were also allocated to the Contingency Reserve. The economic prudence established in the February 2003 budget for 200405 and 200506 was eliminated, largely reflecting the impact of the weaker economy.
Since the November Economic and Fiscal Update there have been three main financial developments that have had an impact on the fiscal outcome for 200304 and future years.
- First, as indicated in the December 2003 Fiscal Monitor, corporate income tax revenues were almost triple the level in December 2002, reflecting final corporate income tax payments from those corporations with a taxation year ending October 31. As a result, corporate income tax revenues for 200304 will be much stronger than what had been estimated at the time of the November 2003 Economic and Fiscal Update.
- Second, tax data for 2002 from the Canada Revenue Agency, which became available in late January 2004, indicated that income growth in Ontario had been significantly lower than previously estimated, resulting in lower equalization entitlements for both 200203 and 200304 of roughly $1 billion per year. Although these amounts will be recovered from the equalization-receiving provinces over time, under generally accepted accounting policies a receivable for these recoveries must be established in the 200304 financial statements of the Government of Canada.
- Dampening the impact of these developments on 200304 outcome were lower goods and services tax (GST) revenues, reflecting the weakness in consumer demand in 2003.
As a result, before accounting for the measures in this budget, the surplus for 200304 is now estimated at $5.5 billion, $3.2 billion higher than the estimate of $2.3 billion in the November 2003 Economic and Fiscal Update.
This estimate is consistent with the fiscal results to the end of January 2004, as published in the January 2004 Fiscal Monitor.
For 200405 and 200506 the status quo fiscal projections incorporate the impact of the revised private sector economic outlook as described in Chapter 2. The private sector forecasters expect somewhat weaker economic growth in both 2004 and 2005 from that expected at the time of the November 2003 Economic and Fiscal Update. They have left their inflation forecast roughly unchanged since the November Update, with the result that nominal incomethe applicable tax base for budgetary revenuesis somewhat lower in both 2004 and 2005. However, the negative impact of the changed economic forecast on the fiscal outlook is partially offset by the developments described above affecting 200304, especially the higher corporate income tax revenues and the lower equalization entitlements, as these largely carry forward into 200405 and 200506.
In addition, the private sector forecasters have lowered their projections for short- and long-term interest rates, which results in lower public debt charges than those assumed in the November 2003 Economic and Fiscal Update. Changes in the other components primarily result from somewhat higher assumed revenue yields from those projected in the November 2003 Economic and Fiscal Update.
The budgetary surplus before accounting for the measures in this budget and before adjusting for prudence is now projected at $4.2 billion for 200405 and $6.6 billion for 200506.
Table 3.1
Changes in the Status Quo Fiscal Outlook
Since the November 2003 Economic and Fiscal Update
|
|
|||
| 200304 | 200405 | 200506 | |
|---|---|---|---|
|
|
|||
| (billions of dollars) | |||
| November 2003 private sector average planning surplus | 0.0 | 0.0 | 0.0 |
| Prudence | |||
| Contingency Reserve | 2.3 | 3.0 | 3.0 |
| Economic prudence | | | |
| Total | 2.3 | 3.0 | 3.0 |
| November Update budgetary surplus | 2.3 | 3.0 | 3.0 |
| Impact of economic changes1 | |||
| Budgetary revenues | |||
| Personal income tax | 0.1 | 1.0 | 1.4 |
| Corporate income tax | 2.5 | 1.6 | 2.0 |
| Other income tax | -0.1 | -0.2 | -0.1 |
| Goods and services tax | -1.5 | -2.0 | -2.0 |
| Other excise taxes and duties | 0.1 | -0.4 | -0.6 |
| Employment insurance premiums | -0.4 | -0.2 | 0.6 |
| Non-tax revenues | -0.1 | -0.1 | 0.0 |
| Total | 0.7 | -0.4 | 1.3 |
| Program expenses | |||
| Major transfers to persons | |||
| Elderly benefits | 0.0 | 0.0 | 0.2 |
| Employment insurance benefits | -0.1 | -0.2 | -0.5 |
| Major transfers to other levels of government | |||
| Federal transfer support for health and other social programs |
0.0 | -0.2 | -0.2 |
| Fiscal arrangements | 2.3 | 1.1 | 1.0 |
| Alternative Payments for Standing Programs | 0.0 | 0.1 | 0.1 |
| Direct program expenses | -0.1 | -0.1 | 0.4 |
| Total | 2.2 | 0.8 | 0.9 |
| Public debt charges | 0.4 | 0.8 | 1.4 |
| Net change | 3.2 | 1.2 | 3.6 |
| Revised "status quo" budgetary surplus | 5.5 | 4.2 | 6.6 |
|
|
|||
| 1 A positive number implies an
improvement in the budgetary balance. A negative number implies a deterioration in the budgetary balance. Note: Numbers may not add due to rounding. |
|||
Impact of Measures in Budget 2004 on the Fiscal Balance
Table 3.2 summarizes the impact of the measures proposed in Budget 2004 on the fiscal surplus for planning purposes.
The specific measures and their costs are described in Chapter 4. In addition, Table 3.2 includes the proposed costs of the March 2004 agricultural assistance package of $1 billion, the equalization and Territorial Formula Financing renewal and the restoration of funding to the Canadian Television Fund.
The net impact of the measures proposed in the 2004 budget amounts to $3.6 billion in 200304, primarily reflecting the $2.0-billion Canada Health and Social Transfer (CHST) cash payments to the provinces and territories for health care, funding of $0.5 billion to address gaps in public health readiness and the March 2004 $1-billion agricultural assistance package.
The net impact of the measures proposed in the 2004 budget amounts to $2.2 billion in 200405, rising to $2.5 billion in 200506.
The Government intends to sell its remaining shares in Petro-Canada in 200405. Based on an average of recent prices and the book value of this investment, it is expected to provide approximately $2 billion in net budgetary revenues.
As a result, the remaining budgetary surplus is $1.9 billion in 200304, $4.0 billion in 200405 and $4.0 billion 200506. For 200304 the $1.9 billion is allocated to the Contingency Reserve. A Contingency Reserve of $3 billion per year is set aside for both 200405 and 200506. If the monies allocated to the Contingency Reserve are not needed, they will reduce the federal debt. In this budget economic prudence has been established at $1 billion for 200405 and 200506.
Table 3.2
Fiscal Outlook Including March 2004 Budget Measures
|
|
|||
| 200304 | 200405 | 200506 | |
|---|---|---|---|
|
|
|||
| (billions of dollars) | |||
| Revised "status quo" budgetary surplus | 5.5 | 4.2 | 6.6 |
| Budget 2004 measures | |||
| March 2004 agricultural assistance package | 1.0 | ||
| The importance of health | 2.5 | 0.1 | 0.1 |
| The importance of learning | 0.3 | 0.5 | |
| The importance of communities | 0.1 | 0.9 | 0.8 |
| The importance of knowledge and commercialization | 0.3 | 0.4 | |
| The importance of Canadas relationship to the world | 0.4 | 0.5 | |
| Equalization/Territorial Formula Financing | 0.2 | 0.2 | |
| Other | 0.0 | 0.1 | |
| Net impact | 3.6 | 2.2 | 2.5 |
| Asset sale | -2.0 | ||
| Remaining budgetary surplus | 1.9 | 4.0 | 4.0 |
| Prudence | |||
| Contingency Reserve | 1.9 | 3.0 | 3.0 |
| Economic prudence | 1.0 | 1.0 | |
| Total | 1.9 | 4.0 | 4.0 |
| Budgetary balance | 0.0 | 0.0 | 0.0 |
|
|
|||
| Note: Numbers may not add due to rounding. | |||
Summary Statement of Transactions
Table 3.3 provides the summary statement of transactions, including the impact of all the measures proposed in this budget. The following sections describe the current fiscal outlook in more detail.
Table 3.3
Summary Statement of Transactions (Including March 2004 Budget
Measures)
|
|
||||
| Actual 200203 |
200304 | 200405 | 200506 | |
|---|---|---|---|---|
|
|
||||
| (billions of dollars) | ||||
| Budgetary transactions | ||||
| Budgetary revenues | 177.6 | 181.1 | 187.2 | 195.8 |
| Total expenses | ||||
| Program expenses | -133.3 | -143.4 | -147.9 | -156.1 |
| Public debt charges | -37.3 | -35.8 | -35.4 | -35.7 |
| Total expenses | -170.6 | -179.2 | -183.3 | -191.8 |
| Underlying budgetary surplus | 7.0 | 1.9 | 4.0 | 4.0 |
| Prudence | ||||
| Contingency Reserve | 1.9 | 3.0 | 3.0 | |
| Economic prudence | 1.0 | 1.0 | ||
| Total | 1.9 | 4.0 | 4.0 | |
| Budgetary balance | 7.0 | 0.0 | 0.0 | 0.0 |
| Federal debt (accumulated deficit) |
||||
| Balanced budget (no debt reduction) | 510.6 | 510.6 | 510.6 | 510.6 |
| Apply Contingency Reserve to debt | 510.6 | 508.7 | 505.7 | 502.7 |
| Non-budgetary transactions | 0.7 | 2.0 | -4.5 | -4.0 |
| Financial source/requirement | 7.6 | 2.0 | -4.5 | -4.0 |
| Per cent of GDP | ||||
| Budgetary revenues | 15.4 | 14.9 | 14.8 | 14.7 |
| Program expenses | 11.5 | 11.8 | 11.7 | 11.7 |
| Public debt charges | 3.2 | 2.9 | 2.8 | 2.7 |
| Budgetary balance | 0.6 | 0.2 | 0.3 | 0.3 |
| Federal debt (accumulated deficit) |
||||
| Balanced budget (no debt reduction) |
44.2 | 42.0 | 40.4 | 38.4 |
| Apply Contingency Reserve to debt |
44.2 | 41.9 | 40.0 | 37.8 |
| Other | ||||
| Public debt charges as a share of revenues | 21.0 | 19.8 | 18.9 | 18.2 |
| Annual per cent change | ||||
| Budgetary revenues | 3.4 | 2.0 | 3.4 | 4.6 |
| Program expenses | 6.6 | 7.6 | 3.1 | 5.6 |
| Total expenses | 3.6 | 5.0 | 2.3 | 4.7 |
|
|
||||
| Note: Numbers may not add due to rounding. | ||||
Consecutive annual balanced budgets or better since 199798
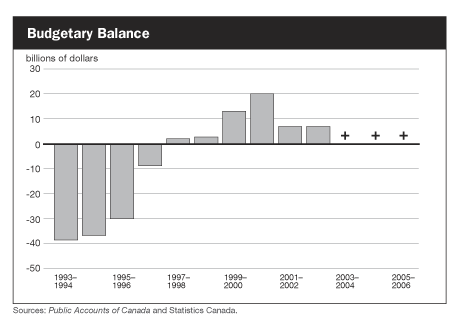
From the early 1980s to the mid-1990s, the federal deficit was stuck at about $30 billion or more per year. However, with structural reforms introduced principally in the 1995 and 1996 budgets, the deficit was eliminated and a surplus was recorded in 199798the first surplus after 27 consecutive years of deficits.
The Government of Canada has recorded six consecutive annual surpluses since then, and on the basis of this budget a balanced budget or better is expected again for 200304. This will mark the seventh consecutive balanced budget, the first time this has occurred since Confederation.
Balanced budgets or better are also projected for 200405 and 200506.
Federal debt-to-GDP ratio dropping towards 25 per cent
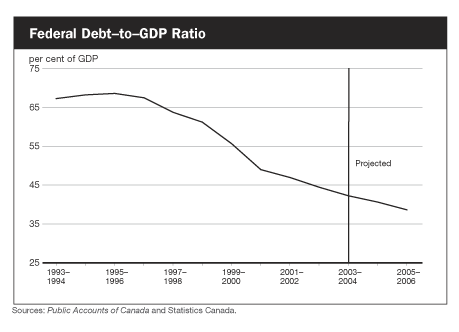
The federal debt-to-GDP ratio is the most appropriate measure of the debt burden, as it measures the federal debt (accumulated deficit) relative to the ability of the nations taxpayers to finance it.
With the reduction of federal debt of $52.3 billion in the last six years and strong economic growth, the federal debt-to-GDP ratio fell to 44.2 per cent in 200203, a decline of nearly 25 percentage points from its peak of 68.4 per cent in 199596.
The debt-to-GDP ratio is expected to decline further to 42 per cent in 200304. With balanced budgets or better and forecast economic growth, it is projected to decline to about 38 per cent by 200506.
The Government is committed to keeping the federal debt-to-GDP ratio on a downward track. In this budget it has announced its objective to lower the ratio to 25 per cent within 10 years.
Outlook for Budgetary Revenues
Budgetary revenues are expected to increase by 2.0 per cent in 200304, following an increase of 3.4 per cent in 200203 (Table 3.4). The slowdown in the rate of growth in 200304 reflects the impact of the various shocks that hit the Canadian economy in 2003 and the impact of the 2000 Five-Year Tax Reduction Plan. In both 200405 and 200506 budgetary revenues are again expected to increase more slowly than the growth in the economy, primarily reflecting the impact of tax reduction measures introduced in this and previous budgets, as well as the downward revisions to economic growth as described in Chapter 2.
Personal income tax revenues are the largest component of budgetary revenues, amounting to just over 45 per cent of total revenues. Based on the financial results to the end of January 2004 and estimates for the balance of the year based on previous years experience, personal income tax revenues are expected to increase by 2.2 per cent in 200304, down from the increase of 2.8 per cent in 200203. The lower growth in 200304 reflects the impact of the shocks that hit the economy in 2003. The increase in personal income tax revenues in 200304 is consistent with the underlying increase in the tax base, after adjusting for the impact of the tax reductions announced in previous budgets. In 200405 personal income tax revenues are expected to increase slightly slower than nominal GDP, reflecting the fiscal impact of the final year of the tax reduction measures introduced as part of the $100-billion Five-Year Tax Reduction Plan. In 200506 personal income tax revenues are projected to increase broadly in line with the growth in nominal GDP.
Corporate profits increased by 10.1 per cent in 2003. This is the main factor contributing to the strong rebound in corporate income tax revenues in 200304. Corporate income tax revenues are expected to increase by 16.7 per cent in 200304, after declining in each of the previous two fiscal years. At $25.9 billion, corporate income tax revenues are still below their peak of $28.3 billion in 200001. The increase in 200304 primarily reflects robust profitability in the financial sector and lower refunds relating to previous years reassessments. Corporate income taxes are projected to increase only marginally in 200405 and broadly in line with the growth in the economy in 200506.
Excise taxes and duties are expected to decline by 1.5 per cent in 200304, following an increase of 11.4 per cent in 200203. The decline in GST revenues primarily reflects weak consumer expenditures in 2003. Customs import duties are expected to decline by 9.0 per cent in 200304, primarily reflecting the impact of the appreciation of the Canadian dollar. Other excise taxes and duties are expected to be virtually unchanged, as the impact of lower tobacco consumption offsets increases in the other components. Thereafter the growth in excise taxes and duties is expected to be broadly in line with the growth in the economy.
Employment insurance (EI) premium revenues are expected to decline by 4.2 per cent in 200304 and 0.8 per cent in 200405. This reflects the impact of the premium rate reductions for both 2003 and 2004, which more than offsets the increase in the number of Canadians employed and therefore paying premiums. The employee premium rate for 2003 was $2.10 per $100 of insurable earnings, down from $2.20 in 2002. For 2004 the employee rate is $1.98. EI premium revenues are projected to rise slightly more than 3 per cent in 200506.
Other revenues include Crown corporation revenues, return on investments, foreign exchange revenues and revenues from the sale of goods and services. The increase in 200405 reflects the inclusion of the expected net proceeds from the sale of the Governments remaining shares in Petro-Canada.
Table 3.4
The Revenue Outlook
|
|
||||
| Actual 200203 |
200304 | 200405 | 200506 | |
|---|---|---|---|---|
|
|
||||
| (millions of dollars) | ||||
| Tax revenues | ||||
| Income tax | ||||
| Personal income tax | 81,707 | 83,500 | 86,940 | 92,455 |
| Corporate income tax | 22,222 | 25,940 | 26,245 | 27,840 |
| Other income tax | 3,291 | 3,250 | 3,285 | 3,450 |
| Total income tax | 107,220 | 112,690 | 116,470 | 123,745 |
| Excise taxes/duties | ||||
| Goods and services tax | 28,248 | 27,685 | 28,540 | 30,310 |
| Customs import duties | 3,221 | 2,930 | 3,000 | 3,085 |
| Energy taxes | 4,992 | 5,275 | 5,290 | 5,455 |
| Other excise taxes/duties | 4,475 | 4,475 | 4,490 | 4,680 |
| Air Travellers Security Charge | 421 | 390 | 355 | 370 |
| Total | 41,357 | 40,755 | 41,675 | 43,900 |
| Total tax revenues | 148,577 | 153,445 | 158,145 | 167,645 |
| Employment insurance revenues | 17,870 | 17,125 | 16,980 | 17,515 |
| Other revenues | 11,115 | 10,510 | 12,110 | 10,660 |
| Total budgetary revenues | 177,562 | 181,080 | 187,235 | 195,820 |
| Per cent of GDP | ||||
| Personal income tax | 7.1 | 6.9 | 6.8 | 6.9 |
| Corporate income tax | 1.9 | 2.1 | 2.1 | 2.1 |
| Other income tax | 0.3 | 0.3 | 0.3 | 0.3 |
| Goods and services tax | 2.4 | 2.3 | 2.2 | 2.3 |
| Excise taxes/duties (excluding GST) |
1.1 | 1.1 | 1.0 | 1.0 |
| Total tax revenues | 12.9 | 12.6 | 12.4 | 12.5 |
| Employment insurance revenues | 1.5 | 1.4 | 1.3 | 1.3 |
| Other revenues | 1.0 | 0.9 | 1.0 | 0.8 |
| Total budgetary revenues | 15.4 | 14.9 | 14.8 | 14.7 |
|
|
||||
| Note: Numbers may not add due to rounding. | ||||
| Employment
Insurance
The Employment Insurance Act required that the Canada Employment Insurance Commission set premium rates at levels that cover program costs while keeping rates relatively stable over the business cycle. However, the December 1999 Report of the Standing Committee on Finance noted that the current rate-setting process "involves not only a look forward process in assessing the level of revenues sufficient to cover program costs over a business cycle, but also a look back process by taking into consideration the level of any past excesses or shortfalls of revenues relative to program costs." As EI premium revenues and program costs are consolidated in the Governments budgetary balance, the "look back" provision, the report concluded, would cause serious disruptions to the overall management of the Governments budget. The report recommended, therefore, that EI rates be set on the basis of the level of revenues needed to cover program costs over the business cycle looking forward and not take into account the level of the cumulative surplus or deficit. Recognizing these difficulties, the Government announced that it would undertake a review of the premium rate-setting process. In the interim Bill C-2 gave power to the Governor in Council to set the rates for 2002 and 2003. In the 2003 budget the Government set the employee premium rate at $1.98 for 2004. Based on the private sector economic forecasts used in that budget, this was the rate estimated that would generate premium revenues equal to the projected program costs for 2004. In the 2003 budget the Government also launched consultations on a new permanent rate-setting mechanism based on the following principles:
The results of the consultations are now being reviewed. A summary of the consultations is available at www.fin.gc.ca. It is the Governments intention to introduce legislation to implement a new mechanism that would be consistent with these principles, taking into account the views expressed during the consultations. However, to ensure against the risk that such legislation may not be passed in time to set the rate for 2005, the Government proposes to give the Governor in Council the authority to set, in the fall of 2004, the rate for 2005. In doing so, it would set the rate in a manner consistent with the new rate-setting mechanism. For planning purposes, the Government is assuming an employee premium rate of $1.98 (per $100 of insurable earnings) for 2005, which is the rate expected to generate revenues sufficient to cover expected program costs, based on the economic assumptions used in this budget. |
Revenue ratio lowered due to tax cuts
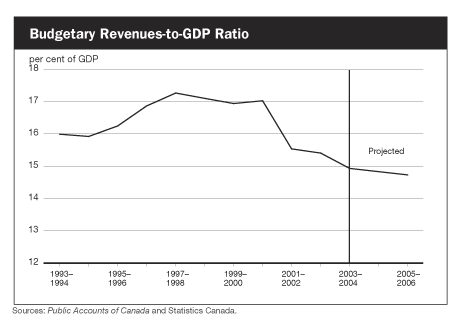
A useful perspective on movements in budgetary revenues can be obtained by examining the "revenue ratio"federal revenues in relation to total income in the economy (or GDP). This represents an approximate measure of the overall federal "tax burden" in that it compares the total of all federal revenues accrued to the size of the economy.
There is a cyclical element to the revenue ratio. It tends to decline during economic downturns and to increase during recoveries, reflecting the progressive nature of the tax system and the cyclical nature of corporate profits and capital gains. This was the primary factor underlying the increase in the revenue ratio between 199495 and 199798, as the economy recovered from the 19901991 recession.
The revenue ratio dropped significantly in 200102 due to the economic slowdown in 2001, the decline in the stock market as well as the tax reductions that came into effect in January 2001 as part of the $100-billion Five-Year Tax Reduction Plan.
The revenue ratio is expected to continue to decline to 200506 due to the ongoing impact of the tax reductions announced in previous budgets as well as further tax measures proposed in this budget.
Outlook for Program Expenses
Table 3.5 presents the program expenses outlook to 200506. Total program expenses are expected to increase by 7.6 per cent in 200304. This increase reflects the $2.5 billion of health-related spending included in this budget, $1.4 billion in assistance to the agricultural sector and funding to the province of Ontario to assist in the fight against SARS. Program expenses are projected to increase 3.1 per cent in 200405 and 5.6 per cent in 200506. Average annual growth in program expenses over the years 200304 to 200506 period is projected to be 51?2 per cent, slightly above average annual nominal GDP growth. For the next two fiscal years200405 and 200506it averages about 41?2 per cent, slightly less than the growth in nominal GDP over this period. Program expenses reflect the $1 billion of savings from reallocation from current spending referred to in the section "Reallocation and Efficiency ImprovementsSecuring the $1 billion" on page 56.
Major transfers to persons are projected to increase, reflecting both higher elderly and EI benefits. The growth in elderly benefits is largely determined by the growth in the elderly population and average benefits, which are fully indexed to quarterly changes in consumer prices. The growth in EI benefits reflects the projected increase in the number of people eligible for benefits and increases in average benefits.
Major transfers to other levels of government include cash transfers to support health and other social programs, fiscal arrangements, and Alternative Payments for Standing Programs. In the 2003 budget incremental funding was provided to the provinces and territories for health care and other social programs as part of the February 2003 First Ministers Accord on Health Care Renewal (see "The Importance of Health" in Chapter 4). As a result, liabilities with respect to the $2.5-billion health supplement and the $1.5-billion Diagnostic/Medical Equipment Fund were recorded in 200203. In January 2004 the Prime Minister committed an additional $2 billion to the provinces and territories for health. This liability is recorded in 200304. In addition, this budget provides an additional $400 million to the provinces and territories to support a national immunization strategy and to assist in enhancing their public health capacities. Thereafter the funding levels reflect the measures in the 2003 Health Accord.
The major programs under fiscal arrangements are equalization and transfers to the territories. The federal government provides equalization payments to less prosperous provinces so they can provide their residents with public services that are reasonably comparable to those in other provinces, at reasonably comparable levels of taxation.
Table 3.5
The Program Expenses Outlook
|
|
||||
| Actual 200203 |
200304 | 200405 | 200506 | |
|---|---|---|---|---|
|
|
||||
| (millions of dollars) | ||||
| Major transfers to persons | ||||
| Elderly benefits | 25,692 | 27,020 | 27,925 | 28,815 |
| Employment insurance benefits | 14,496 | 15,505 | 15,715 | 16,085 |
| Total | 40,188 | 42,525 | 43,640 | 44,900 |
| Major transfers to other levels of government |
||||
| Federal transfer support for health and other social programs | 22,600 | 22,725 | 22,050 | 24,725 |
| Fiscal arrangements | 10,366 | 8,720 | 11,170 | 11,985 |
| Alternative Payments for Standing Programs | -2,321 | -2,430 | -2,620 | -2,775 |
| Total | 30,645 | 29,015 | 30,600 | 33,935 |
| Direct program expenses | 62,490 | 71,885 | 73,610 | 77,235 |
| Total program expenses | 133,323 | 143,425 | 147,850 | 156,070 |
| Per cent of GDP | ||||
| Major transfers to persons | ||||
| Elderly benefits | 2.2 | 2.3 | 2.4 | 2.5 |
| Employment insurance benefits | 1.3 | 1.3 | 1.2 | 1.2 |
| Total | 3.5 | 3.5 | 3.4 | 3.4 |
| Major transfers to other levels of government |
||||
| Federal transfer support for health and other social programs | 2.0 | 1.9 | 1.7 | 1.8 |
| Fiscal arrangements | 0.9 | 0.7 | 0.9 | 0.9 |
| Alternative Payments for Standing Programs | -0.2 | -0.2 | -0.2 | -0.2 |
| Total | 2.7 | 2.4 | 2.4 | 2.5 |
| Direct program expenses | 5.4 | 5.9 | 5.8 | 5.8 |
| Total program expenses | 11.5 | 11.8 | 11.7 | 11.7 |
|
|
||||
| Note: Numbers may not add due to rounding. | ||||
As discussed in the section "Fiscal Outlook Before the Measures Proposed in the 2004 Budget," final personal income tax data for 2002, received from the Canada Revenue Agency in January 2004, resulted in a lowering of equalization entitlements for 200203. This has been carried forward to 200304 and the outer years. For 200304 a receivable has been established for the overpayments in both 200203 and 200304, even though these amounts will be recovered over a number of years. This accounts for the decline observed for 200304.
The equalization program is renewed every five years. Over the past five years, the federal and provincial governments have worked together to develop an approach that will make equalization payments more stable and predictable and improve the measurement of provinces abilities to raise revenues. This budget sets out the changes that the Government will propose to Parliament for the period 200405 to 200809, including a smoothing mechanism by which payments will be made more stable and predictable. These changes are expected to add an extra $1.5 billion to equalization transfers to provinces over the next five years (200405 to 200809). For further details, see Annex 6, "Renewing Equalization and Territorial Formula Financing."
The federal government is also putting in place new five-year funding arrangements with territorial governments that will commit additional resources to assist territories to invest in key priorities and respond to the unique challenges and higher costs in the North. Territorial Formula Financing (the principal federal transfer to the territories) will be increased, providing an additional $150 million over five years. The health transition funding of $20 million annually will be extended, providing another $60 million over the five-year period. The Parliamentary Secretary to the Minister of Indian Affairs and Northern Development with special emphasis on Northern Economic Development, and the Minister of Indian Affairs and Northern Development, are working to develop a northern strategy that will aim to ensure that economic development opportunities are developed in partnership with northern Canadians. This budget provides $90 million over the next five years to support this strategy. The proposals set out in this budget total $300 million over five years.
The Alternative Payments for Standing Programs represent recoveries of federal tax point abatements under contracting-out arrangements. These arrangements allow provinces to assume the administrative and financial authority for certain federal programs. In turn, the Government of Canada provides provinces with tax points, the value of which are netted against total entitlements and accordingly recovered from cash transfers. These recoveries reflect the growth in the value of the tax points.
Direct program expenses consist of subsidies and other transfers (such as assistance to farmers, students and Aboriginal peoples and for international and regional development), payments to Crown corporations and the operating expenses for departments and agencies, including National Defence. This component is expected to increase by 15.0 per cent in 200304, primarily reflecting the impact of new initiatives announced in the 2003 budget and since that budget. In the 2003 budget incremental funding was provided for National Defence, infrastructure, affordable housing and the advancement of sustainable development.
Since the 2003 budget the Government of Canada announced a number of initiatives, primarily to respond to unexpected developments during 2003. These included:
- Incremental funding for National Defence to support Canadas international commitments.
- Funding to assist in the fight against SARS, including $330 million to help the province of Ontario in recognition of its extraordinary effort to protect public health.
- Agricultural assistance of nearly $1.4 billion.
In addition, as outlined in the Annual Financial Report of the Government of Canada for 200203, direct program expenses in 200203 were affected by the impact of one-time adjustments, which lowered expenses in this component. Beyond 200304 this component is projected to grow broadly in line with the growth in nominal GDP.
Program expenses-to-GDP ratio remains below 12 per cent
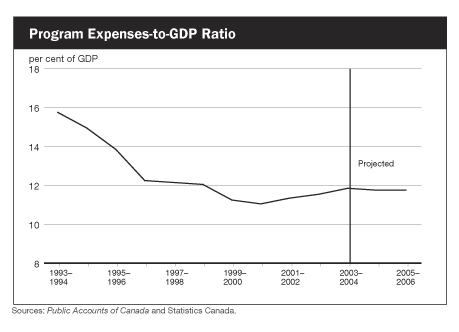
The program expenses-to-GDP ratio has declined significantly, from about 16 per cent in 199394 to 11 per cent in 200001. This decline was largely attributable to the expenditure reduction initiatives announced in the 1995 and 1996 budgets aimed at eliminating the deficit and strong economic growth in 1999 and 2000.
Since 200001 the ratio has increased to an estimated 11.8 per cent in 200304. The increase in the ratio in both 200102 and 200203 primarily reflects the impact of higher cash transfers to the provinces and territories as specified under the September 2000 and February 2003 health accords. The increase in 200304 again reflects, in part, additional funding to the provinces and territories for health care, as well as special assistance to those most affected by the unexpected shocks in 2003.
Over the next two years the ratio is projected to stabilize at 11.7 per cent.
Public debt charges consume fewer dollars
Public debt charges are projected to decline by $1.5 billion in 200304 due to a decline in the average effective interest rate on interest-bearing debt. Over the next two fiscal years they are projected to remain relatively unchanged.
Public debt charges as a percentage of government revenues are estimated to have declined from their peak of 37.6 per cent in 199596 to just under 20 per cent in 200304. This means that in 200304 the Government spent just under 20 cents of each revenue dollar on interest on the federal debt.
This ratio is expected to continue to decline, falling to about 18 per cent in 200506.
Debt Management
Effective management of the federal debt is important to all Canadians as the annual debt-servicing cost is the largest single federal government expense. The Government maintains a prudent debt structure to protect its fiscal position from unexpected increases in interest rates and to limit annual refinancing needs. One of the measures of prudence is the share of the debt that pays a fixed rate of interest, compared to a floating rate of interest. Debt that matures within the next year is considered floating, as it will be refinanced at prevailing market rates.
In the early 1990s the Government raised the fixed-rate portion of the federal debt from one-half to two-thirds to provide more cost stability in an environment of annual deficits, volatile interest rates and high debt levels. However, the increase in the fixed-rate portion of the debt increased debt-servicing costs because long-term fixed-rate debt (e.g. bonds) tends to be more costly than short-term floating-rate debt (e.g. Treasury bills).
Over the past six years the economic and fiscal position has strengthened. Canada now has low and stable inflation and interest rates, strong employment growth, lower foreign indebtedness and a current account surplus. The federal debt level has fallen by $52.3 billion and is at its lowest level, relative to the size of the economy, in nearly two decades. Over this time period market debt has been reduced by $37.1 billion. This reduction has provided the Government of Canada with greater financial stability, reduced its vulnerability to events happening beyond Canadas borders, and contributed to the restoration of Canadas triple-A credit rating.
As a result of these positive economic and fiscal developments, the Government announced in the 2003 budget that it would reduce the fixed-rate portion of the market debt in order to lower debt-servicing costs, while maintaining a prudent level of cost stability. The target for the fixed-rate portion of the debt is being reduced from two-thirds to 60 per cent. The reduction is being implemented in an orderly and transparent manner over the next few years to allow the market time to adjust.
Further details on the outlook for 200405 borrowing programs and the Governments debt structure will be provided in the 200405 Debt Management Strategy, to be released in late March.
Market debt consists of debt issued on credit markets, including Government of Canada bonds, Canada Savings Bonds and Treasury bills. The decline of $37.1 billion in market debt since 199697, coupled with sustained economic growth, has resulted in a decline in the market debt-to-GDP ratio from 57.0 per cent in 199596 to 38.1 per cent in 200203, a decline of 18.9 percentage points. This decline mirrors the rapid fall in the federal debt-to-GDP ratio.
Financial Source/Requirement
The budgetary balance is presented on a full accrual basis of accounting, recording government liabilities and assets when they are incurred or acquired, regardless of when the cash payment or receipt is made.
Table 3.6
The Budgetary Balance, Non-Budgetary Transactions and Financial
Source/Requirement
|
|
||||
|
|
Actual |
200304 |
200405 |
200506 |
|---|---|---|---|---|
|
|
||||
| (billions of dollars) | ||||
| Budgetary surplus | 7.0 | 0.0 | 0.0 | 0.0 |
| Non-budgetary transactions | ||||
| Capital investing activities | -0.9 | -1.6 | -1.5 | -1.7 |
| Other investing activities | -2.2 | -2.3 | -2.3 | -2.3 |
| Pensions and other accounts | 0.4 | 1.7 | -2.2 | -1.7 |
| Other transactions | 3.4 | 4.2 | 1.6 | 1.7 |
| Total | 0.7 | 2.0 | -4.5 | -4.0 |
| Financial source/requirement | 7.6 | 2.0 | -4.5 | -4.0 |
|
|
||||
| Note: Numbers may not add due to rounding. | ||||
In contrast, the financial source/requirement measures the difference between cash coming in to the Government and cash going out. This measure is affected not only by the budgetary balance but by the cash source/requirement resulting from the Governments investing activities through loans, investments and advances; its acquisition and disposal of capital assets; and its operating activities, primarily through the federal employee pension accounts. These activities are included in non-budgetary transactions.
With a balanced budget and a source of $2.0 billion in non-budgetary transactions, a financial source of $2.0 billion is estimated in 200304, down from $7.6 billion in 200203. Financial requirements are forecast in each of the next two fiscal years, primarily because of the transfer of Canada Pension Plan assets to the Canada Pension Plan Investment Board, as described below.
- Capital investing activities include the cash outlay for the acquisition of new tangible capital assets, proceeds from the sale of tangible capital assets, the amortization of existing tangible assets, any loss on the disposal of tangible capital assets and the change in inventories and prepaid expenses. In the calculation of the budgetary balance, the acquisition of new capital assets is not included but the amortization of existing tangible assets is. However, in the calculation of the financial source/requirement, these entries are reversed. A net cash requirement of $1.6 billion is estimated for 200304, reflecting a net increase in the acquisition of tangible capital assets, with similar amounts projected for each of the next two fiscal years.
- Other investing activities include the Governments investments in enterprise Crown corporations, such as the Canada Mortgage and Housing Corporation, Canada Post Corporation, Export Development Canada and the Business Development Bank of Canada. In addition, it includes loans, investments and advances to national and provincial governments and international organizations, and for government programs. The requirements in this component throughout the outlook period are largely attributable to borrowings on behalf of the Canada Student Loans Program.
- Pensions and other accounts include the activities of the Government of Canadas employee superannuation plans, as well as those for federally appointed judges and members of Parliament. Since April 2000 the net amount of contributions less benefit payments related to post-March 2000 service is invested in capital markets. Contributions and payments pertaining to pre-April 2000 service are recorded in the pension accounts. The Government also sponsors a variety of future benefit plans, such as health care and dental plans and disability and other benefits for war veterans and others. In addition, there are a number of other accounts, including the Canada Pension Plan Account, which the Government manages. The expected coming into force in 200405 of Bill C-3, An Act to amend the Canada Pension Plan and the Canada Pension Plan Investment Board Act, will, among other things, permit the transfer of the Canada Pension Plan operating balances to the Canada Pension Plan Investment Board. The operating balances are projected to be about $7 billion at the end of 200304. The transfer involves replacing non-market debt with market debt, with the overall level of federal debt unaffected, thereby resulting in a net financial requirement in both 200405 and 200506.
- Other transactions primarily include the conversion of other accrual adjustments included in the budgetary balance into cash, as well as foreign exchange activities. A net financial source is expected in each year of the outlook period.
Given the impact of the expected transfer of the Canada Pension Plan operating balances, the Government may seek special borrowing authority to fund the transfer through the issuance of new market debt. Under the Financial Administration Act, the Government has standing authority to refinance market debt maturing in a fiscal year. The need for additional borrowing authority will be considered later in 200405, in light of the Governments prevailing fiscal position at that time.
Sensitivity of the Fiscal Outlook to Economic Shocks
The fiscal projections are extremely sensitive to changes in economic assumptionsparticularly to changes in real economic (GDP) growth, inflation and interest rates. Table 3.7 illustrates this sensitivity to a number of economic shocks.
Table 3.7
Estimated Change in Fiscal Position
|
|
||
|
Year 1 |
Year 2 |
|
|---|---|---|
|
|
||
| (billions of dollars) | ||
| 1-per-cent decrease in real GDP growth | ||
| Revenue impact | -1.9 | -1.9 |
| Expense impact | 0.6 | 0.7 |
| Deterioration in fiscal balance | -2.5 | -2.6 |
| 1-per-cent decline in GDP inflation | ||
| Revenue impact | -1.9 | -1.8 |
| Expense impact | -0.5 | -0.5 |
| Deterioration in fiscal balance | -1.4 | -1.3 |
| 100-basis-point decrease in interest rates | ||
| Revenue impact | -0.4 | -0.5 |
| Expense impact | -1.4 | -2.0 |
| Improvement in fiscal balance | 1.1 | 1.5 |
|
|
||
| Note: Numbers may not add due to rounding. | ||
A decrease in the growth of real GDP (through equal reductions in employment and productivity) would lead to lower federal government revenues through a contraction in various tax bases and an increase in spending, primarily due to higher employment insurance benefits. Using standard sensitivity analysis, a 1-per-cent decrease in real GDP growth for one year would lower the budgetary balance by $2.5 billion in the first year and by $2.6 billion in the second year.
A 1-per-cent reduction in the growth in nominal GDP resulting solely from a one-year decline in the rate of GDP inflation would lower the budgetary balance by $1.4 billion in the first year and by $1.3 billion in year two. Most of the impact would be on budgetary revenues, as wages and profits would be lower, as well as the price of goods and services subject to sales and excise taxes. The impact on expenses would be largely reflected in those programs that are indexed to inflation, such as elderly benefit payments.
A sustained 100-basis-point decline in all interest rates would improve the budgetary balance by $1.1 billion in the first year, rising to $1.5 billion in year two. This improvement comes solely from the reduction in public debt charges, which reduces overall budgetary expenses. Expenses would fall by $1.4 billion in the first year and by $2.0 billion in year two, as longer-term debt matures and is refinanced at the lower rates. This impact is slightly larger than that presented in previous years, reflecting the reduction in the fixed-rate portion of the market debt in order to lower debt-servicing costs. Moderating this impact are somewhat lower interest earnings on the Governments interest-bearing assets, which are recorded as part of non-tax revenues.
- Table of Contents - Previous - Next -
|
|
|||||
| Last Updated: 2004-03-23 |
|
| |||