
![]()
Budget 2005 - Budget Plan
- Table of Contents - Previous
- Next -
Chapter 2
Economic Developments and Prospects
Highlights
- Canada has achieved an outstanding fiscal turnaround since the early 1990s. This, combined with low and stable inflation, has enabled the economy to better weather economic shocks.
- Exceptionally strong employment growth (the highest in the Group of Seven) and improved productivity growth have given Canada the fastest rate of increase in living standards among G-7 countries since balancing the budget in 1997.
- The Canadian economy grew at a solid pace in the first three quarters of 2004, thanks to consistent growth in final domestic demand. Real gross domestic product (GDP) advanced 2.7 per cent in the first quarter before strengthening to 3.9 per cent in the second and 3.2 per cent in the third.
- Since the end of 2002, the Canadian dollar has appreciated more than 25 per cent against the U.S. dollar. On a trade-weighted basis, the Canadian dollar has risen more than any other major floating currency. Adjusting to this rapid appreciation is a major challenge for Canadian exporters.
- Private sector forecasters expect somewhat weaker near-term economic growth than previously anticipated. When surveyed in December by the Department of Finance, the forecasters expected growth to be 2.9 per cent in 2005, down from 3.2 per cent in the November 2004 Economic and Fiscal Update. For 2006, they expect growth of 3.1 per cent, unchanged from the November Update.
- Despite the still-encouraging growth outlook for the Canadian and global economies, there remain significant risks.
- In the near term, the large and persistent U.S. current account deficit presents a key risk. This imbalance could result in a further depreciation of the U.S. dollar against all major currencies, including the Canadian dollar. The speed at which the economy adjusts to an appreciation of the Canadian dollar and the magnitude of the adjustment are also uncertain.
- Over the medium term, the U.S. budget deficit remains the principal downside risk. If not corrected, the deficit could put upward pressure on interest rates, crowd out business investment and dampen growth in both the U.S. and Canada. Conversely, a serious effort to reduce the budget deficit could temporarily lower growth in the U.S., which would also negatively affect Canadian growth.
- While the risks to the outlook are negative on balance, a strong macroeconomic framework has improved Canada’s ability to deal with these risks should they materialize.
Introduction
This chapter reviews recent economic developments and prospects. Using the average of private sector economic forecasts, it establishes the economic-planning assumptions that underlie the Government’s budget plan and presents an assessment of risks and uncertainties associated with the economic outlook.
The Canadian economy recorded solid growth in the first three quarters of 2004, supported by healthy increases in final domestic demand. Strong global growth in 2004 and rising demand for Canadian commodities contributed to a mid-year burst of increased export activity. However, the rising Canadian dollar took its toll on exports in the latter part of the year.
Looking ahead, forecasters expect somewhat weaker near-term economic growth than estimated at the time of the November 2004 Economic and Fiscal Update. This reflects the recent appreciation of the Canadian dollar. The risks to the forecast are mainly external, stemming from uncertainty about further exchange rate adjustments and their impact on domestic demand.
Before turning to recent developments in the Canadian economy and the outlook, this chapter will review Canada’s fiscal and monetary framework, which has contributed to sustained improvements in Canadian living standards over the past eight years and enhanced the overall resiliency of the economy.
A Review of Canada’s Macroeconomic Framework
A decade of achievement—Canada’s fiscal turnaround is unmatched among G-7 countries
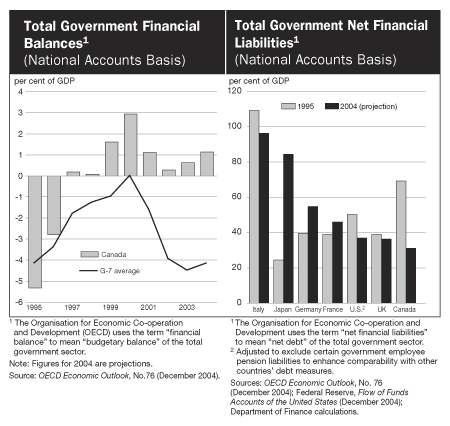
- Canada’s fiscal performance over the past 10 years is unmatched among G-7 countries. In 1995 Canada’s total government deficit was well above the G-7 average. However, significant fiscal improvements at all levels of government enabled Canada’s total government to post a surplus in 1997. Since then Canada has recorded a total government surplus every year, while the average deficit among G-7 countries has deteriorated rapidly since 2000. Indeed, Canada has been the only G-7 country to record a total government budget surplus in each of the past three years. This strong overall fiscal performance, together with sustained economic growth, has given Canada a net debt-to-GDP ratio of a projected 31 per cent in 2004, the lowest in the G-7.
- The macroeconomic reforms taken over the last decade have enabled the Canadian economy to weather economic shocks better than in the past. The OECD recently acknowledged this benefit, stating: "the Canadian economy has delivered solid performance for nearly a decade with increased resilience to economic shocks, demonstrating the benefits of a well designed macroeconomic framework and the pay off from a range of structural reforms implemented since the late 1980s."[1]
Improved national saving has put net foreign debt on a firm downward track
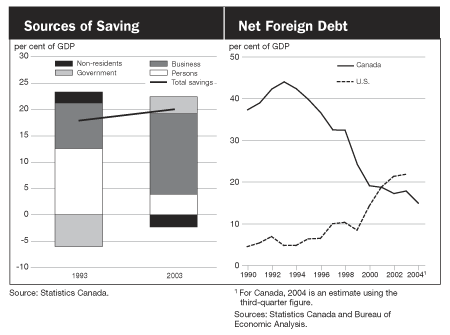
- In 1993 the total government deficit meant that Canada needed foreign sources of saving of 2.1 per cent of GDP to finance domestic investment. As a result, net foreign debt as a share of GDP increased, peaking at more than 43 per cent in 1993.
- However, the shift from deficits to surpluses has reduced Canada’s reliance on foreign sources of funds and has helped generate sustained current account surpluses, lowering Canada’s net foreign debt to about 15 per cent of GDP in 2004.
- Reducing net foreign debt benefits Canada by reducing net investment income flows to foreigners and cutting the economy’s exposure to global financial market shocks.
- These developments stand in sharp contrast to the United States, where large current account deficits raised the stock of net foreign debt as a per cent of GDP to more than 21 per cent by 2003.
Years of low and stable inflation, along with a track record of fiscal discipline, have led to low interest rates
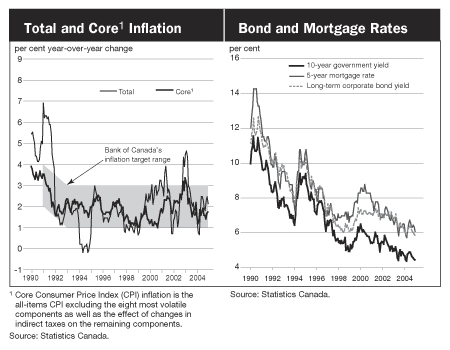
- The credibility of Canada’s monetary policy, achieved through more than a decade of low and stable inflation, has complemented fiscal reform.
- Since 1993 inflation in Canada has averaged 1.9 per cent, which is very close to the mid-point of the current inflation-targeting range of 1 to 3 per cent agreed upon by the Bank of Canada and the Government of Canada.
- Low and stable inflation, together with a strong fiscal position, has given the Bank of Canada the flexibility to respond quickly and decisively to negative shocks either from external sources, such as the global slowdown in 2001, or domestic shocks such as the economic effects of severe acute respiratory syndrome and bovine spongiform encephalopathy (mad cow disease).
- Furthermore, by eliminating the deficit and moving to sustained fiscal surpluses in 1997, Canada has improved its international fiscal credibility, restoring its AAA rating in financial markets. This in turn has led to reductions in risk premiums and interest rates.
- Lower interest rates and the reduction of public debt have trimmed debt-servicing costs, freeing up resources to deliver significant tax reductions to all Canadians and to invest in key strategic areas in support of economic growth. Lower interest rates have also provided strong support to interest-sensitive sectors such as housing, consumer spending and business investment.
Sound fiscal and monetary policies have contributed to increased employment and sustained improvements in Canadian living standards
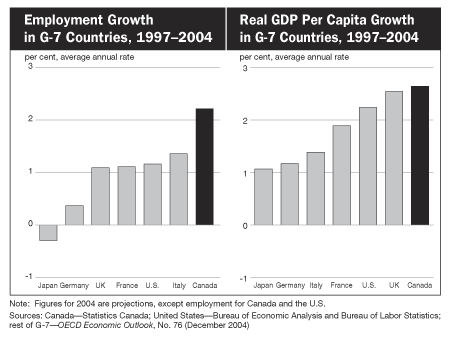
- Improved fiscal and monetary policies have created the conditions for stronger growth in employment and productivity. These two factors have driven significant gains in Canadian living standards since 1997.
- Canada achieved exceptionally strong employment growth between 1997 and 2004—by far the best in the G-7 and nearly double the pace recorded in the U.S. In 2003 Canada had the second highest employment rate—the proportion of Canadians between the ages of 15 and 64 with a job[2]—in the G-7.
- Productivity growth in Canada has also improved, rising on average 1.7 per cent per year over the past eight years, compared with average growth of 1.1 per cent per year between 1980 and 1996.
- Between 1997 and 2004 Canada ranked first in the G-7 in average real GDP per capita growth, which is the most commonly used measure of the change in average living standards. This is the result of stronger employment and productivity growth. Canada’s real GDP per capita increased more in the past 8 years than in the previous 18.
Recent Canadian Economic Developments
Final domestic demand supported Canadian economic growth in the first three quarters of 2004
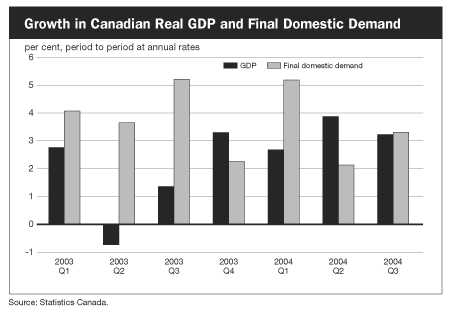
- The Canadian economy grew at a solid pace in the first three quarters of 2004, thanks in large part to consistent growth in final domestic demand.
- Strong export growth also supported GDP from late 2003 to mid-2004, partly as a result of robust global demand.
- Exports have weakened since mid-2004 in part because of the appreciation of the Canadian dollar.
Employment growth has remained strong …
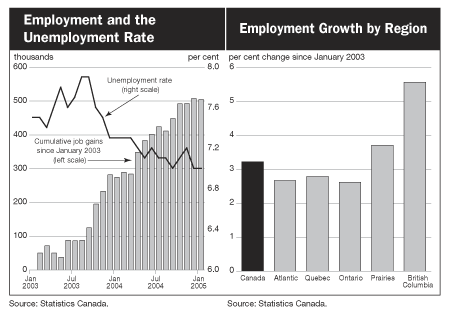
- Between January 2003 and January 2005, the economy created more than 500,000 new jobs, nearly all of which were full-time. The employment rate reached a record high of 62.8 per cent in May 2004 and remained close to that level for the rest of the year and into 2005. Both the employment rate and the participation rate—the total labour force expressed as a percentage of the working-age population—remain higher in Canada than in the U.S.
- With strong job creation in Canada, the unemployment rate fell from nearly 8.0 per cent in August 2003 to a low of 7.0 per cent in January 2005, despite near record rates of participation in the labour market.
- Employment increased throughout Canada, with British Columbia and Prince Edward Island recording the largest percentage increases.
… which has contributed to disposable income growth
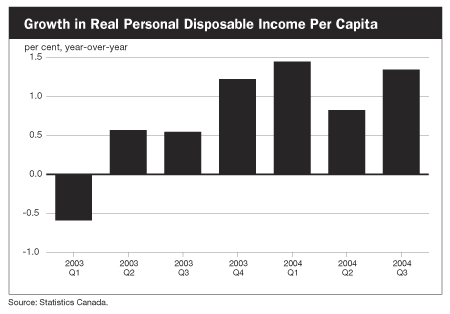
- Strong job gains, particularly in full-time positions, have contributed to growing real personal disposable income per capita.
- In the third quarter of 2004, real personal disposable income per capita was 1.3 per cent higher than the level of a year earlier, and it has grown 14 per cent since its trough in the second quarter of 1996.
Employment gains and disposable income growth have supported consumer confidence and growth in consumer spending
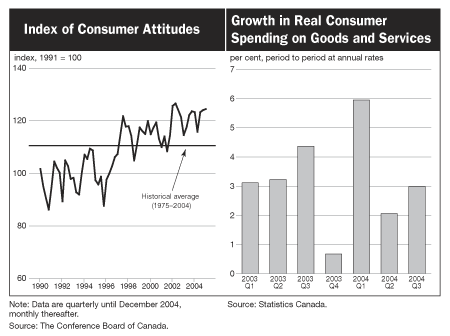
- Canadian consumers were upbeat in 2004 as a result of solid full-time job growth and rising incomes. Surveys show that nearly 60 per cent of Canadians felt that it was a good time to make a major purchase and over 30 per cent expected further income gains.
- This confidence, along with income growth, supported consumer spending. Consumption growth rebounded at the beginning of 2004 following slow growth at the end of 2003 and remained healthy in the second and third quarters.
Housing market activity remains strong, aided by continued low interest rates
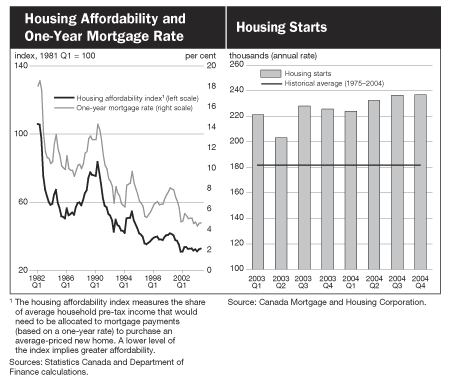
- Low interest rates and higher incomes have contributed to sustained improvements in housing affordability, which stood near its best level on record in 2004. This has supported a very high level of housing activity.
- Housing starts reached an average of over 230,000 units in 2004, the highest annual level in 17 years, and 6.9 per cent above the previous year’s level.
Low borrowing costs, healthy profits and strong business confidence …
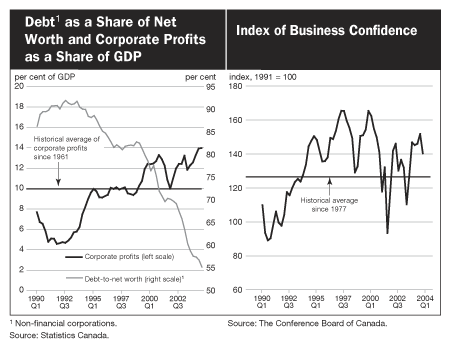
- In the third quarter of 2004, corporate profits were 22.1 per cent higher than in the third quarter of 2003. At 13.9 per cent, profits as a share of GDP reached a 30-year high and were well above the average of the last 40 years. In particular, mining firms saw profits jump sharply in the third quarter due to strong global demand. As well, oil and gas firms benefited during 2004 from higher prices and strong international demand. In general, strong levels of profitability have allowed firms to strengthen their balance sheets, resulting in low debt levels as a share of corporate net worth.
- Reflecting in part the strength in profits, business confidence has remained high. About half of the firms surveyed by the Conference Board of Canada in the fourth quarter of 2004 believed that their financial position and profitability will improve over the next six months. Furthermore, the Canadian Federation of Independent Businesses’ survey of small and mid-sized enterprises, released in December 2004, showed that businesses were more confident about their prospects than they had been earlier in the year.
… continue to support business investment, particularly in machinery and equipment—a key driver of productivity growth
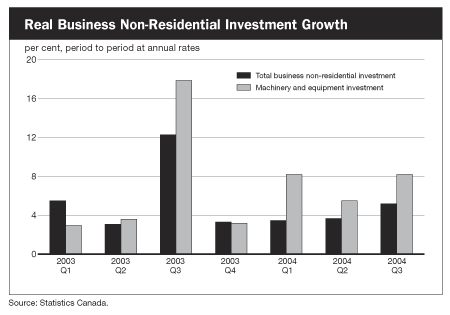
- Business investment spending grew strongly in the first three quarters of 2004, particularly in machinery and equipment. Rapid gains occurred in investment in computers, while growth in software investment and industrial machinery investment rebounded in the third quarter.
- Business investment was supported by above average levels of capacity utilization in the third quarter. In the fourth quarter of 2004, more than half of firms surveyed felt that it was a good time to make capital investments. Business investment has also been helped by the appreciation of the Canadian dollar, which lowers the price of imported machinery and equipment.
However, exports and imports have been affected by the strength of the Canadian dollar, especially in the latter half of 2004
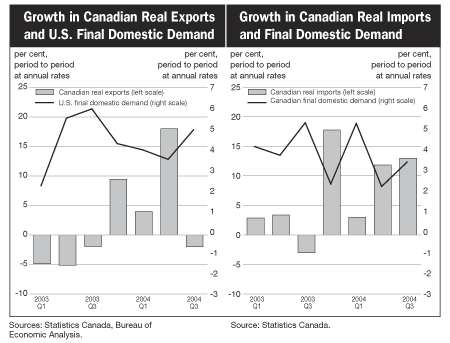
- The rapid appreciation of the Canadian dollar appears to have affected exports throughout much of 2003. While exports rebounded faster than expected between late 2003 and mid-2004, they resumed their decline in the third quarter in spite of continued growth in U.S. demand. The renewed weakness likely reflects the effects of both the 2003 and recent further appreciation of the dollar, with much of the adjustment to the recent appreciation still ahead. Adjusting to this appreciation will be a key challenge for exporting firms.
- On the import side, the stronger Canadian dollar, along with continued strength in Canadian domestic demand, contributed to sustained growth in imports over much of 2003 and 2004.
- The speed at which dollar movements affect trade depends on a number of factors. An appreciation of the Canadian dollar initially reduces the profits of exporting firms as sales in foreign currency generate lower revenue when converted to Canadian dollars. Some firms can delay the impact on profits through hedging instruments. Firms that have no control over the U.S. dollar price they can charge will see no change in U.S. demand for their products, but will gradually adjust their costs and output in response to lower profits.
- Some exporters will take advantage of cheaper imported goods to boost their investment spending, which in turn raises productivity. Companies that can offset some of the appreciation by raising the U.S. dollar price they charge their customers may experience a smaller profit decline but will face a direct, and relatively fast, drop in U.S. demand. While large swings in the dollar can affect export and import growth quite quickly, the full adjustment can be protracted. The speed of adjustment is quite uncertain.
The Canadian Dollar
The Canadian dollar appreciated further against the U.S. dollar in 2004
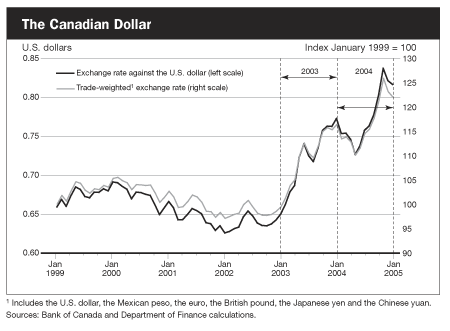
- The Canadian dollar made rapid gains against the U.S. dollar in 2003, appreciating 22 per cent during the year.
- After falling back somewhat in early 2004, the Canadian dollar resumed its ascent against the U.S. dollar, gaining 13 per cent between the end of May and the end of December.
- Stronger global growth and increased demand for commodities has driven part of the rise in the value of the Canadian dollar over the past two years. Since Canada is a net exporter of commodities, our currency often rises against the U.S. dollar when global commodity prices increase.
- However, the appreciation of the Canadian dollar also reflects global portfolio adjustments in response to persistent U.S. current account imbalances. All major floating currencies have climbed sharply against the U.S. dollar over the past two years.
While many major currencies have appreciated against the U.S. dollar, the Canadian economy is more exposed to U.S. currency fluctuations
- While some major currencies have appreciated more than the Canadian dollar over the past two years, on a trade-weighted basis the Canadian dollar has risen more than any other major currency.
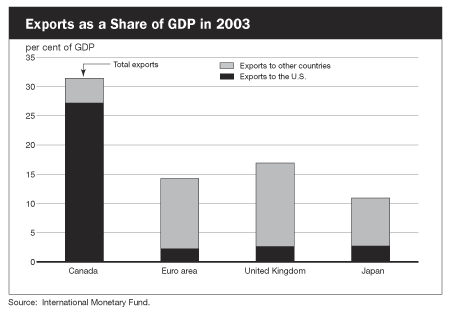
- In Canada, total trade, and in particular exports to the U.S., represents a higher proportion of GDP than in many other countries. As a result, the depreciation of the U.S. dollar has been a more significant economic development for Canada than for other major economies.
Strong global demand for commodities has contributed to the appreciation of the Canadian dollar …
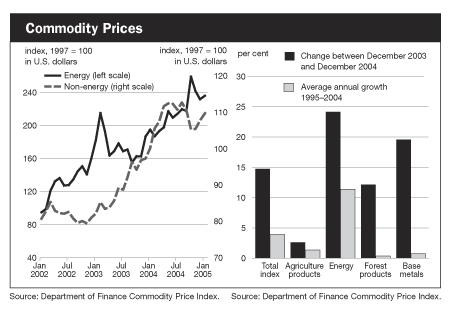
- Between January 2003 and August 2004, demand for non-energy commodities surged, pushing the non-energy commodity price index up nearly 40 per cent. A boom in North American residential construction led to strong gains in the price of forestry products. Base metal prices rose to a 15-year high in the fourth quarter of 2004, reflecting very strong global demand, and in particular a solid rebound in U.S. manufacturing output.
- Strong growth in world demand for oil, notably from China and other non-OECD Asian countries, along with instability in the Middle East, has kept oil prices high by historical standards. Oil prices spiked sharply in the fall of 2004, peaking at more than US$55 per barrel in late October. After falling in November and December, oil prices edged back up to US$45 per barrel by early February, 2005.
- Looking ahead, both energy and non-energy commodity prices are expected to soften, reflecting expectations of a moderation in world economic growth.
… but global current account imbalances have led to a depreciation of the U.S. dollar against many currencies
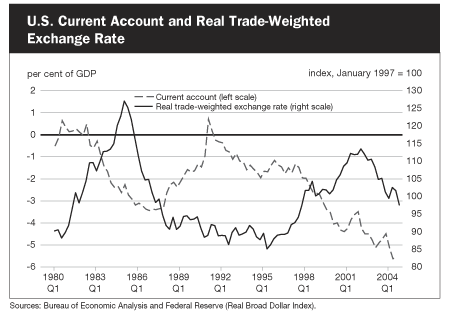
- During the first half of the 1980s, the U.S. current account deficit steadily widened to more than 3 per cent of GDP. A significant depreciation of the inflation-adjusted U.S. dollar against the currencies of its major trading partners eventually reduced the current account deficit, but this turnaround took some time.
- Between 1995 and the first quarter of 2002, the U.S. dollar rose about 30 per cent, contributing to a sustained deterioration in the current account balance. Since then the U.S. dollar has depreciated nearly 15 per cent. However, the U.S. current account deficit has continued to grow, reaching 5.6 per cent of GDP in the third quarter of 2004. Further depreciation of the U.S. dollar is likely needed if the current account deficit is to be significantly reduced.
Employment in the manufacturing sector has been negatively affected by the appreciation of the Canadian dollar
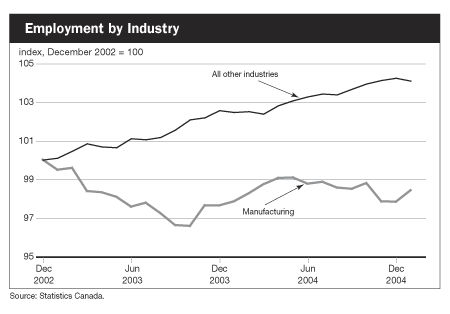
- The appreciation of the Canadian dollar presents a challenge to Canadian firms that are highly exposed to international trade.
- During 2003, employment in the Canadian manufacturing sector, which tends to be sensitive to movements in the value of the Canadian dollar, fell more than 55,000 while employment in all other industries increased by more than 337,000.
- Manufacturing sector employment recovered somewhat in the first half of 2004, with about 26,000 jobs created between December 2003 and June 2004, an increase of 1.1 per cent. During this period employment in all other industries grew 0.7 per cent.
- In the second half of 2004, manufacturing sector employment weakened again; however, manufacturing sector employment increased 14,000 in January 2005, the largest monthly increase in more than a year.
The Bank of Canada held its key policy rate steady in December and January
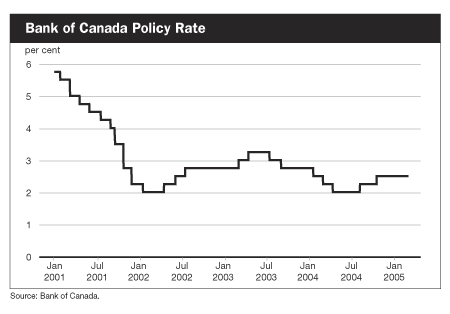
- In January 2004 the Bank of Canada lowered its key policy rate by 25 basis points to 2.5 per cent. The decision reflected the Bank’s view that "the rapid appreciation of the Canadian dollar against the U.S. currency [had] cut into the overall growth of aggregate demand for Canadian goods and services through weaker exports and increased imports."
- In both March and April the Bank lowered its policy rate by 25 basis points to "provide some additional monetary stimulus" in order to support the Canadian economy as it adjusted to higher commodity prices, the realignment of world currencies and intensifying competition from emerging-market economies.
- However, solid economic growth in the second and third quarters reduced excess capacity as the Canadian economy adjusted well to global economic developments. Reflecting its view that the "economy [was then] operating close to its production capacity," the Bank suggested that "monetary stimulus [needed to] be reduced" and lifted its policy rate in two stages, to 2.5 per cent by mid-October.
- Citing more moderate prospects for global growth and a further appreciation of the Canadian dollar, the Bank held its policy rate steady at 2.5 per cent in December. In late January 2005, the Bank again held rates constant as recent data indicated the economy was experiencing "a somewhat more pronounced adjustment to the past appreciation of the Canadian dollar."
Private Sector Economic Forecasts
The Department of Finance surveys about 20 private sector economic forecasters on a quarterly basis regarding their outlook for the Canadian economy. The Department also regularly reviews forecasts for the U.S. and major overseas economies from private sector forecasters and international organizations such as the OECD and the International Monetary Fund.
Department officials also meet with a group of private sector economists to discuss Canada’s economic outlook and the risks and uncertainties associated with that outlook. The Department’s survey of private sector forecasters is the basis for the economic assumptions that underlie the fiscal projections for the budget.
The economic forecasts reported here reflect the survey of private sector forecasters conducted by the Department in December following the release of the third-quarter National Accounts by Statistics Canada on November 30, along with the most recent forecasts by private sector economists in the U.S. and by the OECD.
World Economic Conditions
U.S. growth is expected to be strong in 2005, although growth will be somewhat slower than in 2004
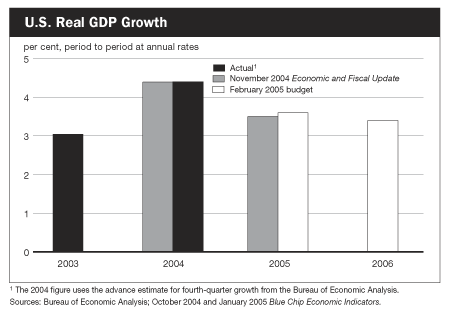
- Despite significant increases in oil prices in 2004, U.S. real GDP grew 4.4 per cent, matching the pace of growth observed in the boom years of 1997 and 1999. This strong growth performance reflected support from large tax cuts in 2003 and a depreciating American dollar.
- Growth is expected to ease in 2005 as fiscal stimulus ends and interest rates gradually rise. The strong U.S. housing market is expected to slow. However, rising incomes and healthy corporate profits should continue to support consumer spending and business investment and help to sustain growth in domestic demand. The depreciation of the American dollar will also provide support to the U.S. export sector. Overall, according to the latest Blue Chip survey, private sector forecasters expect U.S. growth to average 3.6 per cent this year, similar to expectations at the time of the November 2004 Economic and Fiscal Update, and 3.4 per cent in 2006.
The global expansion remains on track
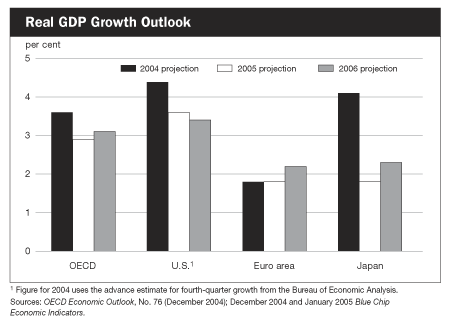
- After renewed strength in 2004, global growth is expected to decline somewhat in 2005, as demand from the United States weakens and higher oil prices continue to affect oil-importing economies. Nevertheless, the expansion remains on track and should pick up in 2006 as real GDP growth in OECD countries is expected to increase to 3.1 per cent from 2.9 per cent in 2005.
- Real GDP in the euro area is expected to grow by 1.8 per cent in 2005 as higher oil prices and a recent renewed appreciation of the euro offsets solid global growth.
- In Japan, where the economy is still struggling with deflation, growth is expected to fall to 1.8 per cent in 2005 from 4.1 per cent in 2004 due to slower growth in global demand and the continued appreciation of the yen against the U.S. dollar.
- Growth is also expected to slow in China in 2005, partly in response to the authorities’ efforts to curb over-investment and ease growth to more sustainable levels. Looking forward, China will likely remain an important contributor to growth in Asia as consumer demand strengthens and exports continue to increase despite slower growth in global demand.
The Canadian Economic Outlook
Private sector forecasters expect Canadian growth to pick up gradually in 2005 and 2006
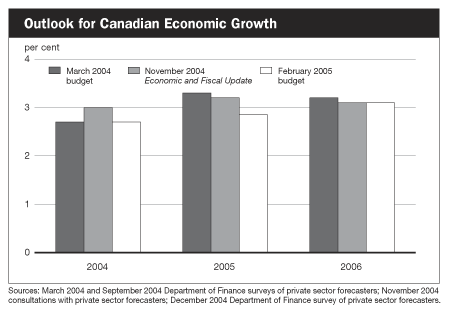
- Private sector forecasters expect somewhat weaker near-term economic growth for Canada than previously anticipated. Forecasters have lowered their outlook for real GDP growth in 2004 largely as a result of downward revisions by Statistics Canada to real GDP growth in the first half of 2004. The weaker growth outlook for 2005 mainly reflects a more pessimistic assessment by forecasters of the impact of the recent appreciation of the Canadian dollar.
- Forecasters now expect the economy to grow by 2.7 per cent in 2004, down from 3.0 per cent at the time of the November 2004 Economic and Fiscal Update. For 2005, forecasters expect growth of 2.9 per cent, moderately lower than in November and at the time of the March 2004 budget. The growth outlook for 2006 is 3.1 per cent, unchanged from the Update although slightly lower than the March 2004 budget.
- Forecasters have also trimmed their outlook for GDP inflation in 2005, in line with expectations of falling commodity prices. As a result, they expect nominal GDP to grow 4.9 per cent in 2005, down from 5.3 per cent at the time of the Update. Nominal GDP is expected to grow 5 per cent in 2006, unchanged from expectations in November.
Interest rates are expected to remain steady until mid-2005
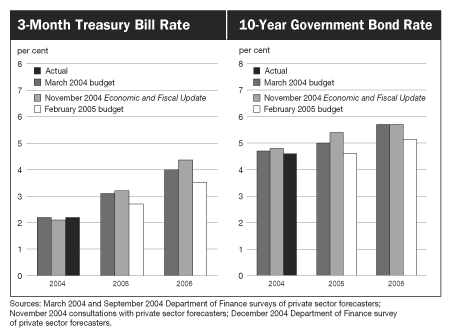
- The somewhat weaker-than-expected economic growth and more pessimistic assessment of the impact of the recent appreciation in the value of the Canadian dollar have led private sector forecasters to lower their projections for short- and long-term interest rates.
- Forecasters expect short-term interest rates to average 2.7 per cent this year and 3.5 per cent in 2006, down 50 and 90 basis points, respectively, from expectations at the time of the November 2004 Economic and Fiscal Update.
- Similarly, forecasters expect long-term rates to average 4.6 per cent in 2005 and 5.1 per cent in 2006, approximately one-half of one percentage point lower than levels expected at the time of the Update.
Risks and Uncertainties
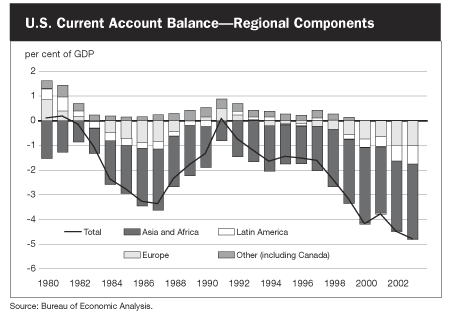
A key risk to the outlook is posed by the large and persistent U.S. current account deficit …
- While Canadian final domestic demand, particularly consumer spending and business investment, has held up well in the face of declining exports and weaker employment growth in export-related industries, there is a near-term risk that the appreciation of the Canadian dollar will begin to affect domestic demand. This could result in labour market weakness on a broader scale, which would dampen consumer confidence and spending.
- The large and persistent U.S. current account deficit presents a key risk to the outlook. This deficit has steadily widened, particularly against emerging Asian nations and Japan. By 2003 the trade deficit with China had increased to US$124 billion, reflecting China’s increasing role as an exporter of manufactured goods to developed countries and its pegged exchange rate regime. Japan’s management of the yen also led to a widening of its current account surplus with the United States.
- Relatively weak growth in the euro zone has contributed to a widening in the U.S. current account deficit with Europe.
- Although Canada is the United States’ largest trading partner, its current account surplus with the U.S., at 0.3 per cent of U.S. GDP, is a small contributor to the total U.S. current account deficit.
… which could be resolved by a combination of stronger overseas growth, adjustment of Asian currencies, and further U.S. dollar depreciation against floating currencies like the Canadian dollar
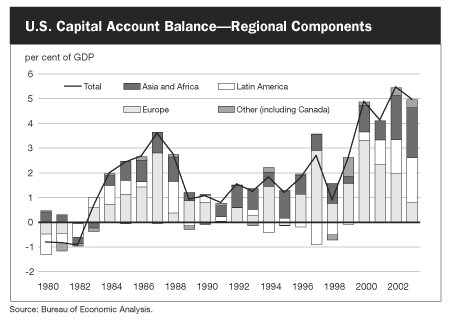
- The other side of the U.S. current account deficit is a capital account surplus. Capital inflows into the United States keep the U.S. dollar elevated with respect to other currencies, which in turn contributes to ongoing U.S. trade and current account deficits.
- Net capital flows from Europe to the United States fell sharply after the bursting of the U.S. high-tech bubble in 2000 and 2001. However, these flows were replaced by greater flows from Japan and, in particular, China. China’s pegged exchange rate means that it is accumulating significant U.S. dollar foreign exchange reserves. These reserves reached US$515 billion in September 2004, with total East Asian reserves standing at close to US$2 trillion. The increase in net inflows from Latin America since 2000 reflects a sharp drop in U.S. investment flows to that region. The large increase in U.S. budget deficits after 2001 has also lowered national saving and increased U.S. reliance on foreign sources of funds.
- The large U.S. current account deficit (and capital account surplus) has meant that U.S. net foreign indebtedness has steadily risen as a share of GDP. The current account deficit must fall from its current high level if further substantial increases in net foreign debt as a share of GDP are to be avoided.
- This could occur in a number of ways, each with differing implications for Canada. Higher, sustained euro area and Japanese growth would reduce their current account surpluses with the United States, while raising global demand and reducing the required broad U.S. dollar adjustment.
- Appreciation of Asian currencies against the U.S. dollar would reduce their accumulation of U.S. dollar reserves and lessen the downward pressure on the U.S. dollar against currencies like the Canadian dollar and the euro.
- A scenario in which all of the adjustment occurs through the exchange rate and against currencies like the euro and the Canadian dollar would pose the greatest challenge for Canada because it could mean significant further Canadian dollar appreciation. Furthermore, the more rapidly the adjustment occurs, the greater the challenge to Canadian firms.
Large U.S. fiscal deficits also present a risk to Canadian growth
- The U.S. budget deficit poses an additional medium-term downside risk. If not corrected, the deficit could put upward pressure on interest rates, crowd out investment and dampen growth in both the U.S. and Canada. Conversely, a serious effort to reduce the budget deficit would temporarily lower growth in the U.S., which would also have negative implications for Canadian growth.
- While the risks to the outlook are negative on balance, Canada’s strong monetary, fiscal and structural policy framework has improved our ability to deal with these potential difficulties if they materialize.
Private Sector Forecasts for 2004–2006
|
|
||||
|---|---|---|---|---|
| 2004 | 2005 | 2006 | Average 2007–2009 |
|
|
|
||||
| (per cent) | ||||
| Real GDP growth | ||||
| March 2004 budget | 2.7 | 3.3 | 3.2 | 3.1 |
| November 2004 Economic and Fiscal Update | 3.0 | 3.2 | 3.1 | 2.9 |
| February 2005 budget | 2.7 | 2.9 | 3.1 | 2.9 |
| GDP inflation | ||||
| March 2004 budget | 1.4 | 1.7 | 1.9 | 1.8 |
| November 2004 Economic and Fiscal Update | 3.1 | 2.1 | 1.8 | 1.7 |
| February 2005 budget | 3.3 | 2.0 | 1.9 | 1.9 |
| Nominal GDP growth | ||||
| March 2004 budget | 4.1 | 5.1 | 5.2 | 5.0 |
| November 2004 Economic and Fiscal Update | 6.2 | 5.3 | 5.0 | 4.7 |
| February 2005 budget | 6.1 | 4.9 | 5.0 | 4.8 |
| 3-month Treasury bill rate | ||||
| March 2004 budget | 2.2 | 3.1 | 4.0 | 4.5 |
| November 2004 Economic and Fiscal Update | 2.1 | 3.2 | 4.4 | 4.7 |
| February 2005 budget | 2.2 | 2.7 | 3.5 | 4.6 |
| 10-year government bond rate | ||||
| March 2004 budget | 4.8 | 5.4 | 5.7 | 5.7 |
| November 2004 Economic and Fiscal Update | 4.7 | 5.0 | 5.7 | 6.0 |
| February 2005 budget | 4.6 | 4.6 | 5.1 | 5.6 |
| Unemployment rate | ||||
| March 2004 budget | 7.5 | 7.2 | 7.0 | 6.8 |
| November 2004 Economic and Fiscal Update | 7.3 | 7.0 | 7.0 | 6.8 |
| February 2005 budget | 7.2 | 7.2 | 7.0 | 6.7 |
| Employment growth | ||||
| March 2004 budget | 1.6 | 1.5 | 1.5 | 1.3 |
| November 2004 Economic and Fiscal Update | 1.7 | 1.6 | 1.5 | 1.2 |
| February 2005 budget | 1.7 | 1.4 | 1.5 | 1.4 |
| Addendum: | ||||
| U.S. real GDP growth | ||||
| March 2004 budget | 4.7 | 3.8 | n/a | n/a |
| November 2004 Economic and Fiscal Update | 4.4 | 3.5 | n/a | n/a |
| February 2005 budget | 4.4 | 3.6 | 3.4 | n/a |
|
|
||||
| Sources: March 2004, September 2004 and December 2004 Department of Finance surveys of private sector forecasters; November 2004 consultations with private sector forecasters; March 2004, October 2004 and January 2005 Blue Chip Economic Indicators. | ||||
Note: This chapter incorporates data available up to February 7, 2005. Figures in this chapter are at annual rates unless otherwise noted.
1 OECD, Economic and Development Review Committee, Economic Survey of Canada (October 2004). [Return]
2 The official definition of the employment rate in Canada is the number of employed persons as a share of the population 15 years of age and older. [Return]
- Table of Contents - Previous - Next -
|
|
|||||
| Last Updated: 2005-02-23 |
|
| |||