Discover what we've learned
This section focuses on the lessons we’ve learned. Find out more about taking the pulse, change management and what’s preventing us from fully living the BP2020 vision. This page contains the documents that pop-up throughout the “Discover what we’ve learned” section of the #DiscoverPSPC video.
PSES Pulse Check
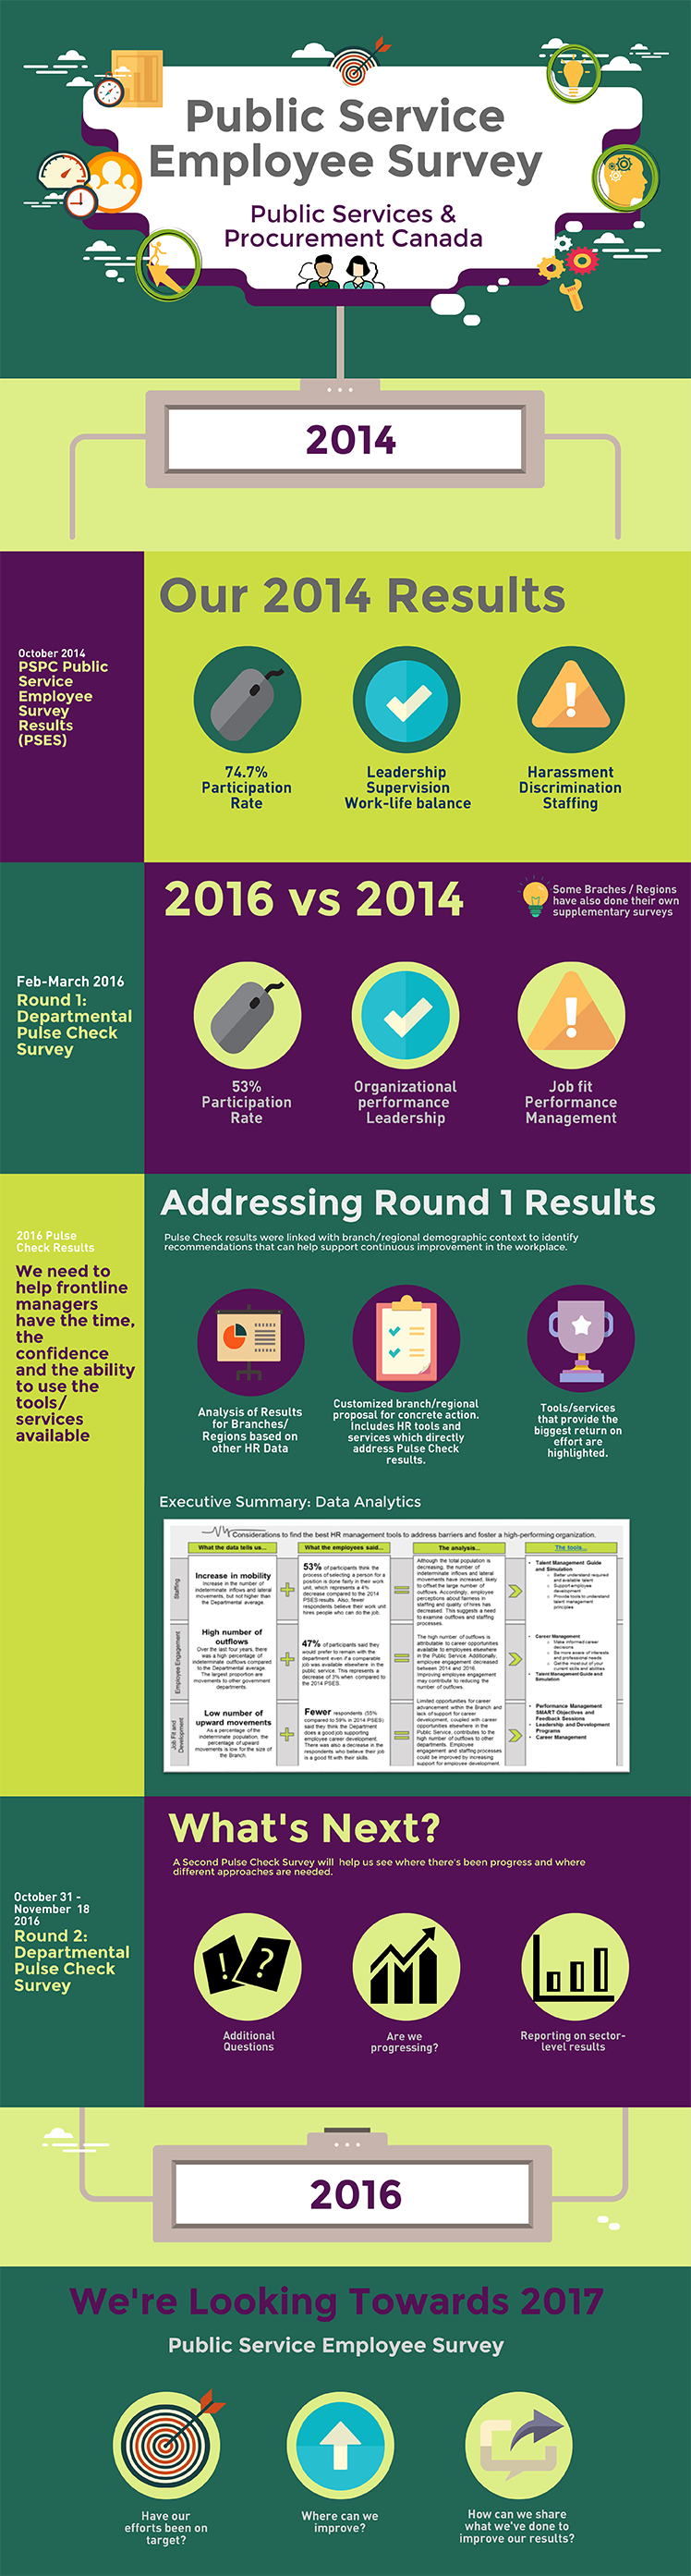
Long description: Public Service Employee Survey
Public Service Employee Survey
Public Services & Procurement Canada
October 2014
PSPC Public Service Employee Survey Results (PSES)
Our 2014 Results
- 74.7% Participation Rate
- Leadership (Checkmark representing what we did well)
- Supervision (Checkmark representing what we did well)
- Work-life balance (Checkmark representing what we did well)
- Harassment (Caution sign representing areas for improvement)
- Discrimination (Caution sign representing areas for improvement)
- Staffing (Caution sign representing areas for improvement)
February–March 2016
Round 1: Departmental Pulse Check Survey
2016 vs 2014
Some Braches/Regions have also done their own supplementary surveys
- 53% Participation Rate
- Organizational performance (Checkmark representing what we did well)
- Leadership (Checkmark representing what we did well)
- Job fit (Caution sign representing areas for improvement)
- Performance Management (Caution sign representing areas for improvement)
2016 Pulse Check Results
We need to help frontline managers have the time, the confidence and the ability to use the tools/ services available
Addressing Round 1 Results
Pulse Check results were linked with branch/regional demographic context to identify recommendations that can help support continuous improvement in the workplace.
- Analysis of Results for Branches/Regions based on other HR Data
- Customized branch/regional proposal for concrete action. Includes HR tools and services which directly address Pulse Check results.
- Tools/services that provide the biggest return on effort are highlighted.
Executive Summary: Data Analytics
October 31 – November 18, 2016
Round 2: Departmental Pulse Check Survey
What's Next?
A Second Pulse Check Survey will help us see where there's been progress and where different approaches are needed.
- Additional Questions
- Are we on progressing?
- Reporting on sector-level results
We're Looking Towards 2017
Public Service Employee Survey
- Have our efforts been on target?
- Where can we improve?
- How can we share what we've done to improve our results?
Implementing Change Management @PSPC
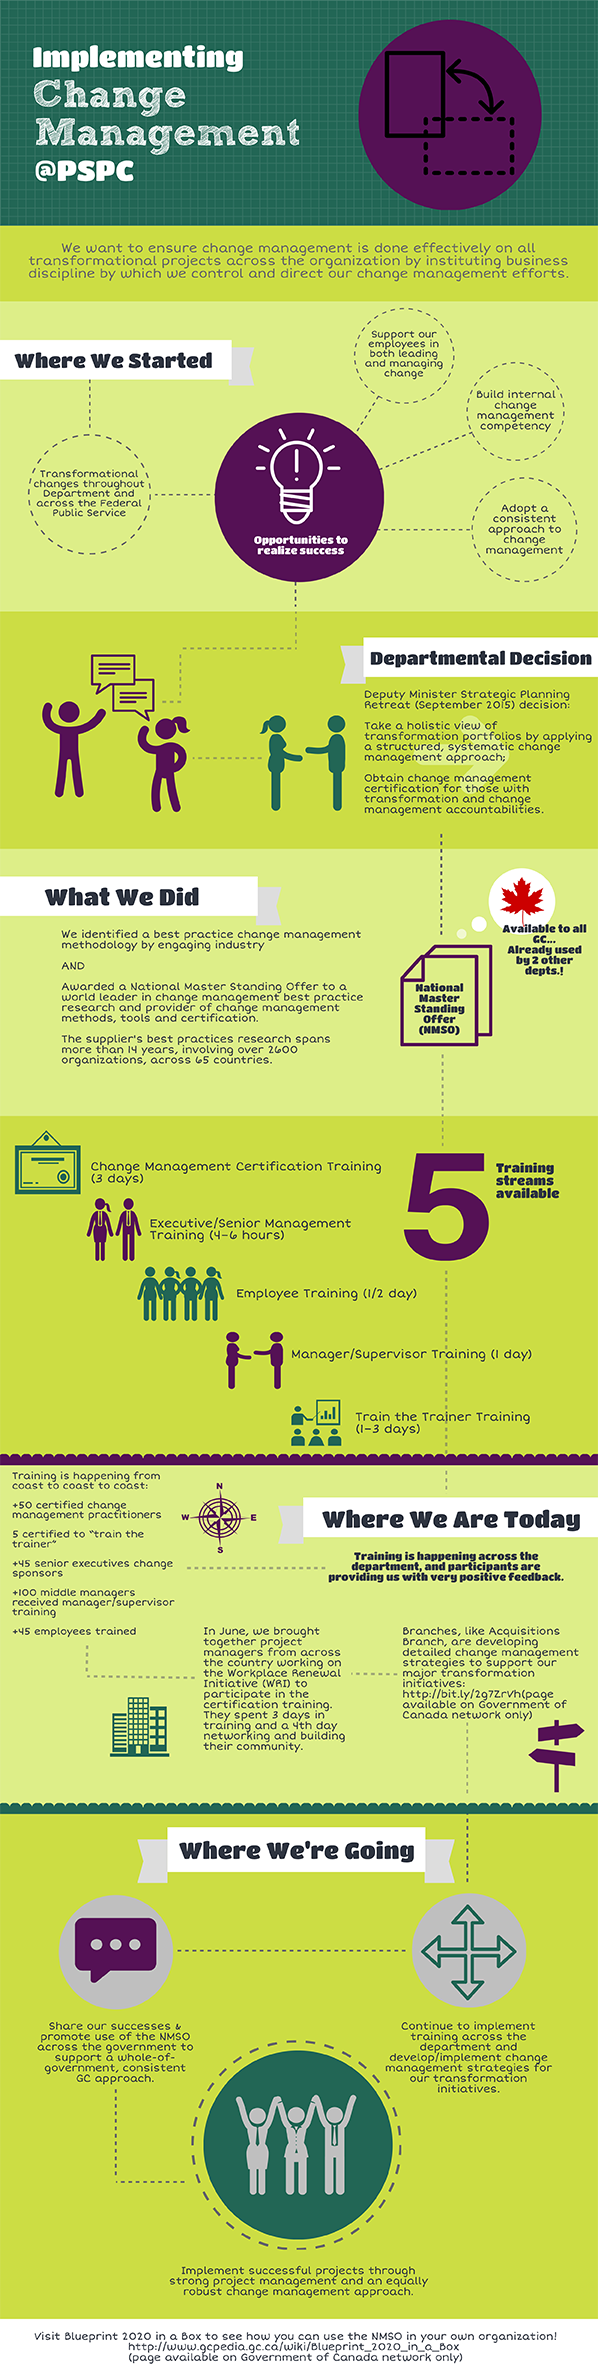
Long description: Implementing Change Management @PSPC
Implementing Change Management @PSPC
We want to ensure change management is done effectively on all transformational projects across the organization by instituting business discipline by which we control and direct our change management efforts.
Where We Started
- Transformational changes throughout Department and across the Federal Public Service
- Opportunities to realize success
- Support our employees in both leading and managing change
- Build internal change management competency
- Adopt a consistent approach to change management
Departmental Decision
- Deputy Minister Strategic Planning Retreat (September 2015) decision:
- Take a holistic view of transformation portfolios by applying a structured, systematic change management approach;
- Obtain change management certification for those with transformation and change management accountabilities.
What We Did
We identified a best practice change management methodology by engaging industry
AND
Awarded a National Master Standing Offer to a world leader in change management best practice research and provider of change management methods, tools and certification.
The supplier's best practices research spans more than 14 years, involving over 2600 organizations, across 65 countries.
National Master Standing Offer (NMSO)
Available to all GC… Already used by 2 other departments
5 Training streams available
- Change Management Certification Training (3 days)
- Executive/Senior Management Training (4–6 hours)
- Manager/Supervisor Training (1 day)
- Employee Training (1/2 day)
- Train the Trainer Training (1–3 days)
Where We Are Today
Training is happening across the department, and participants are providing us with very positive feedback.
Training is happening from coast to coast to coast:
- +50 certified change management practitioners
- 5 certified to “train the trainer”
- +45 senior executives change sponsors
- +100 middle managers received manager/supervisor training
- +45 employees trained
In June, we brought together project managers from across the country working on the Workplace Renewal Initiative (WRI) to participate in the certification training. They spent 3 days in training and a 4th day networking and building their community.
Branches, like Acquisitions Branch, are developing detailed change management strategies to support our major transformation initiatives: http://bit.ly/2g7ZrVh (page available on Government of Canada network only)
Where We're Going
Continue to implement training across the department and develop/implement change management strategies for our transformation initiatives.
Share our successes & promote use of the NMSO across the government to support a whole-of-government, consistent GC approach.
Implement successful projects through strong project management and an equally robust change management approach.
Visit Blueprint 2020 in a Box to see how you can use the NMSO in your own organization! http://www.gcpedia.gc.ca/wiki/Blueprint_2020_in_a_Box (page available on Government of Canada network only)
PSPC 2015 Profile
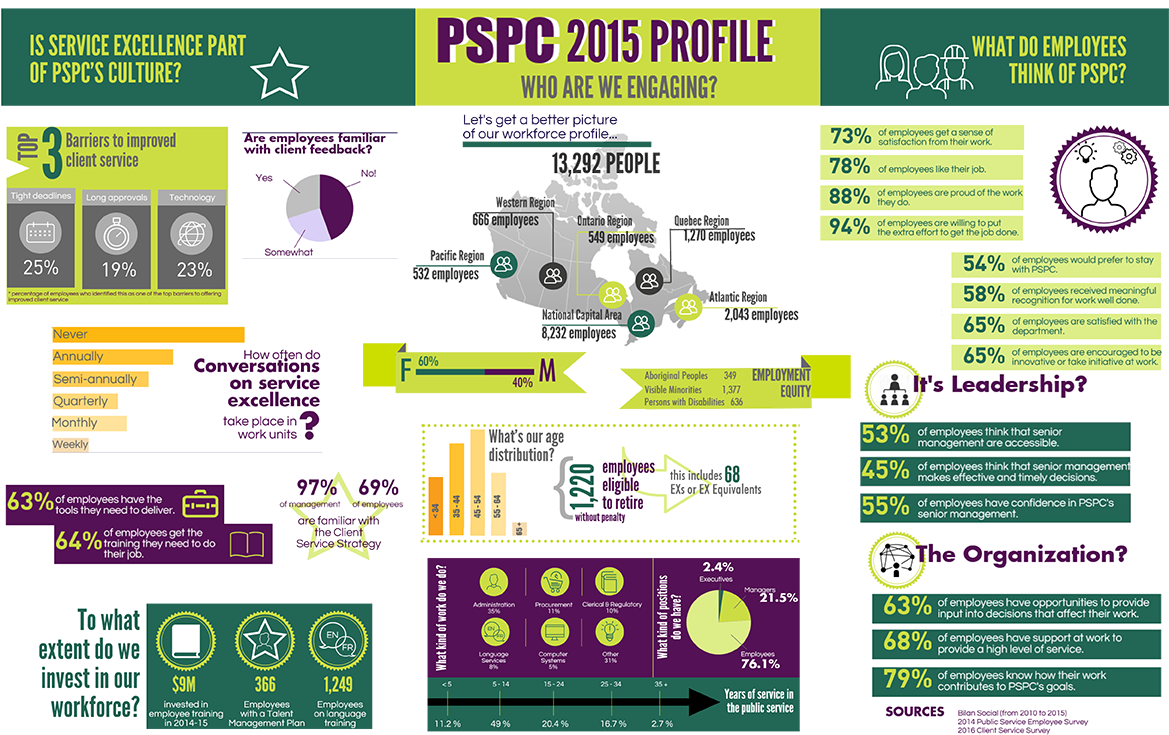
PSPC 2015 Profile
Who are we engaging?
Let’s get a better picture of our workforce profile…
- 13,292 people
- Pacific Region: 532 employees
- Western Region: 666 employees
- Ontario Region: 549 employees
- National Capital Area: 8,232 employees
- Quebec Region: 1,270 employees
- Atlantic Region: 2,043 employees
- 60% female, 40% male
- Employment equity
- Aboriginal Peoples: 349
- Visible Minorities: 1,377
- Persons with Disabilities: 636
What’s our age distribution?
- Less than 34: 2,030 employees
- 35 to 44: 3,366 employees
- 45 to 54: 3,927 employees
- 55 to 64: 2,192 employees
- 65 and over: 216 employees
1,220 employees eligible to retire without penalty; this includes 68 EXs or EX Equivalents.
What kind of work do we do?
- Administration: 35%
- Procurement: 11%
- Clerical and Regulatory: 10%
- Language Services: 8%
- Computer systems: 5%
- Other: 31%
What kind of positions do we have?
- Executives: 2.4%
- Managers: 21.5%
- Employees: 76.1%
Years of service in the public service
- Less than 5: 11.2%
- 5 to 14: 49%
- 15 to 24: 20.4%
- 25 to 34: 16.7%
- 35 and over: 2.7%
Is service excellence part of PSPC’s culture?
Top 3 barriers to improved client service
- Tight deadlines (25%)
- Technology (23%)
- Long approvals (19%)
* Percentage of employees who identified this as one of the top barriers to offering improve client service.
Are employees familiar with client feedback?
- Yes: 30.05%
- No: 44.47%
- Somewhat: 25.48%
How often do conversations on service excellence take place in work units?
- Never: 32.87%
- Annually: 20.63%
- Semi-annually: 16.43%
- Quarterly: 11.19%
- Monthly: 12.7%
- Weekly: 6.18%
Tools and Training
- 63% of employees have the tools they need to deliver
- 64% of employees get the training they need to do their job
Client Service Strategy
- 97% of management are familiar with the Client Service Strategy
- 69% of employees are familiar with the Client Service Strategy
To what extent do we invest in our workforce?
- $9M invested in employee training in 2014-15
- 366 employees with a Talent Management Plan
- 1,249 employees on language training
What do employees think of PSPC?
- 73% of employees get a sense of satisfaction from their work
- 78% of employees like their job
- 88% of employees are proud of the work they do
- 94% of employees are willing to put the extra effort to get the job done
- 54% of employees would prefer to stay with PSPC
- 58% of employees received meaningful recognition for work well done
- 65% of employees are satisfied with the departments
- 65% of employees are encouraged to be innovative or take initiative at work
What do employees think of PSPC’s leadership?
- 53% of employees think that senior management are accessible
- 45% of employees think that senior management makes effective and timely decisions
- 55% of employees have confidence in PSPC’s senior management
What do employees think of the organization?
- 63% of employees have opportunities to provide input into decisions that affect their work
- 68% of employees have support at work to provide a high level of service
- 79% of employees know how their work contributes to PSPC’s goals
Sources:
- Bilan Social (from 2010 to 2015)
- 2014 Public Service Employee Survey
- 2016 Client Service Survey
- Date modified: