Section II: Expenditure overview—2015 to 2016 Departmental Performance Report
Document navigation for "Section II: Expenditure overview"
Actual expenditures
| 2015 to 2016 main estimates | 2015 to 2016 planned spending | 2015 to 2016 total authorities to dateFootnote 1 | 2015 to 2016 actual spending (authorities used) | Difference (actual minus planned) |
|---|---|---|---|---|
| 2,871,525,596 | 2,871,525,596 | 3,215,618,591 | 2,833,315,710 | (38,209,886) |
| 2015 to 2016 planned | 2015 to 2016 actual | 2015 to 2016 difference (actual minus planned) |
|---|---|---|
| 12,103.58Footnote 2 | 11,745.15 | (358.43) |
Budgetary performance summary
Strategic outcome: High quality, central programs and services that ensure sound stewardship on behalf of Canadians and meet the program needs of federal institutions.
| Programs and internal services | 2015 to 2016 main estimates | Planned spending 2015 to 2016 | Planned spending 2016 to 2017 | Planned spending 2017 to 2018 | 2015 to 2016 total authorities to date Footnote 3 | Actual spending (authorities used) 2015 to 2016 | Actual spending (authorities used) 2014 to 2015 | Actual spending (authorities used) 2013 to 2014 |
|---|---|---|---|---|---|---|---|---|
| Acquisitions | 151,339,610 | 151,339,610 | 148,255,037 | 155,238,902 | 155,042,770 | 151,557,532 | 144,689,522 | 152,781,604 |
| Accommodation and real property Services | 2,175,548,102 | 2,175,548,102 | 2,192,828,508 | 2,070,671,770 | 2,441,749,987 | 2,112,305,111 | 2,032,720,120 | 2,111,237,753 |
| Receiver General for Canada | 99,157,873 | 99,157,873 | 106,647,604 | 106,227,619 | 110,793,370 | 109,908,581 | 116,448,841 | 120,686,479 |
| Integrity programs and services | 15,505,622 | 15,505,622 | 15,184,073 | 15,184,073 | 21,448,262 | 20,273,364 | 22,035,911 | 0 |
| Federal pay and pension administration | 114,163,435 | 114,163,435 | 81,761,681 | 83,952,459 | 137,618,499 | 128,954,893 | 115,698,499 | 101,211,263 |
| Linguistic management and services | 60,913,368 | 60,913,368 | 60,707,474 | 60,530,122 | 60,754,093 | 51,299,267 | 57,727,344 | 61,627,911 |
| Specialized programs and services | 29,617,191 | 29,617,191 | 29,454,041 | 30,059,862 | 31,228,075 | 24,537,710 | 47,133,036 | 56,443,733 |
| Procurement Ombudsman | 4,111,325 | 4,111,325 | 4,118,152 | 4,118,152 | 4,101,959 | 3,830,009 | 3,889,948 | 4,075,023 |
| Subtotal | 2,650,356,526 | 2,650,356,526 | 2,638,956,570 | 2,525,982,959 | 2,962,737,015 | 2,602,666,467 | 2,540,343,220 | 2,608,063,764 |
| Internal services subtotal | 221,169,070 | 221,169,070 | 231,502,828 | 231,902,320 | 252,881,576 | 230,649,243 | 226,820,291 | 239,060,369 |
| Total | 2,871,525,596 | 2,871,525,596 | 2,870,459,398 | 2,757,885,279 | 3,215,618,591 | 2,833,315,710 | 2,767,163,511 | 2,847,124,134 |
As part of the present Departmental Performance Report, Public Services and Procurement Canada (PSPC) is informing parliamentarians and Canadians of the budgetary performance achieved for 2015 to 2016. This performance is measured against the planned spending defined in PSPC's 2015 to 2016 Report of Plans and Priorities (RPP).
After the planned spending was submitted as part of the 2015 to 2016 main estimates, PSPC was provided new funding for various initiatives, such as the accelerated infrastructure program (Budget 2015) and the Parliamentary Precinct rehabilitation.
The actual versus planned spending variance of ($38 million) is primarily the result of:
- a change in project timing for various initiatives, such as the preparation of federal accommodation space for occupancy, the Alaska Highway and the Esquimalt Graving Dock
- a reduction in demand for translation services to the Parliament during the election period
- a reduction in the number of advertising campaigns under the whole-of-government web-buy initiative
For additional information on:
- past years actual spending, please consult the 2013 to 2014, 2014 to 2015 and 2015 to 2016 Public Accounts
- future years planned spending, please consult the 2015 to 2016 and 2016 to 2017 RPPs
Departmental spending trend
Text version
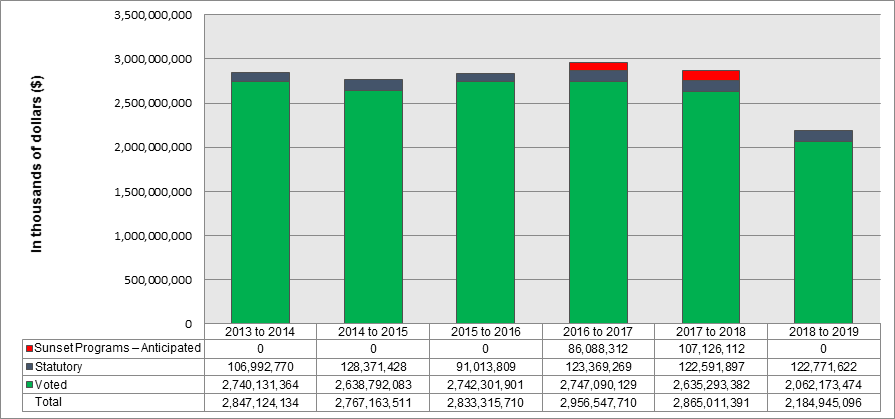
This bar graph illustrates the spending trend for Public Services and Procurement Canada for fiscal years 2013 to 2014, 2014 to 2015, 2015 to 2016, 2016 to 2017, 2017 to 2018 and 2018 to 2019. Financial figures are presented in dollars along the y-axis (vertical), starting at $0, ending at $3.5 billion and increasing by $500 million. These are graphed against fiscal years 2013 to 2014 to 2018 to 2019 on the x-axis (horizontal).
There are three items identified for each fiscal year: anticipated sunset programs, statutory spending and voted spending.
In 2013 to 2014, actual spending was $0 for anticipated sunset programs, $106,992,770 for statutory items and $2,740,131,364 for voted items.
In 2014 to 2015, actual spending was $0 for anticipated sunset programs, $128,371,428 for statutory items and $2,638,792,083 for voted items.
In 2015 to 2016, actual spending was $0 for anticipated sunset programs, $91,013,809 for statutory items and $2,742,301,901 for voted items.
In 2016 to 2017, planned spending is $86,088,312 for anticipated sunset programs, $123,369,269 for statutory items and $2,747,090,129 for voted items.
In 2017 to 2018, planned spending is $107,126,112 for anticipated sunset programs, $122,591,897 for statutory items and $2,635,293,382 for voted items.
In 2018 to 2019, planned spending is $0 for anticipated sunset programs, $122,771,622 for statutory items and $2,062,173,474 for voted items.
Total spending for 2013 to 2014 is 2,847,124,134; for 2014 to 2015 is 2,767,163,511; and for 2015 to 2016 is 2,833,315,710. The total anticipated spending for 2016 to 2017 is 2,956,547,710; for 2017 to 2018 is 2,865,011,391; and for 2018 to 2019 is 2,184,945,096.
The cause of the variances to the sunset programs is the result of:
From 2015 to 2016 to 2016 to 2017, the following will be completed:
- Transformation of Pay Administration initiative
- phase II of the federal contaminated sites action plan
- whole-of-government web buy initiative
From 2016 to 2017 to 2017 to 2018, the following will be completed:
- accelerated infrastructure program (Budget 2015)
- cost and profit assurance program
The decrease observed from 2017 to 2018 to 2018 to 2019 is the result of planned reductions in cash flow for various initiatives, such as the Parliamentary Precinct rehabilitation. Also, this graph does not account for Budget 2016 items, which were approved after the 2016 to 2017 RPP.
Expenditures by vote
For information on PSPC's organizational voted and statutory expenditures, consult the Public Accounts of Canada.
Alignment of spending with the whole-of-government framework
Strategic outcome: High quality, central programs and services that ensure sound stewardship on behalf of Canadians and meet the program needs of federal institutions.
| Program | Spending area | Government of Canada outcome | 2015 to 2016 actual spending |
|---|---|---|---|
| 1.1 Acquisitions | Government affairs | Well-managed and efficient government operations | 151,557,532 |
| 1.2 Accommodation and real property services | Government affairs | Well-managed and efficient government operations | 2,112,305,111 |
| 1.3 Receiver General for Canada | Government affairs | Well-managed and efficient government operations | 109,908,581 |
| 1.4 Integrity programs and services | Government affairs | Well-managed and efficient government operations | 20,273,364 |
| 1.5 Federal pay and pension administration | Government affairs | Well-managed and efficient government operations | 128,954,893 |
| 1.6 Linguistic management and services | Government affairs | Well-managed and efficient government operations | 51,299,267 |
| 1.7 Specialized programs and services | Government affairs | Well-managed and efficient government operations | 24,537,710 |
| 1.8 Procurement Ombudsman | Government affairs | A transparent, accountable and responsive federal government | 3,830,009 |
| Spending area | Total planned spending | Total actual spending |
|---|---|---|
| Economic affairs | 0 | 0 |
| Social affairs | 0 | 0 |
| International affairs | 0 | 0 |
| Government affairs | 2,638,956,570 | 2,602,666,467 |
Financial statements and financial statements highlights
Financial statements highlights
The highlights presented in this sub-section are intended to serve as a general overview of PSPC's financial results. The following condensed financial statements are prepared on an accrual basis of accounting which aligns consumption of resources with the services provided, rather than reporting on the use of authorities as is done in the sub-sections above. Note 3: Parliamentary Authorities of the consolidated departmental financial statements provides reconciliation between these two bases of accounting.
| Financial information | 2015 to 2016 planned results | 2015 to 2016 actual | 2014 to 2015 actual | Difference (2015 to 2016 actual minus 2015 to 2016 planned) | Difference (2015 to 2016 actual minus 2014 to 2015 actual) |
|---|---|---|---|---|---|
| Total expenses | 5,112.2 | 5,312.1 | 5,239.1 | 199.9 | 73.0 |
| Total revenues | (2,578.7) | (2,754.7) | (2,578.7) | (176.0) | (176.0) |
| Net cost of operations before government funding and transfers | 2,533.5 | 2,557.4 | 2,660.3 | 23.9 | (103.0) |
Overall, the actual net cost of operations ($2,557.4 million) decreased by $103 million compared to the prior year ($2,660.4 million). Key variances for both expenses and revenues are explained below.
Expenses
Actual over planned
The 2015 to 2016 expenses were $199.9 million higher than planned (planned: $5,112.2 million; actual: $5,312.1 million). The increase is mainly attributable to the Accommodation and real property services program and is due to increased business volume related to construction and repair work performed on new and existing federal infrastructure across Canada for other government departments.
Actual year over year
The increase in expenses of $73 million (2015 to 2016: $5,312.1 million; 2014 to 2015: $5,239.1 million) is mainly attributable to the Accommodation and real property services program and is due to:
- increased business volume related to construction and repair work performed on new and existing federal infrastructure across Canada for other government departments
Offset by:
- a decrease due to a re-evaluation of the liability transferred from Enterprise Cape Breton Corporation (ECBC) to PSPC in 2014 to 2015
Revenues
Actual over planned
The 2015 to 2016 revenues were $176.0 million higher than planned (planned: $2,578.7 million; actual: $2,754.7 million). The increase is mainly attributable to Accommodation and real property services program and is due to increased business volume related to construction and repair work on new and existing federal infrastructure across Canada for other government departments.
Actual year over year
The increase in revenues of $176 million (2015 to 2016: $2,754.7 million; 2014 to 2015: $2,578.7 million) is mainly attributable to the Accommodation and real property services program and is due to increased business volume related to construction and repair work on new and existing federal infrastructure across Canada for other Government departments.
| Financial information | 2015 to 2016 | 2014 to 2015 | Difference (2015 to 2016 minus 2014 to 2015) |
|---|---|---|---|
| Total net liabilities | 3,880.9 | 3,922.2 | (41.3) |
| Total net financial assets | (993.7) | (833.9) | (159.8) |
| Departmental net debtFootnote 4 | 2,887.2 | 3,088.3 | (201.1) |
| Total non-financial assets | 6,463.9 | 6,343.6 | 120.3 |
| Departmental net financial position | 3,576.7 | 3,255.3 | 321.4 |
The departmental net financial position, calculated by the difference between departmental net debt and total non-financial assets, increased by $321.4 million (2015 to 2016: $3,576.7 million; 2014 to 2015: $3,255.3 million). The increase can be explained by the following:
The decrease in liabilities of $41.3 million, mainly due to:
- a decrease in environmental liabilities (estimated costs related to the management and remediation of contaminated sites) as a result of a re-evaluation of the liability transferred from ECBC to PSPC in 2014 to 2015
- a decrease in lease obligations (future payments to be made) for lease tangible capital assets as a result of the payments made during the year
Offset by:
- an increase in accounts payable directly related to the increased business volume for accelerated infrastructure program projects
An increase in net financial assets of $159.8 million, mainly due to:
- an increase in the due from consolidated revenue fund (amount of cash that the Department is entitled to, without further authorities, in order to pay its liabilities) and in the accounts receivable and advances due to the increased business volume for accelerated infrastructure program projects
An increase in non-financial assets of $120.3 million. (Non-financial assets are non-monetary assets such as physical assets that have been purchased, built or leased). The increase is, mainly due to:
- an increase in assets under construction (physical assets that are being constructed) mainly related to the following projects and initiatives:
- buildings: Parliamentary Precinct restoration and rehabilitation projects
- works and infrastructure: Alaska Highway and Esquimalt Graving Dock projects
- informatics, hardware and software: development of IT systems for the Transformation of Pay and Pension Administration initiatives
- an increase in the leased tangible capital assets (physical assets held under lease on a continuing basis) due to the acquisition of new buildings under capital leases of which the most significant is 2575 Boulevard Ste-Anne in Québec, QC
Offset by:
- a decrease mainly due to depreciation of tangible capital assets (physical assets held on a continuing basis)
Financial statements
Consult PSPC's consolidated departmental financial statements for year ended March 31, 2016.
Document navigation for "Section II: Expenditure overview"
- Date modified: