
Financial statements discussion and analysis
Public Accounts of Canada 2019 Volume I—Top of the page Navigation
- Previous page: Section 1—Financial statements discussion and analysis
- Section 1—Table of contents: Section 1—Financial statements discussion and analysis
- Next page: Ten-year comparative financial information
Introduction
The Public Accounts of Canada is a major accountability report of the Government of Canada. This section, together with the other sections in this volume and in Volumes II and III of the Public Accounts of Canada, provides detailed supplementary information in respect of matters reported in the audited consolidated financial statements in Section 2 of this volume. Supplementary discussion and analysis of the Government's financial results can be found in the Annual Financial Report of the Government of Canada—Fiscal Year 2018-2019, available on the Department of Finance Canada's website.
The consolidated financial statements and financial statements discussion and analysis have been prepared under the joint direction of the Minister of Finance, the President of the Treasury Board and the Receiver General for Canada. Responsibility for the integrity and objectivity of the consolidated financial statements and financial statements discussion and analysis rests with the Government. A glossary of terms used in this financial statements discussion and analysis is provided at the end of this section.
2019 financial highlights
- The Government posted a budgetary deficit of $14.0 billion for the fiscal year ended March 31, 2019, compared to a budgetary deficit of $19.0 billion in 2018.
- Revenues increased by $21.0 billion, or 6.7%, from 2018. Program expenses increased by $14.6 billion, or 4.7%, reflecting increases in all major categories of expenses. Public debt charges were up $1.4 billion, or 6.3%.
- The accumulated deficit (the difference between total liabilities and total assets) stood at $685.5 billion at March 31, 2019. The accumulated deficit-to-GDP (gross domestic product) ratio was 30.9%, down from 31.3% in the previous year.
- As reported by the International Monetary Fund (IMF), Canada's total government net debt-to-GDP ratio, which includes the net debt of the federal, provincial/territorial and local governments, as well as the net assets held in the Canada Pension Plan and Quebec Pension Plan, stood at 26.8% in 2018. This is the lowest level among Group of Seven (G7) countries, which the IMF expects will record an average net debt of 86.0% of GDP for the same year.
Discussion and analysis
Economic developmentsLink to footnote 1
The global economic expansion moderated in 2018 after two years of strong growth, which was broad-based across most regions of the world. Towards the end of the year, increased trade tensions, notably between the U.S. and China, and lower expectations for growth translated into increased financial market volatility, lower commodity prices, and a decline in government bond yields.
Against the backdrop of easing global growth, the Canadian economy moderated to a more sustainable pace in line with underlying fundamentals. Real GDP grew 1.9% in 2018 after the strong growth of 2017 (3.0%). Throughout the year the labour market continued to be strong. Since the fall of 2015, the economy has generated close to 1 million jobs with the unemployment rate reaching its lowest level in more than 40 years.
Supported by accommodative monetary and fiscal policy, consumer spending and business investment led Canadian economic growth in 2018, while lower global oil prices over the second half of the year and slower housing market activity weighed on the economy.
There was continued volatility in commodity markets over the year with the price of West Texas Intermediate crude oil increasing to nearly US$70 per barrel in October, its highest level since before the oil shock, before retreating again to below US$50 per barrel toward the end of 2018.
Canada's nominal GDP, the broadest measure of the tax base, grew 3.6% in 2018, down from 5.6% in 2017. Lower nominal growth was due to more moderate real GDP growth as well as lower GDP inflation, the latter reflecting a decrease in global and Canadian oil prices at the end of the year. Both real and nominal GDP growth in 2018 were in line with the Budget 2019 forecast.
Both short– and long–term interest rates in Canada continued to increase over most of 2018 as a result of increases in the Bank of Canada's policy target rate. However, interest rates across the yield curve remained historically low in 2018, and long-term interest rates began to subside towards the end of the year in response to expectations for easing monetary policy in the U.S., and overall economic uncertainty.
Going forward, there remain important uncertainties and risks in the global and domestic economies. The Government regularly surveys private sector economists on their views on the economy to assess and manage risk. The survey of private sector economists has been used as the basis for economic and fiscal planning since 1994 and introduces an element of independence into the Government's forecasts. This practice has been supported by international organizations, such as the IMF.
| 2017 | 2018 | 2019 | 2020 | |
|---|---|---|---|---|
| Real GDP growth | ||||
| Budget 2018 | 3.0 | 2.1 | 1.6 | 1.7 |
| Budget 2019 | 3.0 | 1.9 | 1.8 | 1.6 |
| Actual | 3.0 | 1.9 | – | – |
| Nominal GDP growth | ||||
| Budget 2018 | 5.6 | 4.1 | 3.5 | 3.8 |
| Budget 2019 | 5.6 | 3.8 | 3.4 | 3.5 |
| Actual | 5.6 | 3.6 | – | – |
| 3-month Treasury bill rate | ||||
| Budget 2018 | 0.7 | 1.4 | 2.0 | 2.3 |
| Budget 2019 | 0.7 | 1.4 | 1.9 | 2.2 |
| Actual | 0.7 | 1.4 | – | – |
| 10-year government bond rate | ||||
| Budget 2018 | 1.8 | 2.3 | 2.8 | 3.1 |
| Budget 2019 | 1.8 | 2.3 | 2.4 | 2.7 |
| Actual | 1.8 | 2.3 | – | – |
| Unemployment rate | ||||
| Budget 2018 | 6.4 | 6.0 | 6.0 | 6.1 |
| Budget 2019 | 6.3 | 5.8 | 5.7 | 5.9 |
| Actual | 6.3 | 5.8 | – | – |
| Consumer price index inflation | ||||
| Budget 2018 | 1.6 | 1.9 | 2.0 | 1.9 |
| Budget 2019 | 1.6 | 2.3 | 1.9 | 2.0 |
| Actual | 1.6 | 2.3 | – | – |
The budgetary balance
The budgetary balance is the difference between the Government's revenues and expenses over a fiscal year. It is one of the key measures of the Government's annual financial performance. The Government posted an annual deficit of $14.0 billion in 2019, compared to a deficit of $19.0 billion in 2018.
The following graph shows the Government's budgetary balance since 1995. To enhance the comparability of results over time and across jurisdictions, the budgetary balance and its components are presented as a percentage of GDP. In 2019, the budgetary deficit was 0.6% of GDP, compared to a deficit of 0.9% of GDP a year earlier.
Annual surplus/deficit
(percentage of GDP)
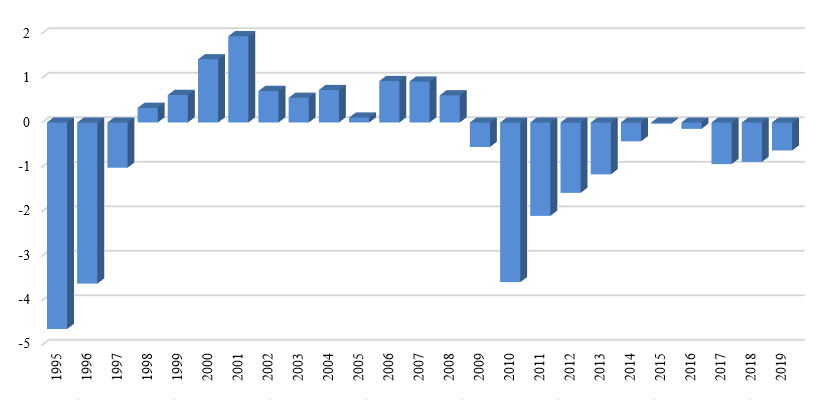
Image description
| Fiscal year | Percentage |
|---|---|
| 1995 | (negative 4.64) |
| 1996 | (negative 3.62) |
| 1997 | (negative 1.02) |
| 1998 | 0.33 |
| 1999 | 0.62 |
| 2000 | 1.42 |
| 2001 | 1.94 |
| 2002 | 0.71 |
| 2003 | 0.55 |
| 2004 | 0.73 |
| 2005 | 0.11 |
| 2006 | 0.93 |
| 2007 | 0.92 |
| 2008 | 0.61 |
| 2009 | (negative 0.55) |
| 2010 | (negative 3.59) |
| 2011 | (negative 2.10) |
| 2012 | (negative 1.58) |
| 2013 | (negative 1.17) |
| 2014 | (negative 0.42) |
| 2015 | (negative 0.03) |
| 2016 | (negative 0.14) |
| 2017 | (negative 0.93) |
| 2018 | (negative 0.89) |
| 2019 | (negative 0.63) |
Revenues were up $21.0 billion, or 6.7%, from the prior year, reflecting increases in all streams, driven primarily by income tax revenues, other taxes and duties and other revenues.
Expenses were up $16.0 billion, or 4.8%, from the prior year. Program expenses increased by $14.6 billion, or 4.7%, primarily reflecting an increase in transfer payments. Public debt charges increased by $1.4 billion, or 6.3%, from the prior year.
| 2019 | 2018 RestatedLink to footnote 2 |
|
|---|---|---|
| Consolidated Statement of Operations | ||
| Revenues | 332,218 | 311,216 |
| Expenses | ||
| Program expenses | 322,916 | 308,288 |
| Public debt charges | 23,266 | 21,889 |
| Total expenses | 346,182 | 330,177 |
| Annual deficit | (negative 13,964) | (negative 18,961) |
| Percentage of GDP | (negative 0.6%) | (negative 0.9%) |
| Consolidated Statement of Financial Position | ||
| Liabilities | ||
| Accounts payable and accrued liabilities | 159,707 | 147,799 |
| Interest-bearing debt | 1,025,464 | 1,002,578 |
| Total liabilities | 1,185,171 | 1,150,377 |
| Financial assets | 413,047 | 397,490 |
| Net debt | (negative 772,124) | (negative 752,887) |
| Non-financial assets | 86,674 | 81,633 |
| Accumulated deficit | (negative 685,450) | (negative 671,254) |
| Percentage of GDP | 30.9% | 31.3% |
Revenues
Federal revenues can be broken down into four main categories: income tax revenues, other taxes and duties, Employment Insurance (EI) premium revenues and other revenues.
Within the income tax category, personal income tax revenues are the largest source of federal revenues, and accounted for 49.3% of total revenues in 2019 (down from 49.4% in 2018). Corporate income tax revenues are the second largest source of revenues, and accounted for 15.2% of total revenues in 2019 (down from 15.4% in 2018). Non-resident income tax revenues are a comparatively smaller source of revenues, accounting for only 2.8% of total revenues in 2019 (up from 2.5% in 2018).
Other taxes and duties consist of revenues from the Goods and Services Tax (GST), energy taxes, customs import duties and other excise taxes and duties. The largest component of this category—GST revenues—accounted for 11.5% of all federal revenues in 2019 (down from 11.8% in 2018). The share of the remaining components of other taxes and duties stood at 5.7% of total federal revenues (up from 5.5% in 2018).
EI premium revenues accounted for 6.7% of total federal revenues in 2019 (down slightly from 2018).
Other revenues are made up of three broad components: net income from enterprise Crown corporations and other government business enterprises; other program revenues from returns on investments, proceeds from the sales of goods and services, and other miscellaneous revenues; and foreign exchange revenues. Other revenues accounted for 8.8% of total federal revenues in 2019 (up slightly from 2018).
Composition of revenues for 2019Link to footnote 3
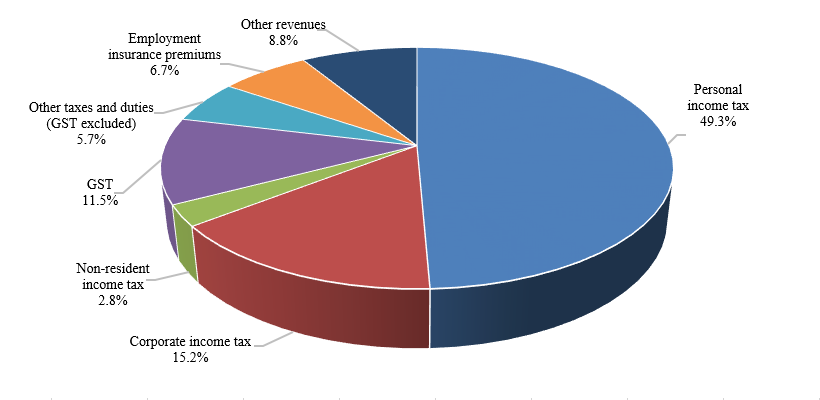
Image description
| Revenues | Percentage |
|---|---|
| Personal income tax | 49.3% |
| Corporate income tax | 15.2% |
| Non-resident income tax | 2.8% |
| GST | 11.5% |
| Other taxes and duties (GST excluded) | 5.7% |
| Employment insurance premiums | 6.7% |
| Other revenues | 8.8% |
The revenue ratio—revenues as a percentage of GDP—compares the total of all federal revenues to the size of the economy. This ratio is influenced by changes in statutory tax rates and by economic developments. The ratio stood at 15.0% in 2019 (up from 14.5% in 2018). This increase primarily reflects growth in personal and corporate income tax revenues and other taxes and duties.
Revenue ratioLink to footnote 4
(revenues as a percentage of GDP)
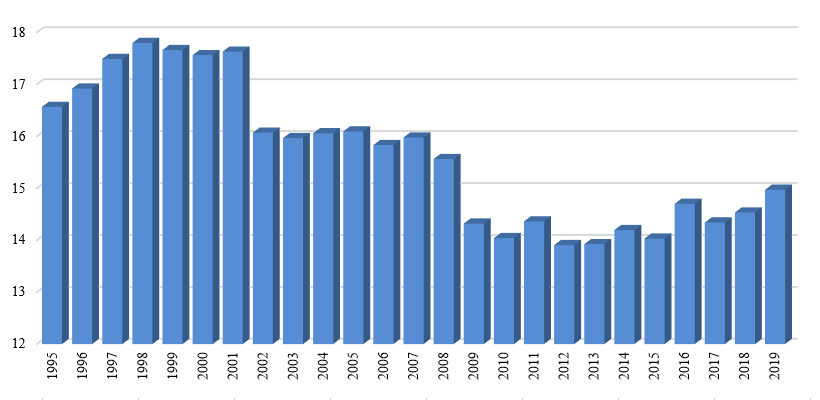
Image description
| Fiscal year | Percentage |
|---|---|
| 1995 | 16.6 |
| 1996 | 16.9 |
| 1997 | 17.5 |
| 1998 | 17.8 |
| 1999 | 17.7 |
| 2000 | 17.6 |
| 2001 | 17.6 |
| 2002 | 16.1 |
| 2003 | 16.0 |
| 2004 | 16.1 |
| 2005 | 16.1 |
| 2006 | 15.8 |
| 2007 | 16.0 |
| 2008 | 15.6 |
| 2009 | 14.3 |
| 2010 | 14.0 |
| 2011 | 14.4 |
| 2012 | 13.9 |
| 2013 | 13.9 |
| 2014 | 14.2 |
| 2015 | 14.0 |
| 2016 | 14.7 |
| 2017 | 14.3 |
| 2018 | 14.5 |
| 2019 | 15.0 |
Revenues compared to 2018
Total revenues amounted to $332.2 billion in 2019, up $21.0 billion, or 6.7%, from 2018. The following table compares revenues for 2019 to 2018.
| 2019 | 2018 RestatedLink to footnote 5 |
Change | ||
|---|---|---|---|---|
| $ | % | |||
| Income tax revenues | ||||
| Personal | 163,881 | 153,619 | 10,262 | 6.7 |
| Corporate | 50,368 | 47,805 | 2,563 | 5.4 |
| Non-resident | 9,370 | 7,845 | 1,525 | 19.4 |
| Total | 223,619 | 209,269 | 14,350 | 6.9 |
| Other taxes and duties | ||||
| Goods and services tax | 38,221 | 36,751 | 1,470 | 4.0 |
| Energy taxes | 5,802 | 5,739 | 63 | 1.1 |
| Customs import duties | 6,881 | 5,416 | 1,465 | 27.0 |
| Other excise taxes and duties | 6,323 | 5,913 | 410 | 6.9 |
| Total | 57,227 | 53,819 | 3,408 | 6.3 |
| Employment insurance premiums | 22,295 | 21,140 | 1,155 | 5.5 |
| Other revenues | 29,077 | 26,988 | 2,089 | 7.7 |
| Total revenues | 332,218 | 311,216 | 21,002 | 6.7 |
- Personal income tax revenues increased by $10.3 billion in 2019, or 6.7%, driven by high employment and a strong labour market.
- Corporate income tax revenues increased by $2.6 billion, or 5.4%, reflecting growth in corporate earnings in a number of sectors including finance, manufacturing and wholesale trade.
- Non-resident income tax revenues are paid by non-residents on Canadian-sourced income. These revenues increased by $1.5 billion, or 19.4%, largely reflecting growth in corporate earnings and dividends.
- Other taxes and duties increased by $3.4 billion, or 6.3%. GST revenues grew by $1.5 billion in 2019, or 4.0%, reflecting growth in retail sales. Energy taxes grew by $0.1 billion, or 1.1%, primarily due to higher aviation fuel consumption in 2019. Customs import duties increased by $1.5 billion, or 27.0%, largely due to the application of steel and aluminum retaliatory tariffs. Excluding the retaliatory tariffs, custom import duties grew by 5.6%. Other excise taxes and duties were up $0.4 billion, or 6.9%, driven primarily by an increase in tobacco excise duties.
- EI premium revenues increased by $1.2 billion, or 5.5%. This was due to an increase in insurable earnings and in the premium rate for 2018.
- Other revenues increased by $2.1 billion, or 7.7%, largely reflecting an increase in interest and penalties revenues and a greater return on investments, both largely due to higher interest rates.
Expenses
Federal expenses can be broken down into three main categories: transfer payments, which account for roughly two-thirds of all federal spending, other expenses and public debt charges.
Transfer payments are classified under four categories:
- Major transfers to persons, which made up 27.8% of total expenses (down from 28.4% in 2018). This category consists of elderly, EI and children's benefits.
- Major transfers to other levels of government—which include the Canada Health Transfer, the Canada Social Transfer, the home care and mental health transfers, fiscal arrangements (Equalization, transfers to the territories, a number of smaller transfer programs and the Quebec Abatement), and Gas Tax Fund transfers—made up 21.9% of total expenses in 2019 (up from 21.4% in 2018).
- Fuel charge proceeds returned, consisting of payments under the new federal carbon pollution pricing system, made up 0.2% of expenses.
- Other transfer payments, which include transfers to Aboriginal peoples, assistance to farmers, students and businesses, support for research and development, and international assistance, made up 14.9% of expenses (up from 14.3% in 2018).
Other expenses, which represent the operating expenses of the Government's 130 departments, agencies, and consolidated Crown corporations and other entities, accounted for 28.4% of total expenses in 2019 (down from 29.3% in 2018).
Public debt charges made up the remaining 6.7% of total expenses in 2019 (up slightly from 2018).
Composition of expenses for 2019Link to footnote 3
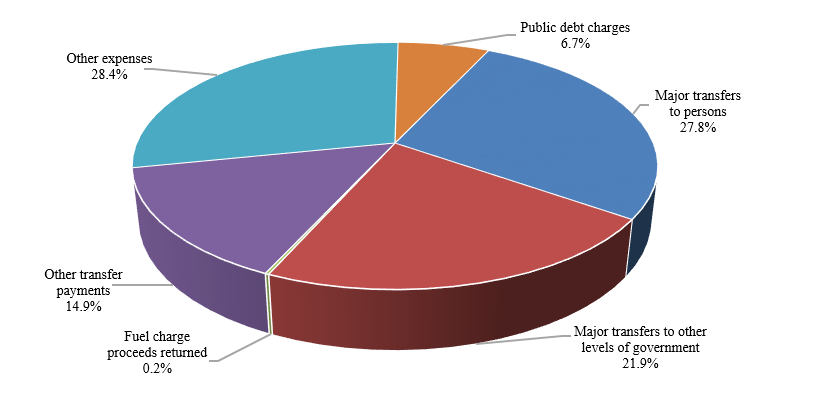
Image description
| Expenses | Percentage |
|---|---|
| Major transfers to persons | 27.8% |
| Major transfers to other levels of government | 21.9% |
| Fuel charges proceeds returned | 0.2% |
| Other transfer payments | 14.9% |
| Other expenses | 28.4% |
| Public debt charges | 6.7% |
Pricing carbon pollution while delivering Climate Action Incentive payments
The federal carbon pollution pricing system is composed of a fuel charge and an output-based pricing system. All direct proceeds from the federal fuel charge are returned to the jurisdiction of origin. In Ontario, New Brunswick, Manitoba and Saskatchewan, the bulk of proceeds are returned through Climate Action Incentive payments. Eligible individuals residing in these provinces can claim the payments through their personal income tax returns. A number of individuals have claimed the Climate Action Incentive payment before the fuel charge came into effect on April 1, 2019 by filing their tax returns before the end of the fiscal year (March 31, 2019). These payments, totaling $0.7 billion, are expensed in the 2019 fiscal year. The corresponding proceeds will be collected in the 2020 fiscal year, offsetting this expense.
Expenses compared to 2018
Total expenses amounted to $346.2 billion in 2019, up $16.0 billion, or 4.8%, from 2018. The following table compares total expenses for 2019 to 2018.
| 2019 | 2018 RestatedLink to footnote 6 |
Change | ||
|---|---|---|---|---|
| $ | % | |||
| Transfer payments | ||||
| Major transfers to persons | ||||
| Elderly benefits | 53,366 | 50,644 | 2,722 | 5.4 |
| Employment insurance | 18,888 | 19,715 | (negative 827) | (negative 4.2) |
| Children's benefits | 23,882 | 23,432 | 450 | 1.9 |
| Total | 96,136 | 93,791 | 2,345 | 2.5 |
| Major transfers to other levels of government | ||||
| Federal transfer support for health and other social programs | 52,729 | 50,872 | 1,857 | 3.7 |
| Fiscal arrangements and other transfers | 23,196 | 19,647 | 3,549 | 18.1 |
| Total | 75,925 | 70,519 | 5,406 | 7.7 |
| Fuel charge proceeds returned | 664 | – | 664 | 100.0 |
| Other transfer payments | 51,753 | 47,138 | 4,615 | 9.8 |
| Total transfer payments | 224,478 | 211,448 | 13,030 | 6.2 |
| Other expenses | 98,438 | 96,840 | 1,598 | 1.7 |
| Total program expenses | 322,916 | 308,288 | 14,628 | 4.7 |
| Public debt charges | 23,266 | 21,889 | 1,377 | 6.3 |
| Total expenses | 346,182 | 330,177 | 16,005 | 4.8 |
- Major transfers to persons increased by $2.3 billion in 2019, reflecting increases in elderly and children's benefits. Elderly benefits increased by $2.7 billion, or 5.4%, reflecting growth in the elderly population and changes in consumer prices, to which benefits are fully indexed. EI benefits decreased by $0.8 billion, or 4.2%, reflecting stronger labour market conditions. Children's benefits increased by $0.5 billion, or 1.9%, reflecting the indexation of the Canada Child Benefit, which took effect in July 2018.
- Major transfers to other levels of government increased by $5.4 billion in 2019, primarily reflecting $2.7 billion in legislated growth in the Canada Health Transfer, the Canada Social Transfer, Equalization transfers and transfers to the territories, as well as a one-time $2.2-billion increase in transfers under the Gas Tax Fund.
- Other transfer payments increased by $4.6 billion, or 9.8%, in 2019, reflecting increases across a number of departments and agencies, including higher transfers relating to infrastructure, $1.0 billion in funding for the Green Municipal Fund announced in Budget 2019, and increased transfers to First Nations and assistance for students.
- Fuel charge proceeds returned began in 2019 and amounted to $0.7 billion.
- Other expenses of departments, agencies, and consolidated Crown corporations and other entities increased by $1.6 billion, or 1.7%.
- Public debt charges increased by $1.4 billion, or 6.3%, reflecting a higher average effective interest rate on the stock of interest-bearing debt in 2019.
There has been a large shift in the composition of total expenses since the mid-1990s. Public debt charges were the largest component for most of the 1990s, given the large and increasing stock of interest-bearing debt and high average effective interest rates on that stock of debt. Since reaching a high of nearly 30% of total expenses in 1997, the share of public debt charges in total expenses has fallen by more than three-quarters.
The interest ratio (public debt charges as a percentage of revenues) shows the proportion of every dollar of revenue that is needed to pay interest and is therefore not available to pay for program initiatives. The lower the ratio, the more flexibility the Government has to address the key priorities of Canadians. The interest ratio has been decreasing in recent years, falling from a peak of 37.6% in 1991 to 7.0% in 2019. This means that, in 2019, the Government spent approximately 7 cents of every revenue dollar on interest on public debt.
Interest ratioLink to footnote 7
(public debt charges as a percentage of revenues)
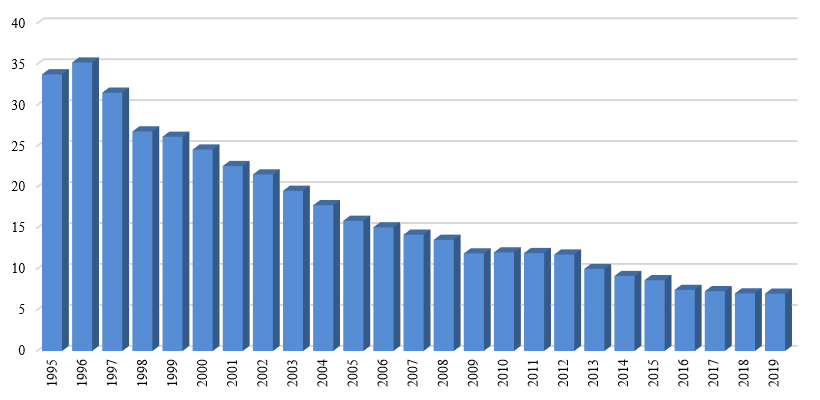
Image description
| Fiscal year | Percentage |
|---|---|
| 1995 | 33.8 |
| 1996 | 35.2 |
| 1997 | 31.5 |
| 1998 | 26.8 |
| 1999 | 26.2 |
| 2000 | 24.6 |
| 2001 | 22.6 |
| 2002 | 21.6 |
| 2003 | 19.6 |
| 2004 | 17.8 |
| 2005 | 15.9 |
| 2006 | 15.1 |
| 2007 | 14.2 |
| 2008 | 13.6 |
| 2009 | 11.9 |
| 2010 | 12.0 |
| 2011 | 12.0 |
| 2012 | 11.8 |
| 2013 | 10.0 |
| 2014 | 9.2 |
| 2015 | 8.6 |
| 2016 | 7.5 |
| 2017 | 7.3 |
| 2018 | 7.0 |
| 2019 | 7.0 |
Comparison of actual results to budget projections
Comparison to March 2019 budget plan
The $14.0-billion deficit recorded in 2019 represents a $0.9-billion improvement over the $14.9-billion deficit projected in the March 2019 Budget.
- Overall, revenues were about equal to the March 2019 budget projections.
- Program expenses were $0.6 billion lower than expected.
- Public debt charges were $0.3 billion lower than forecast, reflecting a lower-than-expected average effective interest rate on the stock of interest-bearing debt.
| Projection | Actual | Difference | |
|---|---|---|---|
| Revenues | 332,209 | 332,218 | 9 |
| Expenses | |||
| Program expenses | 323,502 | 322,916 | (negative 586) |
| Public debt charges | 23,557 | 23,266 | (negative 291) |
| Total expenses | 347,059 | 346,182 | (negative 877) |
| Annual deficit | (negative 14,850) | (negative 13,964) | 886 |
Comparison to February 2018 budget plan
The 2019 budgetary deficit of $14.0 billion represents a $1.8-billion improvement relative to the $15.8-billion deficit projected for 2019 in the February 2018 Budget. This improvement is due to higher-than-forecast revenues, offset in part by higher-than-forecast expenses.
- Revenues were $11.5 billion, or 3.6%, higher than forecast in the February 2018 Budget, driven by stronger-than-expected growth in income tax revenues, reflecting high employment and stronger-than-expected corporate profits.
- Total expenses were $9.6 billion, or 2.9%, higher than projected in the February 2018 Budget, with program expenses $11.1 billion higher than forecast and public debt charges $1.4 billion lower than forecast.
- Major transfers to persons were $1.9 billion lower than forecast. This is largely as a result of lower-than-expected EI benefits reflecting a significant reduction in unemployment.
- Major transfers to other levels of government were $2.3 billion higher than projected, due to a one-time $2.2-billion increase in transfers under the Gas Tax Fund announced in Budget 2019.
- Direct program expenses, which are comprised of other transfer payments, other expenses, and fuel charge proceeds returned, were $10.7 billion higher than projected in the February 2018 Budget. The variance from forecast was largely attributable to: higher-than-projected pension and other employee future benefit expenses, reflecting lower-than-expected discount rates used in valuing the associated benefit obligations under the Government's new discount rate approach adopted in 2018; higher-than-expected impacts from claims and litigation; and measures announced after Budget 2018, including fuel charge proceeds returned, funding for the Green Municipal Fund, and the forgiveness of loans for comprehensive claims and negotiations.
- Public debt charges were $1.4 billion lower than forecast in the February 2018 Budget, largely reflecting a lower-than-expected average effective interest rate on the stock of interest-bearing debt.
| BudgetLink to footnote 8 | Actual | Difference | |
|---|---|---|---|
| Revenues | |||
| Income tax revenues | 216,966 | 223,619 | 6,653 |
| Other taxes and duties | 55,366 | 57,227 | 1,861 |
| Employment insurance premiums | 21,716 | 22,295 | 579 |
| Other revenues | 26,711 | 29,077 | 2,366 |
| Total revenues | 320,759 | 332,218 | 11,459 |
| Expenses | |||
| Program expenses | |||
| Major transfers to persons | 98,059 | 96,136 | (negative 1,923) |
| Major transfers to other levels of government | 73,616 | 75,925 | 2,309 |
| Fuel charge proceeds returned | – | 664 | 664 |
| Other transfer payments | 47,462 | 51,753 | 4,291 |
| Other expenses | 92,714 | 98,438 | 5,724 |
| Total program expenses | 311,851 | 322,916 | 11,065 |
| Public debt charges | 24,707 | 23,266 | (negative 1,441) |
| Total expenses | 336,558 | 346,182 | 9,624 |
| Annual deficit | (negative 15,799) | (negative 13,964) | 1,835 |
Accumulated deficit
The accumulated deficit is the difference between the Government's total liabilities and total assets. The annual change in the accumulated deficit is equal to the annual budgetary balance plus other comprehensive income or loss. Other comprehensive income or loss represents certain unrealized gains and losses on financial instruments and certain actuarial gains and losses related to pensions and other employee future benefits reported by enterprise Crown corporations and other government business enterprises. Based on Canadian public sector accounting standards, other comprehensive income or loss is not included in the Government's annual budgetary balance, but is instead recorded directly to the Government's Consolidated Statement of Accumulated Deficit and Consolidated Statement of Change in Net Debt.
| 2019 | 2018 | Difference | |
|---|---|---|---|
| Accumulated deficit at beginning of year | (negative 671,254) | (negative 651,540) | (negative 19,714) |
| Annual deficit | (negative 13,964) | (negative 18,961) | 4,997 |
| Other comprehensive loss | (negative 232) | (negative 753) | 521 |
| Accumulated deficit at end of year | (negative 685,450) | (negative 671,254) | (negative 14,196) |
The accumulated deficit increased by $14.2 billion in 2019, reflecting the $14.0-billion budgetary deficit and a $0.2-billion other comprehensive loss.
The accumulated deficit was 30.9% of GDP at March 31, 2019, compared to a post-World War II peak of 66.8% at March 31, 1996.
Graph - Accumulated deficit
(as a percentage of GDP)
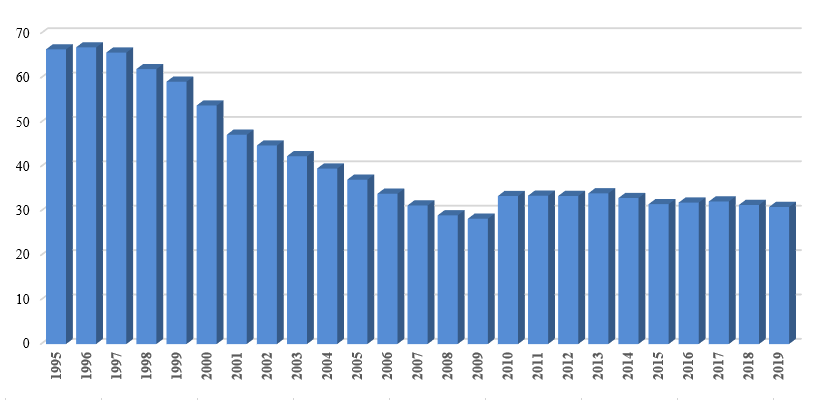
Image description
| Fiscal year | Percentage |
|---|---|
| 1995 | 66.4 |
| 1996 | 66.8 |
| 1997 | 65.7 |
| 1998 | 61.9 |
| 1999 | 59.1 |
| 2000 | 53.7 |
| 2001 | 47.2 |
| 2002 | 44.7 |
| 2003 | 42.3 |
| 2004 | 39.5 |
| 2005 | 37.0 |
| 2006 | 33.9 |
| 2007 | 31.2 |
| 2008 | 29.0 |
| 2009 | 28.2 |
| 2010 | 33.4 |
| 2011 | 33.4 |
| 2012 | 33.4 |
| 2013 | 34.0 |
| 2014 | 32.9 |
| 2015 | 31.5 |
| 2016 | 31.9 |
| 2017 | 32.1 |
| 2018 | 31.3 |
| 2019 | 30.9 |
Measures of Government debt
The consolidated financial statements of the Government of Canada are presented on an accrual basis of accounting. On this basis, there are several generally accepted definitions of government debt.
Total liabilities of the Government consist of unmatured debt, or debt issued on the credit markets, pension and other future benefit liabilities, other interest-bearing liabilities, and accounts payable and accrued liabilities.
Net debt represents the total liabilities of the Government less its financial assets. Financial assets include cash and cash equivalents, accounts receivable, foreign exchange accounts, loans, investments and advances, and public sector pension assets.
The accumulated deficit is equal to total liabilities less total assets—both financial and non-financial. Non-financial assets include tangible capital assets, such as land and buildings, inventories, and prepaid expenses and other. The accumulated deficit is the federal government's main measure of debt.
Measures of Government debt chart
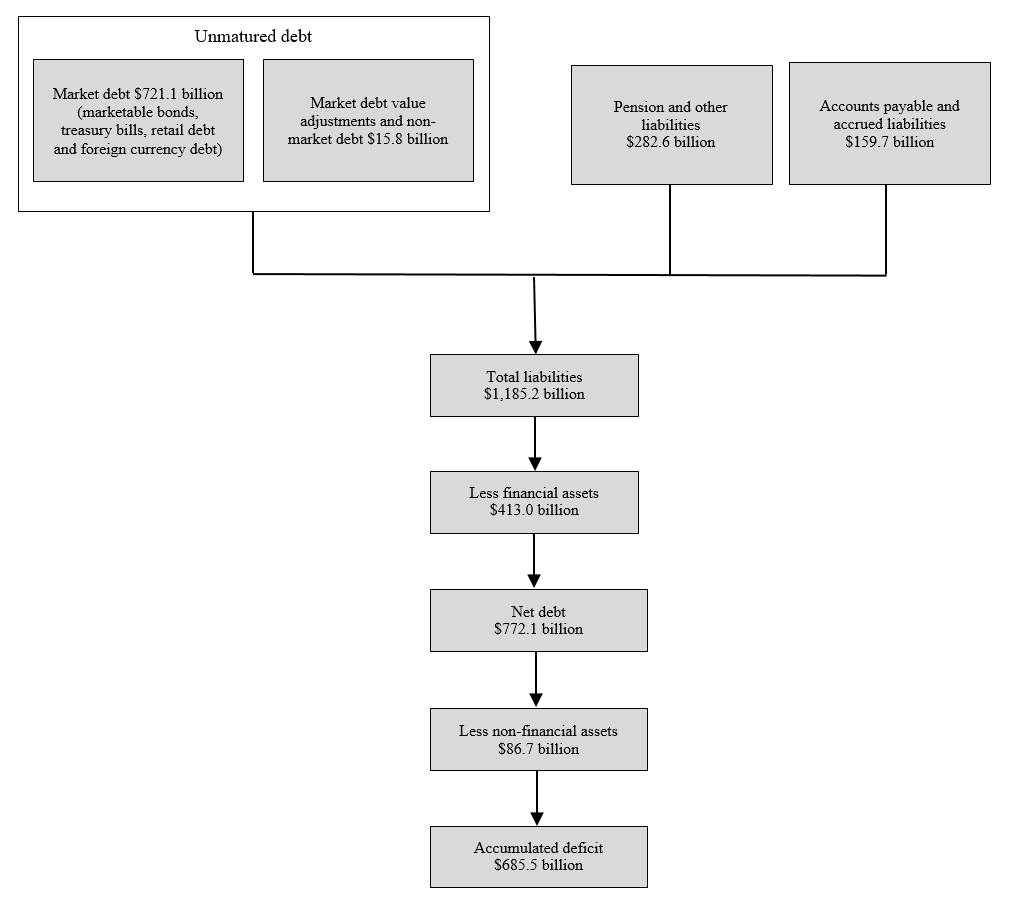
Image description
The Measures of Government debt chart a total of 8 relationship boxes. The first 3 liability measurements align horizontally as follows: Unmatured debt which is made up of Market debt for $721.1 billion (marketable bonds, treasury bills, retail debt and foreign currency debt) and Market debt value adjustments and non-market debt for $15.8 billion; Pension and other liabilities for $282.6 billion; and Accounts payable and accrued liabilities for $159.7 billion. The remaining measurement relationship boxes are aligned vertically below as follows: Total liabilities for $1,185.2 billion; Less financial assets for $413.0 billion; Net debt for $772.1 billion; Less non-financial assets for $86.7 billion; and Accumulated deficit for $685.5 billion.
The Government's total liabilities include interest-bearing debt and accounts payable and accrued liabilities. Total assets include both financial and non-financial assets, the latter consisting primarily of tangible capital assets. The following sections provide more details on each of these components.
| 2019 | 2018 RestatedLink to footnote 9 |
Difference | |
|---|---|---|---|
| Liabilities | |||
| Accounts payable and accrued liabilities | 159,707 | 147,799 | 11,908 |
| Interest-bearing debt | |||
| Unmatured debt | 736,915 | 721,201 | 15,714 |
| Pensions and other future benefits | 282,644 | 275,707 | 6,937 |
| Other liabilities | 5,905 | 5,670 | 235 |
| Total | 1,025,464 | 1,002,578 | 22,886 |
| Total liabilities | 1,185,171 | 1,150,377 | 34,794 |
| Financial assets | |||
| Cash and accounts receivable | 177,041 | 172,057 | 4,984 |
| Foreign exchange accounts | 99,688 | 96,938 | 2,750 |
| Loans, investments and advances | 133,912 | 126,371 | 7,541 |
| Public sector pension assets | 2,406 | 2,124 | 282 |
| Total financial assets | 413,047 | 397,490 | 15,557 |
| Net debt | (negative 772,124) | (negative 752,887) | (negative 19,237) |
| Non-financial assets | 86,674 | 81,633 | 5,041 |
| Accumulated deficit | (negative 685,450) | (negative 671,254) | (negative 14,196) |
Accounts payable and accrued liabilities
The following chart shows accounts payable and accrued liabilities by category for 2019.
Accounts payable and accrued liabilities by category for 2019Link to footnote 3
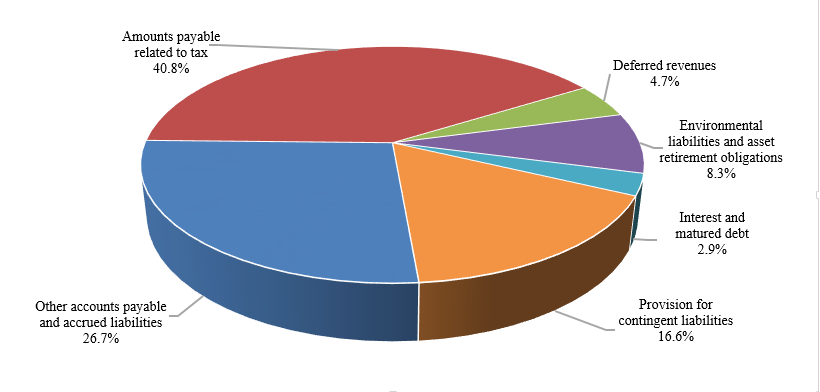
Image description
| Accounts payable and accrued liabilities | Percentage |
|---|---|
| Other accounts payable and accrued liabilities | 26.7% |
| Amounts payable related to tax | 40.8% |
| Deferred revenues | 4.7% |
| Environmental liabilities and asset retirement obligations | 8.3% |
| Interest and matured debt | 2.9% |
| Provision for contingent liabilities | 16.6% |
The Government's accounts payable and accrued liabilities consist of amounts payable related to tax based on assessments and estimates of refunds owing for tax assessments not completed by year-end; provisions for contingent liabilities, including guarantees provided by the Government and claims and pending and threatened litigation; environmental liabilities and asset retirement obligations, which include estimated costs related to the remediation of contaminated sites and the future restoration of certain tangible capital assets; deferred revenue; interest and matured debt, as well as accrued interest at year-end; and other accounts payable and accrued liabilities. Other accounts payable and accrued liabilities include items such as accrued salaries and benefits; amounts payable to provinces, territories and Aboriginal governments for taxes collected and administered on their behalf in accordance with tax collection agreements; and amounts owing at year-end pursuant to contractual arrangements or for work performed or goods received.
At March 31, 2019, accounts payable and accrued liabilities totalled $159.7 billion, up $11.9 billion from March 31, 2018. This increase reflects growth in amounts payable related to tax, provisions for contingent liabilities, other accounts payable and accrued liabilities, environmental liabilities and asset retirement obligations, and interest and matured debt, partially offset by a decrease in deferred revenue.
- Amounts payable related to tax increased by $3.3 billion in 2019, from $61.9 billion at March 31, 2018, to $65.2 billion at March 31, 2019. This increase reflects in part the Climate Action Incentive payments that were accrued at the end of the year.
- Provisions for contingent liabilities increased by $3.4 billion, largely reflecting an increase in the Government's estimates of amounts required to settle various specific claims and pending and threatened litigation.
- Environmental liabilities and asset retirement obligations increased by $0.9 billion in 2019, reflecting revisions to previously estimated provisions, net of remediation activities undertaken.
- Deferred revenue decreased by $0.7 billion in 2019, primarily reflecting the recognition of previously deferred revenue related to spectrum licence auctions.
- Liabilities for interest and matured debt increased by $4 million from the prior year.
- Other accounts payable and accrued liabilities increased by $5.0 billion in 2019. Within this component, accounts payable increased by $5.2 billion. This increase was attributable in large part to the accrual of $3.2 billion in spending measures announced in Budget 2019, including a one-time $2.2-billion top-up to the Gas Tax Fund and $1.0 billion in funding for the Green Municipal Fund. Miscellaneous paylist deductions and other accounts payable increased by $0.1 billion and $21 million, respectively. Accrued salaries and benefits increased by $0.1 billion, due mainly to an increase in allowances for vacation pay. These increases were somewhat offset by a $0.4-billion decrease in liabilities under tax collection agreements, reflecting timing differences in payments to provinces, territories and Aboriginal governments, and a $44-million decrease in notes payable to international organizations.
Graph - Accounts payable and accrued liabilitiesLink to footnote 10
(in billions of dollars)
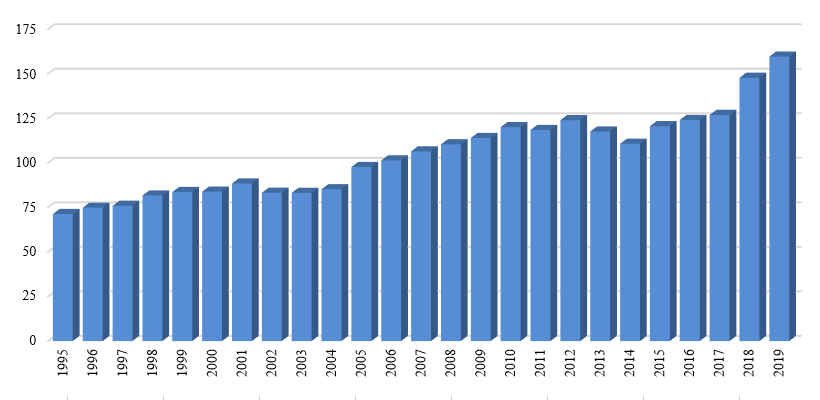
Image description
| Fiscal year | Billions of dollars |
|---|---|
| 1995 | 71.3 |
| 1996 | 74.9 |
| 1997 | 75.9 |
| 1998 | 81.7 |
| 1999 | 83.7 |
| 2000 | 83.9 |
| 2001 | 88.5 |
| 2002 | 83.2 |
| 2003 | 83.2 |
| 2004 | 85.2 |
| 2005 | 97.7 |
| 2006 | 101.4 |
| 2007 | 106.5 |
| 2008 | 110.5 |
| 2009 | 114.0 |
| 2010 | 120.1 |
| 2011 | 118.5 |
| 2012 | 124.0 |
| 2013 | 117.6 |
| 2014 | 110.8 |
| 2015 | 120.6 |
| 2016 | 124.1 |
| 2017 | 127.0 |
| 2018 | 147.8 |
| 2019 | 159.7 |
Interest-bearing debt
Interest-bearing debt includes unmatured debt, or debt issued on the credit markets, pension and other future benefit liabilities, and other liabilities.
- Unmatured debt, which includes fixed-coupon marketable bonds, Real Return Bonds, treasury bills, retail debt (Canada Savings Bonds and Canada Premium Bonds), foreign-currency-denominated debt, and obligations related to capital leases and public-private partnerships, amounted to 71.9% of interest-bearing debt at March 31, 2019.
- Pension and other future benefit liabilities include obligations for: federal public sector pensions sponsored by the Government; disability and associated benefits available to war veterans, current and retired members of the Canadian Forces and the Royal Canadian Mounted Police, their survivors and dependants; health care and dental benefits available to retired employees and their dependants; accumulated sick leave entitlements; severance benefits; workers' compensation benefits; and other future benefits sponsored by some consolidated Crown corporations and other entities. Liabilities for public sector pensions made up 16.5% of interest-bearing debt and other employee and veteran future benefits accounted for an additional 11.1% of interest-bearing debt.
- The remaining 0.6% of interest-bearing debt represents other interest-bearing liabilities of the Government, which include deposit and trust accounts and other specified purpose accounts.
The share of total interest-bearing debt represented by unmatured debt had been declining since the mid-1990s, as the Government was able to retire some of this debt. This trend reversed in 2009 due to the increase in financial requirements stemming from the recession and stimulus measures introduced to mitigate its impacts, as well as an increase in borrowings under the consolidated borrowing framework introduced in 2008. Under the consolidated borrowing framework, the Government finances all of the borrowing needs of Canada Mortgage and Housing Corporation, the Business Development Bank of Canada and Farm Credit Canada through direct lending in order to reduce overall borrowing costs and improve the liquidity of the government securities market.
Graph - Interest-bearing debt by category for 2019Link to footnote 3
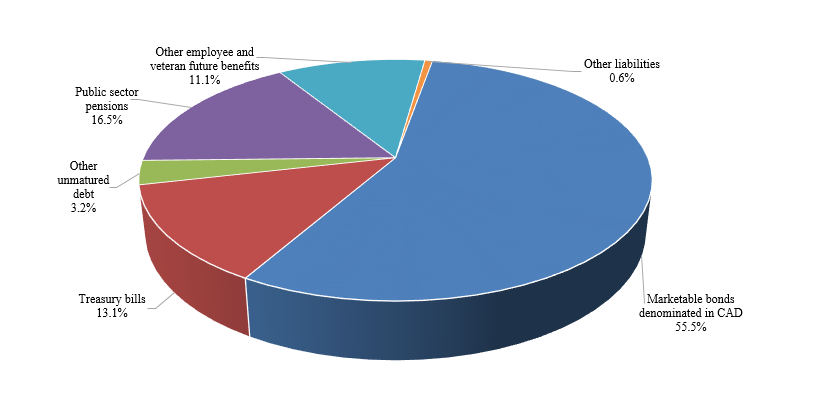
Image description
| Interest bearing debt | Percentage |
|---|---|
| Marketable bonds denominated in CAD | 55.5% |
| Treasury bills | 13.1% |
| Other unmatured debt | 3.2% |
| Public sector pensions | 16.5% |
| Other employee and veteran future benefits | 11.1% |
| Other liabilities | 0.6% |
At March 31, 2019, interest-bearing debt totalled $1,025.5 billion, up $22.9 billion from March 31, 2018. Within interest-bearing debt, unmatured debt increased by $15.7 billion, liabilities for pensions decreased by $2.1 billion, liabilities for other employee and veteran future benefits increased by $9.1 billion, and other liabilities increased by $0.2 billion.
The $15.7-billion increase in unmatured debt is largely attributable to a $16.8-billion increase in market debt, reflecting increased borrowings to meet the financial needs of the Government. This increase was partially offset by a $1.3-billion decrease in unamortized discounts and premiums on market debt.
The Bank of Canada and the Department of Finance Canada manage the Government's unmatured debt and associated risks. The fundamental objective of the debt management strategy is to provide stable, low-cost funding to meet the Government's financial obligations and liquidity needs. Details on the Government's debt management objectives and principles are tabled annually in Parliament through the Department of Finance Canada's Debt Management Strategy.
Foreign holdings of the Government's unmatured debt are estimated at $215.6 billion, representing approximately 29.3% of the Government's total unmatured debt.
Foreign holdings of Government of Canada unmatured debt
(as a percentage of unmatured debt)
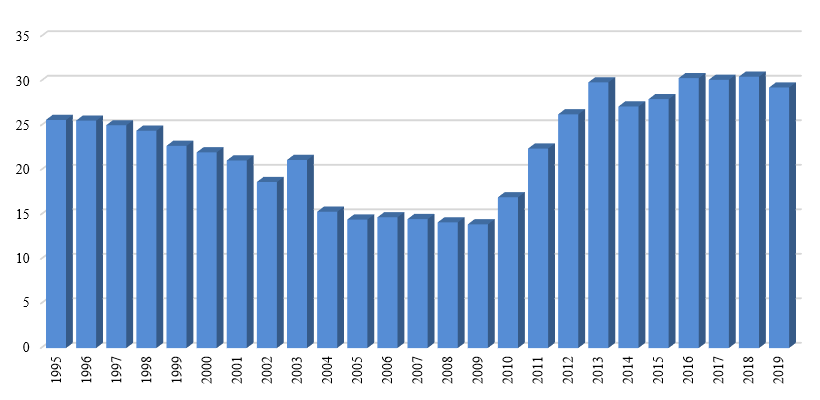
Image description
| Fiscal year | Percentage |
|---|---|
| 1995 | 25.6 |
| 1996 | 25.5 |
| 1997 | 25.0 |
| 1998 | 24.4 |
| 1999 | 22.7 |
| 2000 | 22.0 |
| 2001 | 21.1 |
| 2002 | 18.6 |
| 2003 | 21.1 |
| 2004 | 15.3 |
| 2005 | 14.4 |
| 2006 | 14.7 |
| 2007 | 14.5 |
| 2008 | 14.1 |
| 2009 | 13.9 |
| 2010 | 16.9 |
| 2011 | 22.4 |
| 2012 | 26.2 |
| 2013 | 29.8 |
| 2014 | 27.1 |
| 2015 | 28.0 |
| 2016 | 30.3 |
| 2017 | 30.1 |
| 2018 | 30.5 |
| 2019 | 29.3 |
Source: Statistics Canada
The Government's liabilities for pensions and other future benefits stood at $282.6 billion at March 31, 2019, up $6.9 billion from the prior year. These liabilities represent the estimated present value of pensions and other future benefits earned to March 31, 2019, by current and former employees, as measured annually on an actuarial basis, net of the value of assets set aside for funding purposes. Liabilities for pensions and other future benefits do not include benefits payable under the Canada Pension Plan (CPP). The CPP is not consolidated in the Government's financial statements because changes to the CPP require the agreement of two thirds of participating provinces and it is therefore not controlled by the Government. Further information regarding the CPP can be found in Section 6 of this volume.
Accounting for pensions and other employee and veteran future benefits
The Government's $282.6-billion liability for pensions and other employee and veteran future benefits results from its promise to provide certain benefits to employees during or after employment, or in retirement, in return for their service.
For benefits that accumulate over time as employees work, such as pensions, an annual expense and liability are recorded for the estimated cost of benefits earned by employees during the year. The Government uses an actuarial cost method (the projected accrued benefit method prorated on service) to estimate this expense and liability. Under this method, the Government estimates the total expected future benefit payments for current employees. This total is then pro-rated over employees' period of employment. This means that an equal portion of the estimate is expensed as current service cost in each year of an employee's service, on a present value basis. Several actuarial assumptions are used in calculating current service cost, including future inflation, interest rates, return on pension investments, general wage increases, workforce composition, retirement rates and mortality rates.
For post-employment benefits or compensated absences that do not vest or accumulate, a liability and expense for the expected cost of providing future benefits is recognized immediately in the period when the obligating event occurs. For example, benefits provided to employees in the event of an accident or injury would be recorded when the accident or injury occurs.
Since April 1, 2000, amounts equal to contributions less payments and other charges related to the public service, Canadian Forces—Regular Force and Royal Canadian Mounted Police pension plans, and since 2007 for the Canadian Forces—Reserve Force pension plan, that fall within the Income Tax Act limits are transferred to the Public Sector Pension Investment Board (PSPIB) for investment. Pension assets held by the PSPIB are valued at a market-related value. The Government’s accrued benefit obligations for pensions and other employee and veteran future benefits are presented net of pension assets, as well as unrecognized net actuarial gains and losses (discussed below) and amounts related to the plans of some consolidated Crown corporations and other entities, in arriving at the liability for pensions and other future benefits shown on the Consolidated Statement of Financial Position.
Since the Government's obligations for pensions and other future benefits are recorded on a present value basis, interest expense is recorded each year and added to the obligations to reflect the passage of time, as these liabilities are one year closer to settlement. Interest expense is recorded net of the expected return on investments for funded pension benefits, and reported as part of public debt charges. Current service cost is recorded as part of other expenses on the Consolidated Statement of Operations and Accumulated Deficit.
When an employee ceases employment with the Government, the Government stops recording current service cost in respect of that employee. Benefits subsequently provided to the employee are recorded as reductions in the Government's benefit obligation.
The Government's obligations for pensions and other future benefits are re-estimated on an annual basis to reflect actual experience and updated actuarial assumptions. Increases or decreases in the estimated value of the obligations are referred to as actuarial gains and losses. Under Canadian public sector accounting standards, actuarial gains and losses are not recognized in the Government's liabilities immediately due to their tentative nature and because further adjustments may be required in the future. Instead, these amounts are amortized to expense and to the Government's liabilities over the expected average remaining service life of employees, which represents periods ranging from 4 to 23 years, according to the plan in question, or the average remaining life expectancy of benefit recipients under wartime veteran plans, which represents periods ranging from 6 to 8 years.
For plan amendments, curtailments and settlements that affect accrued benefit obligations for services already rendered by employees, the change in the Government's obligations is reflected in the period of the amendment, curtailment or settlement and recorded as part of other expenses.
The following table illustrates the change in the Government's liabilities for pensions and other future benefits, net of public sector pension assets, in 2019.
| Pensions | Other future benefits | Total | |
|---|---|---|---|
| Net future benefit liabilities at beginning of year | 168,790 | 104,793 | 273,583 |
| Add: | |||
| Benefits earned during the year | 7,305 | 6,807 | 14,112 |
| Interest on accrued benefit obligations, net of the expected return on investments | 3,509 | 3,272 | 6,781 |
| Net actuarial losses recognized during the year | 3,678 | 4,778 | 8,456 |
| Plan amendments, curtailments, settlements and valuation allowanceLink to footnote 11 | 76 | (negative 12) | 64 |
| Subtotal | 14,568 | 14,845 | 29,413 |
| Deduct: | |||
| Benefits paid during the year | 12,223 | 5,694 | 17,917 |
| Transfers to the PSPIB and funds held in external trustsLink to footnote 12 | 3,930 | – | 3,930 |
| Transfers to other plans and administrative expenses | 829 | 82 | 911 |
| Subtotal | 16,982 | 5,776 | 22,758 |
| Net (decrease) increase | (negative 2,414) | 9,069 | 6,655 |
| Net future benefit liabilities at end of year | 166,376 | 113,862 | 280,238 |
| Presented on the Consolidated Statement of Financial Position as: | |||
| Public sector pension liabilities | 168,782 | ||
| Other employee and veteran future benefit liabilities | 113,862 | ||
| Total pension and other future benefit liabilities | 282,644 | ||
| Public sector pension assets | 2,406 | ||
| Net pensions and other future benefit liabilities | 280,238 | ||
The increase in net liabilities for pensions and other future benefits in 2019 reflects the addition of $14.1 billion in future benefits earned by employees during the year, as well as $6.8 billion in net interest charges on the liabilities. The discount rates used in the measurement of unfunded pension and benefit obligations and in calculating interest charges on the obligations are based on the actual zero-coupon yield curve for Government of Canada bonds at fiscal year-end. The discount rate used to value the Government’s obligations for funded pension benefits, which relate to post-March 2000 service under its three main pension plans―the public service, Canadian Forces–Regular Force, and Royal Canadian Mounted Police pension plans―as well as benefits under the Canadian Forces–Reserve Force pension plan is based on the streamed expected rates of return on invested funds.
The Government's liabilities for pensions and other future benefits increased by an additional $8.5 billion in 2019 due to the amortization of actuarial gains and losses. As of March 31, 2019, the Government had net unamortized losses of $83.3 billion. These losses will be amortized over time and recorded as part of other expenses and as an increase in the Government’s liabilities.
The Government also recorded a $0.1-billion increase in liabilities for pensions and other future benefits to reflect the net impact of plan amendments, curtailments, settlements and valuation allowance during the year.
These increases were offset in part by reductions in the liabilities for benefits paid during the year ($17.9 billion) and for net transfers to the PSPIB and funds held in external trusts for investment ($3.9 billion).
Further details on the federal public sector pension plans and other employee and veteran future benefits are contained in Section 6 of this volume.
Interest-bearing debt stood at 46.2% of GDP in 2019, down from 46.8% in 2018. This ratio is down over 28 percentage points from its high of 74.4% in 1996.
Graph - Interest-bearing debt
(as a percentage of GDP)
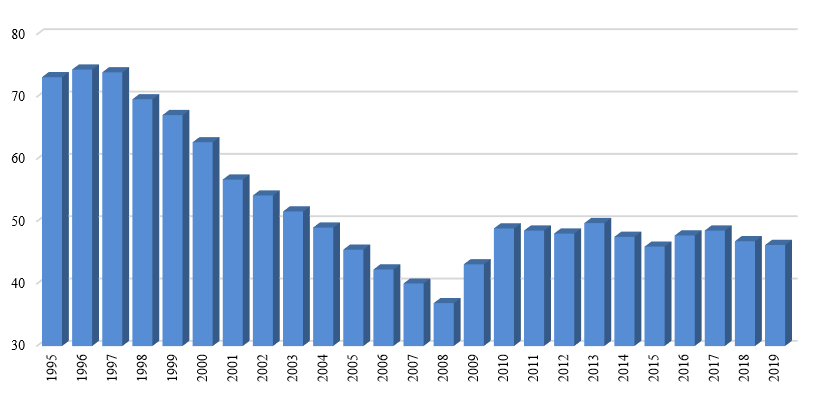
Image description
| Fiscal year | Percentage |
|---|---|
| 1995 | 73.1 |
| 1996 | 74.4 |
| 1997 | 73.9 |
| 1998 | 69.6 |
| 1999 | 67.1 |
| 2000 | 62.7 |
| 2001 | 56.7 |
| 2002 | 54.1 |
| 2003 | 51.6 |
| 2004 | 49.0 |
| 2005 | 45.5 |
| 2006 | 42.3 |
| 2007 | 40.0 |
| 2008 | 36.9 |
| 2009 | 43.1 |
| 2010 | 48.9 |
| 2011 | 48.5 |
| 2012 | 48.1 |
| 2013 | 49.7 |
| 2014 | 47.5 |
| 2015 | 45.9 |
| 2016 | 47.7 |
| 2017 | 48.5 |
| 2018 | 46.8 |
| 2019 | 46.2 |
The average effective interest rate on the Government's interest-bearing debt in 2019 was 2.3%, up from 2.2% in 2018. The average effective interest rate on unmatured debt in 2019 was 2.2%, while the average effective interest rate on pension and other liabilities was 2.5%, reflecting the longer average duration of these obligations.
Average effective interest rate on interest-bearing debt
(in percentage)
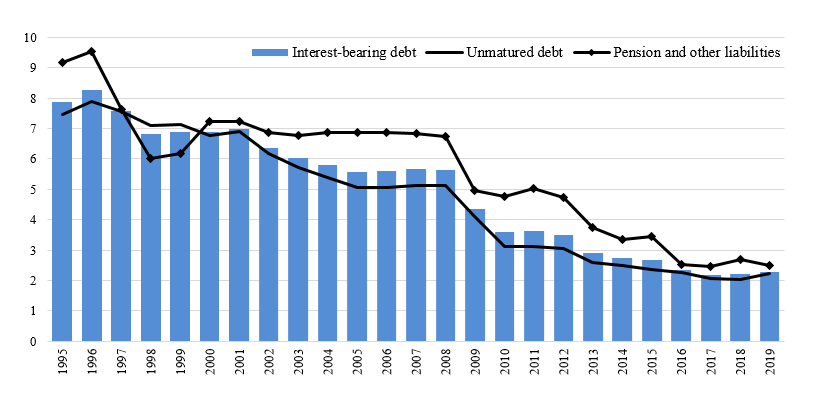
Image description
| Fiscal year | Interest-bearing debt percentage | Unmatured debt percentage | Pension and other liabilities percentage |
|---|---|---|---|
| 1995 | 7.9 | 7.5 | 9.2 |
| 1996 | 8.3 | 7.9 | 9.5 |
| 1997 | 7.6 | 7.6 | 7.6 |
| 1998 | 6.8 | 7.1 | 6.0 |
| 1999 | 6.9 | 7.1 | 6.2 |
| 2000 | 6.9 | 6.8 | 7.2 |
| 2001 | 7.0 | 6.9 | 7.2 |
| 2002 | 6.4 | 6.2 | 6.9 |
| 2003 | 6.0 | 5.7 | 6.8 |
| 2004 | 5.8 | 5.4 | 6.9 |
| 2005 | 5.6 | 5.0 | 6.9 |
| 2006 | 5.6 | 5.0 | 6.9 |
| 2007 | 5.7 | 5.1 | 6.8 |
| 2008 | 5.6 | 5.1 | 6.7 |
| 2009 | 4.4 | 4.1 | 5.0 |
| 2010 | 3.6 | 3.1 | 4.8 |
| 2011 | 3.6 | 3.1 | 5.0 |
| 2012 | 3.5 | 3.1 | 4.7 |
| 2013 | 2.9 | 2.6 | 3.8 |
| 2014 | 2.7 | 2.5 | 3.4 |
| 2015 | 2.7 | 2.4 | 3.5 |
| 2016 | 2.3 | 2.3 | 2.5 |
| 2017 | 2.2 | 2.1 | 2.5 |
| 2018 | 2.2 | 2.0 | 2.7 |
| 2019 | 2.3 | 2.2 | 2.5 |
Financial assets
Financial assets include cash on deposit with the Bank of Canada, chartered banks and other financial institutions, accounts receivable, foreign exchange accounts, loans, investments and advances, and public sector pension assets of consolidated Crown corporations and other entities. The Government's foreign exchange accounts include foreign currency deposits, investments in marketable securities, and subscriptions and loans to the IMF. Proceeds of the Government's foreign currency borrowings are held in the Exchange Fund Account to provide foreign currency liquidity and provide funds needed to promote orderly conditions for the Canadian dollar in foreign exchange markets. Further details on the management of international reserves are available in the annual Report on the Management of Canada's Official International Reserves. The Government's loans, investments and advances include its investments in and loans to enterprise Crown corporations, loans to national governments mainly for financial assistance and development of export trade, and loans under the Canada Student Loans Program.
Financial assets by category for 2019Link to footnote 3
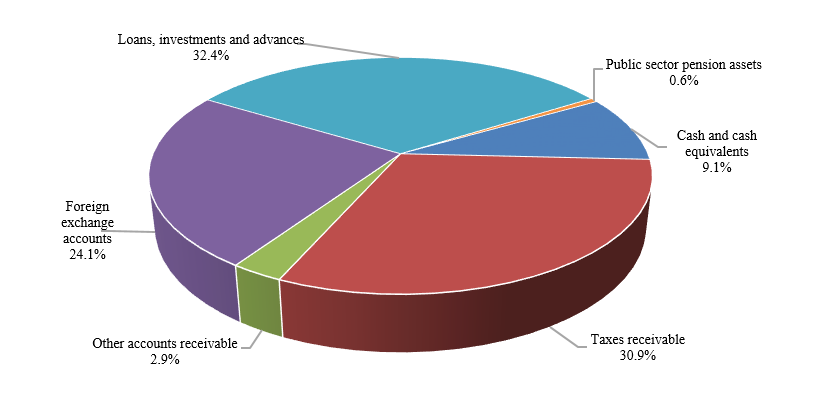
Image description
| Financial assets | Percentage |
|---|---|
| Cash and cash equivalents | 9.1% |
| Taxes receivable | 30.9% |
| Other accounts receivable | 2.9% |
| Foreign exchange accounts | 24.1% |
| Loans, investments and advances | 32.4% |
| Public sector pension assets | 0.6% |
At March 31, 2019, financial assets amounted to $413.0 billion, up $15.6 billion from March 31, 2018. The increase in financial assets reflects increases in cash and accounts receivable, foreign exchange accounts, loans, investments and advances, and public sector pension assets.
At March 31, 2019, cash and accounts receivable totalled $177.0 billion, up $5.0 billion from March 31, 2018. Within this component, cash and cash equivalents increased by $3.0 billion. The balance of cash and cash equivalents includes $20 billion which has been designated as a deposit held with respect to prudential liquidity management. The Government's overall liquidity is maintained at a level sufficient to cover at least one month of net projected cash flows, including coupon payments and debt refinancing needs. Taxes receivable increased by $4.5 billion during 2019 to $127.6 billion, reflecting growth in tax revenues and higher disputed arrears. Other accounts receivable decreased by $2.5 billion, largely due to a $1.6-billion decrease in cash collateral under International Swaps and Derivatives Association agreements in respect of outstanding cross-currency swap agreements and a $1.0-billion decrease in dividends receivable from Canada Mortgage and Housing Corporation at year-end.
Loans, investments and advances in enterprise Crown corporations and other government business enterprises increased by $7.4 billion in 2019. Investments in enterprise Crown corporations and other government business enterprises decreased by $0.6 billion, as the $5.9 billion in net profits recorded by these entities during 2019 were more than offset by $0.2 billion in other comprehensive losses and $6.4 billion in dividends paid to the Government. Net loans and advances were up $8.0 billion, primarily reflecting a $3.2-billion increase in loans to Crown corporations under the consolidated borrowing framework, and $4.8-billion in financing to the Canada Development Investment Corporation (CDEV) from the Canada Account to fund the acquisition of the Trans Mountain entities, to finance construction activities for the expansion project, and to fund other corporate purposes.
Details of the Trans Mountain Pipeline acquisition
On August 31, 2018, the Government of Canada purchased the entities that control the existing Trans Mountain Pipeline, its Expansion Project and related assets for $4.4 billion.
The Trans Mountain entities are controlled by the Trans Mountain Corporation (TMC), which is a subsidiary of CDEV, an enterprise Crown corporation reporting to Parliament through the Minister of Finance. The consolidated equity of CDEV, which includes the Trans Mountain entities under TMC, is recorded as a government asset and reported under Loans, investments and advances on the Consolidated Statement of Financial Position.
The purchase of the Trans Mountain entities was financed through a loan to CDEV from the Canada Account, which is also reported under Loans, investments and advances. The balance of this loan amounted to $4.8 billion as at March 31, 2019. Funding for this loan was provided through an increase in Government of Canada unmatured debt.
The Trans Mountain entities currently provide transportation and logistical services to shippers from the Western Canadian sedimentary basin and generate cash flows from tolls charged to these shippers. The Expansion Project is a capital project, which will significantly increase the capacity of the Trans Mountain pipeline system.
The Trans Mountain entities have significant commercial value and generate returns from existing operational assets. The net results attributable to Canada's holdings in the Trans Mountain entities are consolidated in CDEV's net income, which is included in Other revenues—Enterprise Crown corporations and other government business enterprises on the Consolidated Statement of Operations and Accumulated Deficit.
Construction and other associated expenditures related to the construction of the Expansion Project prior to its in-service date will be recorded as additions to the book value of the Project.
It is not the intention of the Government of Canada to be a long-term owner of the Trans Mountain entities.
Other loans, investments and advances, and public sector pension assets increased by $0.1 billion and $0.3 billion, respectively.
Foreign exchange accounts increased by $2.8 billion in 2019, totalling $99.7 billion at March 31, 2019. The increase in foreign exchange accounts largely reflects a $1.8-billion increase in foreign exchange reserves held in the Exchange Fund Account, due mainly to net revenues earned on investments in the Fund during the year, and a $1.3-billion decrease in notes payable to the IMF.
Since the accumulated deficit reached its post-World War II peak of 66.8% of GDP at March 31, 1996, financial assets have increased by $320.4 billion, mainly reflecting higher levels of cash and cash equivalents and accounts receivable (up $124.5 billion), an increase in the foreign exchange accounts (up $80.6 billion), and an increase in loans, investments and advances (up $112.9 billion). The increase in cash and cash equivalents and accounts receivable is largely attributable to growth in taxes receivable, broadly in line with the growth in the applicable tax bases. The increase in the foreign exchange accounts reflects a decision by the Government in the late 1990s and more recently in the 2012 Debt Management Strategy to increase liquidity in these accounts. The increase in loans, investments and advances is attributable to several factors including the accumulation of net profits from enterprise Crown corporations, the Government taking over the financing of the Canada Student Loans Program from the chartered banks in 2000, and the issuance of direct loans to Crown corporations under the Government's consolidated borrowing framework implemented in 2008.
Graph - Financial assetsLink to footnote 13
(in billions of dollars)
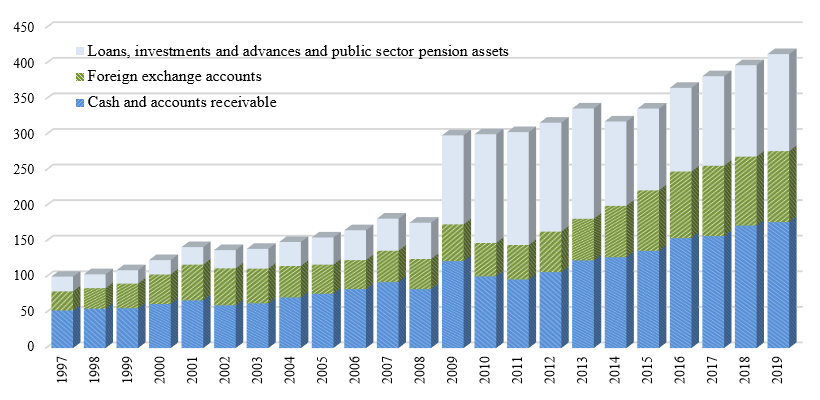
Image description
| Fiscal year | Cash and accounts receivable | Foreign exchange accounts | Loans, investments and advances and public sector pension assets |
|---|---|---|---|
| 1997 | 52.8 | 26.8 | 20.8 |
| 1998 | 55.3 | 29.0 | 19.4 |
| 1999 | 55.9 | 34.7 | 18.7 |
| 2000 | 61.9 | 41.5 | 20.1 |
| 2001 | 67.1 | 50.3 | 24.5 |
| 2002 | 59.9 | 52.0 | 25.7 |
| 2003 | 62.7 | 49.0 | 27.8 |
| 2004 | 71.0 | 44.3 | 33.8 |
| 2005 | 76.3 | 40.9 | 38.2 |
| 2006 | 82.8 | 40.8 | 41.9 |
| 2007 | 92.6 | 44.2 | 45.1 |
| 2008 | 82.9 | 42.3 | 50.9 |
| 2009 | 122.1 | 51.7 | 125.1 |
| 2010 | 100.8 | 47.0 | 152.7 |
| 2011 | 96.3 | 48.5 | 158.5 |
| 2012 | 106.7 | 57.0 | 152.9 |
| 2013 | 123.0 | 58.8 | 154.9 |
| 2014 | 127.6 | 72.3 | 118.6 |
| 2015 | 136.5 | 85.0 | 114.9 |
| 2016 | 154.6 | 93.5 | 117.6 |
| 2017 | 157.3 | 98.8 | 125.9 |
| 2018 | 172.1 | 96.9 | 128.5 |
| 2019 | 177.0 | 99.7 | 136.3 |
Net debt
The Government's net debt—its total liabilities less financial assets—stood at $772.1 billion at March 31, 2019. Net debt was 34.8% of GDP, down 0.4 percentage points from a year earlier, and 37.4 percentage points below its peak of 72.2% at March 31, 1996.
This ratio measures debt relative to the ability of the country's taxpayers to finance it. Total liabilities are reduced only by financial assets as non-financial assets cannot normally be converted to cash to pay off the debt without disrupting government operations.
Graph - Net debtLink to footnote 14
(as percentage of GDP)
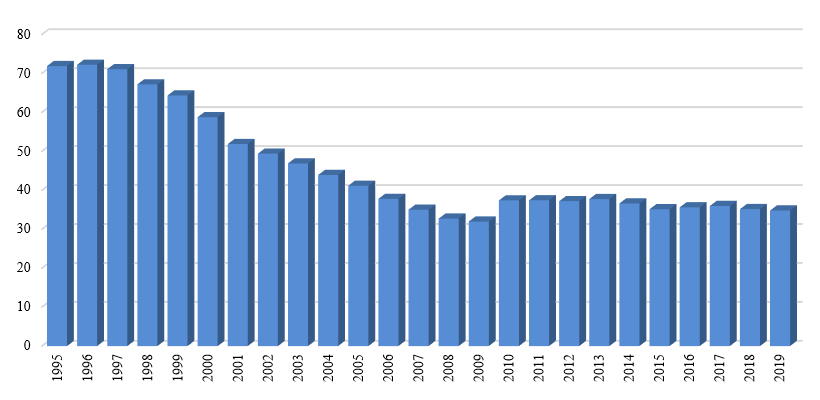
Image description
| Fiscal year | Percentage |
|---|---|
| 1995 | 71.9 |
| 1996 | 72.2 |
| 1997 | 71.1 |
| 1998 | 67.2 |
| 1999 | 64.3 |
| 2000 | 58.7 |
| 2001 | 51.9 |
| 2002 | 49.4 |
| 2003 | 46.9 |
| 2004 | 43.9 |
| 2005 | 41.1 |
| 2006 | 37.8 |
| 2007 | 35.0 |
| 2008 | 32.7 |
| 2009 | 32.0 |
| 2010 | 37.4 |
| 2011 | 37.4 |
| 2012 | 37.2 |
| 2013 | 37.7 |
| 2014 | 36.6 |
| 2015 | 35.1 |
| 2016 | 35.6 |
| 2017 | 36.0 |
| 2018 | 35.2 |
| 2019 | 34.8 |
The percentages of GDP from 2015 to 2018 have been restated to reflect the impact of the retroactive change in accounting treatment of the Canadian Commercial Corporation from principal to an agent. Additional information regarding this restatement can be found in Note 2 of the consolidated financial statements.
International comparisons of net debt
Jurisdictional responsibility (between central, state and local levels of government) for government programs differs among countries. As a result, international comparisons of government fiscal positions are undertaken on a total government, National Accounts, basis. For Canada, total government net debt includes that of the federal, provincial/territorial and local governments, as well as the net assets held in the Canada Pension Plan and Quebec Pension Plan.
Canada has the lowest total government net debt burden among G7 countries
G7 total government net debt, 2018Link to footnote 15
(as a percentage of GDP)
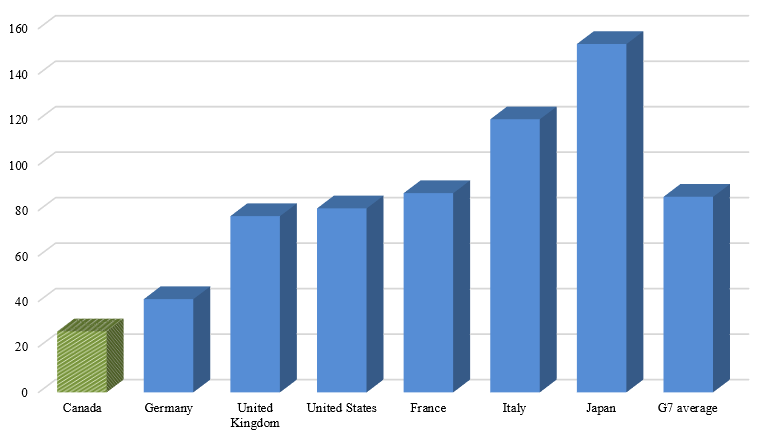
Image description
| Country | Percentage |
|---|---|
| Canada | 26.8 |
| Germany | 41.0 |
| United Kingdom | 77.5 |
| United States | 80.9 |
| France | 87.6 |
| Italy | 120.1 |
| Japan | 153.2 |
| G7 average | 86.0 |
Source: IMF
Canada's total government net debt-to-GDP ratio stood at 26.8% in 2018, according to the IMF. This is the lowest level among G7 countries, which the IMF estimates will record an average net debt of 86.0% of GDP in that same year.
The following table provides a reconciliation between the Government of Canada's accumulated deficit-to-GDP ratio and Canada's total government net debt-to-GDP ratio. Importantly, Canada's total government net debt-to-GDP ratio includes the net debt of the federal, provincial, territorial and local governments, as well as the net assets held by the Canada Pension Plan and Quebec Pension Plan, while excluding liabilities for public sector pensions and other employee future benefits.
| (% of GDP) | |
|---|---|
| Accumulated deficit | 30.9 |
| Add: Non-financial assets | 3.9 |
| Net debt (Public Accounts basis) | 34.8 |
| Less: | |
| Liabilities for public sector pensions | (negative 7.6) |
| Liabilities for other future benefits | (negative 5.1) |
| National accounts/Public Accounts methodological differences and timing adjustmentsLink to footnote 16 | (negative 2.8) |
| Total federal net debt (National Accounts basis) | 19.3 |
| Add: Net debt of provincial/territorial and local governments | 20.6 |
| Less: Net assets of the CPP/QPP | (negative 13.1) |
| Total government net debt | 26.8 |
Non-financial assets
Non-financial assets include the net book value of the Government's tangible capital assets, which include land, buildings, works and infrastructure such as roads and bridges, machinery and equipment, ships, aircraft and other vehicles. Non-financial assets also include inventories and prepaid expenses and other non-financial assets.
Non-financial assets by category for 2019Link to footnote 3
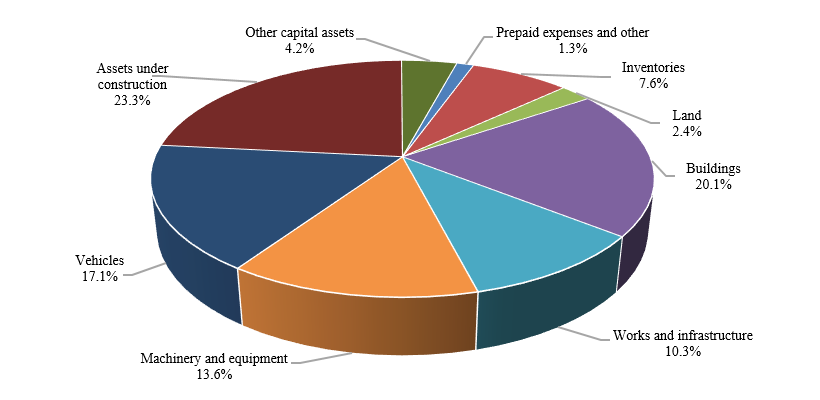
Image description
| Non-financial assets | Percentage |
|---|---|
| Prepaid expenses and other | 1.3% |
| Inventories | 7.6% |
| Land | 2.4% |
| Buildings | 20.1% |
| Works and infrastructure | 10.3% |
| Machinery and equipment | 13.6% |
| Vehicles | 17.1% |
| Assets under construction | 23.3% |
| Other capital assets | 4.2% |
At March 31, 2019, non-financial assets stood at $86.7 billion, up $5.0 billion from a year earlier. Of this growth, $5.1 billion relates to an increase in tangible capital assets, offset in part by a $0.1-billion decrease in inventories.
At March 31, 2019, 60.5% of the original cost of the Government's depreciable tangible capital assets had been amortized, a decrease of 0.2% from a year earlier. Depreciable tangible capital assets exclude land, and assets under construction, which are not yet available for use.
Tangible capital asset cost
(in billions of dollars)
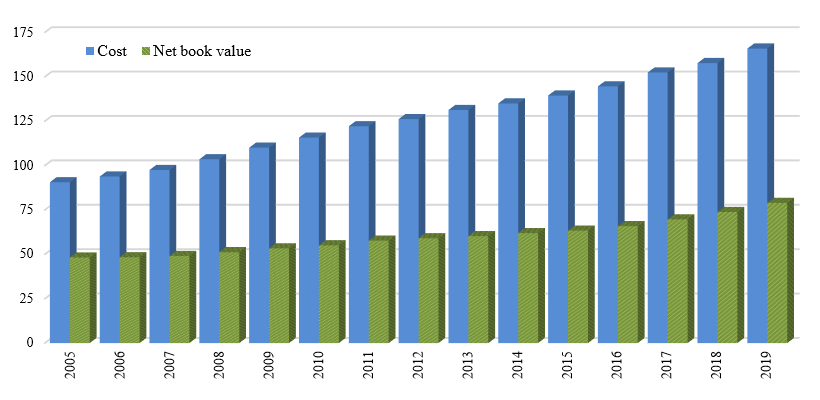
Image description
| Fiscal year | Cost | Net Book Value |
|---|---|---|
| 2005 | 90.6 | 48.2 |
| 2006 | 93.8 | 48.4 |
| 2007 | 97.5 | 49.0 |
| 2008 | 103.5 | 51.2 |
| 2009 | 110.1 | 53.3 |
| 2010 | 115.7 | 55.1 |
| 2011 | 122.1 | 57.7 |
| 2012 | 126.1 | 59.0 |
| 2013 | 131.3 | 60.2 |
| 2014 | 135.0 | 61.9 |
| 2015 | 139.4 | 63.3 |
| 2016 | 144.6 | 65.8 |
| 2017 | 152.4 | 69.7 |
| 2018 | 157.7 | 73.8 |
| 2019 | 165.9 | 78.9 |
The federal government has entered into a number of public-private partnerships (P3s) to design, build, finance and/or operate and maintain large infrastructure projects. Assets under construction totalled $20.2 billion at March 31, 2019, some of which are being built using P3s in which the private sector finances the assets during construction. The Government's liability for these long-term financing arrangements is included in obligations under public-private partnerships reported in Note 9 of the consolidated financial statements.
The Government has a robust policy framework for the management of assets and acquired services. The framework sets the direction for management of assets to ensure the conduct of activities provides value for money and demonstrates sound stewardship in program delivery.
Cash flow
The annual surplus or deficit is presented on an accrual basis of accounting, recognizing revenue in the period it is earned and expenses when incurred, regardless of when the associated cash is received or paid. In contrast, the Government's net cash flow measures the difference between cash coming in to the Government and cash going out.
In 2019, the Government had a total cash requirement of $9.1 billion before financing activities, compared to a total cash requirement of $7.8 billion before financing activities in 2018. Operating activities resulted in a net cash source of $4.1 billion in 2019, compared to a net cash requirement of $3.8 billion in 2018. Cash used by capital investment activities resulted in a net cash requirement of $9.5 billion in 2019, compared to a net cash requirement of $9.0 billion in 2018. Cash used by investing activities totalled $3.7 billion in 2019, compared to a net cash source of $5.0 billion in 2018.
| 2019 | 2018 | |
|---|---|---|
| Cash provided (used) by operating activities | 4,129 | (negative 3,777) |
| Cash used by capital investment activities | (negative 9,545) | (negative 8,954) |
| Cash (used) provided by investing activities | (negative 3,693) | 4,978 |
| Total cash used before financing activities | (negative 9,109) | (negative 7,753) |
| Cash provided by financing activities | 12,102 | 5,895 |
| Net increase (decrease) in cash and cash equivalents | 2,993 | (negative 1,858) |
| Cash and cash equivalents at beginning of year | 34,642 | 36,500 |
| Cash and cash equivalents at end of year | 37,635 | 34,642 |
Financing activities generated a $12.1-billion source of cash in 2019, resulting in an overall net increase in cash of $3.0 billion. The level of cash and cash equivalents stood at $37.6 billion at March 31, 2019.
Contractual obligations and contractual rights
The nature of the Government's operations results in large multi-year contracts and agreements that will generate expenses, liabilities and cash outflows in future years. Major contractual obligations of the Government relate to transfer payments, capital assets and purchases, operating leases, public-private partnership arrangements, and payments to international organizations. As of March 31, 2019, future payments under contractual obligations totalled $162.5 billion ($137.9 billion as of March 31, 2018).
Similarly, the activities of government can also involve the negotiation of contracts or agreements with third parties that result in the government having rights to both assets and revenues in the future. These arrangements typically relate to sales of goods and services, leases of property, and royalties and profit-sharing arrangements. The terms of these contracts and agreements may not always allow for a reasonable estimate of revenues in the future. For contracts and agreements that do allow for a reasonable estimate, total revenues to be received in the future under major contractual rights are estimated at $40.4 billion at March 31, 2019 ($54.6 billion as of March 31, 2018).
Further details regarding the Government's contractual obligations and contractual rights are provided in Section 11, Contractual obligations, contractual rights and contingent liabilities, of this volume.
Risks and uncertainties
The Government's financial results are subject to risks and uncertainties inherent in the nature of certain financial statement elements and government operations, including:
- outcomes from litigation, arbitration and negotiations with third parties, and the resolution of taxes under objection;
- identification and quantification of environmental liabilities;
- ageing tangible capital assets, including information technology infrastructure;
- costs associated with dismantling capital assets at the end of their useful lives;
- credit risk and foreign currency risk associated with the Government's financial assets, including loans, investments and advances and foreign exchange accounts;
- demand for public services and changes in other expenses, including pension expense, that reflect actual experience that is significantly different from forecast;
- delays and unexpected cost increases associated with large-scale investment projects; and,
- unforeseen situations such as natural catastrophes.
The Government's financial statements incorporate a number of significant estimates and assumptions related to risks and uncertainties that are used in valuing its assets, liabilities, revenues and expenses. One of the most significant areas of measurement uncertainty relates to public sector pensions and other employee future benefits, for which payments are made many years into the future and are dependent upon the evolution of factors such as wage increases, workforce composition, retirement rates and mortality rates. In developing its best estimates and assumptions, the Government takes into consideration historical experience, current facts and circumstances, and expected future developments. The Government's financial results are also subject to volatility as a result of year-over-year changes in the discount rates used to value its pension and benefit obligations. Changes in these discount rates result in unrealized gains and losses that are amortized to expenses.
Another significant area of measurement uncertainty relates to contingent liabilities. Contingent liabilities represent possible obligations that may result in future payments when one or more events occur or fail to occur. Examples of contingent liabilities include loan guarantees; insurance programs, including the Deposit Insurance Fund operated by the Canada Deposit Insurance Corporation and the Mortgage Insurance Fund operated by Canada Mortgage and Housing Corporation; callable share capital in international financial institutions; and claims and pending and threatened litigation. As of March 31, 2019, the Government's contingent liabilities totalled roughly $2 trillion. However, the vast majority of this amount represents situations where the probability of a future payment is assessed as unlikely or not determinable. The Government records a provision for contingent liabilities only in cases where the probability of future payment is considered likely. As of March 31, 2019, this provision totalled $26.4 billion.
The Government's assumptions related to risks and uncertainties used in determining its financial results are reassessed at each fiscal year-end and updated as necessary. Exposure to measurement uncertainty from the use of accounting and other estimates in recording certain transactions is discussed in the notes to the consolidated financial statements. Further details with respect to the measurement of the Government's contingent liabilities and environmental liabilities are included in Note 7 and Note 8, respectively, of the consolidated financial statements of the Government of Canada. Note 18 of the consolidated financial statements provides information on instruments and strategies used by the Government to manage financial risks associated with its financial assets and liabilities.
As noted in the Budget and related documents, and in the discussion on Economic Developments earlier in this section, the Government's revenues and expenses are highly sensitive to changes in economic conditions—particularly to changes in economic growth, inflation and interest rates.
To illustrate the impact of changes in economic conditions, the Department of Finance Canada publishes, on a regular basis, sensitivity impacts on the budgetary balance. These are “rules of thumb” as the actual impact will depend on many other factors as well. As published in the March 19, 2019 Budget, these show, for example, that:
- A one-year, 1-percentage-point increase/decrease in real GDP growth would raise/lower the budgetary balance by $4.9 billion in the first year, $4.9 billion in the second year, and $5.1 billion in the fifth year.
- A one-year, 1-percentage-point increase/decrease in GDP inflation would raise/lower the budgetary balance by $2.5 billion in the first year, $2.0 billion in the second year, and $1.1 billion in the fifth year.
- A sustained 100-basis-point decrease/increase in interest rates would raise/lower the budgetary balance by $0.6 billion in the first year, $1.4 billion in the second year, and $2.7 billion in the fifth year.
While these generalized rules of thumb provide good estimates of the sensitivity of the budgetary balance to small economic changes, it is important to note that some of the estimated relationships would change in response to large economic changes.
The Government manages risks to its fiscal projections due to changes in economic conditions by regularly surveying private sector economists on their views on the outlook for the Canadian economy and by monitoring its financial results on an ongoing basis to assess potential risks and guide its financial decisions.
The Government also prepares long-term economic and fiscal projections, which provide a broad analysis of its fiscal position, allowing the Government to respond more effectively to upcoming challenges and protect the long-term sustainability of public finances. The most recent version of these projections is available on the Department of Finance Canada's website.