
Financial statements discussion and analysis
Public Accounts of Canada 2018 Volume I—Top of the page Navigation
- Previous page: Section 1—Financial statements discussion and analysis
- Section 1—Table of contents: Section 1—Financial statements discussion and analysis
- Next page: Ten-year comparative financial information
Introduction
The Public Accounts of Canada is a major accountability report of the Government of Canada. This section, together with the other sections in this volume and in Volumes II and III of the Public Accounts of Canada, provides detailed supplementary information in respect of matters reported in the audited consolidated financial statements in Section 2 of this volume. Supplementary discussion and analysis of the Government's financial results can be found in the Annual Financial Report of the Government of Canada—Fiscal Year 2017-2018, available on the Department of Finance Canada's website.
The consolidated financial statements and financial statements discussion and analysis have been prepared under the joint direction of the Minister of Finance, the President of the Treasury Board and the Receiver General for Canada. Responsibility for the integrity and objectivity of the consolidated financial statements and financial statements discussion and analysis rests with the Government. A glossary of terms used in this financial statements discussion and analysis is provided at the end of this section.
2018 financial highlights
- The Government posted a budgetary deficit of $19.0 billion for the fiscal year ended March 31, 2018, unchanged from a budgetary deficit of $19.0 billion in 2017.
- Revenues increased by $20.1 billion, or 6.9%, from 2017. Program expenses increased by $19.5 billion, or 6.7%, reflecting increases in all major categories of expenses. Public debt charges were up $0.7 billion, or 3.1%.
- The accumulated deficit (the difference between total liabilities and total assets) stood at $671.3 billion at March 31, 2018. The accumulated deficit-to-GDP (gross domestic product) ratio was 31.3%, down from 32.0% in the previous year.
- As reported by the International Monetary Fund (IMF), Canada's total government net debt-to-GDP ratio, which includes the net debt of the federal, provincial/territorial and local governments, as well as the net assets held in the Canada Pension Plan and Quebec Pension Plan, stood at 27.8% in 2017. This is the lowest level among Group of Seven (G7) countries, which the IMF expects will record an average net debt of 87.5% of GDP for the same year.
Discussion and analysis
Economic developmentsLink to footnote 1
2017 Review
The global economy experienced a significant pick-up in the pace of its expansion in 2017, following two consecutive years of deceleration. The expansion was also highly synchronized across regions, with the share of countries in recession declining to close to a record low, and job creation steadily driving unemployment in the Organisation for Economic Co-operation and Development area toward a 40-year low.
This performance was helped by very accommodative monetary policy across most economies, with the policy interest rates of most major central banks remaining low and some central banks continuing to deploy extraordinary monetary policy measures to support economic growth, close output gaps and help revive inflation. Global trade and investment picked up in 2017, contributing to job creation, and fiscal policy remained supportive.
Against the stronger global growth backdrop, the Canadian economy was also remarkably strong in 2017, growing at a pace well above that of all other G7 countries, and at the strongest pace since 2011. Real GDP grew 3.0% after posting subdued growth rates in 2015 (1.0%) and 2016 (1.4%).
Canada's strong economic growth was driven by growth in consumer spending, strong regional housing markets as well as supportive monetary and fiscal policy. At the same time, stronger global economic conditions contributed to a modest rebound in business investment in Canada. Economic growth was fairly broad-based across sectors and regions. The economy added 427,300 jobs in 2017, leading the unemployment rate to fall to 5.8% in December 2017—matching its lowest recorded level in over four decades.
Canada's nominal GDP grew 5.4% in 2017, up from 2.0% in 2016. Higher nominal GDP growth in 2017 was due to both stronger real GDP growth and GDP inflation (the latter reflecting the waning impact of the negative oil price shock on Canada's terms of trade, i.e. the prices of Canadian exports relative to Canadian imports). Both real and nominal GDP growth in 2017 were in line with the Budget 2018 forecast.
Both short- and long-term interest rates in Canada increased in the second half of 2017 as a result of increases in the Bank of Canada's policy target rate. However, interest rates across the yield curve remained historically low in 2017.
In commodity markets, the price of crude oil (West Texas Intermediate) recovered to close to US$60 per barrel by the end of 2017 after reaching its lowest level since 2002 in early 2016 (below US$30 per barrel).
Consumer Price Index (CPI) inflation accelerated somewhat from 1.4% in 2016 to 1.6% in 2017, in line with the Budget 2018 forecast but still below the mid-point of the Bank of Canada's target band (2.0%).
2018 Outlook
Growth in the Canadian economy has gradually eased to a strong but more sustainable pace since mid-2017 and into the first quarter of 2018, which is likely to continue for the rest of the year. The Canadian economy is operating at, or very close to, its full capacity, with unemployment below its trend rate and the output gap effectively closed. However, going forward, there remain some important risks that could affect Canada's economic performance in 2018, specifically:
- Business investment and exports could both be negatively impacted by uncertainty regarding the outcome of the North American Free Trade Agreement (NAFTA) negotiations as well as looming global trade friction, precipitated by U.S. import tariffs.
- As some advanced economy central banks continue to normalize monetary policy, financial conditions could tighten faster than anticipated. Furthermore, as recent turmoil in some emerging markets suggests, tighter-than-expected financial conditions could create further turbulence in world financial markets, and potentially weigh on global economic growth.
- Domestically, high household debt remains a key vulnerability for Canadian consumption and housing activity in the case of a higher-than-expected negative shock to employment, income, house prices or interest rates.
- On the upside, there could be greater-than-expected positive spillovers from the recent economic growth in the U.S. which would result in higher growth in Canada.
These risks, if materialized, could change the anticipated path of economic activity in Canada, and therefore the level of nominal GDP, the broadest single measure of the tax base.
Further, for purposes of the financial statements discussion and analysis, it is important to note that the level of nominal GDP is only one of several factors that can affect the fiscal outcomes. In addition to the size of the overall tax base, fiscal results are affected by changes in the composition of nominal GDP, since different types of income and expenditures are taxed at different rates. Specifically, looking ahead:
- Escalating global trade tensions and uncertainty around NAFTA negotiations could undermine Canadian exports to the U.S. which in turn could erode profit margins for Canadian businesses and the corporate tax base.
- High household debt means that in the case of a negative shock to the economy, Canadian households will have less disposable income for consumption. Lower consumer spending results in lower receipts from sales taxes.
- Another important risk to the outlook is the path of interest rates. In general, if rates rise faster than expected this will have a negative impact on the cost of servicing the Government's debt obligations.
| 2016 | 2017 | 2018 | 2019 | |
|---|---|---|---|---|
| Real GDP growth | ||||
| Budget 2017 | 1.4 | 2.1 | 2.0 | 1.7 |
| Budget 2018 | 1.4 | 3.1 | 2.2 | 1.6 |
| Actual | 1.4 | 3.0 | – | – |
| Nominal GDP growth | ||||
| Budget 2017 | 1.9 | 4.3 | 4.0 | 3.5 |
| Budget 2018 | 2.0 | 5.3 | 4.1 | 3.5 |
| Actual | 2.0 | 5.4 | – | – |
| 3-month Treasury bill rate | ||||
| Budget 2017 | 0.5 | 0.6 | 0.9 | 1.4 |
| Budget 2018 | 0.5 | 0.7 | 1.4 | 2.0 |
| Actual | 0.5 | 0.7 | – | – |
| 10-year government bond rate | ||||
| Budget 2017 | 1.3 | 1.8 | 2.3 | 2.7 |
| Budget 2018 | 1.3 | 1.8 | 2.3 | 2.8 |
| Actual | 1.3 | 1.8 | – | – |
| Unemployment rate | ||||
| Budget 2017 | 7.0 | 6.9 | 6.7 | 6.7 |
| Budget 2018 | 7.0 | 6.4 | 6.0 | 6.0 |
| Actual | 7.0 | 6.3 | – | – |
| Consumer price index inflation | ||||
| Budget 2017 | 1.5 | 2.0 | 2.0 | 1.9 |
| Budget 2018 | 1.4 | 1.6 | 1.9 | 2.0 |
| Actual | 1.4 | 1.6 | – | – |
|
The dash means that the amount is 0 or is rounded to 0. Figures have been restated to reflect the historical revisions in the Canadian System of National Accounts as of the first quarter of 2018 released on May 31, 2018. | ||||
The budgetary balance
The budgetary balance is the difference between the Government's revenues and expenses over a fiscal year. It is one of the key measures of the Government's annual financial performance. The Government posted a budgetary deficit of $19.0 billion in 2018, unchanged from a deficit of $19.0 billion in 2017.
The following graph shows the Government's budgetary balance since 1994. To enhance the comparability of results over time and across jurisdictions, the budgetary balance and its components are presented as a percentage of GDP. In 2018, the budgetary deficit was 0.9% of GDP, virtually unchanged from 2017.
Annual surplus/deficitLink to footnote 2
(percentage of GDP)
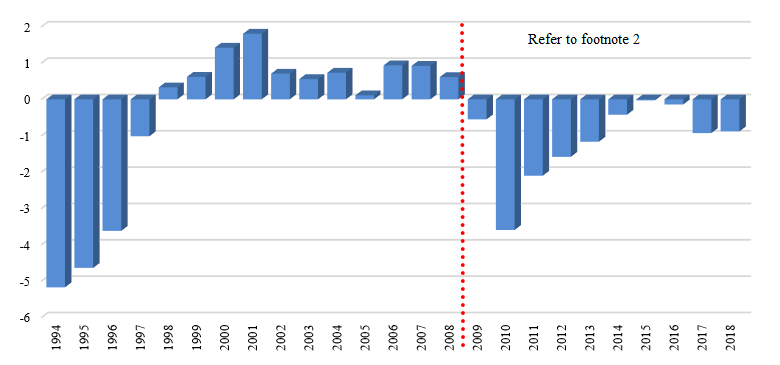
Image description
The graph "Annual surplus/deficit" illustrates the Government's budgetary balance since 1994. To enhance the comparability of results over time and across jurisdictions, the budgetary balance and its components are presented as a percentage of GDP. The GDP percentage for 1994 is −5.17; 1995 is −4.64; 1996 is −3.62; 1997 is −1.02; 1998 is 0.33; 1999 is 0.62; 2000 is 1.42; 2001 is 1.80; 2002 is 0.71; 2003 is 0.56; 2004 is 0.73; 2005 is 0.11; 2006 is 0.93; 2007 is 0.92; 2008 is 0.61; 2009 is −0.55; 2010 is −3.60; 2011 is −2.10; 2012 is −1.58; 2013 is −1.17; 2014 is −0.42; 2015 is −0.03; 2016 is −0.14; 2017 is −0.93; 2018 is −0.88.
Revenues were up $20.1 billion, or 6.9%, from the prior year, primarily reflecting increases in income tax revenues, Goods and Services Tax (GST) revenues and other revenues, partially offset by a decrease in Employment Insurance (EI) premium revenues.
Expenses were up $20.1 billion, or 6.4%, from the prior year. Program expenses increased by $19.5 billion, or 6.7%, reflecting increases in major transfers to persons, major transfers to other levels of government, other transfer payments and other expenses. Public debt charges increased by $0.7 billion, or 3.1%, from the prior year.
| 2018 | 2017 RestatedLink to footnote 3 |
|
|---|---|---|
| Consolidated Statement of Operations | ||
| Revenues | 313,606 | 293,495 |
| Expenses | ||
| Program expenses | 310,678 | 291,220 |
| Public debt charges | 21,889 | 21,232 |
| Total expenses | 332,567 | 312,452 |
| Annual deficit | (negative 18,961) | (negative 18,957) |
| Percentage of GDP | (negative 0.9)% | (negative 0.9)% |
| Consolidated Statement of Financial Position | ||
| Liabilities | ||
| Accounts payable and accrued liabilities | 154,824 | 132,519 |
| Interest-bearing debt | 1,002,578 | 984,337 |
| Total liabilities | 1,157,402 | 1,116,856 |
| Financial assets | 398,639 | 382,758 |
| Net debt | (negative 758,763) | (negative 734,098) |
| Non-financial assets | 87,509 | 82,558 |
| Accumulated deficit | (negative 671,254) | (negative 651,540) |
| Percentage of GDP | 31.3% | 32.0% |
Table notes 1 | ||
Revenues
Federal revenues can be broken down into four main categories: income tax revenues, other taxes and duties, EI premium revenues and other revenues. Within the income tax category, personal income tax revenues are the largest source of federal revenues, and accounted for 49.0% of total revenues in 2018 (unchanged from 2017). Corporate income tax revenues are the second largest source of revenues, and accounted for 15.2% of total revenues in 2018 (up from 14.4% in 2017). Non-resident income tax revenues are a comparatively smaller source of revenues, accounting for only 2.5% of total revenues in 2018 (up from 2.4% in 2017).
Other taxes and duties consist of revenues from the GST, energy taxes, customs import duties and other excise taxes and duties. The largest component of this category—GST revenues—accounted for 11.7% of all federal revenues in 2018 (unchanged from 2017). The share of the remaining components of other taxes and duties stood at 5.4% of total federal revenues (down from 5.8% in 2017).
The last two categories of federal revenues are EI premium revenues and other revenues. EI premium revenues accounted for 6.7% of total federal revenues in 2018 (down from 7.5% in 2017). Other revenues are made up of three broad components: net income from enterprise Crown corporations and other government business enterprises; other program revenues from returns on investments, proceeds from the sales of goods and services, and other miscellaneous revenues; and foreign exchange revenues. Other revenues accounted for 9.4% of total federal revenues in 2018 (up from 9.2% in 2017).
Composition of revenues for 2018Link to footnote 4
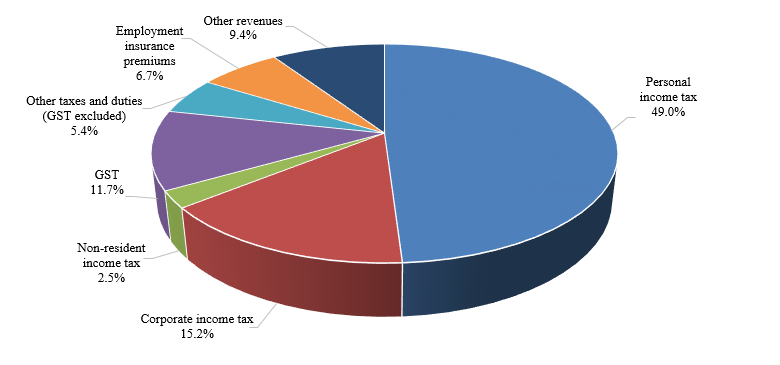
Image description
The graph "Composition of revenues for 2018" illustrates the sources of revenues for the current year and the relative percentage to the total. The percentage by component is: Personal income tax 49.0%; Corporate income tax 15.2%; Non-resident income tax 2.5%; GST 11.7%; Other taxes and duties (GST excluded) 5.4%; Employment insurance premiums 6.7%; and Other revenues 9.4%.
The revenue ratio—revenues as a percentage of GDP—compares the total of all federal revenues to the size of the economy. This ratio is influenced by changes in statutory tax rates and by economic developments. The ratio stood at 14.6% in 2018 (up from 14.4% in 2017). This increase primarily reflects growth in personal and corporate income tax revenues and gains from enterprise Crown corporations. Overall, the revenue ratio has declined since 2002, due primarily to tax reduction measures in personal and corporate income taxes and the GST.
Revenue ratio
(revenues as a percentage of GDP)
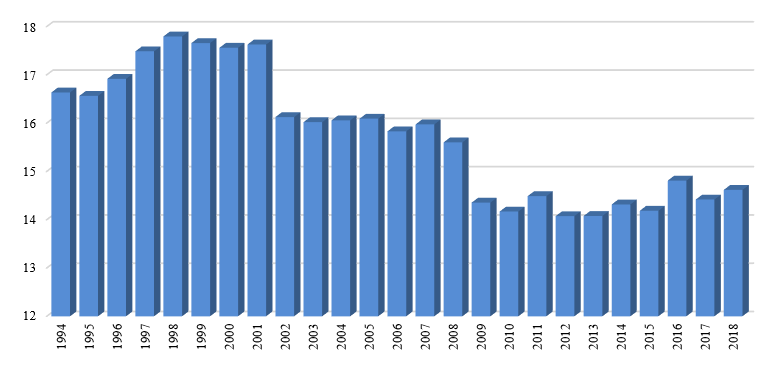
Image description
The Graph "Revenue ratio" illustrates the revenues as a percentage of GDP since 1994. The ratio for 1994 is 16.6; 1995 is 16.6; 1996 is 16.9; 1997 is 17.5; 1998 is 17.8; 1999 is 17.7; 2000 is 17.6; 2001 is 17.6; 2002 is 16.1; 2003 is 16.0; 2004 is 15.9; 2005 is 15.9; 2006 is 15.7; 2007 is 15.8; 2008 is 15.6; 2009 is 14.4; 2010 is 14.2; 2011 is 14.5; 2012 is 14.1; 2013 is 14.1; 2014 is 14.3; 2015 is 14.2; 2016 is 14.8; 2017 is 14.4; and 2018 is 14.6.
Revenues compared to 2017
Total revenues amounted to $313.6 billion in 2018, up $20.1 billion, or 6.9%, from 2017. The following table compares revenues for 2018 to 2017.
| 2018 | 2017 | Change | ||
|---|---|---|---|---|
| $ | % | |||
| Income tax revenues | ||||
| Personal | 153,619 | 143,680 | 9,939 | 6.9 |
| Corporate | 47,805 | 42,216 | 5,589 | 13.2 |
| Non-resident | 7,845 | 7,071 | 774 | 10.9 |
| Total | 209,269 | 192,967 | 16,302 | 8.4 |
| Other taxes and duties | ||||
| Goods and services tax | 36,751 | 34,368 | 2,383 | 6.9 |
| Energy taxes | 5,739 | 5,634 | 105 | 1.9 |
| Customs import duties | 5,416 | 5,478 | (negative 62) | (negative 1.1) |
| Other excise taxes and duties | 5,913 | 5,868 | 45 | 0.8 |
| Total | 53,819 | 51,348 | 2,471 | 4.8 |
| Employment insurance premiums | 21,140 | 22,125 | (negative 985) | (negative 4.5) |
| Other revenues | 29,378 | 27,055 | 2,323 | 8.6 |
| Total revenues | 313,606 | 293,495 | 20,111 | 6.9 |
Personal income tax revenues increased by $9.9 billion in 2018, or 6.9%, reflecting economic growth and the unwinding of the impact of tax planning that suppressed revenues in 2017, whereby high-income individuals recognized additional income in the 2015 tax year and lower income in the 2016 tax year when the 33% tax bracket came into effect.
Corporate income tax revenues increased by $5.6 billion, or 13.2%, reflecting strong corporate earnings and corresponding growth in corporate taxable income. Earnings were particularly strong in the financial, manufacturing and wholesale sectors.
Non-resident income tax revenues are paid by non-residents on Canadian-sourced income. These revenues increased by $0.8 billion, or 10.9%, reflecting growth in corporate earnings and dividends.
Other taxes and duties increased by $2.5 billion, or 4.8%. GST revenues grew by $2.4 billion in 2018, or 6.9%, reflecting growth in retail sales. Energy taxes grew by $0.1 billion, or 1.9%, due to slightly higher gasoline consumption in 2018. Customs import duties decreased by $0.1 billion, or 1.1%. Other excise taxes and duties were up $45 million, or 0.8%.
EI premium revenues decreased by $1.0 billion, or 4.5%. This was due to a significant reduction in the premium rate in 2017 and 2018 relative to prior years, offset in part by growth in employment and wages.
Other revenues increased by $2.3 billion, or 8.6%, in 2018, largely reflecting net income gains from enterprise Crown corporations, as well as positive one-time equity adjustments by several enterprise Crown corporations due to the implementation of new International Financial Reporting Standards.
Expenses
Federal expenses can be broken down into three main categories: transfer payments, which account for roughly two-thirds of all federal spending, other expenses and public debt charges.
Within these three main categories, the largest major component of expenses in 2018 was other expenses, which represents the operating expenses of the Government's 128 departments, agencies, and consolidated Crown corporations and other entities and accounted for 29.8% of total expenses.
The second largest component of expenses was major transfers to persons, which made up 28.2% of total expenses. This category consists of elderly, EI and children's benefits.
Major transfers to other levels of government—which include the Canada Health Transfer, the Canada Social Transfer, the new home care and mental health transfers announced in Budget 2017, fiscal arrangements (Equalization, transfers to the territories, a number of smaller transfer programs and the Quebec Abatement), and transfers to provinces on behalf of Canada's cities and communities—made up 21.2% of total expenses in 2018.
Other transfer payments, which include transfers to Aboriginal peoples, assistance to farmers, students and businesses, support for research and development, and international assistance, made up 14.2% of expenses.
Public debt charges made up the remaining 6.6% of total expenses in 2018.
There has been a large shift in the composition of total expenses since the mid 1990s. Public debt charges were the largest component for most of the 1990s, given the large and increasing stock of interest-bearing debt and high average effective interest rates on that stock of debt. Since reaching a high of nearly 30% of total expenses in 1997, the share of public debt charges in total expenses has fallen by more than two-thirds.
Composition of expenses for 2018
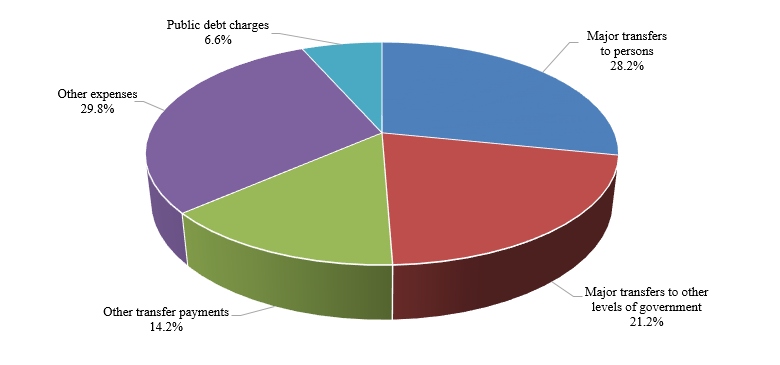
Image description
The graph "Composition of expenses for 2018" illustrates the composition of expenses for the current year and the relative percentage to the total. The percentage by component is: Major transfers to persons 28.2%; Major transfers to other levels of government 21.2%; Other transfer payments 14.2%; Other expenses 29.8%; and Public debt charges 6.6%.
The interest ratio (public debt charges as a percentage of revenues) shows the proportion of every dollar of revenue that is needed to pay interest and is therefore not available to pay for program initiatives. The lower the ratio, the more flexibility the Government has to address the key priorities of Canadians. The interest ratio has been decreasing in recent years, falling from a peak of 37.6% in 1991 to 7.2% in 2017. The ratio continued to fall in 2018, reaching 7.0%. This means that, in 2018, the Government spent approximately 7 cents of every revenue dollar on interest on public debt.
Interest ratioLink to footnote 2
(public debt charges as a percentage of revenues)
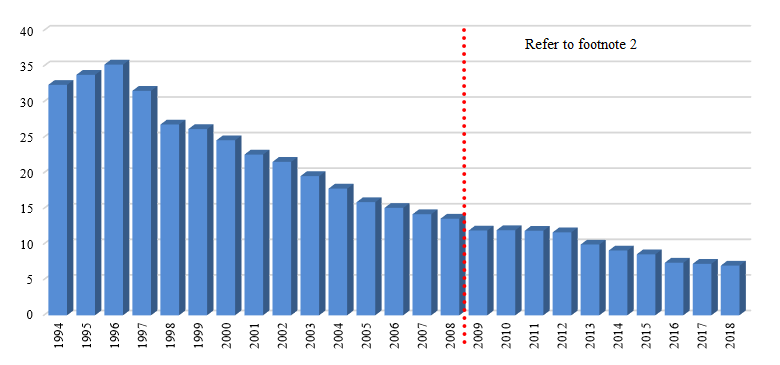
Image description
The graph "Interest ratio" illustrates the public debt charges as a percentage of revenues since 1994. The percentage for 1994 is 32.4; 1995 is 33.8; 1996 is 35.2; 1997 is 31.5; 1998 is 26.8; 1999 is 26.2; 2000 is 24.6; 2001 is 22.6; 2002 is 21.6; 2003 is 19.6; 2004 is 17.8; 2005 is 15.9; 2006 is 15.1; 2007 is 14.2; 2008 is 13.6; 2009 is 11.9; 2010 is 12.0; 2011 is 11.9; 2012 is 11.7; 2013 is 9.9; 2014 is 9.1; 2015 is 8.6; 2016 is 7.4; 2017 is 7.2; and 2018 is 7.0.
Expenses compared to 2017
Total expenses amounted to $332.6 billion in 2018, up $20.1 billion, or 6.4%, from 2017. The following table compares total expenses for 2018 to 2017.
| 2018 | 2017 RestatedLink to footnote 5 |
Change | ||
|---|---|---|---|---|
| $ | % | |||
| Transfer payments | ||||
| Major transfers to persons | ||||
| Elderly benefitsLink to footnote 6 | 50,644 | 48,162 | 2,482 | 5.2 |
| Employment insurance | 19,715 | 20,711 | (negative 996) | (negative 4.8) |
| Children's benefits | 23,432 | 22,065 | 1,367 | 6.2 |
| Total | 93,791 | 90,938 | 2,853 | 3.1 |
| Major transfers to other levels of government | ||||
| Federal transfer support for health and other social programs | 50,872 | 49,405 | 1,467 | 3.0 |
| Fiscal arrangements and other transfers | 19,647 | 19,247 | 400 | 2.1 |
| Total | 70,519 | 68,652 | 1,867 | 2.7 |
| Other transfer payments | 47,138 | 41,580 | 5,558 | 13.4 |
| Total transfer payments | 211,448 | 201,170 | 10,278 | 5.1 |
| Other expenses | 99,230 | 90,050 | 9,180 | 10.2 |
| Total program expenses | 310,678 | 291,220 | 19,458 | 6.7 |
| Public debt charges | 21,889 | 21,232 | 657 | 3.1 |
| Total expenses | 332,567 | 312,452 | 20,115 | 6.4 |
Table notes 2 | ||||
Major transfers to persons increased by $2.9 billion in 2018, reflecting increases in elderly and children's benefits. Elderly benefits increased by $2.5 billion, or 5.2%, reflecting growth in the elderly population and changes in consumer prices, to which benefits are fully indexed. Children's benefits increased by $1.4 billion, or 6.2%, reflecting the new Canada Child Benefit, which replaced the Canada Child Tax Benefit and the Universal Child Care Benefit as of July 2016. EI benefits decreased by $1.0 billion in 2018, reflecting stronger labour market conditions.
Major transfers to other levels of government increased by $1.9 billion in 2018, primarily reflecting legislated growth in the Canada Health Transfer, the Canada Social Transfer, Equalization transfers and transfers to the territories.
Other transfer payments increased by $5.6 billion, or 13.4%, in 2018, reflecting increases across a number of departments and agencies, including increased assistance for students, transfers under the new Early Learning and Child Care Program, increased transfers to First Nations and infrastructure transfers.
Other expenses of departments, agencies, and consolidated Crown corporations and other entities increased by $9.2 billion, or 10.2%. This increase is largely attributable to increased provisions for claims and litigation; higher defence spending; and one-time costs resulting from amendments to veteran future benefits in 2018, including the creation of the new Pain and Suffering Compensation benefit and the new Additional Pain and Suffering Compensation benefit, as well as the consolidation of some financial benefits into one new Income Replacement benefit.
Public debt charges increased by $0.7 billion, or 3.1%, reflecting a slightly higher average effective interest rate on the stock of interest-bearing debt in 2018.
Comparison of actual results to budget projections
Comparison to February 2018 budget plan
The $19.0-billion deficit recorded in 2018 represents a $0.9-billion improvement over the $19.9-billion deficit projected in the February 2018 Budget.
Revenues were $4.0 billion, or 1.3%, higher than expected, primarily reflecting higher-than-projected net income from enterprise Crown corporations (which reflected, in part, one-time equity adjustments due to the implementation of new International Financial Reporting Standards) and stronger-than-expected personal income tax revenues for tax year 2017.
Program expenses were $3.3 billion higher than expected, reflecting higher-than-expected increases in provisions for claims and litigation, which were only partially offset by lower-than-expected major transfers to persons.
Public debt charges were $0.2 billion lower than forecast, reflecting a lower-than-projected stock of interest-bearing debt.
| ProjectionLink to footnote 7 | Actual | Difference | |
|---|---|---|---|
| Revenues | 309,607 | 313,606 | 3,999 |
| Expenses | |||
| Program expenses | 307,427 | 310,678 | 3,251 |
| Public debt charges | 22,088 | 21,889 | (negative 199) |
| Total expenses | 329,515 | 332,567 | 3,052 |
| Annual deficit | (negative 19,908) | (negative 18,961) | 947 |
Table notes 3 | |||
Comparison to March 2017 budget plan
The 2018 budgetary deficit of $19.0 billion represents a $7.0-billion improvement relative to the $26.0-billion deficit projected for 2018 in the March 2017 Budget. This improvement is due to higher-than-forecast revenues, offset in part by higher-than-forecast expenses.
Revenues were $8.9 billion, or 2.9%, higher than forecast in the March 2017 Budget, primarily reflecting stronger-than-expected growth in income tax revenues and other excise taxes and duties due mainly to stronger-than-expected economic performance, particularly in corporate profits.
Total expenses were $1.8 billion higher than projected in the March 2017 Budget, with program expenses $2.4 billion higher than forecast and public debt charges $0.6 billion lower than forecast.
Major transfers to persons were $2.3 billion lower than forecast. This was largely as a result of lower-than-expected EI benefits reflecting a significant reduction in unemployment, as well as lower-than-expected elderly benefits due to weaker-than-expected inflation and fewer recipients than forecast.
Major transfers to other levels of government were in line with projections.
Direct program expenses, which are comprised of other transfer payments and other expenses, were $4.7 billion higher than projected in the March 2017 Budget. The variance from forecast was largely attributable to two significant accrual expenses: $4.3 billion in one-time past service costs associated with amendments to veteran future benefits announced in Budget 2018; and increased provisions for claims and litigation. Partially offsetting these items were lower-than-expected infrastructure transfers reflecting the updated spending profile of a number of infrastructure programs aimed at ensuring that the timing of federal infrastructure funding matches expected project spending by municipal, provincial and territorial governments.
Public debt charges in 2018 were $0.6 billion lower than forecast in the March 2017 Budget, largely reflecting a lower-than-projected stock of interest-bearing debt.
| BudgetLink to footnote 8 | Actual | Difference | |
|---|---|---|---|
| Revenues | |||
| Income tax revenues | 202,582 | 209,269 | 6,687 |
| Other taxes and duties | 51,729 | 53,819 | 2,090 |
| Employment insurance premiums | 21,248 | 21,140 | (negative 108) |
| Other revenues | 29,144 | 29,378 | 234 |
| Total revenues | 304,703 | 313,606 | 8,903 |
| Expenses | |||
| Program expenses | |||
| Major transfers to persons | 96,051 | 93,791 | (negative 2,260) |
| Major transfers to other levels of government | 70,547 | 70,519 | (negative 28) |
| Other transfer payments | 45,136 | 47,138 | 2,002 |
| Other expenses | 96,500 | 99,230 | 2,730 |
| Total program expenses | 308,234 | 310,678 | 2,444 |
| Public debt charges | 22,452 | 21,889 | (negative 563) |
| Total expenses | 330,686 | 332,567 | 1,881 |
| Annual deficit | (negative 25,983) | (negative 18,961) | 7,022 |
Table notes 4 | |||
Accumulated deficit
The accumulated deficit is the difference between the Government's total liabilities and total assets. The annual change in the accumulated deficit is equal to the annual budgetary balance plus other comprehensive income or loss. Other comprehensive income or loss represents certain unrealized gains and losses on financial instruments and certain actuarial gains and losses related to pensions and other employee future benefits reported by enterprise Crown corporations and other government business enterprises. Based on Canadian public sector accounting standards, other comprehensive income or loss is not included in the Government's annual budgetary balance, but is instead recorded directly to the Government's Consolidated Statement of Accumulated Deficit and Consolidated Statement of Change in Net Debt.
| 2018 | 2017 RestatedLink to footnote 9 |
Difference | |
|---|---|---|---|
| Accumulated deficit at beginning of year | (negative 651,540) | (negative 634,440) | (negative 17,100) |
| Annual deficit | (negative 18,961) | (negative 18,957) | (negative 4) |
| Other comprehensive (loss) income | (negative 753) | 1,857 | (negative 2,610) |
| Accumulated deficit at end of year | (negative 671,254) | (negative 651,540) | (negative 19,714) |
Table notes 5 | |||
The opening balance of the accumulated deficit in 2017 and 2018 has been restated to reflect a change in the discount rate methodology used in determining the present value of the Government's unfunded pension obligations. This change has been made following a review of all of the discount rates used by the Government in valuing its long-term assets and liabilities that was undertaken following observations made by the Auditor General in the 2016 and 2017 Public Accounts. The review was aimed at promoting consistency in the Government's present value techniques and considered industry practices, emerging developments in accounting standards and trends in the Canadian financial market. Under the Government's previous methodology, unfunded pension obligations were discounted using a 20-year weighted moving average of Government of Canada long-term bond rates projected over time. Under the new methodology, unfunded pension obligations are discounted using actual Government of Canada bond yields in effect at year-end. The new methodology represents a fundamental change in the Government's discounting approach, and is therefore considered a change in accounting policy, which has been applied on a retroactive basis. This restatement has resulted in an $18.5-billion increase in the opening balance of the accumulated deficit in 2017, a $1.2-billion increase in the deficit in 2017, and a $19.6-billion increase in the opening balance of the accumulated deficit in 2018. Further details regarding this accounting policy change can be found in Note 2 to the consolidated financial statements of the Government of Canada.
Ten-year impact of the change in discount rate methodology used to determine the Government's unfunded pension obligations
The table below provides an estimate of the impact in each of the past 10 years of the change in the accounting policy with respect to discount rates on the Government's budgetary balance and accumulated deficit. The total retroactive adjustment and the amount specifically allocated to 2017 is audited. The allocation of the residual difference to specific historical prior periods as well as impact on 2018 is unaudited.
| 2009 | 2010 | 2011 | 2012 | 2013 | 2014 | 2015 | 2016 | 2017 | 2018 | |
|---|---|---|---|---|---|---|---|---|---|---|
| Impact | ||||||||||
| Budgetary balance | (negative 3,361) | (negative 770) | (negative 1,581) | (negative 1,754) | (negative 2,878) | (negative 2,900) | (negative 2,461) | (negative 1,874) | (negative 1,187) | (negative 507) |
| Accumulated deficit | (negative 4,236) | (negative 5,006) | (negative 6,587) | (negative 8,341) | (negative 11,219) | (negative 14,119) | (negative 16,580) | (negative 18,454) | (negative 19,641) | (negative 20,148) |
| As a percentage of GDP | 0.3 | 0.3 | 0.4 | 0.5 | 0.6 | 0.7 | 0.8 | 0.9 | 1.0 | 0.9 |
| After change in accounting policy | ||||||||||
| Budgetary balance | (negative 9,116) | (negative 56,368) | (negative 34,953) | (negative 28,033) | (negative 21,293) | (negative 8,050) | (negative 550) | (negative 2,861) | (negative 18,957) | (negative 18,961) |
| Accumulated deficit | (negative 467,946) | (negative 524,103) | (negative 556,914) | (negative 591,917) | (negative 620,610) | (negative 626,000) | (negative 628,910) | (negative 634,440) | (negative 651,540) | (negative 671,254) |
| As a percentage of GDP | 28.3 | 33.4 | 33.5 | 33.4 | 34.0 | 33.0 | 31.6 | 31.8 | 32.0 | 31.3 |
The change in discount rate methodology used to determine the Government's unfunded pension obligations reduces the budgetary balance, on average by $1.7 billion annually and raises the accumulated deficit-to-GDP ratio by 0.3 percentage points of GDP in 2009, rising to 0.9 percentage points of GDP in 2018
The change in the Government's discounting approach has also impacted the valuation of other employee future benefits, environmental liabilities and asset retirement obligations, provisions for contingent liabilities, capital leases and loans receivable. The changes in discounting methodology for these other assets and liabilities are considered refinements of the previous methodologies used, and are therefore reflected as changes in estimates in 2018, with no restatements of the accumulated deficit.
The accumulated deficit increased by $19.7 billion in 2018, reflecting the $19.0-billion budgetary deficit, and a $0.8-billion other comprehensive loss. The $0.8-billion other comprehensive loss largely reflects $0.7 billion in net unrealized losses on available-for-sale financial instruments.
The accumulated deficit was 31.3% of GDP at March 31, 2018, compared to a post-World War II peak of 66.8% at March 31, 1996.
Graph - Accumulated deficitLink to footnote 2
(as a percentage of GDP)
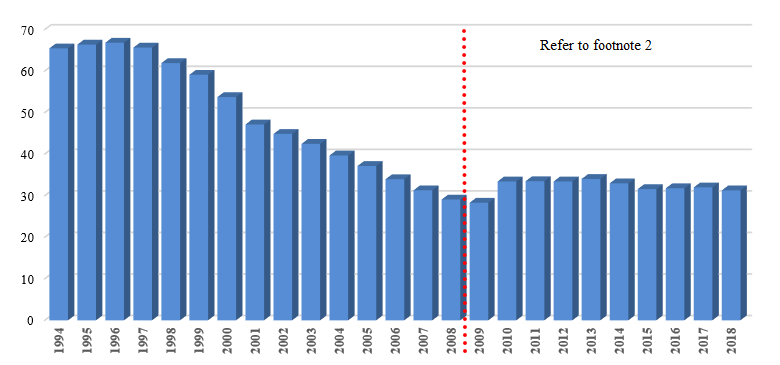
Image description
The graph "Accumulated deficit" illustrates the accumulated deficit since 1994. The percentage for 1994 is 65.5; 1995 is 66.4; 1996 is 66.8; 1997 is 65.7; 1998 is 61.9; 1999 is 59.1; 2000 is 53.7; 2001 is 47.2; 2002 is 44.9; 2003 is 42.5; 2004 is 39.7; 2005 is 37.2; 2006 is 34.0; 2007 is 31.3; 2008 is 29.1; 2009 is 28.3; 2010 is 33.4; 2011 is 33.5; 2012 is 33.4; 2013 is 34.0; 2014 is 33.0; 2015 is 33.6; 2016 is 31.8; 2017 is 32.0; and 2018 is 31.3.
Measures of Government debt
The consolidated financial statements of the Government of Canada are presented on an accrual basis of accounting. On this basis, there are several generally accepted definitions of government debt.
Total liabilities of the Government consist of unmatured debt, or debt issued on the credit markets, pension and other future benefit liabilities, other interest-bearing liabilities, and accounts payable and accrued liabilities.
Net debt represents the total liabilities of the Government less its financial assets. Financial assets include cash and cash equivalents, accounts receivable, foreign exchange accounts, loans, investments and advances, and public sector pension assets.
The accumulated deficit is equal to total liabilities less total assets—both financial and non-financial. Non-financial assets include tangible capital assets, such as land and buildings, inventories, and prepaid expenses and other. The accumulated deficit is the federal government's main measure of debt.
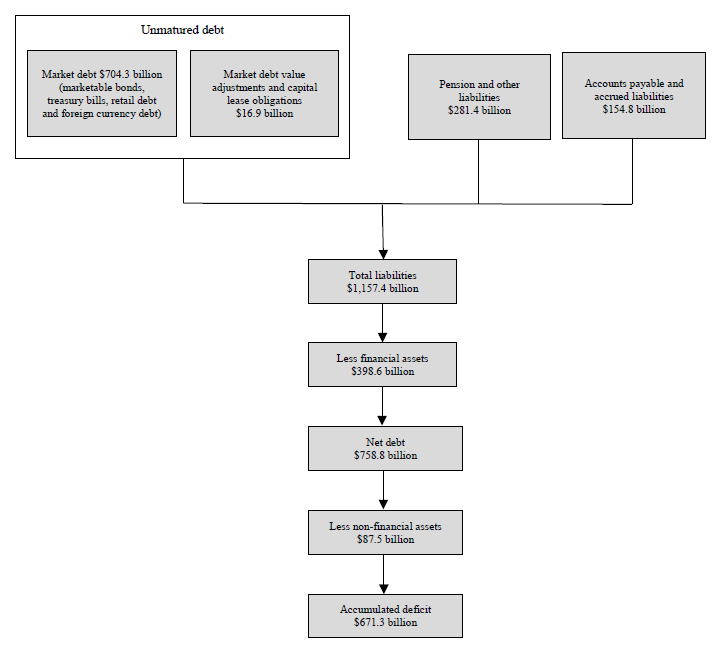
Image description
The organizational chart "Measures of Government debt" illustrates a total of 8 relationship boxes. The first 3 liability measurements align horizontally as follows: Unmatured debt which is made up of Market debt for $704.3 billion (marketable bonds, treasury bills, retail debt and foreign currency debt) and Market debt value adjustments and capital lease obligations for $16.9 billion; Pension and other liabilities for $281.4 billion; and Accounts payable and accrued liabilities for $154.8 billion. The remaining measurement relationship boxes are aligned vertically below as follows: Total liabilities for $1,157.4 billion; Less financial assets for $398.6 billion; Net debt for $758.8 billion; Less non-financial assets for $87.5 billion; and Accumulated deficit for $671.3 billion.
The Government's total liabilities include interest-bearing debt and accounts payable and accrued liabilities. Total assets include both financial and non-financial assets, the latter consisting primarily of tangible capital assets. The following sections provide more details on each of these components.
| 2018 | 2017 RestatedLink to footnote 10 |
Difference | |
|---|---|---|---|
| Liabilities | |||
| Accounts payable and accrued liabilities | 154,824 | 132,519 | 22,305 |
| Interest-bearing debt | |||
| Unmatured debt | 721,201 | 713,633 | 7,568 |
| Pensions and other future benefits | 275,707 | 265,015 | 10,692 |
| Other liabilities | 5,670 | 5,689 | (negative 19) |
| Total | 1,002,578 | 984,337 | 18,241 |
| Total liabilities | 1,157,402 | 1,116,856 | 40,546 |
| Financial assets | |||
| Cash and accounts receivable | 173,206 | 158,055 | 15,151 |
| Foreign exchange accounts | 96,938 | 98,797 | (negative 1,859) |
| Loans, investments and advances | 126,371 | 124,006 | 2,365 |
| Public sector pension assets | 2,124 | 1,900 | 224 |
| Total financial assets | 398,639 | 382,758 | 15,881 |
| Net debt | (negative 758,763) | (negative 734,098) | (negative 24,665) |
| Non-financial assets | 87,509 | 82,558 | 4,951 |
| Accumulated deficit | (negative 671,254) | (negative 651,540) | (negative 19,714) |
Table notes 6 | |||
Accounts payable and accrued liabilities
The following chart shows accounts payable and accrued liabilities by category for 2018.
Accounts payable and accrued liabilities by category for 2018
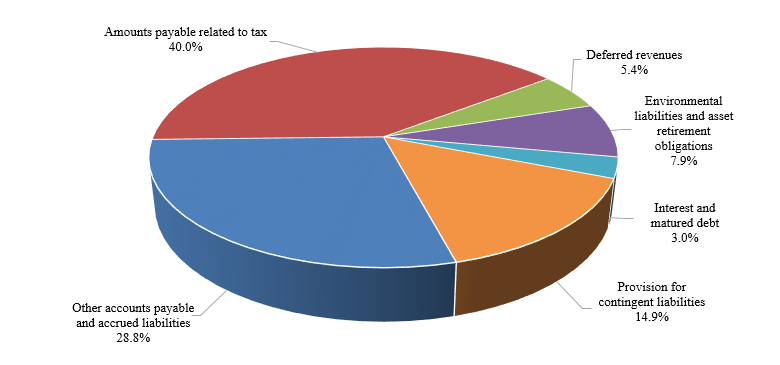
Image description
The Graph "Accounts payable and accrued liabilities by category for 2018" illustrates the composition of accounts payable and accrued liabilities for the current year and the relative percentage to the total. The percentage by component is: Amounts payable related to tax 40.0%; Deferred revenues 5.4%; Environmental liabilities and asset retirement obligations 7.9%; Interest and matured debt 3.0%; Provision for contingent liabilities 14.9%; and Other accounts payable and accrued liabilities 28.8%.
The Government's accounts payable and accrued liabilities consist of amounts payable related to tax based on assessments and estimates of refunds owing for tax assessments not completed by year-end; provisions for contingent liabilities, including guarantees provided by the Government and claims and pending and threatened litigation; environmental liabilities and asset retirement obligations, which include estimated costs related to the remediation of contaminated sites and the future restoration of certain tangible capital assets; deferred revenue; interest and matured debt, as well as accrued interest at year-end; and other accounts payable and accrued liabilities. Other accounts payable and accrued liabilities include items such as accrued salaries and benefits; amounts payable to provinces, territories and Aboriginal governments for taxes collected and administered on their behalf in accordance with tax collection agreements; and amounts owing at year-end pursuant to contractual arrangements or for work performed or goods received.
At March 31, 2018, accounts payable and accrued liabilities totalled $154.8 billion, up $22.3 billion from March 31, 2017. This increase reflects growth in amounts payable related to tax, provisions for contingent liabilities, other accounts payable and accrued liabilities, and interest and matured debt, partially offset by decreases in deferred revenue and environmental liabilities and asset retirement obligations.
Amounts payable related to tax increased by $6.8 billion in 2018, from $55.1 billion at March 31, 2017 to $61.9 billion at March 31, 2018.
Provisions for contingent liabilities increased by $6.5 billion, largely reflecting an increase in the Government's estimated losses related to various specific claims and pending and threatened litigation.
Other accounts payable and accrued liabilities increased by $10.1 billion in 2018. Within this component, liabilities under provincial, territorial and Aboriginal tax agreements increased by $5.0 billion due to timing differences in payments to provinces, territories and Aboriginal governments. Accounts payable increased by $5.3 billion. Within this category, accounts payable of consolidated Crown corporations and other entities increased by $1.5 billion, largely relating to growth in trade payables and progress work liabilities owed to foreign customers by the Canadian Commercial Corporation. Notes payable to international organizations and miscellaneous paylist deductions increased by $0.2 billion and $0.1 billion respectively. These increases were somewhat offset by a $0.5-billion decrease in accrued salaries and benefits, reflecting in part the payment of retroactive salaries under new collective agreements.
Liabilities for interest and matured debt increased by $27 million from the prior year.
Deferred revenue decreased by $0.9 billion in 2018, primarily reflecting the recognition of previously deferred revenue related to spectrum licence auctions.
Environmental liabilities and asset retirement obligations decreased by $0.3 billion in 2018, reflecting remediation activities undertaken during the year, as well as revisions to previously estimated provisions.
Graph - Accounts payable and accrued liabilities
(in billions of dollars)
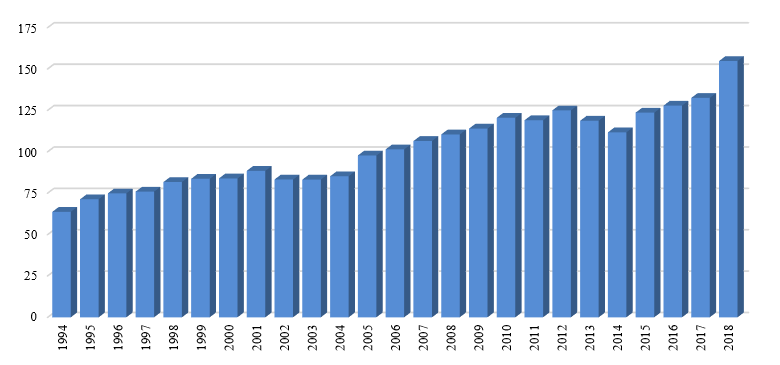
Image description
The Graph "Accounts payable and accrued liabilities" illustrates, in billions of dollars, the amount of accounts payable and accrued liabilities since 1994. The amount for 1994 is 63.7; 1995 is 71.3; 1996 is 74.9; 1997 is 75.9; 1998 is 81.7; 1999 is 83.7; 2000 is 83.9; 2001 is 88.5; 2002 is 83.2; 2003 is 83.2; 2004 is 85.2; 2005 is 97.7; 2006 is 101.4; 2007 is 106.5; 2008 is 110.5; 2009 is 114.0; 2010 is 120.5; 2011 is 119.1; 2012 is 125.0; 2013 is 118.7; 2014 is 111.7; 2015 is 123.6; 2016 is 127.9; 2017 is 132.5; and 2018 is 154.8.
Interest-bearing debt
Interest-bearing debt includes unmatured debt, or debt issued on the credit markets, pension and other future benefit liabilities, and other liabilities. Unmatured debt, which includes fixed-coupon marketable bonds, Real Return Bonds, treasury bills, retail debt (Canada Savings Bonds and Canada Premium Bonds), foreign-currency-denominated debt, and obligations related to capital leases, amounted to 71.9% of interest-bearing debt at March 31, 2018. Pension and other future benefit liabilities include obligations for: federal public sector pensions sponsored by the Government; disability and associated benefits available to war veterans, current and retired members of the Canadian Forces and the Royal Canadian Mounted Police, their survivors and dependants; health care and dental benefits available to retired employees and their dependants; accumulated sick leave entitlements; severance benefits; workers' compensation benefits; and other future benefits sponsored by some consolidated Crown corporations and other entities. Liabilities for public sector pensions made up 17.0% of interest-bearing debt and other employee and veteran future benefits accounted for an additional 10.5% of interest-bearing debt. The remaining 0.6% of interest-bearing debt represents other interest-bearing liabilities of the Government, which include deposit and trust accounts and other specified purpose accounts.
The share of total interest-bearing debt represented by unmatured debt had been declining since the mid-1990s, as the Government was able to retire some of this debt. This trend reversed in 2009 due to the increase in financial requirements stemming from the recession and stimulus measures introduced to mitigate its impacts, as well as an increase in borrowings under the consolidated borrowing framework introduced in 2008. Under the consolidated borrowing framework, the Government finances all of the borrowing needs of Canada Mortgage and Housing Corporation, the Business Development Bank of Canada and Farm Credit Canada through direct lending in order to reduce overall borrowing costs and improve the liquidity of the government securities market.
Graph - Interest-bearing debt by category for 2018Link to footnote 4
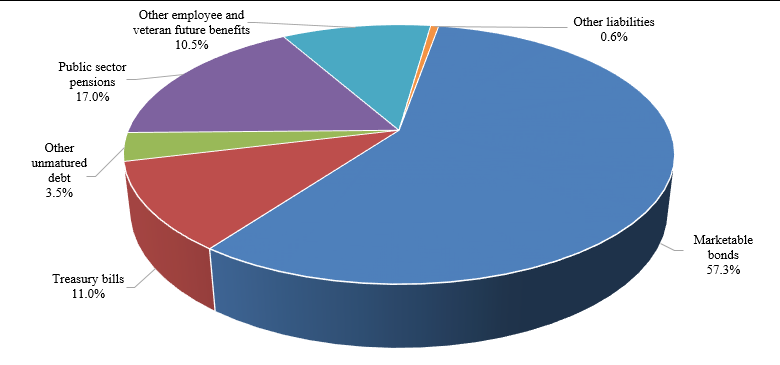
Image description
The graph "Interest-bearing debt by category for 2018" illustrates the composition of interest-bearing debt for the current year and the relative percentage to the total. The preceding text provides complementary information to the graph. The components are: Marketable bonds 57.3%; Treasury bills 11.0%; Other unmatured debt 3.5%; Public sector pensions 17.0%; Other employee and veteran future benefits 10.5%; and Other liabilities 0.6%.
At March 31, 2018, interest-bearing debt totalled $1,002.6 billion, up $18.2 billion from March 31, 2017. Within interest-bearing debt, unmatured debt increased by $7.6 billion, liabilities for pensions decreased by $0.5 billion, liabilities for other employee and veteran future benefits increased by $11.2 billion, and other liabilities decreased by $19 million.
The $7.6-billion increase in unmatured debt is largely attributable to a $9.2-billion increase in market debt, reflecting increased borrowings to meet the financial needs of the Government. This increase was partially offset by a $1.9-billion decrease in unamortized discounts and premiums on market debt.
The Bank of Canada and the Department of Finance Canada manage the Government's unmatured debt and associated risks. The fundamental objective of the debt management strategy is to provide stable, low-cost funding to meet the Government's financial obligations and liquidity needs. Details on the Government's debt management objectives and principles are tabled annually in Parliament through the Department of Finance Canada's Debt Management Strategy.
Foreign holdings of the Government's unmatured debt are estimated at $211.8 billion, representing approximately 29.4% of the Government's total unmatured debt.
Foreign holdings of Government of Canada unmatured debt
(as a percentage of unmatured debt)
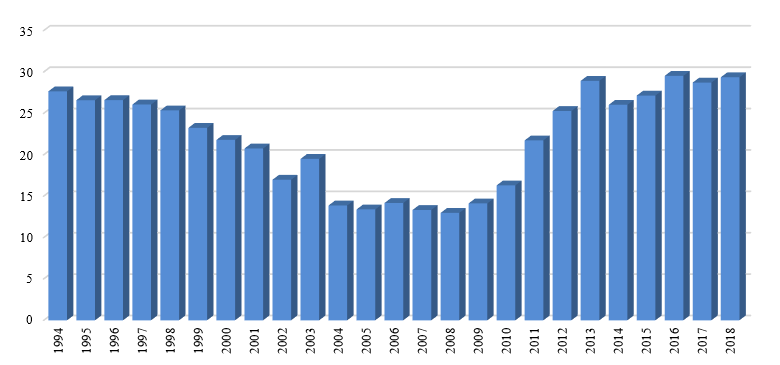
Image description
The graph "Foreign holdings of Government of Canada unmatured debt" illustrates foreign holdings of the Government's unmatured debt as a percentage of unmatured debt since 1994. The percentage for 1994 is 27.7; 1995 is 26.6; 1996 is 26.6; 1997 is 26.1; 1998 is 25.4; 1999 is 23.3; 2000 is 21.8; 2001 is 20.8; 2002 is 17.0; 2003 is 19.5; 2004 is 13.9; 2005 is 13.4; 2006 is 14.2; 2007 is 13.3; 2008 is 13.0; 2009 is 14.1; 2010 is 16.3; 2011 is 21.7; 2012 is 25.3; 2013 is 28.9; 2014 is 26.0; 2015 is 27.2; 2016 is 29.5; 2017 is 28.7; and 2018 is 29.4.
The Government's liabilities for pensions and other future benefits stood at $275.7 billion at March 31, 2018, up $10.7 billion from the prior year. These liabilities represent the estimated present value of pensions and other future benefits earned to March 31, 2018, by current and former employees, as measured annually on an actuarial basis, net of the value of assets set aside for funding purposes. Liabilities for pensions and other future benefits do not include benefits payable under the Canada Pension Plan (CPP). The CPP is not consolidated in the Government's financial statements because changes to the CPP require the agreement of two thirds of participating provinces and it is therefore not controlled by the Government. Further information regarding the CPP can be found in Section 6 of this volume.
The following table illustrates the change in the Government's liabilities for pensions and other future benefits, net of public sector pension assets, in 2018.
| Pensions | Other future benefits | Total | |
|---|---|---|---|
| Net future benefit liabilities at beginning of year—as restated | 169,547 | 93,568 | 263,115 |
| Add: | |||
| Benefits earned during the year | 7,175 | 5,968 | 13,143 |
| Interest on accrued benefit obligations, net of the expected return on investments | 4,021 | 3,116 | 7,137 |
| Net actuarial losses recognized during the year | 4,544 | 4,171 | 8,715 |
| Plan amendments, curtailments, settlements and valuation allowanceLink to footnote 11 | 88 | 4,095 | 4,183 |
| Subtotal | 15,828 | 17,350 | 33,178 |
| Deduct: | |||
| Benefits paid during the year | 11,745 | 6,045 | 17,790 |
| Transfers to the PSPIB and funds held in external trustsLink to footnote 12 | 4,119 | – | 4,119 |
| Transfers to other plans and administrative expenses | 721 | 80 | 801 |
| Subtotal | 16,585 | 6,125 | 22,710 |
| Net (decrease) increase | (negative 757) | 11,225 | 10,468 |
| Net future benefit liabilities at end of year | 168,790 | 104,793 | 273,583 |
| Presented on the Consolidated Statement of Financial Position as: | |||
| Public sector pension liabilities | 170,914 | ||
| Other employee and veteran future benefit liabilities | 104,793 | ||
| Total pension and other future benefit liabilities | 275,707 | ||
| Public sector pension assets | 2,124 | ||
| Net pensions and other future benefit liabilities | 273,583 | ||
Table notes 7The dash means that the amount is 0 or is rounded to 0.A blank cell means there is no available data. | |||
The increase in net liabilities for pensions and other future benefits in 2018 reflects the addition of $13.1 billion in future benefits earned by employees during the year as well as $7.1 billion in net interest charges on the liabilities. Accounting standards require that liabilities due a long time into the future be recorded at their estimated present, or discounted value. The Government revised its methodology for selecting discount rates used in the measurement of unfunded pension and benefit obligations in 2018. The revised methodology is based on the actual zero-coupon yield curve for Government of Canada bonds at fiscal year-end. The discount rate used to value the Government's obligations for funded pension benefits, which relate to post-March 2000 service under its three main pension plans—the public service, Canadian Forces—Regular Force, and Royal Canadian Mounted Police pension plans—as well as benefits under the Canadian Forces—Reserve Force pension plan, has not been changed. For these obligations, the discount rate continues to be based on the streamed expected rates of return on invested funds. Interest is recorded on the liabilities for pensions and other future benefits each year, net of the expected return on investments associated with funded benefits, to reflect the passage of time as the liabilities are one year closer to settlement. Net interest charges are recorded as part of public debt charges while benefits expense is recorded as part of other expenses on the Consolidated Statement of Operations and Accumulated Deficit.
The Government's liabilities for pensions and other future benefits increased by an additional $8.7 billion in 2018 due to the amortization of actuarial gains and losses. Actuarial gains and losses represent year-over-year increases or decreases in the estimated value of the Government's pension and other future benefit obligations and the value of related assets due to changes in actuarial assumptions or actual experience different from that previously estimated. Actuarial assumptions include future inflation, interest rates, return on investments, general wage increases, workforce composition, retirement rates and mortality rates. Under Canadian public sector accounting standards, which are set independently by the Public Sector Accounting Board, actuarial gains and losses are not recognized in the liabilities immediately but instead are amortized over the expected average remaining service life of plan contributors, which represents periods ranging from 4 to 23 years, according to the plan in question. As of March 31, 2018, the Government had net unamortized losses of $57.4 billion. These losses will be reflected over time in the liabilities and recorded as part of other expenses.
The Government also recorded a $4.2-billion increase in liabilities for pensions and other future benefits to reflect the net impact of plan amendments, curtailments, settlements and valuation allowance during the year. The largest of these amendments relates to amendments to veteran future benefits, including the new Pain and Suffering Compensation benefit that replaces the existing Disability Award; the new Additional Pain and Suffering Compensation benefit, to compensate veterans with a service related injury or illness causing severe and permanent impairment; and the consolidation of some benefits into a new Income Replacement benefit.
These increases were offset in part by reductions in the liabilities for benefits paid during the year ($17.8 billion) and for net transfers to the Public Sector Pension Investment Board and funds held in external trusts for investment ($4.1 billion).
Further details on the federal public sector pension plans and other employee and veteran future benefits are contained in Section 6 of this volume.
Interest-bearing debt stood at 46.7% of GDP in 2018, down from 48.4% in 2017. This ratio is down almost 28 percentage points from its high of 74.4% in 1996.
Graph - Interest-bearing debtLink to footnote 2
(as a percentage of GDP)
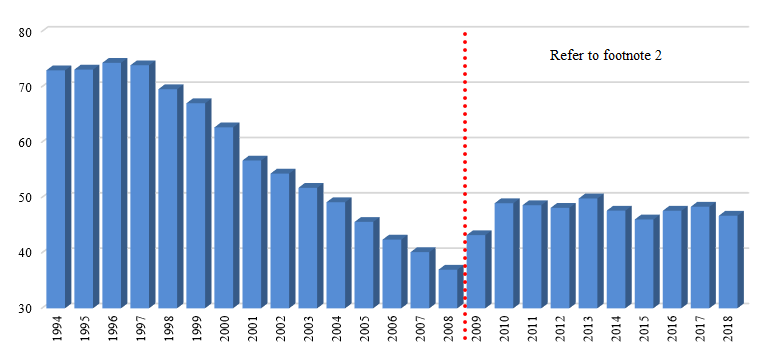
Image description
The graph "Interest-bearing debt" illustrates the percentage of interest-bearing debt on GDP since 1994. The percentage for 1994 is 73.0; 1995 is 73.1; 1996 is 74.4; 1997 is 73.9; 1998 is 69.6; 1999 is 67.1; 2000 is 62.7; 2001 is 56.7; 2002 is 54.3; 2003 is 51.8; 2004 is 49.2; 2005 is 45.6; 2006 is 42.4; 2007 is 40.2; 2008 is 37.0; 2009 is 43.2; 2010 is 49.0; 2011 is 48.6; 2012 is 48.2; 2013 is 49.8; 2014 is 47.6; 2015 is 46.1; 2016 is 47.6; 2017 is 48.4; and 2018 is 46.7.
The average effective interest rate on the Government's interest-bearing debt in 2018 was 2.2%, virtually unchanged from 2017. The average effective interest rate on unmatured debt in 2018 was 2.0%, while the average effective interest rate on pension and other liabilities was 2.7%, reflecting the longer average duration of these obligations.
Average effective interest rate on interest-bearing debtLink to footnote 2
(in percentage)
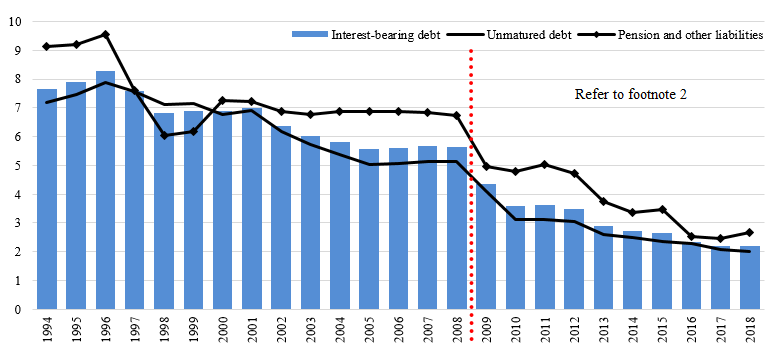
Image description
The graph "Average effective interest rate on interest-bearing debt" illustrates the percentage of the average effective interest rate on interest-bearing debt, unmatured debt, and pension and other liabilities since 1994. The percentage for interest-bearing debt for 1994 is 7.7; 1995 is 7.9; 1996 is 8.3; 1997 is 7.6; 1998 is 6.8; 1999 is 6.9; 2000 is 6.9; 2001 is 7.0; 2002 is 6.4; 2003 is 6.0; 2004 is 5.8; 2005 is 5.6; 2006 is 5.6; 2007 is 5.7; 2008 is 5.6; 2009 is 4.4; 2010 is 3.6; 2011 is 3.6; 2012 is 3.5; 2013 is 2.9; 2014 is 2.7; 2015 is 2.7; 2016 is 2.3; 2017 is 2.2; and 2018 is 2.2. For unmatured debt, the percentage for 1994 is 7.2; 1995 is 7.5; 1996 is 7.9; 1997 is 7.6; 1998 is 7.1; 1999 is 7.1; 2000 is 6.8; 2001 is 6.9; 2002 is 6.2; 2003 is 5.7; 2004 is 5.4; 2005 is 5.0; 2006 is 5.0; 2007 is 5.1; 2008 is 5.1; 2009 is 4.1; 2010 is 3.1; 2011 is 3.1; 2012 is 3.1; 2013 is 2.6; 2014 is 2.5; 2015 is 2.4; 2016 is 2.3; 2017 is 2.1; and 2018 is 2.0. For pension and other liabilities, the percentage for 1994 is 9.1; 1995 is 9.2; 1996 is 9.5; 1997 is 7.6; 1998 is 6.0; 1999 is 6.2; 2000 is 7.2; 2001 is 7.2; 2002 is 6.9; 2003 is 6.8; 2004 is 6.9; 2005 is 6.9; 2006 is 6.9; 2007 is 6.8; 2008 is 6.7; 2009 is 5.0; 2010 is 4.8; 2011 is 5.0; 2012 is 4.7; 2013 is 3.8; 2014 is 3.4; 2015 is 3.5; 2016 is 2.5; 2017 is 2.5; and 2018 is 2.7.
Financial assets
Financial assets include cash on deposit with the Bank of Canada, chartered banks and other financial institutions, accounts receivable, foreign exchange accounts, loans, investments and advances, and public sector pension assets of consolidated Crown corporations and other entities. The Government's foreign exchange accounts include foreign currency deposits, investments in marketable securities, and subscriptions and loans to the International Monetary Fund. Proceeds of the Government's foreign currency borrowings are held in the Exchange Fund Account to provide foreign currency liquidity and provide funds needed to promote orderly conditions for the Canadian dollar in foreign exchange markets. Further details on the management of international reserves are available in the annual Report on the Management of Canada's Official International Reserves. The Government's loans, investments and advances include its investments in and loans to enterprise Crown corporations, loans to national governments mainly for financial assistance and development of export trade, and loans under the Canada Student Loans Program.
Financial assets by category for 2018
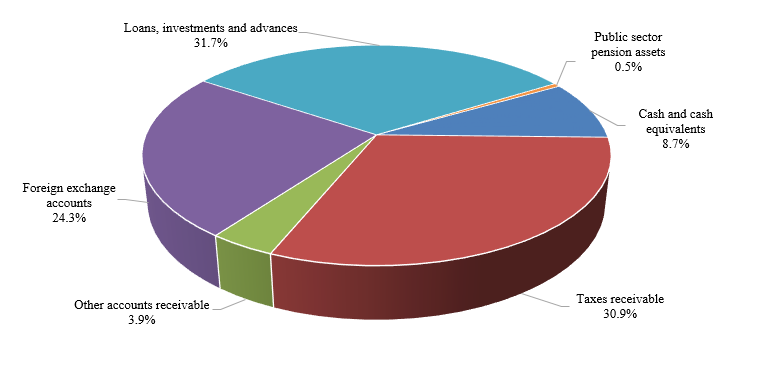
Image description
The Graph "Financial assets by category for 2018" illustrates the composition of financial assets for the current year and the relative percentage to the total. The percentage by component is: Cash and cash equivalents 8.7%; Taxes receivable 30.9%; Other accounts receivable 3.9%; Foreign exchange accounts 24.3%; Loans, investments and advances 31.7%; and Public sector pension assets 0.5%.
At March 31, 2018, financial assets amounted to $398.8 billion, up $16.0 billion from March 31, 2017. The increase in financial assets reflects increases in cash and accounts receivable, loans, investments and advances, and public sector pension assets, partially offset by a decrease in foreign exchange accounts.
At March 31, 2018, cash and accounts receivable totalled $173.2 billion, up $15.2 billion from March 31, 2017. Within this component, cash and cash equivalents decreased by $1.9 billion. The balance of cash and cash equivalents includes $20 billion which has been designated as a deposit held with respect to prudential liquidity management. The Government's overall liquidity is maintained at a level sufficient to cover at least one month of net projected cash flows, including coupon payments and debt refinancing needs. Taxes receivable increased by $12.5 billion during 2018 to $123.0 billion, reflecting growth in tax revenues. Other accounts receivable increased by $4.5 billion due in large part to a $1.8-billion increase in cash collateral under International Swaps and Derivatives Association agreements in respect of outstanding cross-currency swap agreements; a $1.5-billion dividend receivable from Canada Mortgage and Housing Corporation at year-end; and a $0.5-billion increase in trade receivables of the Canadian Commercial Corporation.
Loans, investments and advances in enterprise Crown corporations and other government business enterprises increased by $1.3 billion in 2018. Net loans and advances increased by $3.1 billion, due mainly to an increase in loans to Crown corporations under the consolidated borrowing framework. Investments in enterprise Crown corporations and other government business enterprises decreased by $1.8 billion, as the $7.0 billion in net profits recorded by these entities during 2018 were more than offset by $0.8 billion in other comprehensive losses and $8.0 billion in dividends paid to the Government.
Other loans, investments and advances increased by $1.0 billion, from $24.6 billion to $25.6 billion, largely reflecting growth in the Canada Student Loans portfolio, attributable in part to measures introduced in Budget 2016, which increased the number of students eligible to participate in the program, as well as the number of students eligible to receive the maximum loan amount.
Public sector pension assets increased by $0.2 billion.
Foreign exchange accounts decreased by $1.9 billion in 2018, totalling $96.9 billion at March 31, 2018. The decrease in foreign exchange accounts is in large part due to a decline in foreign exchange reserves held in the Exchange Fund Account, reflecting $4.2 billion in net lower advances to the Account during the year that were only partially offset by the Account's $1.7-billion net income and $1.3 billion in foreign exchange gains.
Since the accumulated deficit reached its post-World War II peak of 66.8% of GDP at March 31, 1996, financial assets have increased by $306.0 billion, mainly reflecting higher levels of cash and cash equivalents and accounts receivable (up $120.6 billion), an increase in the foreign exchange accounts (up $77.9 billion), and an increase in loans, investments and advances (up $105.3 billion). The increase in cash and cash equivalents and accounts receivable is largely attributable to growth in taxes receivable, broadly in line with the growth in the applicable tax bases. The increase in the foreign exchange accounts reflects a decision by the Government in the late 1990s and more recently in the 2012 Debt Management Strategy to increase liquidity in these accounts. The increase in loans, investments and advances is attributable to several factors including the accumulation of net profits from enterprise Crown corporations, the Government taking over the financing of the Canada Student Loans Program from the chartered banks in 2000, and the issuance of direct loans to Crown corporations under the Government's consolidated borrowing framework implemented in 2008.
Graph - Financial assets
(in billions of dollars)
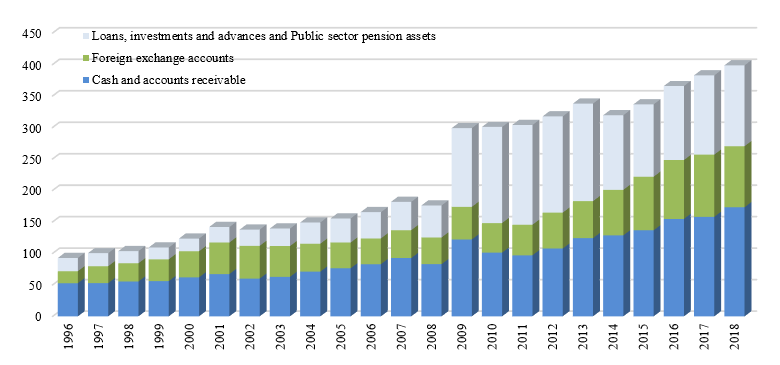
Image description
The Graph "Financial assets" illustrates, in billions of dollars, the Loans, investments and advances and Public sector pension assets, Foreign exchange accounts, Cash and accounts receivable since 1996. Respectively, the amounts for 1996 are 21.0, 19.1, 52.6; 1997 are 20.8, 26.8, 52.8; 1998 are 19.4, 29.0, 55.3; 1999 are 18.7, 34.7, 55.9; 2000 are 20.1, 41.5, 61.9; 2001 are 24.5, 50.3, 67.1; 2002 are 25.7, 52.0, 59.9; 2003 are 27.8, 49.0, 62.7; 2004 are 33.8, 44.3, 71.0; 2005 are 38.2, 40.9, 76.3; 2006 are 41.9, 40.8, 82.8; 2007 are 45.1, 44.2, 92.6; 2008 are 50.9, 42.3, 82.9; 2009 are 125.1, 51.7, 122.1; 2010 are 152.7,47.0, 101.2; 2011 are 158.5, 48.5, 96.9; 2012 are 152.9, 57.0, 107.7; 2013 are 154.9, 58.8, 124.2; 2014 are 118.6, 72.3, 128.6; 2015 are 114.9, 85.0, 136.7; 2016 are 117.6, 93.5, 154.7; 2017 are 125.9, 98.8, 158.1; and 2018 are 128.5, 96.9, 173.2.
Net debt
The Government's net debt—its total liabilities less financial assets—stood at $758.8 billion at March 31, 2018. Net debt was 35.4% of GDP, down 0.7 percentage points from a year earlier, and 36.8 percentage points below its peak of 72.2% at March 31, 1996.
This ratio measures debt relative to the ability of the country's taxpayers to finance it. Total liabilities are reduced only by financial assets as non-financial assets cannot normally be converted to cash to pay off the debt without disrupting government operations.
Graph - Net debtLink to footnote 2
(as percentage of GDP)
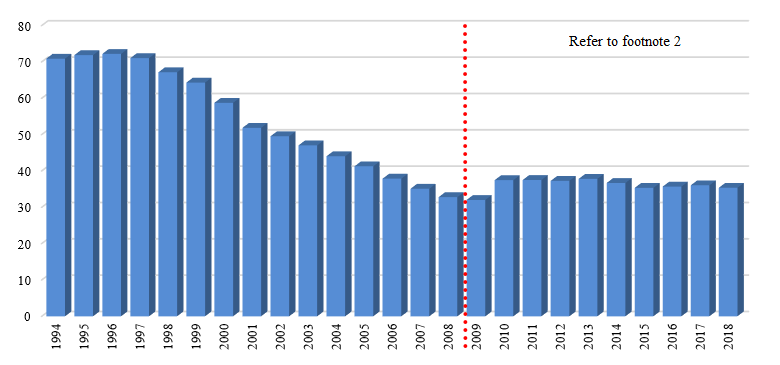
Image description
The Graph "Net debt" illustrates the net debt as a percentage of GDP since 1994. The percentage for 1994 is 70.9; 1995 is 71.9; 1996 is 72.2; 1997 is 71.1; 1998 is 67.2; 1999 is 64.3; 2000 is 58.7; 2001 is 51.9; 2002 is 49.6; 2003 is 47.0; 2004 is 44.1; 2005 is 41.3; 2006 is 37.9; 2007 is 35.1; 2008 is 32.8; 2009 is 32.0; 2010 is 37.5; 2011 is 37.5; 2012 is 37.3; 2013 is 37.8; 2014 is 36.7; 2015 is 35.4; 2016 is 35.7; 2017 is 36.1; and 2018 is 35.4.
International comparisons of net debt
Jurisdictional responsibility (between central, state and local levels of government) for government programs differs among countries. As a result, international comparisons of government fiscal positions are undertaken on a total government, National Accounts, basis. For Canada, total government net debt includes that of the federal, provincial/territorial and local governments, as well as the net assets held in the Canada Pension Plan and Quebec Pension Plan.
Canada has the lowest total government net debt burden among G7 countries
G7 total government net debt, 2017Link to footnote 13
(as a percentage of GDP)
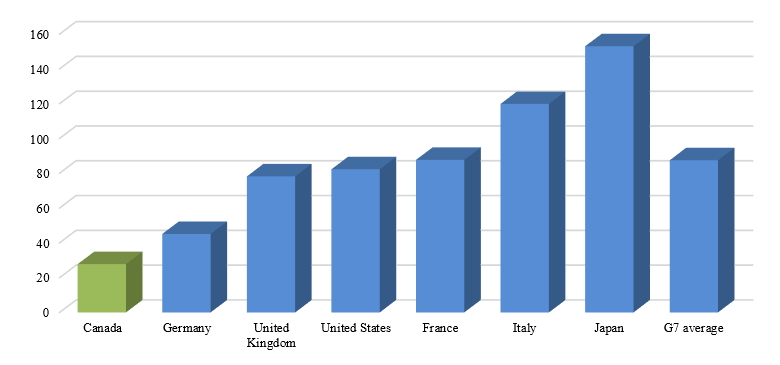
Image description
The Graph "G7 total Government net debt for 2017" illustrates the G7 net debt-to-GDP ratio as a percentage of GDP by country. The percentage by component is: Canada is 27.8; Germany is 45.1; United Kingdom is 78.2; United States is 82.3; France is 87.7; Italy is 119.9; and Japan is 153.0. The G7 average is 87.5.
Source: International Monetary Fund, Fiscal Monitor (April 2018).
Canada's total government net debt-to-GDP ratio stood at 27.8% in 2017, according to the IMF. This is the lowest level among G7 countries, which the IMF estimates will record an average net debt of 87.5% of GDP in that same year.
The following table provides a reconciliation between the Government of Canada's accumulated deficit-to-GDP ratio and Canada's total government net debt-to-GDP ratio. Importantly, Canada's total government net debt-to-GDP ratio includes the net debt of the federal, provincial, territorial and local governments, as well as the net assets held by the Canada Pension Plan and Quebec Pension Plan while excluding liabilities for public sector pensions and other employee future benefits.
| (% of GDP) | |
|---|---|
| Accumulated deficit | 31.3 |
| Add: Non-financial assets | 4.1 |
| Net debt (Public Accounts basis) | 35.4 |
| Less: | |
| Liabilities for public sector pensions | (negative 8.0) |
| Liabilities for other future benefits | (negative 4.9) |
| National accounts/Public Accounts methodological differences and timing adjustmentsLink to footnote 14 | (negative 0.8) |
| Total federal net debt (National Accounts basis) | 21.7 |
| Add: Net debt of provincial/territorial and local governments | 19.4 |
| Less: Net assets of the CPP/QPP | (negative 13.3) |
| Total government net debt | 27.8 |
Table notes 8Source: Statistics Canada and Public Accounts of Canada. | |
Non-financial assets
Non-financial assets include the net book value of the Government's tangible capital assets, which include land, buildings, works and infrastructure such as roads and bridges, machinery and equipment, ships, aircraft and other vehicles. Non-financial assets also include inventories and prepaid expenses and other non-financial assets.
Non-financial assets by category for 2018
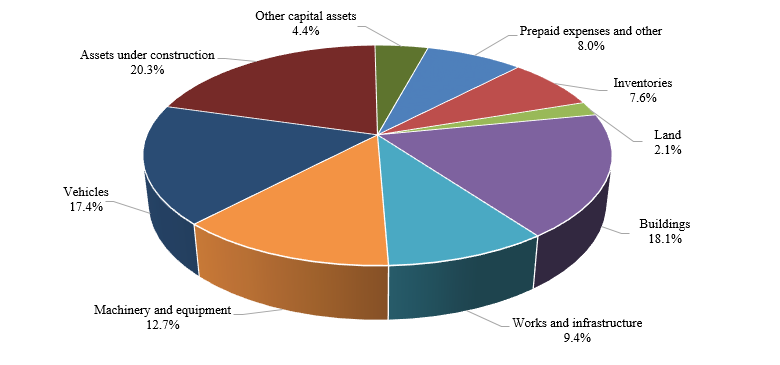
Image description
The Graph "Non-financial assets by category for 2018" illustrates the composition of non-financial assets for the current year and the relative percentage to the total. The percentage by component is: Prepaid expenses and other 8.0%; Inventories 7.6%; Land 2.1%; Buildings 18.1%; Works and infrastructure 9.4%; Machinery and equipment 12.7%; Vehicles 17.4%; Assets under construction 20.3%; and Other capital assets 4.4%.
At March 31, 2018, non-financial assets stood at $87.5 billion, up $5.0 billion from a year earlier. Of this growth, $4.2 billion relates to an increase in tangible capital assets while $1.0 billion relates to an increase in prepaid expenses. The growth in tangible capital assets in large part reflects a $3.1-billion increase in assets under construction. The increase in prepaid expenses is due mainly to an increase in progress work by Canadian exporters on contracts not yet fulfilled by the Canadian Commercial Corporation.
At March 31, 2018, 60.7% of the original cost of the Government's depreciable tangible capital assets had been amortized, a decrease of 0.1% from a year earlier. Depreciable tangible capital assets exclude land, and assets under construction, which are not yet available for use.
Tangible capital asset cost
(in billions of dollars)
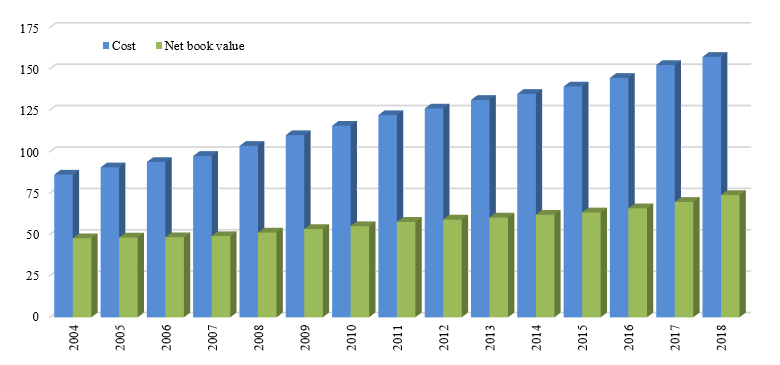
Image description
The Graph "Tangible capital asset cost" illustrates, in billions of dollars, the tangible capital asset cost and net book value since 2004. The amount for 2004 is Cost 86.2 and Net book value 47.7; 2005 is Cost 90.6 and Net book value 48.2; 2006 is Cost 93.8 and Net book value 48.4; 2007 is Cost 97.5 and Net book value 49.0; 2008 is Cost 103.5 and Net book value 51.2; 2009 is Cost 110.1 and Net book value 53.3; 2010 is Cost 115.7 and Net book value 55.1; 2011 is Cost 122.1 and Net book value 57.7; 2012 is Cost 126.1 and Net book value 59.0; 2013 is Cost 131.3 and Net book value 60.2; 2014 is Cost 135.0 and Net book value 61.9; 2015 is Cost 139.4 and Net book value 63.3; 2016 is Cost 144.6 and Net book value 65.8; 2017 is Cost 152.4 and Net book value 69.7; and 2018 is Cost 157.3 and Net book value 73.8.
The federal government has entered into a number of public-private partnerships (P3s) to design, build, finance and/or operate and maintain large infrastructure projects.
Assets under construction totalled $17.8 billion at March 31, 2018, some of which are being built using P3s in which the private sector finances the assets during construction. The Government's liability for these long-term financing arrangements is included in obligations under public-private partnerships reported in Note 8 of the consolidated financial statements.
The Government has a robust policy framework for the management of assets and acquired services. The framework sets the direction for management of assets to ensure the conduct of activities provides value for money and demonstrates sound stewardship in program delivery.
Cash flow
The annual surplus or deficit is presented on an accrual basis of accounting, recognizing revenue in the period it is earned and expenses when incurred, regardless of when the associated cash is received or paid. In contrast, the Government's net cash flow measures the difference between cash coming in to the Government and cash going out.
In 2018, the Government had a total cash requirement of $7.8 billion before financing activities, compared to a total cash requirement of $27.1 billion before financing activities in 2017. Operating activities resulted in a net cash requirement of $3.8 billion in 2018, compared to a net cash requirement of $17.8 billion in 2017. Cash used by capital investment activities resulted in net cash requirement of $9.0 billion in 2018, compared to a net cash requirement of $7.4 billion in 2017. Cash provided by investing activities was $5.0 billion in 2018, compared to a net cash requirement of $1.9 billion in 2017.
| 2018 | 2017 | |
|---|---|---|
| Cash used by operating activities | (negative 3,777) | (negative 17,809) |
| Cash used by capital investment activities | (negative 8,954) | (negative 7,413) |
| Cash provided (used) by investing activities | 4,978 | (negative 1,909) |
| Total cash used before financing activities | (negative 7,753) | (negative 27,131) |
| Cash provided by financing activities | 5,895 | 25,061 |
| Net decrease in cash and cash equivalents | (negative 1,858) | (negative 2,070) |
| Cash and cash equivalents at beginning of year | 36,500 | 38,570 |
| Cash and cash equivalents at end of year | 34,642 | 36,500 |
Financing activities generated a $5.9-billion source of cash in 2018, resulting in an overall net decrease in cash of $1.9 billion. The level of cash and cash equivalents stood at $34.6 billion at March 31, 2018.
Contractual obligations and contractual rights
The nature of the Government's operations results in large multi-year contracts and agreements that will generate expenses, liabilities and cash outflows in future years. Major contractual obligations of the Government relate to transfer payments, capital assets and purchases, operating leases, public-private partnership arrangements, and payments to international organizations. As of March 31, 2018, future payments under contractual obligations totalled $137.9 billion ($121.7 billion as of March 31, 2017).
Similarly, the activities of government can also involve the negotiation of contracts or agreements with third parties that result in the government having rights to both assets and revenues in the future. These arrangements typically relate to sales of goods and services, leases of property, and royalties and profit-sharing arrangements. The terms of these contracts and agreements may not always allow for a reasonable estimate of revenues in the future. For contracts and agreements that do allow for a reasonable estimate, total revenues to be received in the future under major contractual rights are estimated at $54.6 billion at March 31, 2018.
Further details regarding the Government's contractual obligations and contractual rights are provided in Section 11, Contractual obligations, contractual rights and contingent liabilities, of this volume.
Risks and uncertainties
The Government's financial results are subject to risks and uncertainties inherent in the nature of certain financial statement elements and government operations, including:
- outcomes from litigation, arbitration and negotiations with third parties, and the resolution of taxes under objection;
- identification and quantification of environmental liabilities;
- ageing tangible capital assets, including information technology infrastructure;
- costs associated with dismantling capital assets at the end of their useful lives;
- credit risk and foreign currency risk associated with the Government's financial assets, including loans, investments and advances and foreign exchange accounts;
- demand for public services and changes in other expenses, including pension expense, that reflect actual experience that is significantly different from forecast;
- delays and unexpected cost increases associated with large-scale investment projects; and,
- unforeseen situations such as natural catastrophes.
The Government's financial statements incorporate a number of significant estimates and assumptions related to risks and uncertainties that are used in valuing its assets, liabilities, revenues and expenses. One of the most significant areas of measurement uncertainty relates to public sector pensions and other employee future benefits, for which payments are made many years into the future and are dependent upon the evolution of factors such as wage increases, workforce composition, retirement rates and mortality rates. In developing its best estimates and assumptions, the Government takes into consideration historical experience, current facts and circumstances, and expected future developments. The Government's financial results are also subject to volatility as a result of year-over-year changes in the discount rates used to value its pension and benefit obligations. Changes in these discount rates result in unrealized gains and losses that are amortized to expenses. The Government's new discount rate approach discussed in the previous section on Interest-Bearing Debt is expected to result in increased volatility going forward, in particular in relation to the Government's main unfunded pension obligations, where the discount rate has changed from a 20-year moving weighted average of long-term bond rates to a methodology based on interest rates in effect at year-end.
Another significant area of measurement uncertainty relates to contingent liabilities. Contingent liabilities represent possible obligations that may result in future payments when one or more events occur or fail to occur. Examples of contingent liabilities include loan guarantees; insurance programs, including the Deposit Insurance Fund operated by the Canada Deposit Insurance Corporation and the Mortgage Insurance Fund operated by Canada Mortgage and Housing Corporation; callable share capital in international financial institutions; and claims and pending and threatened litigation. As of March 31, 2018, the Government's contingent liabilities totalled roughly $2 trillion. However, the vast majority of this amount represents situations where the probability of a future payment is assessed as unlikely or not determinable. The Government records a provision for contingent liabilities only in cases where the probability of future payment is considered likely. As of March 31, 2018, this provision totalled $23.0 billion.
The Government's assumptions related to risks and uncertainties used in determining its financial results are reassessed at each fiscal year-end and updated as necessary. Exposure to measurement uncertainty from the use of accounting and other estimates in recording certain transactions is discussed in Note 1 of the consolidated financial statements. Further details with respect to the measurement of the Government's contingent liabilities and environmental liabilities are included in Note 6 and Note 7, respectively, of the consolidated financial statements of the Government of Canada. Note 17 of the consolidated financial statements provides information on instruments and strategies used by the Government to manage financial risks associated with its financial assets and liabilities.
As noted in the Budget and related documents, and in the discussion on Economic Developments earlier in this section, the Government's revenues and expenses are highly sensitive to changes in economic conditions—particularly to changes in economic growth, inflation and interest rates.
To illustrate the impact of changes in economic conditions, the Department of Finance Canada publishes, on a regular basis, sensitivity impacts on the budgetary balance. These are "rules of thumb" as the actual impact will depend on many other factors as well. As published in the February 27, 2018 Budget, these show, for example, that:
- A one-year, 1-percentage-point increase/decrease in real GDP growth would raise/lower the budgetary balance by $4.8 billion in the first year, $4.5 billion in the second year, and $4.9 billion in the fifth year.
- A one-year, 1-percentage-point increase/decrease in GDP inflation would raise/lower the budgetary balance by $2.1 billion in the first year, $2.0 billion in the second year, and $1.4 billion in the fifth year.
- A sustained 100-basis-point decrease/increase in interest rates would raise/lower the budgetary balance by $0.6 billion in the first year, $1.5 billion in the second year, and $2.8 billion in the fifth year.
While these generalized rules of thumb provide good estimates of the sensitivity of the budgetary balance to small economic changes, it is important to note that some of the estimated relationships would change in response to large economic changes.
The Government manages risks to its fiscal projections due to changes in economic conditions by regularly surveying private sector economists on their views on the outlook for the Canadian economy and by monitoring its financial results on an ongoing basis to assess potential risks and guide its financial decisions.
The Government also prepares long-term economic and fiscal projections, which provide a broad analysis of its fiscal position, allowing the Government to respond more effectively to upcoming challenges and protect the long-term sustainability of public finances. The most recent version of these projections is available on the Department of Finance Canada's website.