
Financial statements discussion and analysis
Public Accounts of Canada 2020 Volume I: Top of the page Navigation
- Previous page: Section 1: Financial statements discussion and analysis
- Section 1: Table of contents: Section 1: Financial statements discussion and analysis
- Next page: Ten-year comparative financial information
Introduction
The Public Accounts of Canada is a major accountability report of the Government of Canada. This section, together with the other sections in this volume and in Volumes II and III of the Public Accounts of Canada, provides detailed supplementary information in respect of matters reported in the audited consolidated financial statements in Section 2 of this volume. Supplementary discussion and analysis of the financial results can be found in the Annual Financial Report of the Government of Canada—Fiscal Year 2019-2020, available on the Department of Finance Canada's website.
The consolidated financial statements and financial statements discussion and analysis have been prepared under the joint direction of the Minister of Finance, the President of the Treasury Board and the Receiver General for Canada. Responsibility for the integrity and objectivity of the consolidated financial statements and financial statements discussion and analysis rests with the government. A glossary of terms used in this financial statements discussion and analysis is provided at the end of this section.
2020 financial highlights
- The government posted a budgetary deficit of $39.4 billion for the fiscal year ended March 31, 2020, compared to a deficit of $14.0 billion in the previous fiscal year.
- The budgetary deficit before net actuarial losses stood at $28.8 billion in 2020, compared to $5.6 billion in 2019. The budgetary balance before net actuarial losses is a new measure that is being introduced to supplement the traditional budgetary balance and improve the transparency of the government's financial reporting by isolating the impact of the amortization of net actuarial losses arising from the government's pension and other employee future benefit plans.
- Compared to projections in the 2020 Economic and Fiscal Snapshot (July 2020 Snapshot), the annual deficit was $5.0 billion higher than the $34.4-billion deficit projected, mainly reflecting lower-than-expected tax and non-tax revenues, while the annual deficit before net actuarial losses was $5.2 billion higher than projected.
- Revenues increased by $1.9 billion, or 0.6%, from 2019, primarily reflecting increases in income tax revenues and the introduction of the fuel charge. Program expenses excluding net actuarial losses increased by $23.9 billion, or 7.6%, from 2019, reflecting increases in all major categories of expenses, including fuel charge proceeds returned. Net actuarial losses, which reflect changes in the measurement of the government's obligations for pensions and other employee future benefits accrued in previous fiscal years, increased $2.2 billion, or 26.9%, due in large part to declines in year-end interest rates used in valuing these obligations and increased costs associated with the utilization of disability and other future benefits provided to veterans. Public debt charges were up $1.2 billion, or 5.1%, largely reflecting higher Consumer Price Index adjustments on Real Return Bonds, an increase in the stock of Government of Canada treasury bills, and higher costs associated with marketable bonds.
- The accumulated deficit (the difference between total liabilities and total assets) stood at $721.4 billion at March 31, 2020. The accumulated deficit-to-GDP (gross domestic product) ratio was 31.3%, up from 30.8% in the previous year.
- As reported by the International Monetary Fund (IMF), Canada's total government net debt-to-GDP ratio, which includes the net debt of the federal, provincial/territorial and local governments, as well as the net assets held in the Canada Pension Plan and Quebec Pension Plan, stood at 25.9% in 2019. This is the lowest level among Group of Seven (G7) countries, which the IMF expects will record an average net debt of 88.1% of GDP for the same year.
Discussion and analysis
Economic developmentsLink to Table note 1
The global economy was at a mature stage of the business cycle for most of 2019 and early 2020. Though the expansion was moderating, the major trade tensions that had dogged the global outlook for the past few years had eased. Many central banks had begun easing monetary policy gradually to try to maintain the expansion.
Real GDP in 2019 grew 1.7%, after growth of 2.0% in 2018. Throughout 2019, and into the early part of 2020, the labour market continued to be strong, adding about 25,000 jobs per month over this period. Commodity prices, responding to slowing global demand, saw modest declines; the price of West Texas Intermediate crude oil declined to US$57 per barrel from US$65 per barrel in 2018. Short-term interest rates remained around 1.7% for most of 2019 as the Bank of Canada paused its monetary policy tightening cycle for the year. However, long-term interest rates continued to decline throughout the year, averaging 1.6%, down from 2.3% in 2018, as global monetary policy continued to gradually ease.
Canada's nominal GDP, the broadest measure of the tax base, grew 3.6% in 2019, down from 3.9% in 2018, as real GDP growth moderated towards potential.
The global and Canadian economies, however, soon experienced an historic disruption in the final two weeks of the fiscal year. The COVID-19 pandemic became an unprecedented threat to our health, and a global economic challenge. With unprecedented speed and breadth, the COVID-19 pandemic affected nearly all aspects of life. Public health containment measures led to large segments of the economy coming to an abrupt stop, with activity in some industries driven to near zero. Workplaces and schools were closed, travel restricted, and public gatherings banned, resulting in drastic impacts on many aspects of Canadians' lives. In March 2020 alone, more than 3 million people lost their jobs or saw their hours significantly scaled back.
The toll on the broader economy in 2020 is expected to be the largest and most sudden economic contraction since the Great Depression. By just the first quarter of 2020, Canada had already witnessed a large decline in real GDP, a drop in both short- and long-term interest rates to record lows, and a steep decline in commodity prices, including for oil. As the recovery has taken hold over the summer of 2020, many of these indicators have since bounced back; however, activity remains depressed in many sectors.
The Government of Canada's rapid and substantial economic support measures have helped protect Canadians from a far worse economic outcome, prevented more layoffs, and have laid a foundation for a faster and stronger recovery.
Going forward, the threat of a resurgent wave of COVID-19 and uncertainty surrounding the durability of the economic recovery, and the transition to a post-pandemic world, are the key risks to the global and domestic economies. The fiscal results up to March 31, 2020 only partially reflect the impact of COVID-19. In fiscal year 2021, the severe deterioration in the economic outlook plus the temporary measures implemented through the government's economic response plan are expected to result in a projected deficit of $343.2 billion in fiscal year 2021Link to Table note 2.
| 2018 | 2019 | 2020 | 2021 | |
|---|---|---|---|---|
| Real GDP growth | ||||
| Budget 2019 | 2.0 | 1.7 | 1.6 | 1.7 |
| 2020 Economic and Fiscal Snapshot | 2.0 | 1.7 | (negative 6.8) | 5.5 |
| Actual | 2.0 | 1.7 | – | – |
| Nominal GDP growth | ||||
| Budget 2019 | 4.1 | 3.4 | 3.5 | 3.7 |
| 2020 Economic and Fiscal Snapshot | 3.9 | 3.6 | (negative 6.3) | 7.9 |
| Actual | 3.9 | 3.6 | – | – |
| 3-month Treasury bill rate | ||||
| Budget 2019 | 1.4 | 1.9 | 2.2 | 2.3 |
| 2020 Economic and Fiscal Snapshot | 1.4 | 1.7 | 0.5 | 0.3 |
| Actual | 1.4 | 1.7 | – | – |
| 10-year government bond rate | ||||
| Budget 2019 | 2.3 | 2.4 | 2.7 | 2.8 |
| 2020 Economic and Fiscal Snapshot | 2.3 | 1.6 | 0.8 | 1.0 |
| Actual | 2.3 | 1.6 | – | – |
| Unemployment rate | ||||
| Budget 2019 | 5.8 | 5.7 | 5.9 | 6.0 |
| 2020 Economic and Fiscal Snapshot | 5.8 | 5.7 | 9.8 | 7.8 |
| Actual | 5.8 | 5.7 | – | – |
| Consumer price index inflation | ||||
| Budget 2019 | 2.3 | 1.9 | 2.0 | 1.9 |
| 2020 Economic and Fiscal Snapshot | 2.2 | 2.0 | 0.5 | 2.0 |
| Actual | 2.2 | 2.0 | – | – |
Canada's COVID-19 Economic Response Plan
Canada entered the COVID-19 pandemic in a strong fiscal position, enabling the government to take decisive action to protect Canadians and businesses from the impacts of the pandemic. Canada's COVID-19 Economic Response Plan (the Plan) includes measures to protect the health and safety of Canadians and provide direct support to Canadian workers and businesses. It also includes tax and customs duty payment deferrals to meet liquidity needs of businesses and households and to help stabilize the Canadian economy. Combined, these measures make Canada's plan one of the most generous response plans in the world.
The Plan focuses on three broad areas of support:
- Health Care System and Safety of Canadians, such as funding to strengthen critical health care systems, purchase personal protective equipment and supplies, and support critical medical research and vaccine developments.
- Support to Individuals, which includes delivering immediate income support to those most affected by the crisis, creating incentives for safe participation in the labour market, and ensuring vulnerable Canadians have access to the supports they need.
- Support to Businesses, such as support for market liquidity to ensure that businesses can continue to access credit, and bridge financing for businesses of all sizes so they can remain solvent and keep Canadians employed.
The government continues to take the necessary steps to implement this Plan and ensure timely access to the income support and credit relief that Canadians and businesses need to manage the pressures they are facing as a result of COVID-19, so that the Canadian economy is well-positioned to recover when the crisis subsides.
The impact of this Plan on the financial results of the government will largely be felt in the 2021 fiscal year. A relatively small share of the Plan is reflected in the 2020 budgetary results, including $6.5 billion for the Canada Emergency Response Benefit (CERB), $0.5 billion in support for provincial and territorial public health preparedness and critical health care systems, and $0.2 billion for national public health pandemic operations.
In addition to the measures noted above, credit and liquidity support is being made available through the Bank of Canada under several large-scale asset purchase programs to increase liquidity in core funding markets, and by the Canada Mortgage and Housing Corporation, through the Insured Mortgage Purchase Program (IMPP). The IMPP operates at no additional risk to the taxpayer, as the mortgages underlying the purchased securities are already insured.
The Government of Canada's debt program will increase in 2021 in order to allow the government to make the necessary temporary investments to stabilize the Canadian economy amidst the extraordinary circumstances of the COVID-19 pandemic. The government is taking a prudent approach by issuing an unprecedented level of long-term bonds in order to lock in funding at historically low interest rates.
Further information on Canada's COVID-19 Economic Response Plan can be found at canada.ca/en/department-finance/economic-response-plan. Information regarding the government's 2021 Debt Management Strategy, which sets out the Government of Canada's objectives, strategy and borrowing plans for its domestic debt program and the management of its official international reserves, can be found in Annex 3 of the Economic and Fiscal Snapshot 2020 at canada.ca/en/department-finance/services/publications/economic-fiscal-snapshot/debt-management-strategy-2020-21.
Additional details regarding the impact of the Plan on the government's financial results for 2020 are presented in the following sections of this financial statements discussion and analysis.
The budgetary balance
The budgetary balance is the difference between the government's revenues and total expenses over a fiscal year. It is one of the key measures of the government's annual financial performance. The government posted an annual deficit of $39.4 billion in 2020, compared to a deficit of $14.0 billion in 2019.
The annual deficit before net actuarial losses represents the difference between the government's revenues and expenses excluding net actuarial losses. By excluding the impact of re-measurement gains and losses stemming from the annual revaluation of the government's pension and other employee future benefit obligations accrued in previous fiscal years, this measure is intended to present a clearer picture of the results of government operations during the current fiscal year. The annual deficit before net actuarial losses stood at $28.8 billion in 2020, compared to $5.6 billion in 2019.
The following graph shows the government's budgetary balance since 1996, as well as the budgetary balance before net actuarial losses since 2009. To enhance the comparability of results over time and across jurisdictions, the budgetary balance and its components are presented as a percentage of GDP. In 2020, the budgetary deficit was 1.7% of GDP, compared to a deficit of 0.6% of GDP a year earlier. The budgetary deficit before net actuarial losses was 1.2% of GDP, compared to a deficit of 0.3% of GDP a year earlier.
Annual surplus/deficit
(percentage of GDP)
Note: In 2018, the government implemented, on a retroactive basis, a change in its methodology for the determination of the discount rate for unfunded pension benefits. Fiscal results for 2009 to 2017 were restated to reflect this change. Restated data for years prior to 2009 is not available.
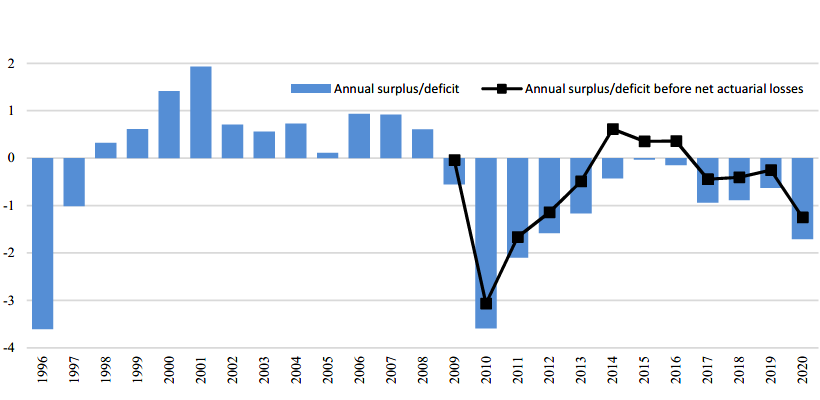
Image description
| Fiscal year | Annual surplus/deficit | Annual surplus/deficit before net actuarial losses |
|---|---|---|
| 1996 | (negative 3.6) | |
| 1997 | (negative 1.0) | |
| 1998 | 0.3 | |
| 1999 | 0.6 | |
| 2000 | 1.4 | |
| 2001 | 1.9 | |
| 2002 | 0.7 | |
| 2003 | 0.6 | |
| 2004 | 0.7 | |
| 2005 | 0.1 | |
| 2006 | 0.9 | |
| 2007 | 0.9 | |
| 2008 | 0.6 | |
| 2009 | (negative 0.6) | 0.0 |
| 2010 | (negative 3.6) | (negative 3.1) |
| 2011 | (negative 2.1) | (negative 1.7) |
| 2012 | (negative 1.6) | (negative 1.1) |
| 2013 | (negative 1.2) | (negative 0.5) |
| 2014 | (negative 0.4) | 0.6 |
| 2015 | 0.0 | 0.4 |
| 2016 | (negative 0.1) | 0.4 |
| 2017 | (negative 0.9) | (negative 0.4) |
| 2018 | (negative 0.9) | (negative 0.4) |
| 2019 | (negative 0.6) | (negative 0.3) |
| 2020 | (negative 1.7) | (negative 1.2) |
Annual deficit before net actuarial losses
A new line item, Annual deficit before net actuarial losses, has been added to this year's Consolidated Statement of Operations and Accumulated Deficit to improve the transparency of the government's financial reporting. This addition follows an introductory discussion of the concept in the Economic and Fiscal Update 2019, released on December 16, 2019, and public consultations undertaken during winter 2019 and spring 2020 on how this new measurement might be used in the government's financial reporting framework. Given the feedback received, the government has decided to incorporate this new measurement in its reports on projected and actual financial results, starting with the 2020 consolidated financial statements.
Actuarial losses and gains arise from the annual re-measurement of the government's existing obligations for public sector pensions and other future benefits owed to veterans and government employees. The measurement of these obligations involves the extensive use of estimates and assumptions about future events and circumstances, such as wage increases, inflation and mortality. In particular, the unfunded obligations are sensitive to changes in short- and long-term interest rates, which are used to estimate the value of expected future benefit payments in today's dollars. This volatility has increased in recent years, with the introduction of a new discount rate methodology in the 2018 Public Accounts. Prior to the change in methodology, unfunded pension obligations were discounted using a 20-year moving average of Government of Canada long-term bond rates, which resulted in a relatively stable discount rate. Under the new methodology, unfunded benefit obligations are discounted based on the spot rates of Government of Canada bonds at fiscal year-end (March 31), which can fluctuate significantly from one year to the next, resulting in actuarial gains and losses that flow through the budgetary balance.
While these adjustments and revaluations are an important part of providing an accurate picture of the government's statement of financial position at any given time, they can also result in large swings in the budgetary balance, which may impair the usefulness and understandability of the government's financial statements and fiscal projections, including as a measurement of the short-term impact of government spending and taxation choices on the economy.
The new "Annual deficit before net actuarial losses" line item has been introduced as a supplementary measure to isolate the impact of re-measurements of previously recorded pension and other employee future benefit obligations and provide a clearer view of the government's planned and actual operating activities in an accounting period, enhancing transparency and accountability.
Revenues were up $1.9 billion, or 0.6%, from the prior year, primarily reflecting increases in income tax revenues and the introduction of the fuel charge.
Expenses were up $27.3 billion, or 7.9%, from the prior year. Program expenses excluding net actuarial losses increased by $23.9 billion, or 7.6%, primarily reflecting an increase in transfer payments. Net actuarial losses increased by $2.2 billion, or 26.9%, from the prior year, due in large part to declines in year-end interest rates used to value the government's pension and other employee future benefit obligations and increased costs associated with the utilization of disability and other future benefits provided to veterans, which have resulted in increases in the value of these obligations. Public debt charges increased by $1.2 billion, or 5.1%, from the prior year, largely reflecting higher Consumer Price Index adjustments on Real Return Bonds, an increase in the stock of Government of Canada treasury bills, and higher costs associated with marketable bonds.
| 2020 | 2019 | |
|---|---|---|
| Consolidated Statement of Operations | ||
| Revenues | 334,131 | 332,218 |
| Expenses | ||
| Program expenses, excluding net actuarial lossesLink to footnote 3 | 338,467 | 314,555 |
| Public debt charges | 24,447 | 23,266 |
| Total expenses, excluding net actuarial lossesLink to footnote 3 | 362,914 | 337,821 |
| Annual deficit before net actuarial lossesLink to footnote 3 | (negative 28,783) | (negative 5,603) |
| Net actuarial lossesLink to footnote 3 | (negative 10,609) | (negative 8,361) |
| Annual deficit | (negative 39,392) | (negative 13,964) |
| Percentage of GDP | (negative 1.7%) | (negative 0.6%) |
| Consolidated Statement of Financial Position | ||
| Liabilities | ||
| Accounts payable and accrued liabilities | 163,833 | 159,707 |
| Interest-bearing debt | 1,084,776 | 1,025,464 |
| Total liabilities | 1,248,609 | 1,185,171 |
| Financial assets | 435,718 | 413,047 |
| Net debt | (negative 812,891) | (negative 772,124) |
| Non-financial assets | 91,531 | 86,674 |
| Accumulated deficit | (negative 721,360) | (negative 685,450) |
| Percentage of GDP | 31.3% | 30.8% |
Revenues
Federal revenues can be broken down into five main categories: income tax revenues, other taxes and duties, Employment Insurance (EI) premium revenues, fuel charge proceeds and other revenues.
Within the income tax category, personal income tax revenues are the largest source of federal revenues, and accounted for 50.2% of total revenues in 2020 (up from 49.3% in 2019). Corporate income tax revenues are the second largest source of revenues, and accounted for 15.0% of total revenues in 2020 (down from 15.2% in 2019). Non-resident income tax revenues are a comparatively smaller source of revenues, accounting for only 2.8% of total revenues in 2020 (unchanged from 2019).
Other taxes and duties consist of revenues from the Goods and Services Tax (GST), energy taxes, customs import duties and other excise taxes and duties. The largest component of this category—GST revenues—accounted for 11.2% of all federal revenues in 2020 (down from 11.5% in 2019). The share of the remaining components of other taxes and duties stood at 4.9% of total federal revenues (down from 5.7% in 2019).
EI premium revenues accounted for 6.6% of total federal revenues in 2020 (down slightly from 2019).
Fuel charge proceeds under the new federal carbon pollution pricing system that came into effect in April 2019 accounted for 0.8% of total federal revenues in 2020.
Other revenues are made up of three broad components: net income from enterprise Crown corporations and other government business enterprises; other program revenues from returns on investments, proceeds from the sales of goods and services, and other miscellaneous revenues; and foreign exchange revenues. Other revenues accounted for 8.5% of total federal revenues in 2020 (down from 8.8% in 2019).
Composition of revenues for 2020
Note: Numbers may not add to 100% due to rounding.
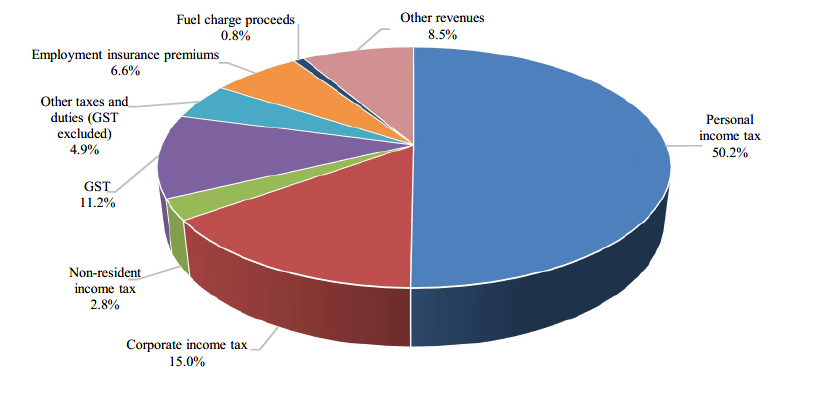
Image description
| Revenues | Percentage |
|---|---|
| Personal income tax | 50.2% |
| Corporate income tax | 15.0% |
| Non-resident income tax | 2.8% |
| GST | 11.2% |
| Other taxes and duties (GST excluded) | 4.9% |
| Employment Insurance premiums | 6.6% |
| Fuel charge proceeds | 0.8% |
| Other revenues | 8.5% |
Revenues compared to 2019
Total revenues amounted to $334.1 billion in 2020, up $1.9 billion, or 0.6%, from 2019. The following table compares revenues for 2020 to 2019.
| 2020 | 2019 | Change | ||
|---|---|---|---|---|
| $ | % | |||
| Income tax revenues | ||||
| Personal | 167,576 | 163,881 | 3,695 | 2.3 |
| Corporate | 50,060 | 50,368 | (negative 308) | (negative 0.6) |
| Non-resident | 9,476 | 9,370 | 106 | 1.1 |
| Total | 227,112 | 223,619 | 3,493 | 1.6 |
| Other taxes and duties | ||||
| Goods and services tax | 37,386 | 38,221 | (negative 835) | (negative 2.2) |
| Energy taxes | 5,683 | 5,802 | (negative 119) | (negative 2.1) |
| Customs import duties | 4,853 | 6,881 | (negative 2,028) | (negative 29.5) |
| Other excise taxes and duties | 5,958 | 6,323 | (negative 365) | (negative 5.8) |
| Total | 53,880 | 57,227 | (negative 3,347) | (negative 5.8) |
| Employment insurance premiums | 22,219 | 22,295 | (negative 76) | (negative 0.3) |
| Fuel charge proceeds | 2,655 | – | 2,655 | n/a |
| Other revenues | 28,265 | 29,077 | (negative 812) | (negative 2.8) |
| Total revenues | 334,131 | 332,218 | 1,913 | 0.6 |
- Personal income tax revenues increased by $3.7 billion in 2020, or 2.3%, reflecting developments in the labour market, particularly employment and wage growth until the end of calendar year 2019.
- Corporate income tax revenues decreased by $0.3 billion, or 0.6%, reflecting the drop in corporate profits resulting from the COVID-19 economic weakness at the end of the fiscal year and the effects of the payment deferral measures. Declines in corporate earnings were in a number of sectors including manufacturing, transport and hospitality, accommodation and the entertainment sector.
- Non-resident income tax revenues are paid by non-residents on Canadian-sourced income. These revenues increased by $0.1 billion, or 1.1%.
- Other taxes and duties decreased by $3.3 billion, or 5.8%. GST revenues declined by $0.8 billion in 2020, or 2.2%, reflecting weakness in retail sales and lower GST on imports, particularly in March as many retailers shut down operations due to the COVID-19 pandemic. Energy taxes fell by $0.1 billion, or 2.1%, primarily due to higher aviation fuel consumption in 2019. Customs import duties decreased by $2.0 billion, or 29.5%, largely due to the removal of retaliatory steel and aluminum tariffs. Other excise taxes and duties were down $0.4 billion, or 5.8%, driven primarily by a decrease in tobacco excise duties.
- EI premium revenues decreased by $0.1 billion, or 0.3%, due to a decrease in the premium rate for 2020.
- Other revenues decreased by $0.8 billion, or 2.8%, largely reflecting a decrease in enterprise Crown corporation profits due to COVID-19.
Pricing carbon pollution and delivering Climate Action Incentive payments
The federal carbon pollution pricing system is composed of a regulatory charge on fossil fuels ("fuel charge") and an output-based pricing system. The federal fuel charge began applying in Ontario, New Brunswick, Saskatchewan, and Manitoba, effective April 1, 2019; in Nunavut and Yukon, effective July 1, 2019; and in Alberta, effective January 1, 2020. Of note, the federal fuel charge no longer applies in New Brunswick, effective April 1, 2020, as the province implemented a tax on carbon emitting products that meets the federal benchmark stringency requirements. All direct proceeds from the federal fuel charge are returned to the jurisdiction of origin. Fuel charge proceeds totalled $2.7 billion in 2020. During 2020, in Ontario, New Brunswick, Manitoba, Alberta and Saskatchewan, the bulk of proceeds were returned through Climate Action Incentive payments. Eligible individuals residing in these provinces were able to claim the payments through their personal income tax returns. In Nunavut and Yukon, the proceeds were returned directly to the governments of those jurisdictions. Fuel charge proceeds returned totalled $2.6 billion in 2020.
The revenue ratio—revenues as a percentage of GDP—compares the total of all federal revenues to the size of the economy. This ratio is influenced by changes in statutory tax rates and by economic developments. The ratio stood at 14.5% in 2020 (down from 14.9% in 2019). This decrease primarily reflects a year-over-year decline in other taxes and duties, particularly in customs import duty revenues due to the removal of retaliatory steel and aluminum tariffs, and a year-over-year decline in other revenues driven by lower enterprise Crown corporation profits due to COVID-19.
Revenue ratio
(revenues as a percentage of GDP)
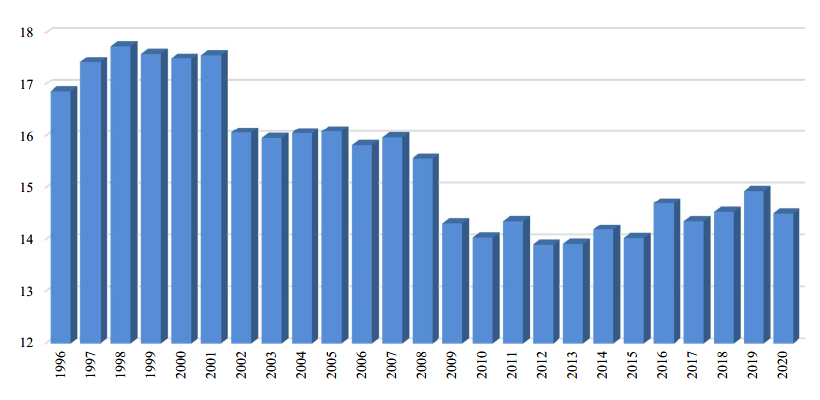
Image description
| Fiscal year | Percentage |
|---|---|
| 1996 | 16.9 |
| 1997 | 17.4 |
| 1998 | 17.7 |
| 1999 | 17.6 |
| 2000 | 17.5 |
| 2001 | 17.6 |
| 2002 | 16.1 |
| 2003 | 16.0 |
| 2004 | 16.1 |
| 2005 | 16.1 |
| 2006 | 15.8 |
| 2007 | 16.0 |
| 2008 | 15.6 |
| 2009 | 14.3 |
| 2010 | 14.0 |
| 2011 | 14.4 |
| 2012 | 13.9 |
| 2013 | 13.9 |
| 2014 | 14.2 |
| 2015 | 14.0 |
| 2016 | 14.7 |
| 2017 | 14.4 |
| 2018 | 14.5 |
| 2019 | 14.9 |
| 2020 | 14.5 |
Expenses
Federal expenses can be broken down into four main categories: transfer payments, which account for roughly two-thirds of all federal spending, net actuarial losses, other expenses and public debt charges.
Transfer payments are classified under four categories:
- Major transfers to persons, which made up 28.7% of total expenses (up from 27.8% in 2019). This category consists of elderly, EI, and children's benefits, and the new Canada Emergency Response Benefit.
- Major transfers to other levels of government—which include the Canada Health Transfer, the Canada Social Transfer, the home care and mental health transfers, fiscal arrangements (Equalization, transfers to the territories, a number of smaller transfer programs and the Quebec Abatement), Gas Tax Fund transfers, and transfers under the new Hibernia Dividend Backed Annuity Agreement—made up 21.2% of total expenses in 2020 (down from 21.9% in 2019).
- Fuel charge proceeds returned, consisting of payments under the new federal carbon pollution pricing system, made up 0.7% of expenses.
- Other transfer payments, which include transfers to Indigenous peoples, assistance to farmers, students and businesses, support for research and development, and international assistance, made up 14.6% of expenses (down from 14.9% in 2019).
Net actuarial losses made up 2.8% of total expenses in 2020, up from 2.4% in 2019.
Other expenses, which represent the operating expenses of the government's 134 departments, agencies, and consolidated Crown corporations and other entities, accounted for 25.5% of total expenses in 2020 (down from 26.0% in 2019).
Public debt charges made up the remaining 6.5% of total expenses in 2020 (down from 6.7% in 2019).
Composition of expenses for 2020
Note: Numbers may not add to 100% due to rounding.
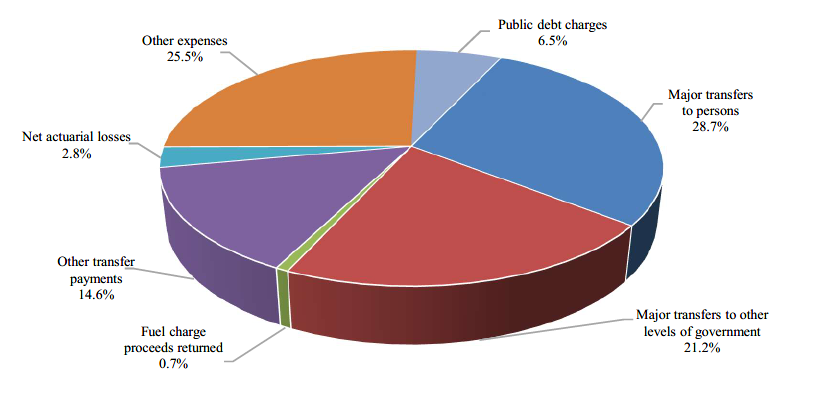
Image description
| Expenses | Percentage |
|---|---|
| Major transfers to persons | 28.7% |
| Major transfers to other levels of government | 21.2% |
| Fuel charge proceeds returned | 0.7% |
| Other transfer payments | 14.6% |
| Actuarial losses | 2.8% |
| Other expenses | 25.5% |
| Public debt charges | 6.5% |
Expenses compared to 2019
Total expenses amounted to $373.5 billion in 2020, up $27.3 billion, or 7.9%, from 2019. The following table compares total expenses for 2020 to 2019.
| 2020 | 2019 | Change | ||
|---|---|---|---|---|
| $ | % | |||
| Transfer payments | ||||
| Major transfers to persons | ||||
| Elderly benefits | 56,227 | 53,366 | 2,861 | 5.4 |
| Employment insurance | 21,750 | 18,888 | 2,862 | 15.2 |
| Children's benefits | 24,344 | 23,882 | 462 | 1.9 |
| Canada emergency response benefit | 4,739 | – | 4,739 | n/a |
| Total | 107,060 | 96,136 | 10,924 | 11.4 |
| Major transfers to other levels of government | ||||
| Federal transfer support for health and other social programs | 55,457 | 52,729 | 2,728 | 5.2 |
| Fiscal arrangements and other transfers | 23,718 | 23,196 | 522 | 2.3 |
| Total | 79,175 | 75,925 | 3,250 | 4.3 |
| Fuel charge proceeds returned | 2,636 | 664 | 1,972 | 297.0 |
| Other transfer payments | 54,405 | 51,753 | 2,652 | 5.1 |
| Total transfer payments | 243,276 | 224,478 | 18,798 | 8.4 |
| Other expenses, excluding net actuarial lossesLink to footnote 4 | 95,191 | 90,077 | 5,114 | 5.7 |
| Total program expenses, excluding net actuarial lossesLink to footnote 4 | 338,467 | 314,555 | 23,912 | 7.6 |
| Public debt charges | 24,447 | 23,266 | 1,181 | 5.1 |
| Total expenses, excluding net actuarial lossesLink to footnote 4 | 362,914 | 337,821 | 25,093 | 7.4 |
| Net actuarial lossesLink to footnote 4 | 10,609 | 8,361 | 2,248 | 26.9 |
| Total expenses | 373,523 | 346,182 | 27,341 | 7.9 |
- Major transfers to persons increased by $10.9 billion in 2020, reflecting increases across all major categories, as well as the new Canada Emergency Response Benefit (CERB), an income support program introduced under Canada's COVID-19 Economic Response Plan. Elderly benefits increased by $2.9 billion, or 5.4%, reflecting growth in the elderly population and changes in consumer prices, to which benefits are fully indexed.EI benefits, which include $1.8 billion in CERB benefits to individuals eligible for EI in 2020, increased by $2.9 billion, or 15.2%, as individuals qualified for increased benefits, and COVID-19 weakened labour market conditions near year-end. Children's benefits increased by $0.5 billion, or 1.9%, reflecting the indexation of the Canada Child Benefit. CERB payments to those individuals not eligible for EI totalled $4.7 billion, bringing total transfers under the CERB to $6.5 billion.
- Major transfers to other levels of government increased by $3.3 billion in 2020, primarily reflecting $3.3 billion in legislated growth in the Canada Health Transfer, the Canada Social Transfer, Equalization transfers and transfers to the territories; $2.4 billion in transfers under the new Hibernia Dividend Backed Annuity Agreement reached on April 1, 2019 between Canada and Newfoundland and Labrador; and, $0.5 billion in transfers to provinces and territories for public health preparedness, critical health care system needs and to support mitigation efforts associated with COVID-19. These increases were offset in part by a decrease in Gas Tax Fund transfers, reflecting a one-time, $2.2-billion increase in Gas Tax Fund transfers in the prior year, and a $0.8-billion increase in recoveries under the Quebec Abatement.
- Other transfer payments increased by $2.7 billion, or 5.1%, in 2020, reflecting increases across a number of departments and agencies, such as growth in transfers paid through the tax system, including the Canada workers benefit, reflecting enhancements announced in Budget 2018; compensation for supply-managed dairy producers as a result of market access commitments made under recent international trade agreements; transfers under the new Interim Housing Assistance Program to address extraordinary interim housing pressures resulting from increased volumes of asylum claimants entering Canada; and, increased provisions for loan guarantees, reflecting the economic outlook at March 31, 2020.
- Fuel charge proceeds returned increased by $2.0 billion, or 297.0%, largely reflecting the accounting treatment of Climate Action Incentive payments, which requires some of the costs to be borne in the fiscal year prior to the fuel charge being collected because they are delivered through the personal income tax system through returns for the previous tax year. A portion of personal income tax returns are filed and assessed before the end of the fiscal year. As a result, fuel charge proceeds returned in 2020 reflect a portion of the Climate Action Incentive payments that were made in respect of fuel charge proceeds generated in 2020 and returned through 2018 tax returns, and a portion of the payments made in respect of proceeds to be generated in 2021 and returned through 2019 tax returns.
- Other expenses of departments, agencies, and consolidated Crown corporations and other entities, excluding net actuarial losses, increased by $5.1 billion, or 5.7%, in large part due to an increase in personnel costs and increased provisions for bad debts.
- Public debt charges increased by $1.2 billion, or 5.1%, reflecting higher Consumer Price Index adjustments on Real Return Bonds, an increase in the stock of Government of Canada treasury bills, and higher costs associated with marketable bonds.
- Net actuarial losses, which represent changes in the measurement of the government's obligations for pensions and other employee future benefits accrued in previous fiscal years, increased $2.2 billion, or 26.9%, due in large part to declines in year-end interest rates and increased costs associated with the utilization of disability and other future benefits provided to veterans.
Hibernia Dividend Backed Annuity Agreement
The government and the province of Newfoundland and Labrador entered into the Hibernia Dividend Backed Annuity Agreement (HDBA) effective April 1, 2019. Under the HDBA, the Government of Canada is obligated to make stated annual payments between 2019 and 2056 to Newfoundland and Labrador totalling $3.3 billion. The total payments of $3.3 billion include the provincial income and capital taxes (provincial taxes) in respect of those years payable by Canada Hibernia Holding Corporation (CHHC) to Newfoundland and Labrador. The government indirectly owns all of the issued and outstanding shares of CHHC through the Canada Development Investment Corporation, a wholly owned federal Crown corporation.
The province of Newfoundland and Labrador is obligated under the HDBA to pay the Government of Canada eight fixed annual payments of $100 million each, starting in 2045 and ending in 2052.
Scheduled payments to the province of Newfoundland and Labrador are made through a Specified Purpose Account, established pursuant to subsection 21(1) of the Financial Administration Act.
The government has recorded a transfer payment expense of $2.4 billion and other revenue of $0.4 billion in 2020, representing the present value of its liability to and receivable from the province, respectively, under the agreement.
There has been a large shift in the composition of total expenses since the mid-1990s. Public debt charges were the largest component for most of the 1990s, given the large and increasing stock of interest-bearing debt and high average effective interest rates on that stock of debt. Since reaching a high of nearly 30% of total expenses in 1997, the share of public debt charges in total expenses has fallen by more than three-quarters.
The interest ratio (public debt charges as a percentage of revenues) shows the proportion of every dollar of revenue that is needed to pay interest and is therefore not available to pay for program initiatives. The lower the ratio, the more flexibility the government has to address the key priorities of Canadians. The interest ratio has been decreasing in recent years, falling from a peak of 37.6% in 1991 to 7.3% in 2020. This means that, in 2020, the government spent approximately 7 cents of every revenue dollar on interest on public debt.
Interest ratio
(public debt charges as a percentage of revenues)
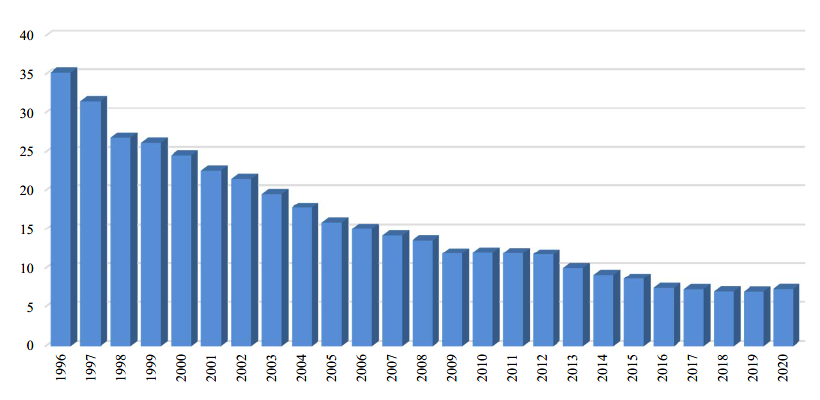
Image description
| Fiscal year | Percentage |
|---|---|
| 1996 | 35.2 |
| 1997 | 31.5 |
| 1998 | 26.8 |
| 1999 | 26.2 |
| 2000 | 24.6 |
| 2001 | 22.6 |
| 2002 | 21.6 |
| 2003 | 19.6 |
| 2004 | 17.8 |
| 2005 | 15.9 |
| 2006 | 15.1 |
| 2007 | 14.2 |
| 2008 | 13.6 |
| 2009 | 11.9 |
| 2010 | 12.0 |
| 2011 | 12.0 |
| 2012 | 11.8 |
| 2013 | 10.0 |
| 2014 | 9.2 |
| 2015 | 8.6 |
| 2016 | 7.5 |
| 2017 | 7.3 |
| 2018 | 7.0 |
| 2019 | 7.0 |
| 2020 | 7.3 |
Comparison of actual results to budget projections
Comparison to July 2020 Snapshot
The $39.4-billion deficit recorded in 2020 was $5.0 billion higher than the $34.4-billion deficit projected in the July 2020 Snapshot.
- Overall, revenues were $7.3 billion lower than forecast due to lower-than-expected tax and non-tax revenues.
- Program expenses, excluding net actuarial losses, were $2.0 billion lower than expected.
- Public debt charges were $0.1 billion lower than forecast.
- Net actuarial losses were $0.2 billion lower than projected.
| ProjectionLink to footnote 5 | Actual | Difference | |
|---|---|---|---|
| Revenues | 341,400 | 334,131 | (negative 7,269) |
| Expenses | |||
| Program expenses, excluding net actuarial losses | 340,516 | 338,467 | (negative 2,049) |
| Public debt charges | 24,501 | 24,447 | (negative 54) |
| Total expenses, excluding net actuarial losses | 365,017 | 362,914 | (negative 2,103) |
| Annual deficit before net actuarial losses | (negative 23,617) | (negative 28,783) | (negative 5,166) |
| Net actuarial losses | (negative 10 760) | (negative 10 609) | 151 |
| Annual deficit | (negative 34,377) | (negative 39,392) | (negative 5,015) |
Comparison to March 2019 budget plan
The 2020 budgetary deficit of $39.4 billion was $22.5 billion higher than the $16.8-billion deficit projected for 2020 in the March 2019 Budget.
Revenues were $4.6 billion, or 1.4%, lower than forecast in the March 2019 Budget, driven by weaker-than-expected growth in GST revenue and customs import duties.
Total expenses, excluding net actuarial losses, were $14.2 billion, or 4.1%, higher than projected in the March 2019 Budget, with program expenses $15.9 billion higher than forecast and public debt charges $1.8 billion lower than forecast.
- Major transfers to persons were $6.6 billion higher than forecast, a result of measures announced in the COVID-19 Economic Response Plan, primarily the Canada Emergency Response Benefit.
- Major transfers to other levels of government were $2.3 billion higher than projected. This is largely due to transfers under the new Hibernia Dividend Backed Annuity Agreement that was announced in the Economic and Fiscal Update 2019.
- Direct program expenses, which are comprised of other transfer payments, other expenses excluding net actuarial losses, and fuel charge proceeds returned, were $7.0 billion higher than projected in the March 2019 Budget. The variance from forecast is largely attributable to higher-than-projected pension and other employee future benefit expenses, reflecting lower-than-expected interest rates; higher-than-expected expenses related to claims and litigation; and measures announced after Budget 2019.
- Public debt charges were $1.8 billion lower than forecast in the March 2019 Budget, largely reflecting a lower-than-expected average effective interest rate on the stock of interest-bearing debt.
Net actuarial losses were $3.7 billion higher than projected, largely reflecting higher-than-expected losses at the end of 2019 due to lower-than-expected interest rates, as well as increased costs associated with the utilization of disability and other future benefits provided to veterans.
| BudgetLink to footnote 6 | Actual | Difference | |
|---|---|---|---|
| Revenues | |||
| Income tax revenues | 226,526 | 227,112 | 586 |
| Other taxes and duties | 59,280 | 53,880 | (negative 5,400) |
| Employment insurance premiums | 21,967 | 22,219 | 252 |
| Fuel charge proceeds | 2,335 | 2,655 | 320 |
| Other revenues | 28,670 | 28,265 | (negative 405) |
| Total revenues | 338,778 | 334,131 | (negative 4,647) |
| Expenses | |||
| Program expenses | |||
| Major transfers to persons | 100,435 | 107,060 | 6,625 |
| Major transfers to other levels of government | 76,886 | 79,175 | 2,289 |
| Direct program expenses | |||
| Fuel charge proceeds returned | 2,640 | 2,636 | (negative 4) |
| Other transfer payments | 52,798 | 54,405 | 1,607 |
| Other expenses, excluding net actuarial losses | 89,774 | 95,191 | 5,417 |
| Total program expenses, excluding net actuarial losses | 322,533 | 338,467 | 15,934 |
| Public debt charges | 26,212 | 24,447 | (negative 1,765) |
| Total expenses, excluding net actuarial losses | 348,745 | 362,914 | 14,169 |
| Annual deficit before net actuarial losses | (negative 9,967) | (negative 28,783) | (negative 18,816) |
| Net actuarial losses | (negative 6,882) | (negative 10,609) | (negative 3,727) |
| Annual deficit | (negative 16,849) | (negative 39,392) | (negative 22,543) |
Accumulated deficit
The accumulated deficit is the difference between the government's total liabilities and total assets. The annual change in the accumulated deficit is equal to the annual budgetary balance plus other comprehensive income or loss. Other comprehensive income or loss represents certain unrealized gains and losses on financial instruments and certain actuarial gains and losses related to pensions and other employee future benefits reported by enterprise Crown corporations and other government business enterprises. Based on Canadian public sector accounting standards, other comprehensive income or loss is not included in the government's annual budgetary balance, but is instead recorded directly to the government's Consolidated Statement of Accumulated Deficit and Consolidated Statement of Change in Net Debt.
| 2020 | 2019 | Difference | |
|---|---|---|---|
| Accumulated deficit at beginning of year | (negative 685,450) | (negative 671,254) | (negative 14,196) |
| Annual deficit | (negative 39,392) | (negative 13,964) | (negative 25,428) |
| Other comprehensive income (loss) | 3,482 | (negative 232) | 3,714 |
| Accumulated deficit at end of year | (negative 721,360) | (negative 685,450) | (negative 35,910) |
The accumulated deficit increased by $35.9 billion in 2020, reflecting the $39.4-billion budgetary deficit, offset in part by $3.5 billion in other comprehensive income.
The accumulated deficit was 31.3% of GDP at March 31, 2020, compared to a post-World War II peak of 66.6% at March 31, 1996.
Graph - Accumulated deficit
(as a percentage of GDP)
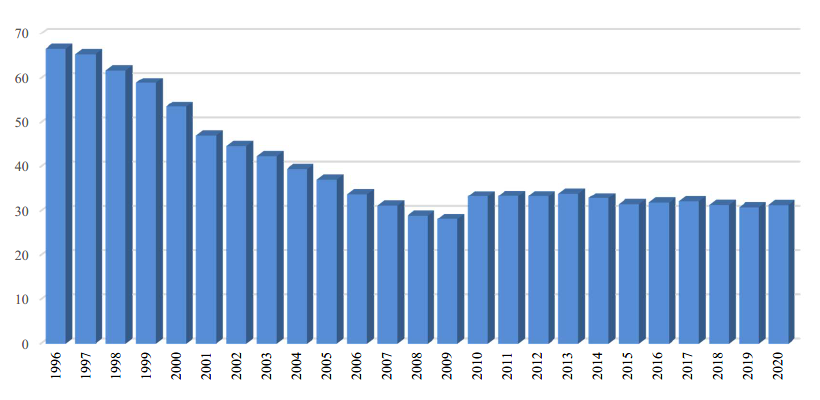
Image description
| Fiscal year | Percentage |
|---|---|
| 1996 | 66.6 |
| 1997 | 65.5 |
| 1998 | 61.7 |
| 1999 | 58.9 |
| 2000 | 53.6 |
| 2001 | 47.0 |
| 2002 | 44.7 |
| 2003 | 42.3 |
| 2004 | 39.5 |
| 2005 | 37.0 |
| 2006 | 33.9 |
| 2007 | 31.2 |
| 2008 | 29.0 |
| 2009 | 28.2 |
| 2010 | 33.4 |
| 2011 | 33.4 |
| 2012 | 33.4 |
| 2013 | 34.0 |
| 2014 | 32.9 |
| 2015 | 31.5 |
| 2016 | 31.9 |
| 2017 | 32.2 |
| 2018 | 31.4 |
| 2019 | 30.8 |
| 2020 | 31.3 |
Measures of government debt
The consolidated financial statements of the Government of Canada are presented on an accrual basis of accounting. On this basis, there are several generally accepted definitions of government debt.
Total liabilities of the government consist of unmatured debt, or debt issued on the credit markets, pension and other future benefit liabilities, other interest-bearing liabilities, and accounts payable and accrued liabilities.
Net debt represents the total liabilities of the government less its financial assets. Financial assets include cash and cash equivalents, accounts receivable, foreign exchange accounts, loans, investments and advances, and public sector pension assets.
The accumulated deficit is equal to total liabilities less total assets—both financial and non-financial. Non-financial assets include tangible capital assets, such as land and buildings, inventories, and prepaid expenses and other. The accumulated deficit is the federal government's main measure of debt.
Measures of Government debt chart
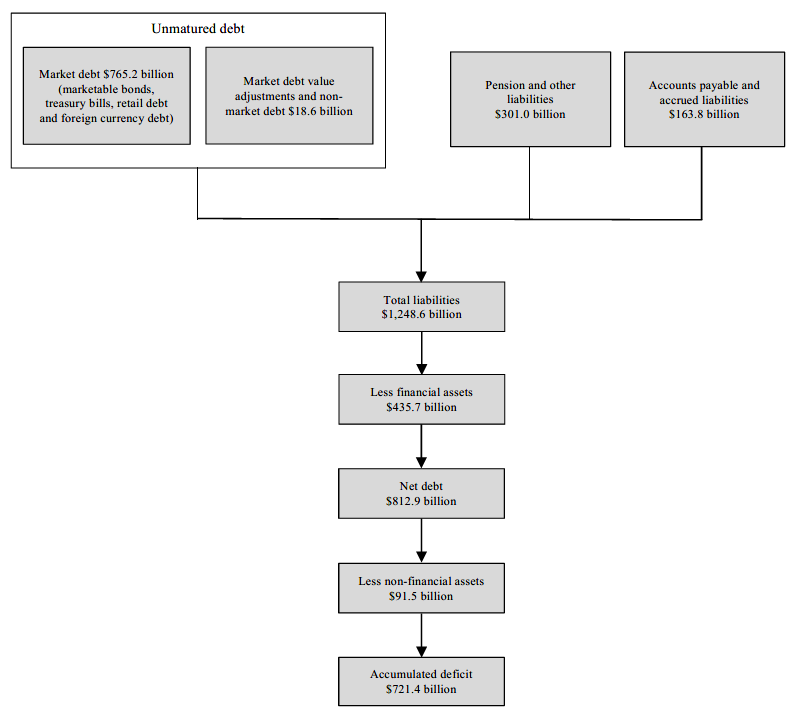
Image description
The Measures of Government debt chart a total of 8 relationship boxes. The first 3 liability measurements align horizontally as follows: Unmatured debt which is made up of Market debt for $765.2 billion (marketable bonds, treasury bills, retail debt and foreign currency debt) and Market debt value adjustments and non-market debt for $18.6 billion; Pension and other liabilities for $301.0 billion; and Accounts payable and accrued liabilities for $163.8 billion. The remaining measurement relationship boxes are aligned vertically below as follows: Total liabilities for $1,248.6 billion; Less financial assets for $435.7 billion; Net debt for $812.9 billion; Less non-financial assets for $91.5 billion; and Accumulated deficit for $721.4 billion.
The government's total liabilities include interest-bearing debt and accounts payable and accrued liabilities. Total assets include both financial and non-financial assets, the latter consisting primarily of tangible capital assets. The following sections provide more details on each of these components.
| 2020 | 2019 | Difference | |
|---|---|---|---|
| Liabilities | |||
| Accounts payable and accrued liabilities | 163,833 | 159,707 | 4,126 |
| Interest-bearing debt | |||
| Unmatured debt | 783,751 | 736,915 | 46,836 |
| Pensions and other future benefits | 294,974 | 282,644 | 12,330 |
| Other liabilities | 6,051 | 5,905 | 146 |
| Total | 1,084,776 | 1,025,464 | 59,312 |
| Total liabilities | 1,248,609 | 1,185,171 | 63,438 |
| Financial assets | |||
| Cash and accounts receivable | 173,715 | 177,041 | (negative 3,326) |
| Foreign exchange accounts | 104,903 | 99,688 | 5,215 |
| Loans, investments and advances | 152,502 | 133,912 | 18,590 |
| Public sector pension assets | 4,598 | 2,406 | 2,192 |
| Total financial assets | 435,718 | 413,047 | 22,671 |
| Net debt | (negative 812,891) | (negative 772,124) | (negative 40,767) |
| Non-financial assets | 91,531 | 86,674 | 4,857 |
| Accumulated deficit | (negative 721,360) | (negative 685,450) | (negative 35,910) |
Accounts payable and accrued liabilities
The following chart shows accounts payable and accrued liabilities by category for 2020.
Accounts payable and accrued liabilities by category for 2020
Note: Numbers may not add to 100% due to rounding.
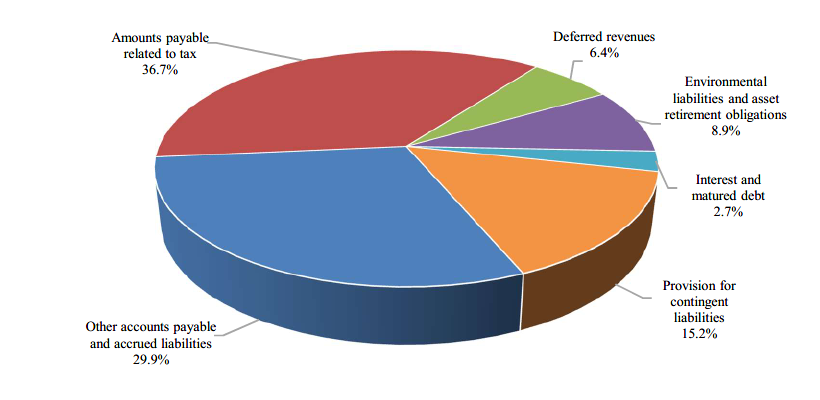
Image description
| Accounts payable and accrued liabilities | Percentage |
|---|---|
| Other accounts payable and accrued liabilities | 29.9% |
| Amounts payable related to tax | 36.7% |
| Deferred revenues | 6.4% |
| Environmental liabilities and asset retirement obligations | 8.9% |
| Interest and matured debt | 2.7% |
| Provision for contingent liabilities | 15.2% |
The government's accounts payable and accrued liabilities consist of amounts payable related to tax based on assessments and estimates of refunds owing for tax assessments not completed by year-end; provisions for contingent liabilities, including guarantees provided by the government and claims and pending and threatened litigation; environmental liabilities and asset retirement obligations, which include estimated costs related to the remediation of contaminated sites and the future restoration of certain tangible capital assets; deferred revenue; interest and matured debt, as well as accrued interest at year-end; and other accounts payable and accrued liabilities. Other accounts payable and accrued liabilities include items such as accrued salaries and benefits; amounts payable to provinces, territories and Indigenous governments for taxes collected and administered on their behalf in accordance with tax collection agreements; and amounts owing at year-end pursuant to contractual arrangements or for work performed or goods received.
At March 31, 2020, accounts payable and accrued liabilities totalled $163.8 billion, up $4.1 billion from March 31, 2019. This increase reflects growth in other accounts payable and accrued liabilities, deferred revenue, and environmental liabilities and asset retirement obligations, offset in part by decreases in amounts payable related to tax, provisions for contingent liabilities, and interest and matured debt.
- Amounts payable related to tax decreased by $5.0 billion in 2020, from $65.2 billion at March 31, 2019, to $60.2 billion at March 31, 2020. This decrease largely reflects lower assessed refunds owing at the end of the fiscal year due to extended filing deadlines under the government's Economic Response Plan, as well as year-over-year differences in the timing of refunds.
- Provisions for contingent liabilities decreased by $1.5 billion, largely reflecting the settlement of various claims and pending and threatened litigation.
- Environmental liabilities and asset retirement obligations increased by $1.5 billion in 2020, reflecting revisions to previously estimated provisions, net of remediation activities undertaken in 2020.
- Deferred revenue increased by $3.0 billion in 2020, primarily reflecting proceeds from the auction of spectrum licences in the 600 MHz Band, which concluded on April 4, 2019.
- Liabilities for interest and matured debt decreased by $0.2 billion from the prior year.
- Other accounts payable and accrued liabilities increased by $6.4 billion in 2020. Within this component, accounts payable increased by $9.1 billion, due largely to the accrual of CERB benefits payable to individuals for the period of March 15 to March 31, 2020, the recording of a $2.3-billion liability to Newfoundland and Labrador under the new Hibernia Dividend Backed Annuity Agreement, as well as increased accrued liabilities for settled claims. These increases were offset in part by the payment in 2020 of a one-time $2.2-billion top-up to the Gas Tax Fund and $1.0 billion in funding for the Green Municipal Fund, announced in Budget 2019 and accrued at the end of 2019. Accrued salaries and benefits increased by $2.1 billion. Liabilities under tax collection agreements decreased by $4.7 billion, largely reflecting timing differences in payments to provinces and territories, while miscellaneous paylist deductions decreased by $0.1 billion. Notes payable to international organizations and other accounts payable decreased by $46 million and $30 million, respectively.
Graph - Accounts payable and accrued liabilities
(in billions of dollars)
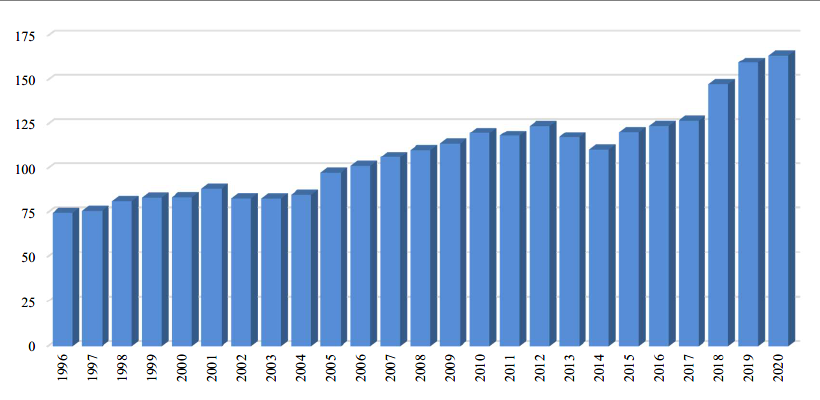
Image description
| Fiscal year | Billions of dollars |
|---|---|
| 1996 | 74.9 |
| 1997 | 75.9 |
| 1998 | 81.7 |
| 1999 | 83.7 |
| 2000 | 83.9 |
| 2001 | 88.5 |
| 2002 | 83.2 |
| 2003 | 83.2 |
| 2004 | 85.2 |
| 2005 | 97.7 |
| 2006 | 101.4 |
| 2007 | 106.5 |
| 2008 | 110.5 |
| 2009 | 114.0 |
| 2010 | 120.1 |
| 2011 | 118.5 |
| 2012 | 124.0 |
| 2013 | 117.6 |
| 2014 | 110.8 |
| 2015 | 120.6 |
| 2016 | 124.1 |
| 2017 | 127.0 |
| 2018 | 147.8 |
| 2019 | 159.7 |
| 2020 | 163.8 |
Interest-bearing debt
Interest-bearing debt includes unmatured debt, or debt issued on the credit markets, pension and other future benefit liabilities, and other liabilities.
- Unmatured debt, which includes fixed-coupon marketable bonds, Real Return Bonds, treasury bills, retail debt (Canada Savings Bonds and Canada Premium Bonds), foreign-currency-denominated debt, and obligations related to capital leases and public-private partnerships, amounted to 72.3% of interest-bearing debt at March 31, 2020.
- Pension and other future benefit liabilities include obligations for: federal public sector pensions sponsored by the government; disability and associated benefits available to war veterans, current and retired members of the Canadian Forces and the Royal Canadian Mounted Police, their survivors and dependants; health care and dental benefits available to retired employees and their dependants; accumulated sick leave entitlements; severance benefits; workers' compensation benefits; and other future benefits sponsored by some consolidated Crown corporations and other entities. Liabilities for public sector pensions made up 15.5% of interest-bearing debt and other employee and veteran future benefits accounted for an additional 11.7% of interest-bearing debt.
- The remaining 0.6% of interest-bearing debt represents other interest-bearing liabilities of the government, which include deposit and trust accounts and other specified purpose accounts.
The share of total interest-bearing debt represented by unmatured debt had been declining since the mid-1990s, as the government was able to retire some of this debt. This trend reversed in 2009 due to the increase in financial requirements stemming from the recession and stimulus measures introduced to mitigate its impacts, as well as an increase in borrowings under the consolidated borrowing framework introduced in 2008. Under the consolidated borrowing framework, the government finances all of the borrowing needs of Canada Mortgage and Housing Corporation, the Business Development Bank of Canada and Farm Credit Canada through direct lending in order to reduce overall borrowing costs and improve the liquidity of the government securities market.
Graph - Interest-bearing debt by category for 2020
Note: Numbers may not add to 100% due to rounding.
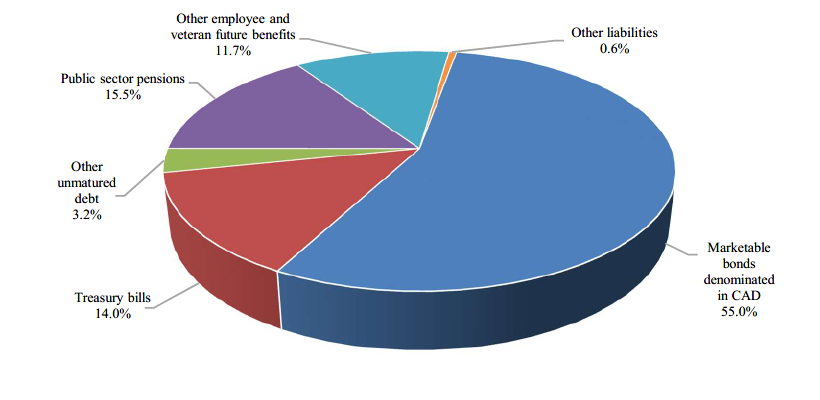
Image description
| Interest bearing debt | Percentage |
|---|---|
| Marketable bonds denominated in CAD | 55.0% |
| Treasury bills | 14.0% |
| Other unmatured debt | 3.2% |
| Public sector pensions | 15.5% |
| Other employee and veteran future benefits | 11.7% |
| Other liabilities | 0.6% |
At March 31, 2020, interest-bearing debt totalled $1,084.8 billion, up $59.3 billion from March 31, 2019. Within interest-bearing debt, unmatured debt increased by $46.8 billion, liabilities for pensions decreased by $0.2 billion, liabilities for other employee and veteran future benefits increased by $12.5 billion, and other liabilities increased by $0.1 billion.
The $46.8-billion increase in unmatured debt is largely attributable to a $44.1-billion increase in market debt, reflecting increased borrowings to meet the financial needs of the government, as well as a $3.3-billion increase in liabilities from cross-currency swap revaluations.
The Bank of Canada and the Department of Finance Canada manage the government's unmatured debt and associated risks. The fundamental objective of the debt management strategy is to provide stable, low-cost funding to meet the government's financial obligations and liquidity needs. Details on the government's debt management objectives, strategy, and borrowing plans are tabled annually in Parliament through the Department of Finance Canada's Debt Management Strategy.
Foreign holdings of the government's unmatured debt are estimated at $216.9 billion at March 31, 2020, representing approximately 27.7% of the government's total unmatured debt.
Foreign holdings of Government of Canada unmatured debt
(as a percentage of unmatured debt)
Source: Statistics Canada
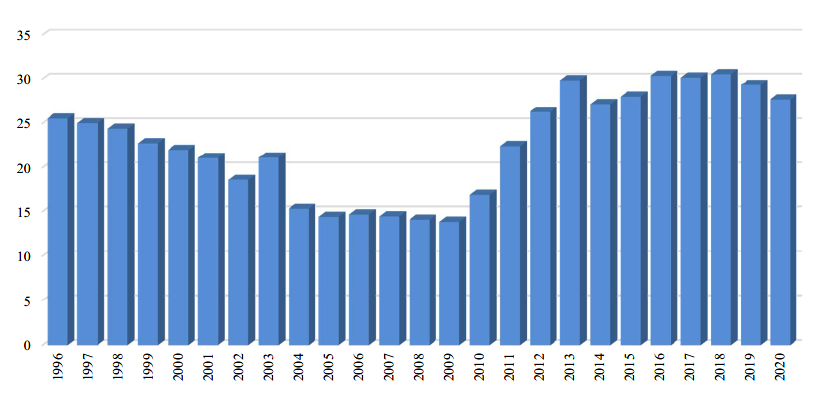
Image description
| Fiscal year | Percentage |
|---|---|
| 1996 | 25.5 |
| 1997 | 25.0 |
| 1998 | 24.4 |
| 1999 | 22.7 |
| 2000 | 22.0 |
| 2001 | 21.1 |
| 2002 | 18.6 |
| 2003 | 21.1 |
| 2004 | 15.3 |
| 2005 | 14.4 |
| 2006 | 14.7 |
| 2007 | 14.5 |
| 2008 | 14.1 |
| 2009 | 13.9 |
| 2010 | 16.9 |
| 2011 | 22.4 |
| 2012 | 26.3 |
| 2013 | 29.9 |
| 2014 | 27.2 |
| 2015 | 28.0 |
| 2016 | 30.3 |
| 2017 | 30.2 |
| 2018 | 30.5 |
| 2019 | 29.3 |
| 2020 | 27.7 |
The government's liabilities for pensions and other future benefits stood at $295.0 billion at March 31, 2020, up $12.3 billion from the prior year. These liabilities represent the estimated present value of pensions and other future benefits earned to March 31, 2020, by current and former employees, as measured annually on an actuarial basis, net of the value of assets set aside for funding purposes. Liabilities for pensions and other future benefits do not include benefits payable under the Canada Pension Plan (CPP). The CPP is not consolidated in the government's financial statements because changes to the CPP require the agreement of two thirds of participating provinces and it is therefore not controlled by the government. Further information regarding the CPP can be found in Section 6 of this volume.
Accounting for pensions and other employee and veteran future benefits
The government's $295.0-billion liability for pensions and other employee and veteran future benefits results from its promise to provide certain benefits to employees during or after employment, or in retirement, in return for their service.
For benefits that accumulate over time as employees work, such as pensions, an annual expense and liability are recorded for the estimated cost of benefits earned by employees during the year. The government uses an actuarial cost method (the projected accrued benefit method prorated on service) to estimate this expense and liability. Under this method, the government estimates the total expected future benefit payments for current employees. This total is then prorated over employees' period of employment. This means that an equal portion of the estimate is expensed as current service cost in each year of an employee's service, on a present value basis. Several actuarial assumptions are used in calculating current service cost, including future inflation, interest rates, return on pension investments, general wage increases, workforce composition, retirement rates and mortality rates.
For post-employment benefits or compensated absences that do not vest or accumulate, a liability and expense for the expected cost of providing future benefits is recognized immediately in the period when the obligating event occurs. For example, benefits provided to employees in the event of an accident or injury would be recorded when the accident or injury occurs.
Since April 1 2000, amounts equal to contributions less benefit payments and other charges related to the public service, Canadian Forces—Regular Force and Royal Canadian Mounted Police pension plans, and since 2007 for the Canadian Forces—Reserve Force pension plan, that fall within the Income Tax Act limits are transferred to the Public Sector Pension Investment Board (PSPIB) for investment. Pension assets held by the PSPIB are valued at a market-related value. The government's accrued benefit obligations for pensions and other employee and veteran future benefits are presented net of pension assets, as well as unrecognized net actuarial gains and losses (discussed below) and amounts related to the plans of some consolidated Crown corporations and other entities, in arriving at the liability for pensions and other future benefits shown on the Consolidated Statement of Financial Position.
Since the government's obligations for pensions and other future benefits are recorded on a present value basis, interest expense is recorded each year and added to the obligations to reflect the passage of time, as these liabilities are one year closer to settlement. Interest expense is recorded net of the expected return on investments for funded pension benefits, and reported as part of public debt charges. Current service cost is recorded as part of other expenses excluding net actuarial losses on the Consolidated Statement of Operations and Accumulated Deficit.
When an employee ceases employment with the government, the government stops recording current service cost in respect of that employee. Benefits subsequently provided to the employee are recorded as reductions in the government's benefit obligation.
The government's obligations for pensions and other future benefits are re-estimated on an annual basis to reflect actual experience and updated actuarial assumptions. Increases or decreases in the estimated value of the obligations are referred to as actuarial losses and gains. Under Canadian public sector accounting standards, actuarial gains and losses are not recognized in the government's liabilities immediately due to their tentative nature and because further adjustments may be required in the future. Instead, these amounts are amortized to expense and to the government's liabilities over the expected average remaining service life of employees, which represents periods ranging from 5 to 23 years, according to the plan in question, or the average remaining life expectancy of benefit recipients under wartime veteran plans, which represents periods ranging from 6 to 7 years.
For plan amendments, curtailments and settlements that affect accrued benefit obligations for services already rendered by employees, the change in the government's obligations is reflected in the period of the amendment, curtailment or settlement and recorded as part of other expenses excluding net actuarial losses.
The following table illustrates the change in the government's liabilities for pensions and other future benefits, net of public sector pension assets, in 2020.
| Pensions | Other future benefits | Total | |
|---|---|---|---|
| Net future benefit liabilities at beginning of year | 166,376 | 113,862 | 280,238 |
| Add: | |||
| Benefits earned during the year | 7,687 | 8,334 | 16,021 |
| Interest on accrued benefit obligations, net of the expected return on investments | 2,684 | 3,395 | 6,079 |
| Net actuarial losses recognized during the year | 3,973 | 6,636 | 10,609 |
| Valuation allowance | 17 | – | 17 |
| Subtotal | 14,361 | 18,365 | 32,726 |
| Deduct: | |||
| Benefits paid during the year | 12,713 | 5,757 | 18,470 |
| Transfers to the PSPIB and funds held in external trustsLink to footnote 7 | 3,049 | – | 3,049 |
| Transfers to other plans and administrative expenses | 977 | 92 | 1,069 |
| Subtotal | 16,739 | 5,849 | 22,588 |
| Net (decrease) increase | (negative 2,378) | 12,516 | 10,138 |
| Net future benefit liabilities at end of year | 163,998 | 126,378 | 290,376 |
| Presented on the Consolidated Statement of Financial Position as: | |||
| Public sector pension liabilities | 168,596 | ||
| Other employee and veteran future benefit liabilities | 126,378 | ||
| Total pension and other future benefit liabilities | 294,974 | ||
| Public sector pension assets | 4,598 | ||
| Net pensions and other future benefit liabilities | 290,376 | ||
The increase in net liabilities for pensions and other future benefits in 2020 reflects the addition of $16.0 billion in future benefits earned by employees during the year, as well as $6.1 billion in net interest charges on the liabilities. The discount rates used in the measurement of the government-sponsored unfunded pension and benefit obligations and in calculating interest charges on the obligations are based on the actual zero-coupon yield curve for Government of Canada bonds at fiscal year-end. The discount rate used to value the government's obligations for funded pension benefits, which relate to post-March 2000 service under its three main pension plans―the public service, Canadian Forces–Regular Force, and Royal Canadian Mounted Police pension plans―as well as benefits under the Canadian Forces–Reserve Force pension plan is based on the streamed expected rates of return on invested funds.
The government's liabilities for pensions and other future benefits increased by an additional $10.6 billion in 2020 due to the amortization of actuarial gains and losses. As of March 31, 2020, the government had net unamortized losses of $143.6 billion. These losses will be amortized over time and recorded as part of net actuarial losses and as an increase in the government's liabilities.
The government also recorded a $17 million increase in liabilities for pensions to reflect the impact of a valuation allowance during the year.
These increases were offset in part by reductions in the liabilities for benefits paid during the year ($18.5 billion) and for net transfers to the PSPIB and funds held in external trusts for investment ($3.0 billion).
Further details on the federal public sector pensions and other employee and veteran future benefits are contained in Section 6 of this volume.
Interest-bearing debt stood at 47.1% of GDP in 2020, up from 46.1% in 2019. This ratio is down 27 percentage points from its high of 74.1% in 1996.
Graph - Interest-bearing debt
(as a percentage of GDP)
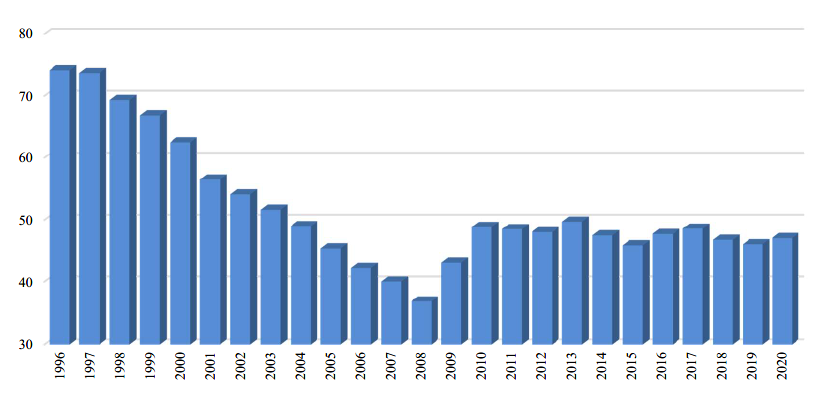
Image description
| Fiscal year | Percentage |
|---|---|
| 1996 | 74.1 |
| 1997 | 73.7 |
| 1998 | 69.4 |
| 1999 | 66.8 |
| 2000 | 62.5 |
| 2001 | 56.5 |
| 2002 | 54.1 |
| 2003 | 51.6 |
| 2004 | 49.0 |
| 2005 | 45.5 |
| 2006 | 42.3 |
| 2007 | 40.0 |
| 2008 | 36.9 |
| 2009 | 43.1 |
| 2010 | 48.9 |
| 2011 | 48.5 |
| 2012 | 48.1 |
| 2013 | 49.7 |
| 2014 | 47.5 |
| 2015 | 45.9 |
| 2016 | 47.7 |
| 2017 | 48.6 |
| 2018 | 46.8 |
| 2019 | 46.1 |
| 2020 | 47.1 |
The average effective interest rate on the government's interest-bearing debt in 2020 was 2.3%, unchanged from 2019. The average effective interest rate on unmatured debt in 2020 was 2.4%, while the average effective interest rate on pension and other liabilities was 2.2%.
Average effective interest rate on interest-bearing debt
(in percentage)
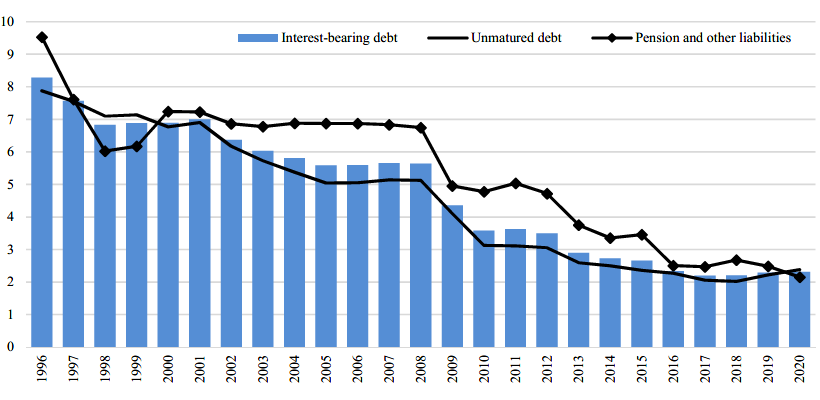
Image description
| Fiscal year | Interest-bearing debt percentage | Unmatured debt percentage | Pension and other liabilities percentage |
|---|---|---|---|
| 1996 | 8.3 | 7.9 | 9.5 |
| 1997 | 7.6 | 7.6 | 7.6 |
| 1998 | 6.8 | 7.1 | 6.0 |
| 1999 | 6.9 | 7.1 | 6.2 |
| 2000 | 6.9 | 6.8 | 7.2 |
| 2001 | 7.0 | 6.9 | 7.2 |
| 2002 | 6.4 | 6.2 | 6.9 |
| 2003 | 6.0 | 5.7 | 6.8 |
| 2004 | 5.8 | 5.4 | 6.9 |
| 2005 | 5.6 | 5.0 | 6.9 |
| 2006 | 5.6 | 5.0 | 6.9 |
| 2007 | 5.7 | 5.1 | 6.8 |
| 2008 | 5.6 | 5.1 | 6.7 |
| 2009 | 4.4 | 4.1 | 5.0 |
| 2010 | 3.6 | 3.1 | 4.8 |
| 2011 | 3.6 | 3.1 | 5.0 |
| 2012 | 3.5 | 3.1 | 4.7 |
| 2013 | 2.9 | 2.6 | 3.8 |
| 2014 | 2.7 | 2.5 | 3.4 |
| 2015 | 2.7 | 2.4 | 3.5 |
| 2016 | 2.3 | 2.3 | 2.5 |
| 2017 | 2.2 | 2.1 | 2.5 |
| 2018 | 2.2 | 2.0 | 2.7 |
| 2019 | 2.3 | 2.2 | 2.5 |
| 2020 | 2.3 | 2.4 | 2.2 |
Financial assets
Financial assets include cash on deposit with the Bank of Canada, chartered banks and other financial institutions, accounts receivable, foreign exchange accounts, loans, investments and advances, and public sector pension assets. The government's foreign exchange accounts include foreign currency deposits, investments in marketable securities, and subscriptions and loans to the IMF. Proceeds of the government's foreign currency borrowings are held in the Exchange Fund Account to provide foreign currency liquidity and provide funds needed to promote orderly conditions for the Canadian dollar in foreign exchange markets. Further details on the management of international reserves are available in the annual Report on the Management of Canada's Official International Reserves. The government's loans, investments and advances include its investments in and loans to enterprise Crown corporations, loans to national governments mainly for financial assistance and development of export trade, and loans under the Canada Student Loans Program.
Financial assets by category for 2020
Note: Numbers may not add to 100% due to rounding.
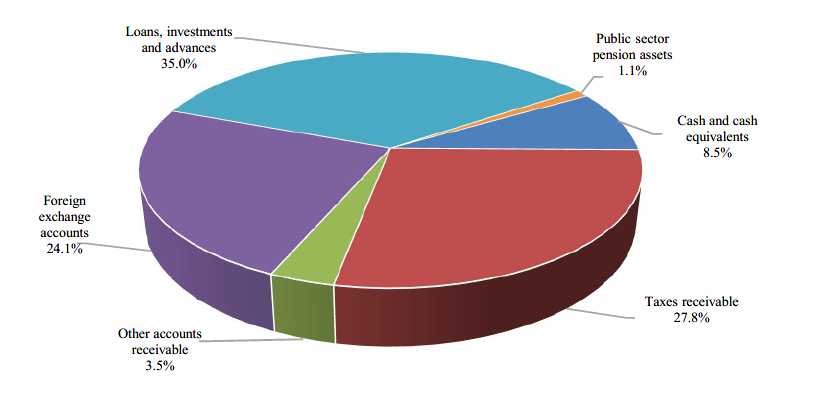
Image description
| Financial assets | Percentage |
|---|---|
| Cash and cash equivalents | 8.5% |
| Taxes receivable | 27.8% |
| Other accounts receivable | 3.5% |
| Foreign exchange accounts | 24.1% |
| Loans, investments and advances | 35.0% |
| Public sector pension assets | 1.1% |
At March 31, 2020, financial assets amounted to $435.7 billion, up $22.7 billion from March 31, 2019. The increase in financial assets reflects increases in foreign exchange accounts, loans, investments and advances, and public sector pension assets, offset in part by a decrease in cash and accounts receivable.
At March 31, 2020, cash and accounts receivable totalled $173.7 billion, down $3.3 billion from March 31, 2019. Within this component, cash and cash equivalents decreased by $0.4 billion. The balance of cash and cash equivalents includes $20 billion that has been designated as a deposit held with respect to prudential liquidity management. Taxes receivable decreased by $6.5 billion during 2020 to $121.1 billion, largely stemming from the COVID-19 pandemic and deferrals of tax filing deadlines announced as part of the government's relief measures. Other accounts receivable increased by $3.5 billion, largely due to a $2.8-billion increase in cash collateral under International Swaps and Derivatives Association agreements in respect of outstanding cross-currency swap agreements and a $0.5-billion increase in dividends receivable from the Bank of Canada at year-end.
Loans, investments and advances in enterprise Crown corporations and other government business enterprises increased by $16.9 billion in 2020. Capital investments in enterprise Crown corporations and other government business enterprises increased by $1.8 billion, largely reflecting support for COVID-19 liquidity and capital relief measures for businesses under the Business Credit Availability Program administered by the Business Development Bank of Canada, as well as support for additional lending capacity under Farm Credit Canada. Investments in enterprise Crown corporations and other government business enterprises grew by an additional $3.8 billion, primarily reflecting $3.6 billion in net profits and $3.5 billion in other comprehensive income recorded by these entities during 2020, offset in part by $3.6 billion in dividends paid to the government. Net loans and advances were up $11.9 billion, primarily reflecting a $10.5-billion increase in loans to Crown corporations under the consolidated borrowing framework, and $1.5 billion in financing to the Canada Development Investment Corporation (CDEV) from the Canada Account to finance construction activities for the Trans Mountain expansion project.
Other loans, investments and advances increased by $1.7 billion, from $25.7 billion to $27.4 billion, largely reflecting an increase in loans and unconditionally repayable contributions to industry, as well as growth in the Canada Student Loans portfolio, reflecting in part measures announced in Budget 2016, which increased the number of students participating in the program as well as the number of students eligible to receive the maximum loan amounts.
Public sector pension assets increased by $2.2 billion, largely reflecting an increase in the net assets under the Public Service Pension Fund.
Foreign exchange accounts increased by $5.2 billion in 2020, totalling $104.9 billion at March 31, 2020, due mainly to foreign exchange gains on the translation of the net assets denominated in foreign currencies to Canadian dollar equivalents as at March 31, 2020.
Since the accumulated deficit reached its post-World War II peak of 66.6% of GDP at March 31, 1996, financial assets have increased by $343.1 billion, mainly reflecting higher levels of cash and cash equivalents and accounts receivable (up $121.1 billion), an increase in the foreign exchange accounts (up $85.8 billion), and an increase in loans, investments and advances (up $131.5 billion). The increase in cash and cash equivalents and accounts receivable is largely attributable to growth in taxes receivable, broadly in line with the growth in the applicable tax bases. The increase in the foreign exchange accounts reflects a decision by the government in the late 1990s and more recently in the 2012 Debt Management Strategy to increase liquidity in these accounts. The increase in loans, investments and advances is attributable to several factors including the accumulation of net profits from enterprise Crown corporations, the government taking over the financing of the Canada Student Loans Program from the chartered banks in 2000, and the issuance of direct loans to Crown corporations under the government's consolidated borrowing framework implemented in 2008.
Graph - Financial assets
(in billions of dollars)
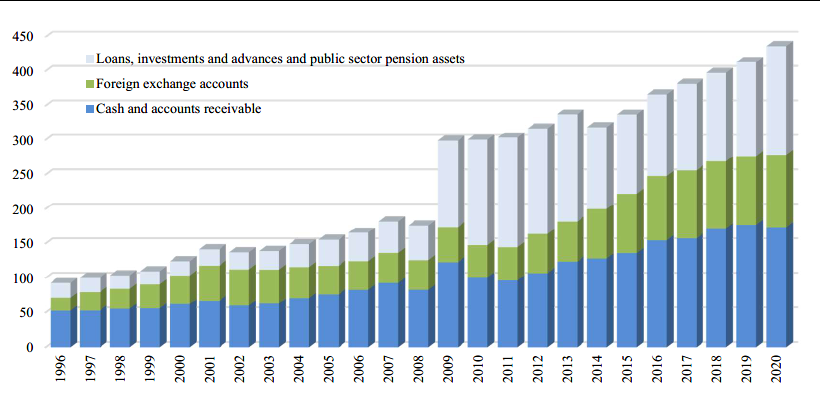
Image description
| Fiscal year | Cash and accounts receivable | Foreign exchange accounts | Loans, investments and advances and public sector pension assets |
|---|---|---|---|
| 1996 | 52.6 | 19.1 | 21.0 |
| 1997 | 52.8 | 26.8 | 20.8 |
| 1998 | 55.3 | 29.0 | 19.4 |
| 1999 | 55.9 | 34.7 | 18.7 |
| 2000 | 61.9 | 41.5 | 20.1 |
| 2001 | 67.1 | 50.3 | 24.5 |
| 2002 | 59.9 | 52.0 | 25.7 |
| 2003 | 62.7 | 49.0 | 27.8 |
| 2004 | 71.0 | 44.3 | 33.8 |
| 2005 | 76.3 | 40.9 | 38.2 |
| 2006 | 82.8 | 40.8 | 41.9 |
| 2007 | 92.6 | 44.2 | 45.1 |
| 2008 | 82.9 | 42.3 | 50.9 |
| 2009 | 122.1 | 51.7 | 125.1 |
| 2010 | 100.8 | 47.0 | 152.7 |
| 2011 | 96.3 | 48.5 | 158.5 |
| 2012 | 106.7 | 57.0 | 152.9 |
| 2013 | 123.0 | 58.8 | 154.9 |
| 2014 | 127.6 | 72.3 | 118.6 |
| 2015 | 136.5 | 85.0 | 114.9 |
| 2016 | 154.6 | 93.5 | 117.6 |
| 2017 | 157.3 | 98.8 | 125.9 |
| 2018 | 172.1 | 96.9 | 128.5 |
| 2019 | 177.0 | 99.7 | 136.3 |
| 2020 | 173.7 | 104.9 | 157.1 |
Net debt
The government's net debt—its total liabilities less financial assets—stood at $812.9 billion at March 31, 2020. Net debt was 35.3% of GDP, up 0.6 percentage points from a year earlier, and 36.7 percentage points below its peak of 72.0% at March 31, 1996.
This ratio measures debt relative to the ability of the country's taxpayers to finance it. Total liabilities are reduced only by financial assets as non-financial assets cannot normally be converted to cash to pay off the debt without disrupting government operations.
Graph - Net debt
(as percentage of GDP)
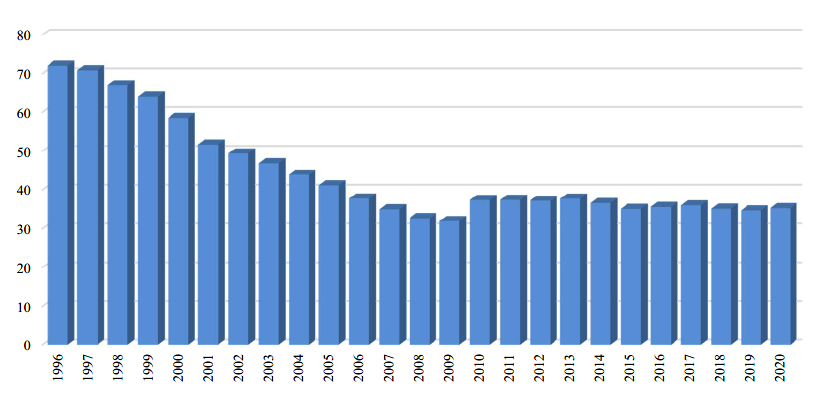
Image description
| Fiscal year | Percentage |
|---|---|
| 1996 | 72.0 |
| 1997 | 70.8 |
| 1998 | 66.9 |
| 1999 | 64.1 |
| 2000 | 58.5 |
| 2001 | 51.7 |
| 2002 | 49.4 |
| 2003 | 46.9 |
| 2004 | 43.9 |
| 2005 | 41.1 |
| 2006 | 37.8 |
| 2007 | 35.0 |
| 2008 | 32.7 |
| 2009 | 32.0 |
| 2010 | 37.4 |
| 2011 | 37.4 |
| 2012 | 37.2 |
| 2013 | 37.7 |
| 2014 | 36.6 |
| 2015 | 35.1 |
| 2016 | 35.6 |
| 2017 | 36.0 |
| 2018 | 35.2 |
| 2019 | 34.7 |
| 2020 | 35.3 |
International comparisons of net debt
Jurisdictional responsibility (between central, state and local levels of government) for government programs differs among countries. As a result, international comparisons of government fiscal positions are undertaken on a total government, National Accounts, basis. For Canada, total government net debt includes that of the federal, provincial/territorial and local governments, as well as the net assets held in the Canada Pension Plan and Quebec Pension Plan.
Canada has the lowest total government net debt burden among G7 countries
G7 total government net debt, 2019
(as a percentage of GDP)
Source: IMF
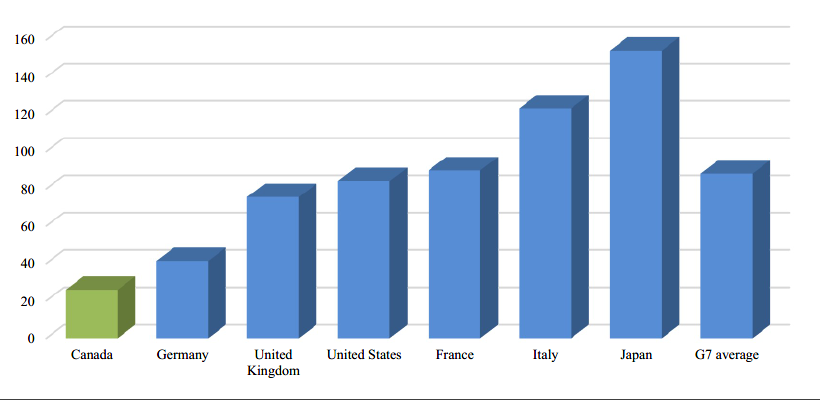
Image description
| Country | Percentage |
|---|---|
| Canada | 25.9 |
| Germany | 41.3 |
| United Kingdom | 75.5 |
| United States | 84.1 |
| France | 89.8 |
| Italy | 123.1 |
| Japan | 154.3 |
| G7 average | 88.1 |
Canada's total government net debt-to-GDP ratio stood at 25.9% in 2019, according to the IMF. This is the lowest level among G7 countries, which the IMF estimates will record an average net debt of 88.1% of GDP in that same year.
The following table provides a reconciliation between the Government of Canada's accumulated deficit-to-GDP ratio and Canada's total government net debt-to-GDP ratio. Importantly, Canada's total government net debt-to-GDP ratio includes the net debt of the federal, provincial, territorial and local governments, as well as the net assets held by the Canada Pension Plan and Quebec Pension Plan, while excluding liabilities for public sector pensions and other employee future benefits.
| (% of GDP) | |
|---|---|
| Accumulated deficit | 31.3 |
| Add: Non-financial assets | 4.0 |
| Net debt (Public Accounts basis) | 35.3 |
| Less: | |
| Liabilities for public sector pensions | (negative 7.3) |
| Liabilities for other future benefits | (negative 5.5) |
| National Accounts/Public Accounts methodological differences and timing adjustmentsLink to footnote 8 | (negative 3.5) |
| Total federal net debt (National Accounts basis) | 18.9 |
| Add: Net debt of provincial/territorial and local governments | 20.1 |
| Less: Net assets of the CPP/QPP | (negative 13.2) |
| Total government net debtLink to footnote 9 | 25.8 |
Non-financial assets
Non-financial assets include the net book value of the government's tangible capital assets, which include land, buildings, works and infrastructure such as roads and bridges, machinery and equipment, ships, aircraft and other vehicles. Non-financial assets also include inventories and prepaid expenses and other non-financial assets.
Non-financial assets by category for 2020
Note: Numbers may not add to 100% due to rounding.
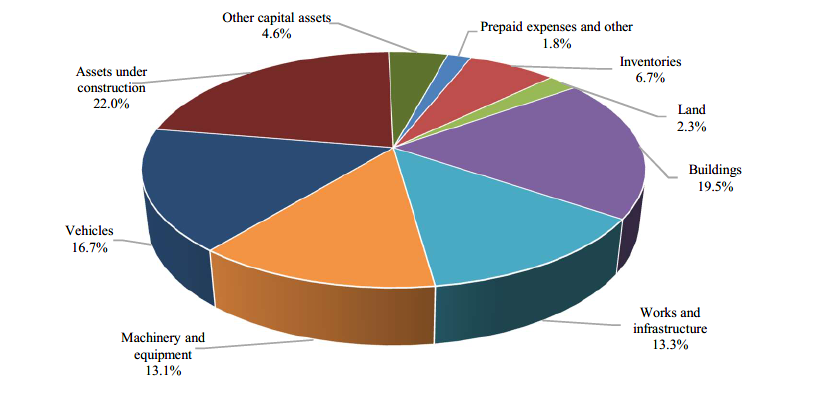
Image description
| Non-financial assets | Percentage |
|---|---|
| Prepaid expenses and other | 1.8 |
| Inventories | 6.7 |
| Land | 2.3 |
| Buildings | 19.5 |
| Works and infrastructure | 13.3 |
| Machinery and equipment | 13.1 |
| Vehicles | 16.7 |
| Assets under construction | 22.0 |
| Other capital assets | 4.6 |
At March 31, 2020, non-financial assets stood at $91.5 billion, up $4.9 billion from a year earlier. Of this growth, $4.7 billion relates to an increase in tangible capital assets and $0.5 billion relates to an increase in prepaid expenses, offset in part by a $0.4-billion decrease in inventories.
At March 31, 2020, 59.4% of the original cost of the government's depreciable tangible capital assets had been amortized, a decrease of 1.1% from a year earlier. Depreciable tangible capital assets exclude land, and assets under construction, which are not yet available for use.
Tangible capital asset cost
(in billions of dollars)
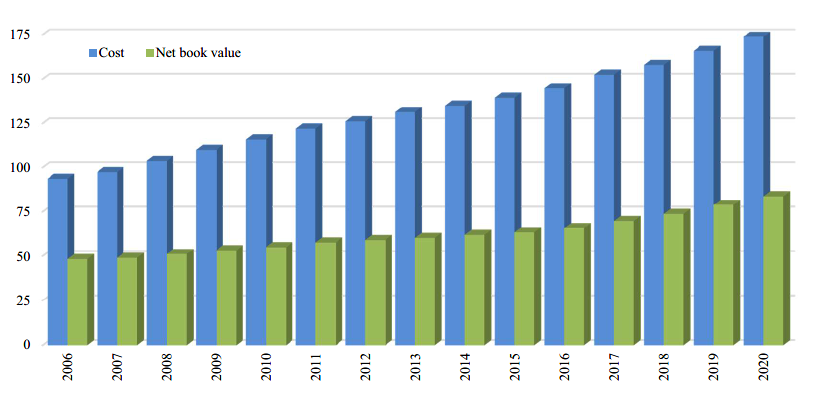
Image description
| Fiscal year | Cost | Net Book Value |
|---|---|---|
| 2006 | 93.8 | 48.4 |
| 2007 | 97.5 | 49.0 |
| 2008 | 103.5 | 51.2 |
| 2009 | 110.1 | 53.3 |
| 2010 | 115.7 | 55.1 |
| 2011 | 122.1 | 57.7 |
| 2012 | 126.1 | 59.0 |
| 2013 | 131.3 | 60.2 |
| 2014 | 135.0 | 61.9 |
| 2015 | 139.4 | 63.3 |
| 2016 | 144.6 | 65.8 |
| 2017 | 152.4 | 69.9 |
| 2018 | 157.7 | 73.8 |
| 2019 | 165.9 | 78.9 |
| 2020 | 173.7 | 83.7 |
The federal government has entered into a number of public-private partnerships (P3s) to design, build, finance and/or operate and maintain large infrastructure projects. Assets under construction totalled $20.1 billion at March 31, 2020, some of which are being built using P3s in which the private sector finances the assets during construction. The government's liability for these long-term financing arrangements is included in obligations under public-private partnerships reported in Note 9 of the consolidated financial statements.
The government has a robust policy framework for the management of assets and acquired services. The framework sets the direction for management of assets to ensure the conduct of activities provides value for money and demonstrates sound stewardship in program delivery.
Cash flow
The annual surplus or deficit is presented on an accrual basis of accounting, recognizing revenue in the period it is earned and expenses when incurred, regardless of when the associated cash is received or paid. In contrast, the government's net cash flow measures the difference between cash coming in to the government and cash going out.
In 2020, the government had a total cash requirement of $37.8 billion before financing activities, compared to a total cash requirement of $9.1 billion before financing activities in 2019. Operating activities resulted in a net cash requirement of $15.3 billion in 2020, compared to a net cash source of $4.7 billion in 2019. Cash used by capital investment activities resulted in a net cash requirement of $9.4 billion in 2020, compared to a net cash requirement of $9.5 billion in 2019. Cash used by investing activities totalled $13.1 billion in 2020, compared to $4.3 billion in 2019.
| 2020 | 2019 | |
|---|---|---|
| Cash (used) provided by operating activitiesLink to footnote 10 | (negative 15,287) | 4,688 |
| Cash used by capital investment activities | (negative 9,441) | (negative 9,545) |
| Cash used by investing activitiesLink to footnote 10 | (negative 13,052) | (negative 4,252) |
| Total cash used before financing activities | (negative 37,780) | (negative 9,109) |
| Cash provided by financing activities | 37,387 | 12,102 |
| Net (decrease) increase in cash and cash equivalents | (negative 393) | 2,993 |
| Cash and cash equivalents at beginning of year | 37,635 | 34,642 |
| Cash and cash equivalents at end of year | 37,242 | 37,635 |
Financing activities generated a $37.4-billion source of cash in 2020, resulting in an overall net decrease in cash of $0.4 billion. The level of cash and cash equivalents stood at $37.2 billion at March 31, 2020.
Contractual obligations and contractual rights
The nature of the government's operations results in large multi-year contracts and agreements that will generate expenses, liabilities and cash outflows in future years. Major contractual obligations of the government relate to transfer payments, capital assets and purchases, operating leases, public-private partnership arrangements, and payments to international organizations. As of March 31, 2020, future payments under contractual obligations totalled $179.4 billion ($162.5 billion as of March 31, 2019).
Similarly, the activities of government can also involve the negotiation of contracts or agreements with third parties that result in the government having rights to both assets and revenues in the future. These arrangements typically relate to sales of goods and services, leases of property, and royalties and profit-sharing arrangements. The terms of these contracts and agreements may not always allow for a reasonable estimate of revenues in the future. For contracts and agreements that do allow for a reasonable estimate, total revenues to be received in the future under major contractual rights are estimated at $37.2 billion at March 31, 2020 ($40.4 billion as of March 31, 2019).
Further details regarding the government's contractual obligations and contractual rights are provided in Section 11, Contractual obligations, contractual rights and contingent liabilities, of this volume.
Risks and uncertainties
The government's financial results are subject to risks and uncertainties inherent in the nature of certain financial statement elements and government operations, including:
- changes in economic conditions—particularly changes in economic growth, inflation and interest rates;
- outcomes from litigation, arbitration and negotiations with third parties, and the resolution of taxes under objection;
- identification and quantification of environmental liabilities;
- ageing tangible capital assets, including information technology infrastructure;
- costs associated with dismantling capital assets at the end of their useful lives;
- credit risk and foreign currency risk associated with the government's financial assets, including loans, investments and advances and foreign exchange accounts;
- demand for public services and changes in other expenses, including pension expense, that reflect actual experience that is significantly different from forecast;
- delays and unexpected cost increases associated with large-scale investment projects; and,
- unforeseen situations such as natural catastrophes, or more currently, the COVID-19 pandemic.
In the current context, uncertainty has been magnified to unprecedented levels. With extraordinary speed and breadth, the COVID-19 pandemic has affected nearly all aspects of life, and the toll of COVID-19 on the global economy is expected to be the largest and most sudden contraction since the Great Depression. The economic and fiscal developments, including those related to the COVID-19 crisis, that occurred between the Economic and Fiscal Update 2019 and the Economic and Fiscal Snapshot 2020 are estimated to have lowered the 2021 budgetary balance by $81.3 billion.
The economic recovery will depend on Canada's ability to hold the rate of transmission of the virus down. However, many unknowns remain surrounding the path of the virus in key Canadian trading partners, and whether or not the world experiences a resurgence of uncontrolled transmission. Given the unique characteristics of the crisis, and the numerous unknowns surrounding the virus, many alternative paths are possible for the economic recovery.
The government is taking significant steps to prepare for and achieve a safe and gradual restart of the economy, while investing in testing, tracing and health system capacity to mitigate and manage a possible resurgence of the virus. However, the Canadian economy is likely to require ongoing policy support. In the coming months, and as needed, the government will announce additional measures to support the recovery.
The government's financial statements typically incorporate a number of significant estimates and assumptions related to risks and uncertainties that are used in valuing its assets, liabilities, revenues and expenses. One of the most significant areas of measurement uncertainty relates to public sector pensions and other employee future benefits, for which payments are made many years into the future and are dependent upon the evolution of factors such as wage increases, workforce composition, retirement rates, mortality rates, and expected returns on pension investments. In developing its best estimates and assumptions, the government takes into consideration historical experience, current facts and circumstances, and expected future developments. The government's financial results are also subject to volatility as a result of year-over-year changes in the discount rates used to value its pension and benefit obligations. Changes in these discount rates result in unrealized gains and losses that are amortized to expenses.
Another significant area of measurement uncertainty relates to contingent liabilities. Contingent liabilities represent possible obligations that may result in future payments when one or more events occur or fail to occur. Examples of contingent liabilities include loan guarantees; insurance programs, including the Deposit Insurance Fund operated by the Canada Deposit Insurance Corporation and the Mortgage Insurance Fund operated by Canada Mortgage and Housing Corporation; callable share capital in international financial institutions; and claims and pending and threatened litigation. As of March 31, 2020, the government's contingent liabilities totalled roughly $2 trillion. However, the vast majority of this amount represents situations where the probability of a future payment is assessed as unlikely or not determinable. The government records a provision for contingent liabilities only in cases where the probability of future payment is considered likely. As of March 31, 2020, this provision totalled $24.9 billion.
The COVID-19 pandemic has led to additional measurement uncertainty in the preparation of the government's 2020 consolidated financial statements. Historical experience related to certain estimates in the consolidated financial statements may not be relevant, or may not be as reliable as before, in predicting future outcomes. This may lead to a greater possibility of a material variance between estimates recognized or disclosed in the consolidated financial statements and the results ultimately realized. Balances subject to additional measurement uncertainty due to the pandemic include tax revenues, provisions for accounts receivable, contingent liabilities, pensions and other future benefits and loans, investments and advances, including those that may result from lending programs of enterprise Crown corporations.
Looking to 2021, the COVID-19 pandemic and the Economic Response Plan are expected to result in significant changes in the government's revenues, expenses, assets and liabilities. The decline in economic activity will worsen the overall fiscal environment as tax revenues decline and the relative size of the deficit increases in proportion to lower levels of output in the economy. Expenses are expected to increase significantly, reflecting spending under various support programs, including the CERB, Canada Emergency Wage Subsidy, and transfers to provinces and territories under the Safe Restart Agreement. Loans, investments and advances are also expected to increase, reflecting loans advanced under the Canada Emergency Business Account program. The financial position and results of the government's enterprise Crown corporations will also be impacted, such as through loans and guarantees provided by the Business Development Bank of Canada and Export Development Canada under the Business Credit Availability Program, and through various liquidity support programs provided by the Bank of Canada. The magnitude of these impacts will depend on program uptake as well as the economic recovery.
The Government of Canada's debt program will increase significantly in 2021 in order to finance necessary temporary investments to stabilize the Canadian economy amidst the extraordinary circumstances of the COVID-19 pandemic. Despite the significant increase in borrowing, record low interest rates have made Canada's debt significantly more affordable.
A significant proportion of extraordinary borrowings early in 2021 consisted of short-term instruments, mainly treasury bills, given the ability to issue these instruments in volume quickly to raise needed funding. However, the government is planning to significantly increase long-term bonds to lock in funding at historically low interest rates. The government has also been increasing bond issuances steadily to help manage rollover risk, reduce pressure on the treasury bill sector, and ultimately rebuild contingency capacity in the event that significant funding is needed again in short order. Given a historic level of issuance overall and particularly in long-term bonds, the government will consult with market participants and experts to assess and review the market's capacity for long-term debt. Adjustments to the debt strategy may be made as warranted to maintain stability in Canada's fixed-income markets in these evolving circumstances, taking into account the requirements of other issuers, such as provinces, municipalities and corporations.
The government's assumptions related to risks and uncertainties used in determining its financial results are reassessed at each fiscal year-end and updated as necessary. Exposure to measurement uncertainty from the use of accounting and other estimates in recording certain transactions is discussed in the notes to the consolidated financial statements. Further details with respect to the measurement of the government's tax revenues, provisions for accounts receivable, contingent liabilities, environmental liabilities, pensions and other future benefits, and loans, investments and advances are included in the notes to the consolidated financial statements of the Government of Canada. Note 18 of the consolidated financial statements provides information on instruments and strategies used by the government to manage financial risks associated with its financial assets and liabilities.
The government manages risks to its fiscal projections due to changes in economic conditions by regularly surveying private sector economists on their views on the outlook for the Canadian economy and by monitoring its financial results on an ongoing basis to assess potential risks and guide its financial decisions. However, as noted in the July 2020 Economic and Fiscal Snapshot, there is a wider divergence of views surrounding the economic outlook than during normal times and all projections should be considered with caution.
The government also typically prepares long-term economic and fiscal projections, which provide a broad analysis of its fiscal position, allowing the government to respond more effectively to upcoming challenges and protect the long-term sustainability of public finances. These projections are available on the Department of Finance Canada's website.
Public Accounts of Canada 2020 Volume I: Bottom of the page Navigation
- Previous page: Section 1: Financial statements discussion and analysis
- Section 1: Table of contents: Section 1: Financial statements discussion and analysis
- Next page: Ten-year comparative financial information
- Date modified: