Financial reporting—The Long Term Vision and Plan Annual Report 2015 to 2016
Total program expenditures
Figure 21—Total Long Term Vision and Plan Program expenditures (in millions of dollars)
| Budget | Expenditures | Forecast | ||||||
|---|---|---|---|---|---|---|---|---|
| Programs | Project approval | Expenditure authority | 2015 to 2016 budget |
2015 to 2016 expenditures |
Prior years expenditures | Cumulative expenditures up to 2015 to 2016 | Planned expenditures 2016 to 2017 Footnote 2 |
Planned expenditures 2017 to 2018 and future years Footnote 2 |
| Total Major capital program Footnote 1 |
2,659.2 | 2,504.4 | 346.6 | 328.0 | 1,483.3 | 1,811.4 | 289.6 | 557.7 |
| Total Recapitalization program | 255.0 | 254.0 | 23.8 | 23.6 | 147.3 | 170.9 | 21.0 | 5.8 |
| Total Building Components and Connectivity program | 156.1 | 142.2 | 19.5 | 23.1 | 100.9 | 124.0 | 16.3 | 6.5 |
| Total Planning program | 145.7 | 80.0 | 18.1 | 13.1 | 47.6 | 60.7 | 12.9 | 10.1 |
| Grand total Long Term Vision and Plan (LTVP) | 3,215.9 | 2,980.6 | 408.0 | 387.8 | 1,779.1 | 2,167.0 | 339.8 | 580.1 |
Remarks: Numbers may not add up due to rounding. Planned forecasts may require project approval and/or expenditure authority amendment.
Major capital program
Figure 22—Major capital program project expenditures (in millions of dollars) and delivery timelines
| Budget | Expenditures | Forecast | Construction completion dates Footnote 3 |
||||||
|---|---|---|---|---|---|---|---|---|---|
| Projects | Project approval | Expenditure authority | 2015 to 2016 budget |
2015 to 2016 expenditures |
Prior years expenditures | Cumulative expenditures up to 2015 to 2016 | Planned expenditures 2016 to 2017 Footnote 2 |
Planned expenditures 2017 to 2018 and future years Footnote 2 |
|
| West Block rehabilitation | 862.9 | 862.9 | 156.9 | 134.9 | 342.3 | 477.2 | 160.0 | 225.7 | 2017 |
| Wellington Building renovation | 425.2 | 425.2 | 95.0 | 95.1 | 298.9 | 394.0 | 22.5 | 8.7 | 2016 |
| Visitor Welcome Centre—phase 1 Footnote 4 |
129.9 | 129.9 | 14.7 | 14.7 | 19.6 | 34.3 | 23.0 | 72.6 | 2017 |
| Senate interim accommodations (Government Conference Centre) | 273.3 | 223.6 | 36.5 | 36.8 | 19.3 | 56.1 | 35.0 | 173.2 | 2018 |
| East Block 1867 wing exterior rehabilitation | 185.6 | 82.7 | 8.0 | 8.2 | 18.3 | 26.4 | 6.0 | 50.2 | TBD |
| Sir John A. Macdonald Building | 99.5 | 99.5 | 5.3 | 5.1 | 93.2 | 98.3 | 1.2 | 0.0 | 2015 |
| Library of Parliament | 134.1 | 134.1 | 0.0 | 0.0 | 134.1 | 134.1 | 0.0 | 0.0 | 2006 |
| Parliament Hill emergency power | 9.7 | 9.7 | 0.9 | 1.2 | 0.0 | 1.2 | 8.5 | 0.0 | 2017 |
| Perimeter safety hoarding and overhead protection | 2.0 | 2.0 | 0.0 | 0.8 | 0.8 | 1.7 | 0.0 | 0.0 | 2015 |
| Leases, fit-ups and others Footnote 1 |
537.0 | 534.9 | 29.4 | 31.3 | 556.8 | 588.1 | 33.4 | 27.2 | N/A |
| Total Major capital program | 2,659.2 | 2,504.4 | 346.6 | 328.0 | 1,483.3 | 1,811.4 | 289.6 | 557.7 | N/A |
Remarks: Numbers may not add up due to rounding. Planned forecasts may require project approval and/or expenditure authority amendment.
Figure 23—Major capital program project spending—Fiscal year 2015 to 2016 (in millions of dollars)
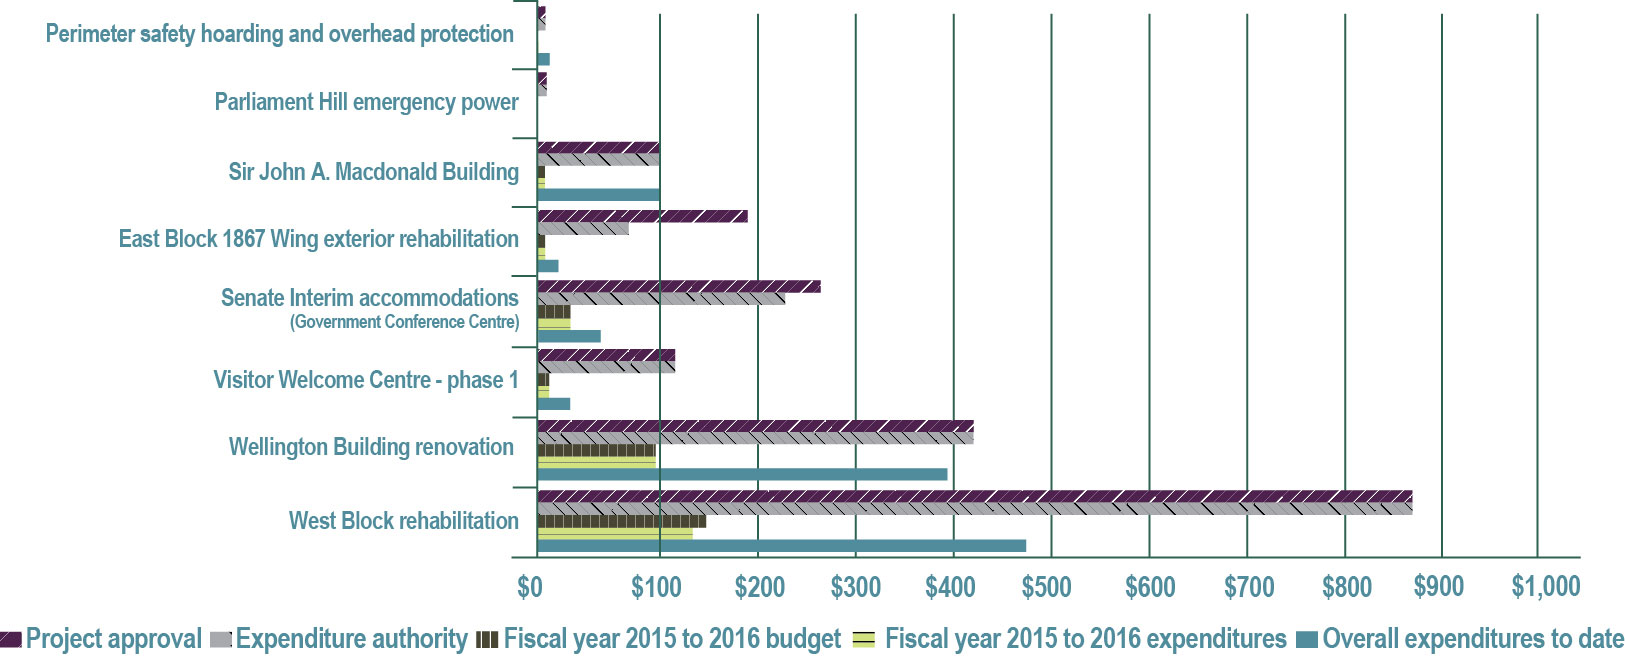
Table equivalent of figure 23—Major capital program project spending—Fiscal year 2015 to 2016 (in millions of dollars)
| Project approval | Expenditure authority | Fiscal year 2015 to 2016 budget | Fiscal year 2015 to 2016 expenditures | Overall expenditures to date | |
|---|---|---|---|---|---|
| West Block rehabilitation | $862.9 | $862.9 | $156.9 | $134.9 | $477.2 |
| Wellington Building renovation | $425.2 | $425.2 | $95.0 | $95.1 | $394.0 |
| Visitor Welcome Centre—phase 1 | $129.9 | $129.9 | $14.7 | $14.7 | $34.3 |
| Senate interim accommodations (Government Conference Centre) | $273.3 | $223.6 | $36.5 | $36.8 | $56.1 |
| East Block 1867 wing exterior rehabilitation | $185.6 | $82.7 | $8.0 | $8.2 | $26.4 |
| Sir John A. Macdonald Building | $99.5 | $99.5 | $5.3 | $5.1 | $98.3 |
| Parliament Hill emergency power | $9.7 | $9.7 | $0.9 | $1.2 | $1.2 |
| Perimeter safety hoarding and overhead protection | $2.0 | $2.0 | $0.0 | $0.8 | $1.7 |
Recapitalization program
Figure 24—Recapitalization program project expenditures (in millions of dollars) and delivery timelines
| Budget | Expenditures | Forecast | Construction completion dates Footnote 3 |
||||||
|---|---|---|---|---|---|---|---|---|---|
| Projects | Project approval | Expenditure authority | 2015 to 2016 budget |
2015 to 2016 expenditures |
Prior years expenditures | Cumulative expenditures up to 2015 to 2016 | Planned expenditures 2016 to 2017 Footnote 2 |
Planned expenditures 2017 to 2018 and future years Footnote 2 |
|
| Centre Block ventilation towers envelope rehabilitation | 21.3 | 21.3 | 6.9 | 6.8 | 8.5 | 15.3 | 6.0 | 0.0 | 2016 |
| Centre Block East and West Pavilions envelope rehabilitation | 17.1 | 17.1 | 5.7 | 5.6 | 7.5 | 13.1 | 4.0 | 0.0 | 2016 |
| Centre Block various short-term repairs | 6.4 | 6.4 | 0.4 | 0.4 | 4.6 | 5.0 | 0.0 | 0.0 | 2015 |
| Centre Block House of Commons Chamber modifications | 3.5 | 3.5 | 0.9 | 0.9 | 1.6 | 2.5 | 0.0 | 0.0 | 2015 |
| Confederation Building high/ low voltage system | 4.1 | 4.1 | 1.7 | 1.7 | 0.6 | 2.2 | 1.9 | 0.0 | 2016 |
| Confederation Building window frame stabilization and sash rehabilitation | 7.8 | 7.8 | 3.1 | 3.1 | 1.4 | 4.5 | 3.4 | 0.0 | 2016 |
| North perimeter wall rehabilitation Parliament Hill grounds | 16.8 | 16.8 | 3.8 | 3.8 | 8.9 | 12.7 | 4.1 | 0.0 | 2016 |
| West slope infrastructure rehabilitation | 10.3 | 10.3 | 1.3 | 1.3 | 8.7 | 10.0 | 0.3 | 0.0 | 2016 |
| Other Recapitalization | 167.7 | 166.7 | 0.0 | 0.0 | 105.6 | 105.6 | 1.4 | 5.8 | N/A |
| Total Recapitalization program | 255.0 | 254.0 | 23.8 | 23.6 | 147.3 | 170.9 | 21.0 | 5.8 | N/A |
Remarks: Numbers may not add up due to rounding. Planned forecasts may require project approval and/or expenditure authority amendment.
Figure 25—Recapitalization program project spending—Fiscal year 2015 to 2016 (in millions of dollars)
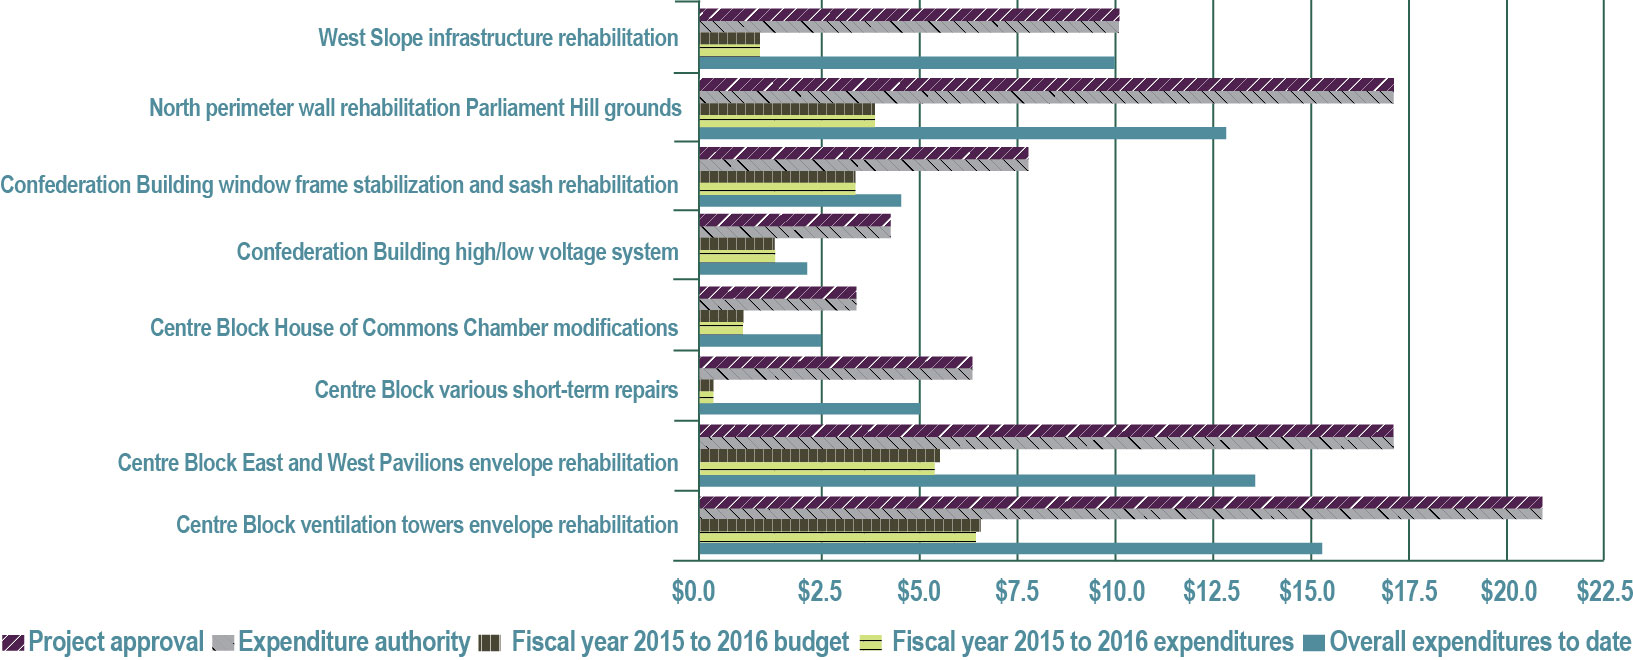
Table equivalent of figure 25—Recapitalization program project spending—Fiscal year 2015 to 2016 (in millions of dollars)
| Project approval | Expenditure authority | Fiscal year 2015 to 2016 budget | Fiscal year 2015 to 2016 expenditures | Overall expenditures to date | |
|---|---|---|---|---|---|
| Centre Block ventilation towers envelope rehabilitation | $21.3 | $21.3 | $6.9 | $6.8 | $15.3 |
| Centre Block East and West Pavilions envelope rehabilitation | $17.1 | $17.1 | $5.7 | $5.6 | $13.1 |
| Centre Block various short-term repairs | $6.4 | $6.4 | $0.4 | $0.4 | $5.0 |
| Centre Block House of Commons Chamber modifications | $3.5 | $3.5 | $0.9 | $0.9 | $2.5 |
| Confederation Building high/low voltage system | $4.1 | $4.1 | $1.7 | $1.7 | $2.2 |
| Confederation Building window frame stabilization and sash rehabilitation | $7.8 | $7.8 | $3.1 | $3.1 | $4.5 |
| North perimeter wall rehabilitation Parliament Hill grounds | $16.8 | $16.8 | $3.8 | $3.8 | $12.7 |
| West slope infrastructure rehabilitation | $10.3 | $10.3 | $1.3 | $1.3 | $10.0 |
Building Components and Connectivity program
Figure 26—Building Components and Connectivity program project expenditures (in millions of dollars) and delivery timelines
| Budget | Expenditures | Forecast | Construction completion dates Footnote 3 |
||||||
|---|---|---|---|---|---|---|---|---|---|
| Projects | Project approval | Expenditure authority | 2015 to 2016 budget |
2015 to 2016 expenditures |
Prior years expenditures | Cumulative expenditures up to 2015 to 2016 | Planned expenditures 2016 to 2017 Footnote 2 |
Planned expenditures 2017 to 2018 and future years Footnote 2 |
|
| Wireless networking | 10.1 | 10.1 | 2.8 | 3.3 | 4.9 | 8.2 | 1.8 | 0.1 | 2017 |
| Trunked radio communication system | 15.9 | 15.9 | 2.3 | 2.7 | 12.6 | 15.3 | 0.6 | 0.1 | 2016 |
| Integrated security system upgrade and expansion | 16.8 | 16.8 | 1.8 | 2.1 | 9.6 | 11.7 | 5.1 | 0.0 | 2017 |
| Core network infrastructure revision Footnote 6 |
11.8 | 11.8 | 3.9 | 4.7 | 5.0 | 9.7 | 2.0 | 0.2 | 2017 |
| Parliament Hill pathway connectivity | 15.5 | 15.5 | 1.3 | 1.6 | 11.2 | 12.8 | 0.3 | 2.4 | 2018 |
| Next generation network infrastructure—telephony | 11.9 | 5.6 | 2.2 | 2.6 | 0.0 | 2.6 | 3.0 | 0.0 | 2018 |
| Master control and distribution upgrade | 6.0 | 6.0 | 4.5 | 5.3 | 0.0 | 5.3 | 0.6 | 0.0 | 2016 |
| Other Building Components and Connectivity | 68.1 | 60.5 | 0.7 | 0.8 | 57.6 | 58.4 | 3.0 | 3.8 | N/A |
| Total Building Components and Connectivity program | 156.1 | 142.2 | 19.5 | 23.1 | 100.9 | 124.0 | 16.3 | 6.5 | N/A |
Remarks: Numbers may not add up due to rounding. Planned forecasts may require project approval and/or expenditure authority amendment.
Figure 27—Building Components and Connectivity program project spending—Fiscal year 2015 to 2016 (in millions of dollars) and delivery timelines
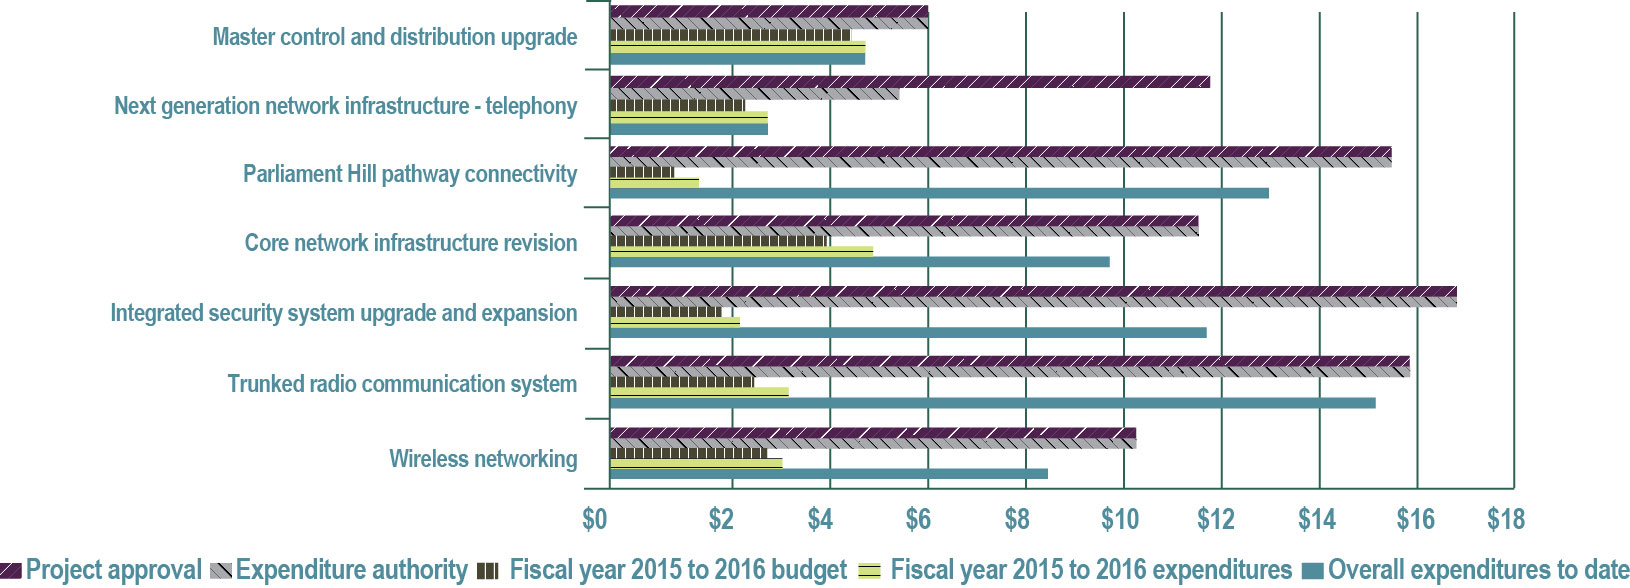
Table equivalent of figure 27—Building Components and Connectivity program project spending—Fiscal year 2015 to 2016 (in millions of dollars) and delivery timelines
| Project approval | Expenditure authority | Fiscal year 2015 to 2016 budget | Fiscal year 2015 to 2016 expenditures | Overall expenditures to date | |
|---|---|---|---|---|---|
| Wireless networking | $10.1 | $10.1 | $2.8 | $3.3 | $8.2 |
| Trunked radio communication system | $15.9 | $15.9 | $2.3 | $2.7 | $15.3 |
| Integrated security system upgrade and expansion | $16.8 | $16.8 | $1.8 | $2.1 | $11.7 |
| Core network infrastructure revision | $11.8 | $11.8 | $3.9 | $4.7 | $9.7 |
| Parliament Hill pathway connectivity | $15.5 | $15.5 | $1.3 | $1.6 | $12.8 |
| Next generation network infrastructure—telephony | $11.9 | $5.6 | $2.2 | $2.6 | $2.6 |
| Master control and distribution upgrade | $6.0 | $6.0 | $4.5 | $5.3 | $5.3 |
Planning program
Figure 28—Planning program project expenditures (in millions of dollars) and delivery timelines
| Budget | Expenditures | Forecast | Completion dates Footnote 3 |
||||||
|---|---|---|---|---|---|---|---|---|---|
| Projects | Project approval | Expenditure authority | 2015 to 2016 budget |
2015 to 2016 expenditures |
Prior years expenditures | Cumulative expenditures up to 2015 to 2016 | Planned expenditures 2016 to 2017 Footnote 2 |
Planned expenditures 2017 to 2018 and future years Footnote 2 |
|
| Centre Block major rehabilitation | 31.9 | 31.9 | 8.0 | 8.0 | 18.8 | 26.9 | 7.5 | 0.3 | TBD |
| Long Term Vision and Plan strategic planning | 10.7 | 10.7 | 6.5 | 3.2 | 7.4 | 10.7 | 2.8 | 2.8 | Ongoing |
| Long Term Vision and Plan underground infrastructure master plan | 2.2 | 2.2 | 0.4 | 0.2 | 1.1 | 1.3 | 0.8 | 0.1 | 2016 |
| Material management master plan | 1.7 | 1.7 | 0.5 | 0.2 | 1.0 | 1.2 | 0.4 | 0.1 | 2016 |
| Long Term Vision and Plan Program Management Office | 2.3 | 2.3 | 2.4 | 1.2 | 0.0 | 1.2 | 1.1 | 0.0 | Ongoing |
| Other Planning | 97.0 | 31.3 | 0.3 | 0.2 | 19.3 | 19.4 | 0.3 | 6.8 | N/A |
| Total Planning program | 145.7 | 80.0 | 18.1 | 13.1 | 47.6 | 60.7 | 12.9 | 10.1 | N/A |
Remarks: Numbers may not add up due to rounding. Planned forecasts may require project approval and/or expenditure authority amendment.
Figure 29—Planning program project spending—Fiscal year 2015 to 2016 (in millions of dollars)
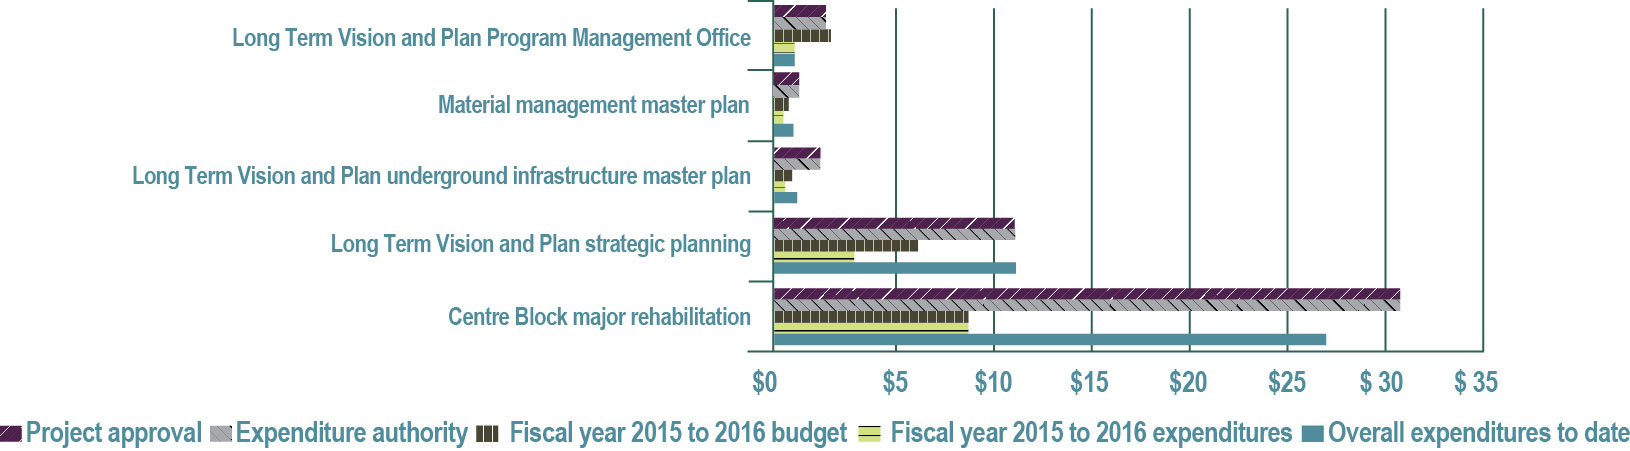
Table equivalent of figure 29—Planning program project spending—Fiscal year 2015 to 2016 (in millions of dollars)
| Project approval | Expenditure authority | Fiscal year 2015 to 2016 budget | Fiscal year 2015 to 2016 expenditures | Overall expenditures to date | |
|---|---|---|---|---|---|
| Centre Block major rehabilitation | $31.9 | $31.9 | $8.0 | $8.0 | $26.9 |
| Long Term Vision and Plan strategic planning | $10.7 | $10.7 | $6.5 | $3.2 | $10.7 |
| Long Term Vision and Plan underground infrastructure master plan | $2.2 | $2.2 | $0.4 | $0.2 | $1.3 |
| Material management master plan | $1.7 | $1.7 | $0.5 | $0.2 | $1.2 |
| Long Term Vision and Plan Program Management Office | $2.3 | $2.3 | $2.4 | $1.2 | $1.2 |
Leased
Figure 30—Long Term Vision and Plan lease cost breakdown (in millions of dollars)
| LTVP leases | Lease project approval (LPA) Footnote 5 |
Prior years expenditures | Forecast expenditures 2015 to 2016 |
Actual expenditures 2015 to 2016 |
Total expenditures to the end of 2015 to 2016 |
|---|---|---|---|---|---|
| 119 Queen Street | $1.2 | $2.2 | $0.4 | $0.4 | $2.6 |
| 131 Queen Street | $166.3 | $112.5 | $13.5 | $14.4 | $126.9 |
| 181 Queen Street | $59.9 | $69.5 | $6.8 | $6.8 | $76.3 |
| 155 Queen Street (10th Floor) | $13.6 | $2.9 | $0.6 | $0.6 | $3.5 |
| 155 Queen Street (6th Floor) | $0.3 | $0.1 | $0.1 | $0.1 | $0.2 |
| 2074-2086 Walkley Road, Trade Shops | $11.2 | $2.8 | $0.7 | $0.6 | $3.3 |
| 768 Belfast Road, House of Commons | $2.0 | $1.4 | $0.0 | $0.0 | $1.4 |
| 2455 Don Reid Drive, E-Printing | $11.1 | $4.6 | $1.2 | $1.0 | $5.6 |
| 1 Wellington Street—Rideau Committee Rooms | $23.6 | $5.1 | $1.0 | $0.9 | $6.1 |
| C.D. Howe Building | $18.4 | $14.3 | $1.7 | $1.7 | $16.1 |
| Clarica / Sun Life Building | $46.9 | $29.9 | $3.3 | $4.3 | $34.2 |
| Interim Room 200—Government of Canada Conference Centre | $9.1 | $8.0 | $0.5 | $0.5 | $8.5 |
| Total-LTVP | $363.5 | $253.4 | $29.8 | $31.3 | $284.7 |
Remarks: Numbers may not add up due to rounding.
Figure 31—Annual lease costs (in millions of dollars)
| Year | Expenditures | Forecast |
|---|---|---|
| 2002 to 2003 | $0.0 | N/A |
| 2003 to 2004 | $0.5 | N/A |
| 2004 to 2005 | $5.5 | N/A |
| 2005 to 2006 | $6.8 | N/A |
| 2006 to 2007 | $17.5 | N/A |
| 2007 to 2008 | $24.0 | N/A |
| 2008 to 2009 | $24.0 | N/A |
| 2009 to 2010 | $26.0 | N/A |
| 2010 to 2011 | $28.1 | N/A |
| 2011 to 2012 | $29.3 | N/A |
| 2012 to 2013 | $30.7 | N/A |
| 2013 to 2014 | $30.5 | N/A |
| 2014 to 2015 | $30.7 | N/A |
| 2015 to 2016 | $31.3 | N/A |
| 2016 to 2017 | N/A | $30.3 |