
Statistics Canada
www.statcan.gc.ca
Common menu bar links
Consumer Price Index
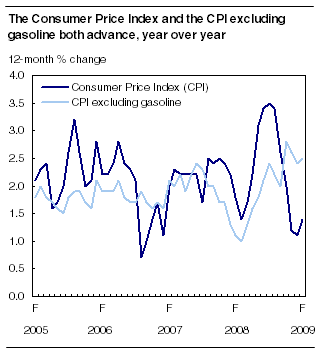
Consumer prices on average rose 1.4% in the 12 months to February 2009, slightly faster than the 1.1% increase observed in January.
The upward pressure on the Consumer Price Index (CPI) came primarily from two sources: higher food and shelter costs.
Chart 1
Food prices, the largest factor, increased 7.4% during the 12-month period to February, on the heels of a 7.3% increase in January. Shelter costs, the second largest, increased 3.0%, slightly slower than the 3.3% rise in January.
These gains offset lower transportation costs, which continued to exert strong downward pressure on consumer prices in February. Transportation costs were down as a result of lower prices for gasoline and for purchasing and leasing passenger vehicles.
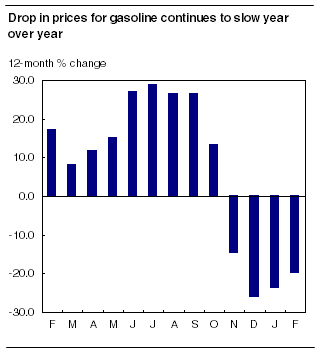
Gasoline prices in February 2009 were 19.7% below levels in February last year. Excluding gasoline, the CPI rose 2.5% in the 12 months to February. Overall, energy prices fell 8.8% during the 12-month period to February, less than the 10.9% fall in January.
Seasonally adjusted monthly change: First increase in five months
On a seasonally adjusted monthly basis, consumer prices rose 0.4% from January to February, halting four monthly declines. A 1.3% rise in the transportation index in February, after falling 1.4% in January, largely accounted for the turnaround in February. Higher food prices also contributed to February's rise.
Excluding food and energy, seasonally adjusted consumer prices rose 0.3% from January to February, following a monthly decline of 0.2% in January.
12-month change: Drop in transportation costs partly offsets higher food prices
Higher food prices and shelter costs offset a 5.8% decline in the transportation index in February.
The cost of food continued to be pushed up primarily by prices for food purchased from stores, which rose 8.9%. The main contributors were a 25.8% hike in the price of fresh vegetables, a 9.7% rise in the prices of bakery and cereal products, and a 6.1% increase in meat prices.
Chart 2
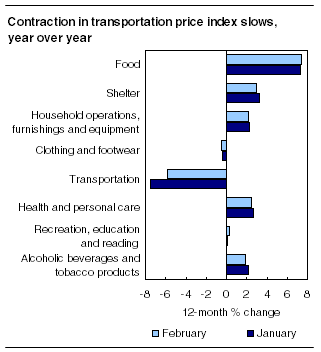
February's increase in costs for shelter was due primarily to higher mortgage interest costs and prices for household utilities. Mortgage interest costs, which are a function of housing prices and interest rates, and which take account of the fact that most homeowners do not change houses or re-contract their mortgages very frequently, were up 5.0% in the 12 months to February. This increase was largely the result of higher housing prices.
The cost of household utilities rose 4.9% as a result of increasing prices for water (+9.4%), natural gas (+14.4%) and electricity (+4.5%). These gains were tempered by declines in prices for fuel oil and other fuels, especially in Atlantic Canada.
The transportation price index fell, largely as a result of falling gasoline and motor vehicle prices.
February's 12-month decline of 19.7% in gasoline prices was slower than the 12-month decline of 23.5% in January. This slowdown occurred largely because pump prices rose 5.6% on a monthly basis from January to February 2009.
Chart 3
The cost of purchasing and leasing passenger vehicles fell 6.4% in February, compared with an 8.2% year-over-year drop in January. The slowdown occurred as a result of slight increases in manufacturers' suggested retail prices and minor clawbacks in incentives offered by manufacturers and dealers.
The declines in prices for gasoline and for purchasing and leasing passenger vehicles were partly offset by increases in prices for passenger vehicle insurance and air transportation.
Prices for clothing and footwear fell 0.5% in the 12 months to February, after falling 0.4% in January. A 1.7% decrease in clothing prices largely accounted for February's drop.
Jewellery prices rose 9.9% in the 12 months to February, primarily as a result of rising prices for gold.
Provinces: Fastest increases in consumer prices on the Prairies
Growth in consumer prices rose faster in most provinces in February, due largely to smaller price drops for gasoline. Consumers in the three Prairie provinces faced the fastest increases in consumer prices in the 12 months to February.
Chart 4
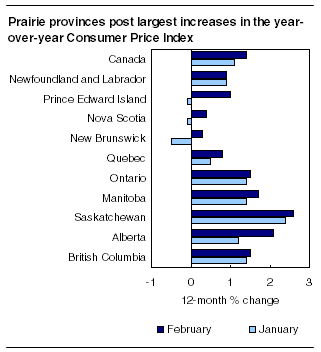
Consumers in Saskatchewan paid 2.6% more on average in February, while those in Alberta and Manitoba paid 2.1% and 1.7% more, respectively.
In all three cases, the primary contributor was higher mortgage interest costs. In Alberta and Manitoba, another factor was a rise in the cost of purchasing passenger vehicle insurance. In Saskatchewan, a major factor was a 22.4% rise in natural gas prices.
The 12-month change in consumer prices was slowest in New Brunswick (+0.3%) and Nova Scotia (+0.4%) in February. This was the result of more moderate price increases for shelter and larger price declines for gasoline, fuel oil and other fuels and to purchase and lease passenger vehicles than in most other provinces.
12-month change in the Bank of Canada's core index holds steady
The Bank of Canada's core index advanced 1.9% over the 12 months to February, identical to the increase posted in January.
The seasonally adjusted monthly core index rose 0.4% from January to February, after falling 0.3% from December to January. The upturn was due primarily to a rise in prices to purchase and lease passenger vehicles from January to February, which fell from December to January.
For a more detailed analysis, consult the publication The Consumer Price Index.
Available on CANSIM: tables 326-0009, 326-0012, 326-0015 and 326-0020 to 326-0022.
Definitions, data sources and methods: survey number 2301.
More information about the concepts and use of the CPI are also available online in Your Guide to the Consumer Price Index (62-557-XIB, free) from the Publications module of our website.
The February 2009 issue of The Consumer Price Index, Vol. 88, no. 2 (62-001-XWE, free), is now available from the Publications module of our website. A paper copy is also available (62-001-XPE, $12/$111). A more detailed analysis of the CPI is available in this publication. See How to order products.
The Consumer Price Index for March will be released on April 17.
For more information, or to enquire about the concepts, methods or data quality of this release, contact the Dissemination Unit (toll-free 1-866-230-2248; 613-951-9606; fax 613-951-2848; prices-prix@statcan.gc.ca), Prices Division.
Table 1
| (2002=100) | |||||
|---|---|---|---|---|---|
| Relative importance2 | February 2008 | February 2009 | January 2008 to January 2009 | February 2008 to February 2009 | |
| Unadjusted | |||||
| % change | |||||
| All-items | 100.003 | 112.2 | 113.8 | 1.1 | 1.4 |
| Food | 17.04 | 112.8 | 121.2 | 7.3 | 7.4 |
| Shelter | 26.62 | 119.6 | 123.2 | 3.3 | 3.0 |
| Household operations and furnishings | 11.10 | 104.1 | 106.4 | 2.3 | 2.2 |
| Clothing and footwear | 5.36 | 94.1 | 93.6 | -0.4 | -0.5 |
| Transportation | 19.88 | 117.0 | 110.2 | -7.5 | -5.8 |
| Health and personal care | 4.73 | 107.7 | 110.4 | 2.7 | 2.5 |
| Recreation, education and reading | 12.20 | 100.8 | 101.1 | 0.1 | 0.3 |
| Alcoholic beverages and tobacco products | 3.07 | 126.8 | 129.2 | 2.2 | 1.9 |
| All-items (1992=100) | 133.6 | 135.4 | 1.1 | 1.3 | |
| Special aggregates | |||||
| Goods | 48.78 | 107.4 | 107.3 | -1.0 | -0.1 |
| Services | 51.22 | 116.9 | 120.2 | 3.0 | 2.8 |
| All-items excluding food and energy | 73.57 | 109.4 | 110.8 | 1.2 | 1.3 |
| Energy | 9.38 | 139.4 | 127.2 | -10.9 | -8.8 |
| Core CPI4 | 82.71 | 110.7 | 112.8 | 1.9 | 1.9 |
Table 2
| (2002=100) | |||||
|---|---|---|---|---|---|
| Relative importance1 | February 2008 | February 2009 | January 2008 to January 2009 | February 2008 to February 2009 | |
| Unadjusted | |||||
| % change | |||||
| Canada | 100.002 | 112.2 | 113.8 | 1.1 | 1.4 |
| Newfoundland and Labrador | 1.27 | 112.4 | 113.4 | 0.9 | 0.9 |
| Prince Edward Island | 0.35 | 114.6 | 115.7 | -0.1 | 1.0 |
| Nova Scotia | 2.56 | 113.9 | 114.3 | -0.1 | 0.4 |
| New Brunswick | 1.97 | 111.7 | 112.0 | -0.5 | 0.3 |
| Quebec | 21.05 | 111.4 | 112.3 | 0.5 | 0.8 |
| Ontario | 41.22 | 111.4 | 113.1 | 1.4 | 1.5 |
| Manitoba | 3.06 | 111.2 | 113.1 | 1.4 | 1.7 |
| Saskatchewan | 2.64 | 113.6 | 116.5 | 2.4 | 2.6 |
| Alberta | 11.43 | 119.0 | 121.5 | 1.2 | 2.1 |
| British Columbia | 14.29 | 110.3 | 111.9 | 1.4 | 1.5 |
| Whitehorse | 0.06 | 110.1 | 113.7 | 2.4 | 3.3 |
| Yellowknife | 0.08 | 112.3 | 114.5 | 2.7 | 2.0 |
| Iqaluit (Dec. 2002=100) | 0.02 | 108.4 | 111.8 | 3.3 | 3.1 |
Table 3
| (2002=100) | ||||||
|---|---|---|---|---|---|---|
| Relative importance1 | December 2008 | January 2009 | February 2009 | December 2008 to January 2009 | January to February 2009 | |
| Seasonally adjusted | ||||||
| % change | ||||||
| All-items | 100.002 | 114.0 | 113.9 | 114.4 | -0.1 | 0.4 |
| Food | 17.04 | 119.8 | 120.2 | 120.8 | 0.3 | 0.5 |
| Shelter | 26.62 | 123.4 | 123.1 | 123.2 | -0.2 | 0.1 |
| Household operations and furnishings | 11.10 | 105.6 | 105.9 | 106.1 | 0.3 | 0.2 |
| Clothing and footwear | 5.36 | 92.9 | 93.8 | 93.9 | 1.0 | 0.1 |
| Transportation | 19.88 | 110.3 | 108.8 | 110.2 | -1.4 | 1.3 |
| Health and personal care | 4.73 | 110.1 | 110.7 | 110.6 | 0.5 | -0.1 |
| Recreation, education and reading | 12.20 | 102.0 | 101.7 | 102.3 | -0.3 | 0.6 |
| Alcoholic beverages and tobacco products | 3.07 | 128.7 | 129.2 | 129.2 | 0.4 | 0.0 |
| Special aggregates | ||||||
| All-items excluding food | 82.96 | 112.0 | 111.5 | 112.3 | -0.4 | 0.7 |
| All-items excluding food and energy | 73.57 | 111.0 | 110.8 | 111.1 | -0.2 | 0.3 |
| All-items excluding eight of the most volatile components | 82.71 | 111.5 | 111.3 | 111.6 | -0.2 | 0.3 |
| Core CPI3 | 82.71 | 112.9 | 112.6 | 113.0 | -0.3 | 0.4 |