
Public Health Agency of Canada
www.publichealth.gc.ca
Common menu bar links
Institutional links
Diseases & Conditions
Health & Safety
Research & Statistics
Agency Information
Search Box
Healthy settings for young people in Canada
Previous | Table of Contents | Next
Feelings of Satisfaction, Belonging, and Safety at School
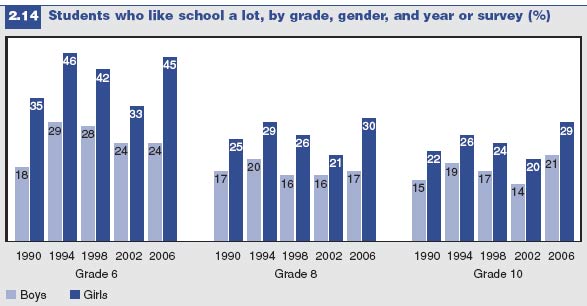
The proportion of students who report they like school a lot is presented in Figure 2.14, which shows a steady decline between the 1994 and 2002 HBSC cycles. Notably, in the 2006 cycle, an increased proportion of girls in all three grades report liking school a lot, along with Grade 10 boys. These results are somewhat surprising given the decline in achievement the students report relative to previous survey years (not shown). As in previous HBSC cycles, girls like school more than boys at all grade levels.
 Grade 8 and 10 students report similar levels of liking school, but both
of these are
lower than the results for Grade 6 students. This difference coincides with
the shift
experienced by many students from having a single teacher to multiple teachers
(see Chapter 1); however, because the timing of the shift is not uniform
across jurisdictions,
it is not possible to determine whether the decrease in liking school is
associated
with the changing school structure or with other factors directly related
to the students
themselves.
Grade 8 and 10 students report similar levels of liking school, but both
of these are
lower than the results for Grade 6 students. This difference coincides with
the shift
experienced by many students from having a single teacher to multiple teachers
(see Chapter 1); however, because the timing of the shift is not uniform
across jurisdictions,
it is not possible to determine whether the decrease in liking school is
associated
with the changing school structure or with other factors directly related
to the students
themselves.
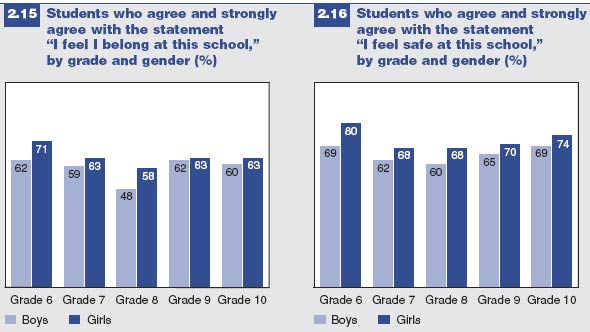
Figures 2.15 and 2.16 indicate the majority of students feel they belong and feel safe at their school. The sense of belonging drops slightly after Grade 6, reaching its lowest point in Grade 8 before rising slightly again.
As with the measures of achievement (self-perceptions and marks), girls demonstrate higher scores on measures of belonging, more frequently reporting a sense of belonging than boys. Students’ feelings of safety follow a similar pattern.
Underlying these findings are 10 to 20% of students who do not share a sense of school belonging and 7 to 16% of students who do not feel safe at school (not shown). Boys are more likely to express these negative views, especially in Grades 7, 8, and 9.
Aspects of teacher, peer, and parental relationships
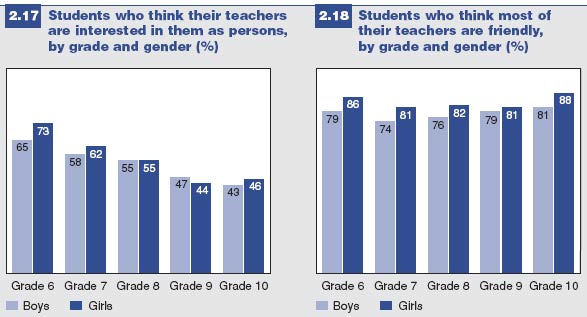
As students progress through their schooling, they are less likely to believe teachers are interested in them as persons (Figure 2.17). The results are similar for both boys and girls. Regardless, students largely report that their teachers are friendly, with girls being more positive (Figure 2.18).
| For data on young people’s friendships, please see the section on the peer context later in this chapter. |
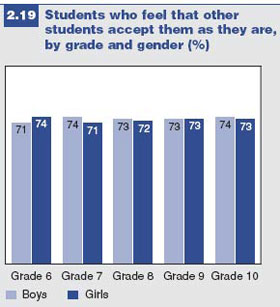
Figure 2.19 shows the percentage of students who agree or strongly agree that other students accept them as they are. The majority of respondents (just below 75%) feel accepted by their peers across grade levels. Nevertheless, a relatively small, but significant number of students do not feel accepted by their peers (not shown).
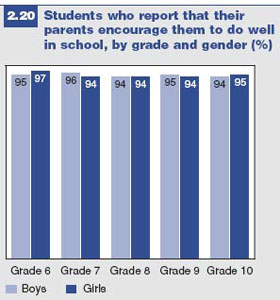
According to the 2006 HBSC results, most Canadian students believe their parents are very supportive of their education, with well over 90% of students agreeing or strongly agreeing that their parents encourage them to do well in school (Figure 2.20). Previous cycles of the HBSC have found fewer students reporting that they felt their parents encouraged them to do well at school (not shown). The 2006 results suggest parents appreciate the importance of their child’s academic success even after he or she has entered high school.
The pressures of school
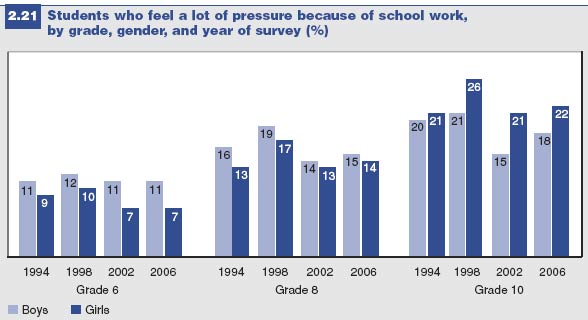
A significant proportion of students feel a lot of pressure because of school work (Figure 2.21) and, not unexpectedly, students experience increasing pressure in successive grades. There is a shift, however, in the relative pressure felt by boys and girls: in Grades 6 and 8, boys are more likely than girls to feel pressured, whereas in Grade 10, the reverse is true. The data also suggest the amount of pressure felt by students has remained relatively constant across the survey years.
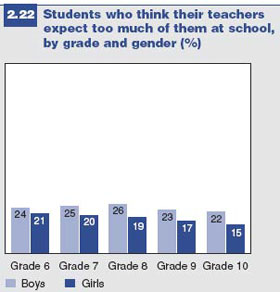
Between 15 and 26% of students report feeling overly high expectations from teachers, with boys more often reporting this (Figure 2.22).
 The pressures of school can be a
“double-edged sword” for many students,
as, typically, students experiencing too
much pressure to achieve also report lower
levels of achievement (not shown).
The pressures of school can be a
“double-edged sword” for many students,
as, typically, students experiencing too
much pressure to achieve also report lower
levels of achievement (not shown).
The school setting
Summary
Overall, the proportion of students who like school increased in 2006, especially for girls, reversing a decline observed over the three previous cycles of the HBSC study. While the majority of students feel they belong in school, students in Grade 8 report the lowest levels of school belonging (with only 48% of boys and 58% of girls reporting feelings of belonging); boys report lower overall belonging than girls. A majority of students feel safe at school, with girls more commonly reporting feeling safe. Boys are more likely to believe teachers expect too much of them, but girls feel more pressure from school work in later grades. Students report very high levels of parental support. Overall, girls report higher levels of satisfaction with all areas of schooling.
The school environment is an important factor in the relationship between young people’s school experiences and their health behaviours. Students who like school, feel they belong in school, or feel the school is a safe place to be are more likely to enjoy going to school. The relationship of students’ school experience to their health and social behaviours remains an important area for further examination.9
Nine survey items:
- The rules in this school are fair
- Our school is a nice place to be
- I feel I belong at this school
- How do you feel about school at present?
- I am encouraged to express my own views in my class(es)
- Our teachers treat us fairly
- When I need extra help, I can get it
- My teachers are interested in me as a person
- Most of my teachers are friendly.
Measures used in this report
The academic achievement measure consists of students’ responses to a question about their average mark in the past year. The response options were: Excellent (Mostly A’s / above 85% / or level 4); Above average (Mostly A’s and B’s / between 70 and 84% / or level 3 and 4); Average (Mostly B’s and C’s / between 60 and 69% / or level 3); Below average (Mostly C’s / between 50 and 59% / or level 2); and Poor (Mostly letter grades below C / below 50% / or level 1). An attitude towards school scale was developed from nine survey items. Only those students with complete data for the nine items were included.
References
- Carter, M., R. McGee, B. Taylor, and S. Williams (2007). Health outcomes in adolescence: Associations with family, friends and school engagement. Journal of Adolescence, 30(1):51-62.
- McGee, R., M. Carter, S. Williams, and B. Taylor (2005). Weapon carrying in a sample of high school students in New Zealand. Australian and New Zealand Journal of Public Health, 29:13-15.
- Resnick, M.D., L.J. Harris, and R.W. Blum (1993). The impact of caring and connectedness on adolescent health and well-being. Journal of Paediatrics and Child Health, 29 (Suppl. 1):S3-S9.
- Baumeister, R.F., and M.R. Leary (1995). The need to belong: Desire for interpersonal attachments as a fundamental human motivation. Psychological Bulletin, 117(3):497-529.
- Wang, J., L. Wildman, and G. Calhoun (1996). The relationships between parental influence and student achievement in seventh grade mathematics. School Science and Mathematics, 96:395-399.
- Connop, H., and A.J.C. King (1999). Adolescent Smoking Initiation and Maintenance: Report of a Pilot Study of School Smoking Zones. Kingston, Ontario: Queen’s University, Social Program Evaluation Group.
- Huurre, T., H. Aro, O. Rahkonen, and E. Komulainen (2006). School factors in adolescence: Predicting adult educational level. Educational Research, 48(1):41-53.
- e.g., Samdal, O., D. Nutbeam, B. Wold, and L. Kannas (1998). Achieving health and education goals through schools: A study of the importance of the school climate and the students’ satisfaction with school. Health Education Research, 13:383-397.
- Fredericks J.A., P.C. Blumenfeld, and A.H. Paris (2004). School engagement: Potential of the concept, state of the evidence. Review of Educational Research, 74:59-109.