
Public Health Agency of Canada
www.publichealth.gc.ca
Common menu bar links
E-mail this page
 |
|
January 27, 2008 to February 2, 2008 (Week 5) |
Fluwatch
Influenza A and B detections in Canada continue to increase
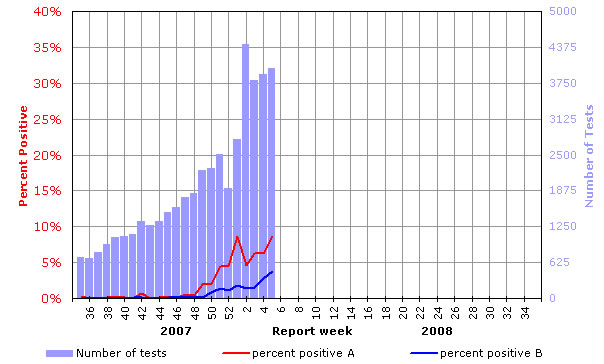
During week 05, overall influenza activity levels in Canada remained similar to previous weeks. In week 05, only 1 region reported widespread influenza activity (from BC) and 9 regions reported localized activity (in BC, AB, MB, ON, & NB). Sixteen regions reported no activity and 22 reported sporadic activity (see map). Note: No data was received from SK and several regions in NF and ON this week. In week 05, the percentage of specimens that tested positive for influenza was 12% (498/4,006) with both influenza A and B detections having increased from the previous week. Of the influenza detections to date, 75% were influenza A and 25% were influenza B (see table). This week, the ILI consultation rate was 22 ILI consultations per 1,000 patient visits (see ILI graph), which is below the expected range for this week. The sentinel response rate was 60%. Thirteen new outbreaks of influenza or ILI were reported this week as follows: 5 LTCFs, 4 schools, and 4 other.
Antigenic Characterization:
The National Microbiology Laboratory (NML) has characterized 327 influenza viruses for the 2007-2008 influenza season: 203 A(H1N1), 32 A(H3N2) and 92 B viruses. All influenza A(H1N1) viruses were antigenically similar to A/Solomon Islands/3/2006. Of the 32 influenza A(H3N2) viruses characterized, 5 were antigenically similar to A/Wisconsin/67/2005 and 27 were antigenically similar to A/Brisbane/10/2007. One of the 5 A/Wisconsin-like viruses had reduced titer to A/Wisconsin/67/2005 reference antiserum. Of the 92 influenza B isolates characterized, 3 were antigenically similar to B/Malaysia/2506/2004 and 89 were antigenically similar to B/Florida/4/2006 (belonging to the B/Yamagata lineage) (see pie chart).
Antiviral Resistance:
Since the start of the season, the NML has tested 241 influenza A isolates (202 H1N1 and 39 H3N2) for amantadine resistance and found that 37 (95%) of the 39 H3N2 isolates were resistant to amantadine and 4 (2%) of 202 H1N1 isolates were resistant (see recommendation from the 2006-2007 influenza season below).
The NML has also tested 244 influenza isolates (173 A/H1N1, 18 A/H3N2 & 53 B) for oseltamivir (Tamiflu) resistance and found that 12 (6.9%) of the 173 H1N1 isolates tested were resistant to oseltamivir.
The resistant isolates were from NF (1), ON (9), MB (1) and BC (1). These oseltamivir resistant strains remain sensitive to the antiviral amantadine. PHAC is collaborating with provincial and territorial and international partners in monitoring, reporting and assessing the implications of the findings. While antivirals can be used to lessen the length and severity of influenza, vaccination remains the most effective method of preventing illness. This year's influenza vaccine protects against influenza A(H1N1) and therefore vaccination remains an effective measure in preventing illness.
Influenza-associated Paediatric Hospitalizations:
No new laboratory-confirmed influenza-associated paediatric hospitalizations were reported through the Immunization Monitoring Program Active (IMPACT) network this week.
International:
CDC: During week 04, influenza activity continued to increase in the United States. The proportion of specimens that tested positive for influenza virus increased to 16.8% this week. The majority of influenza detections to date were for influenza A viruses (86%). Since September 30, 2007, CDC antigenically characterized 197 influenza viruses: 101 influenza A(H1) (97 A/Solomon Islands/3/2006-like and 4 showed somewhat reduced titers with antisera produced against A/Solomon Islands), 53 influenza A(H3) (6 A/Wisconsin/67/2005-like and 46 A/Brisbane/10/2007-like, and 1 showed somewhat reduced titers with antisera produced against A/Wisconsin and A/Brisbane), and 43 influenza B viruses (3 belonging to the B/Victoria and 40 B/Yamagata lineage).
EISS: In week 5, medium levels of influenza activity were reported in most European countries. In the majority of countries the influenza activity is either unchanging or declining. Although influenza A(H1) is the dominant virus strain circulating in Europe this season, influenza B still represents 20% of the total influenza virus detections since the start of the season. A significant proportion (20%) of the A(H1N1) viruses circulating in Europe were resistant to oseltamivir with resistant viruses found in 9 European countries.
Human Avian Influenza: Since 2 February 2008, the WHO reported 2 additional cases (1 fatal) of H5N1 avian influenza infection from Indonesia.
Recommendation for the Use of Amantadine for Treatment and Prevention of Influenza
The Public Health Agency of Canada does not recommend the use of amantadine for treatment or prevention of influenza for the 2006-2007 season. This recommendation will be revisited if new information becomes available.
Total number of influenza tests performed and number of positive tests by province/territory of testing laboratory, Canada, 2007-2008
| Province
of reporting laboratories |
Report
Period: January 27 to February 2, 2008 |
Season
to Date: August 26, 2007 to February 2, 2008 |
||||||
| Total
# Influenza Tests |
# of Positive Tests | Total
# Influenza Tests |
# of Positive Tests | |||||
| Influenza A | Influenza B | Total | Influenza A | Influenza B | Total | |||
| NL | 68 | 10 | 6 | 16 | 294 | 25 | 6 | 31 |
| PE | 4 | 0 | 1 | 1 | 42 | 0 | 1 | 1 |
| NS | 22 | 0 | 0 | 0 | 278 | 2 | 2 | 4 |
| NB | 15 | 1 | 3 | 4 | 302 | 2 | 4 | 6 |
| QC | 1060 | 68 | 12 | 80 | 9375 | 229 | 36 | 265 |
| ON | 1187 | 67 | 14 | 81 | 13572 | 724 | 38 | 762 |
| MB | 62 | 5 | 3 | 8 | 1546 | 11 | 4 | 15 |
| SK | 146 | 23 | 13 | 36 | 2648 | 79 | 46 | 125 |
| AB | 1212 | 87 | 79 | 166 | 15306 | 284 | 331 | 615 |
| BC | 230 | 85 | 21 | 106 | 1526 | 250 | 55 | 305 |
| Canada | 4006 | 346 | 152 | 498 | 44889 | 1606 | 523 | 2129 |
Specimens from NT, YT, and NU are sent to reference laboratories in other provinces.
Note: Cumulative data includes updates to previous weeks; due to reporting delays, the sum of weekly report totals do not add up to cumulative totals.
Abbreviations: Newfoundland/Labrador (NL), Prince Edward Island (PE), New Brunswick (NB), Nova Scotia (NS), Quebec (QC), Ontario (ON), Manitoba (MB), Saskatchewan (SK), Alberta (AB), British Columbia (BC), Yukon (YT), Northwest Territories (NT), Nunavut (NU)
Respiratory virus laboratory detections in Canada, by geographic
regions, are available weekly on the following website:
<http://www.phac-aspc.gc.ca/bid-bmi/dsd-dsm/rvdi-divr/index-eng.php>
Number of influenza surveillance regions† reporting widespread or localized influenza activity, Canada, by report week, 2007-2008 (N=54)
![]()
† sub-regions within the province or territory as defined by the provincial/territorial epidemiologist. Graph may change as late returns come in.
Influenza
Activity Level by Provincial and Territorial |
||||||||||||
 |
|
|||||||||||
Note: Influenza activity levels, as represented on this map, are assigned and reported by Provincial and Territorial Ministries of Health, based on laboratory confirmations, sentinel ILI rates (see graphs and tables) and outbreaks. Please refer to detailed definitions. For areas where no data is reported, late reports from these provinces and territories will appear on the FluWatch website. Select single maps by report week to get this updated information.
<http://dsol-smed.phac-aspc.gc.ca/dsol-smed/fluwatch/fluwatch.phtml?lang=e>
Click on the map to view provinces/territories and maps for other weeks.
Influenza tests reported and percentage of tests positive, Canada, by report week, 2007-2008
Percent positive influenza tests, compared to other respiratory viruses, Canada, by reporting week, 2007-2008
![]()
Influenza strain characterization, Canada, cumulative, 2007-2008 influenza season by the Respiratory Viruses Section at the National Microbiology Laboratory
[N=327]
{Strain characterization, number identified, per cent of total number}
NACI recommends that the trivalent vaccine for the 2007-2008 season in Canada contain A/Solomon Islands/3/2006 (H1N1)-like virus; an A/Wisconsin/67/2005 (H3N2)-like virus; and a B/Malaysia/2506/2004-like virus.
Influenza-like illness (ILI) consultation rates, Canada, by report week, 2007-2008 compared to 1996/97 through to 2006/07 seasons
![]()
Note: No data available for mean rate in previous years for weeks 19 to 39 (1996-1997 through 2002-2003 seasons).
Number of New Outbreaks in Long Term Care Facilities, Canada, by Report Week, 2007-2008
![]()
Please note that the above graphs may change as late returns come in.