
Public Health Agency of Canada
www.publichealth.gc.ca
Common menu bar links
E-mail this page
 |
|
December 30, 2007 to January 5, 2008 (Week 1) |
Fluwatch
All influenza indicators increased from the previous week; however overall influenza activity in Canada remains low
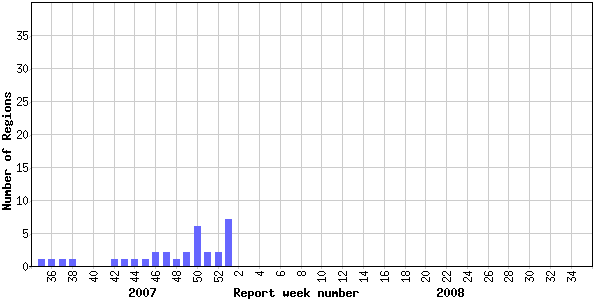
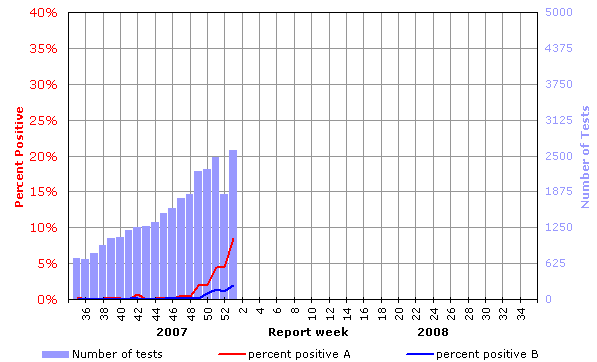
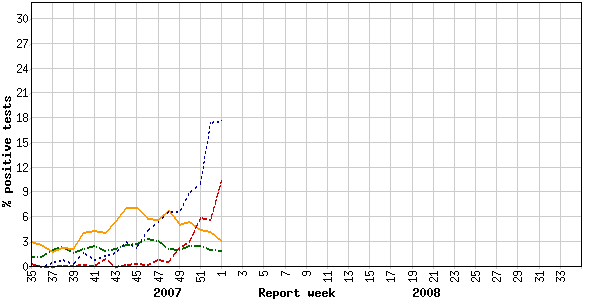
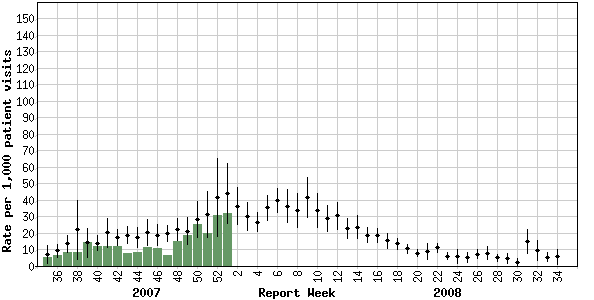
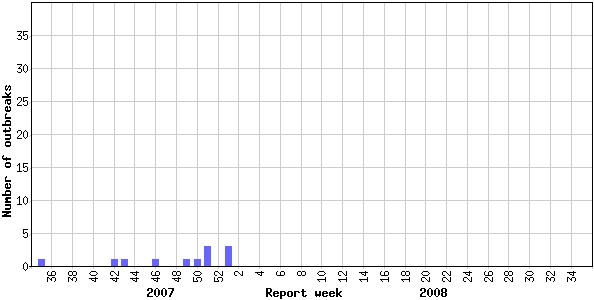
During week 01, influenza activity levels in Canada remained fairly low overall; however all influenza indicators increased from the previous week. In week 01, 7 influenza surveillance regions (in ON, SK, AB and NT) reported localized influenza activity, while the rest reported either no activity (n=29) or sporadic activity (n=20) (see map). In week 01, 10.4% (271/2601) of the specimens tested were positive for influenza. Although both influenza A and B detections increased this week compared to the previous week, the percent positive for influenza A detections increased at a much higher rate. Of the influenza detections to date, 79% were influenza A and 21% were influenza B (see table). This week, the ILI consultation rate rose slightly to 32 ILI consultations per 1,000 patient visits (see ILI graph), which is within the expected range for this week. Note however that the sentinel response rate was low at 42%. Four new influenza outbreaks were reported in week 01 from AB, NT and ON: 3 were in LTCF's and 1 was in another type of facility.
Antigenic Characterization:
The National Microbiology Laboratory (NML) has characterized 118 influenza viruses for the 2007-2008 influenza season: 80 A(H1N1), 9 A(H3N2) and 29 B viruses. All influenza A(H1N1) viruses were antigenically similar to A/Solomon Islands/3/2006. Of the 9 influenza A(H3N2) viruses characterized, 5 were antigenically similar to A/Wisconsin/67/2005 and 4 were antigenically similar to A/Brisbane/10/2007. One of the 5 A/Wisconsin-like viruses had reduced titer to A/Wisconsin/67/2005 reference antiserum. Of the 29 influenza B isolates characterized, 3 were antigenically similar to B/Malaysia/2506/2004 and 26 were antigenically similar to B/Florida/4/2006 (belonging to the B/Yamagata lineage) (see pie chart).
* The WHO recommends that the vaccines to be used in the 2007-2008 season (northern hemisphere) contain the following: an A/Solomon Islands/3/2006 (H1N1)-like virus; an A/Wisconsin/67/2005 (H3N2)-like virus; and a B/Malaysia/2506/2004-like (B/Victoria/2/1987 lineage) virus.
Antiviral Resistance:
Since the start of the season, the NML has tested 42 influenza A isolates (33 H1N1 and 9 H3N2) for amantadine resistance and found that 7 (78%) of the 9 H3N2 isolates were resistant to amantadine (originating from ON and AB) and 1 (3%) of 33 H1N1 isolates was resistant (originating from BC) (see recommendation from the 2006-2007 influenza season below). Of the 42 isolates tested for oseltamivir resistance (33 influenza A, 9 influenza B), none were found to be resistant.
Influenza-associated Paediatric Hospitalizations:
This week, there were 8 new laboratory-confirmed influenza-associated paediatric hospitalizations in Ontario reported through the Immunization Monitoring Program Active (IMPACT) network, all due to influenza A. All of the 21 hospitalizations reported so far this season have been due to influenza A. The proportion of cases to date by age group are as follows: 24% each among 6-23 month olds, 2-4 year-olds, and 5-9 year-olds; 14% each among 0-5 month olds and 10-16 year-olds.
International:
WHO: During weeks 50–51, the level of overall influenza activity in the world remained low. A slight increase in the number of influenza viruses detected was observed in some countries of the northern hemisphere.
CDC: During week 52, influenza activity continued to increase in the United States. Five states reported regional influenza activity, 9 states reported local influenza activity and the majority reported sporadic (n=33) and no influenza activity (n=3). The proportion of specimens that tested positive for influenza virus declined slightly to 3.2% this week. The majority of influenza detections to date were for influenza A viruses (88%). Since September 30, 2007, CDC antigenically characterized 79 influenza viruses: 32 influenza A(H1) (all A/Solomon Islands/3/2006), 19 influenza A(H3) (4 A/Wisconsin/67/2005-like and 14 A/Brisbane/10/2007-like, and 1 showed somewhat reduced titers with antisera produced against A/Wisconsin and A/Brisbane), and 28 influenza B viruses (3 belonging to the B/Victoria and 25 B/Yamagata lineage). To date this season, 1 influenza-associated pediatric death has been reported to the CDC (in week 48).
EISS: During week 52, increased levels of influenza activity was reported in 7 European countries and low levels were reported across the rest of Europe. Of the total virus detections since week 40, 82% were influenza A of which 95% were of the H1 subtype. Antigenic and/or genetic characterisation of 268 influenza viruses included: 3 A/New Caledonia/20/99 (H1N1)-like, 216 A/Solomon Island/3/2006 (H1N1)-like, 2 A/Wisconsin/67/2005 (H3N2)-like, 7 A/Brisbane/10/2007 (H3N2)-like, 24 B/Florida/4/2006-like and 16 B/Malaysia/2506/2004-like.
Human Avian Influenza: Since 5 January 2008, the WHO reported 1 additional case of H5N1 avian influenza infection in Indonesia. The case is a 16-year-old female from West Java province who developed symptoms on 30 December and was hospitalized on 4 January.
Recommendation for the Use of Amantadine for Treatment and Prevention of Influenza
The Public Health Agency of Canada does not recommend the use of amantadine for treatment or prevention of influenza for the 2006-2007 season. This recommendation will be revisited if new information becomes available.
Total number of influenza tests performed and number of positive tests by province/territory of testing laboratory, Canada, 2007-2008
| Province
of reporting laboratories |
Report
Period: December 30, 2007 to January 5, 2008 |
Season
to Date: August 26, 2007 to January 5, 2008 |
||||||
| Total
# Influenza Tests |
# of Positive Tests | Total
# Influenza Tests |
# of Positive Tests | |||||
| Influenza A | Influenza B | Total | Influenza A | Influenza B | Total | |||
| NL | 32 | 2 | 0 | 2 | 152 | 5 | 0 | 5 |
| PE | 2 | 0 | 0 | 0 | 30 | 0 | 0 | 0 |
| NS | 13 | 0 | 0 | 0 | 192 | 0 | 1 | 1 |
| NB | 13 | 0 | 0 | 0 | 219 | 0 | 0 | 0 |
| QC | 800 | 18 | 3 | 21 | 5623 | 46 | 8 | 54 |
| ON | 1027 | 159 | 4 | 163 | 8090 | 364 | 6 | 370 |
| MB | 49 | 0 | 1 | 1 | 708 | 0 | 1 | 1 |
| SK | 206 | 5 | 6 | 11 | 1886 | 26 | 16 | 42 |
| AB | 363 | 12 | 32 | 44 | 10735 | 43 | 100 | 143 |
| BC | 96 | 24 | 5 | 29 | 818 | 60 | 10 | 70 |
| Canada | 2601 | 220 | 51 | 271 | 28453 | 544 | 142 | 686 |
Specimens from NT, YT, and NU are sent to reference laboratories in other provinces.
Note: Cumulative data includes updates to previous weeks; due to reporting delays, the sum of weekly report totals do not add up to cumulative totals.
Abbreviations: Newfoundland/Labrador (NL), Prince Edward Island (PE), New Brunswick (NB), Nova Scotia (NS), Quebec (QC), Ontario (ON), Manitoba (MB), Saskatchewan (SK), Alberta (AB), British Columbia (BC), Yukon (YT), Northwest Territories (NT), Nunavut (NU)
Respiratory virus laboratory detections in Canada, by geographic
regions, are available weekly on the following website:
<http://www.phac-aspc.gc.ca/bid-bmi/dsd-dsm/rvdi-divr/index-eng.php>
Number of influenza surveillance regions† reporting widespread or localized influenza activity, Canada, by report week, 2007-2008 (N=54)
![]()
† sub-regions within the province or territory as defined by the provincial/territorial epidemiologist. Graph may change as late returns come in.
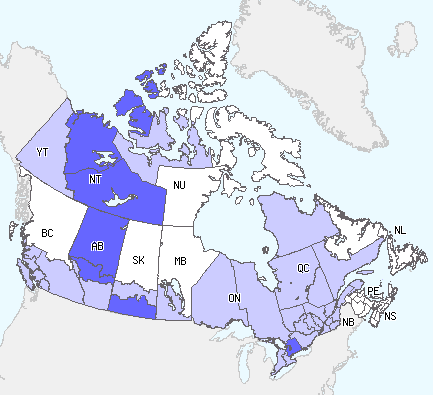
Influenza
Activity Level by Provincial and Territorial |
||||||||||||
 |
|
|||||||||||
Note: Influenza activity levels, as represented on this map, are assigned and reported by Provincial and Territorial Ministries of Health, based on laboratory confirmations, sentinel ILI rates (see graphs and tables) and outbreaks. Please refer to detailed definitions. For areas where no data is reported, late reports from these provinces and territories will appear on the FluWatch website. Select single maps by report week to get this updated information.
<http://dsol-smed.phac-aspc.gc.ca/dsol-smed/fluwatch/fluwatch.phtml?lang=e>
Click on the map to view provinces/territories and maps for other weeks.
Influenza tests reported and percentage of tests positive, Canada, by report week, 2007-2008
Percent positive influenza tests, compared to other respiratory viruses, Canada, by reporting week, 2007-2008
![]()
Influenza strain characterization, Canada, cumulative, 2007-2008 influenza season by the Respiratory Viruses Section at the National Microbiology Laboratory
[N=118]
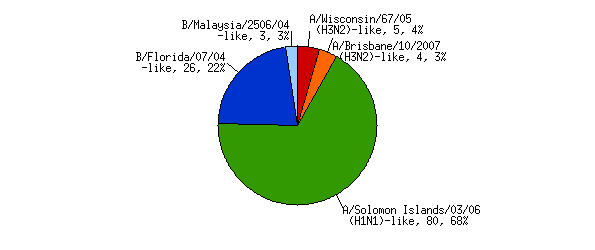
{Strain characterization, number identified, per cent of total number}
NACI recommends that the trivalent vaccine for the 2007-2008 season in Canada contain A/Solomon Islands/3/2006 (H1N1)-like virus; an A/Wisconsin/67/2005 (H3N2)-like virus; and a B/Malaysia/2506/2004-like virus.
Influenza-like illness (ILI) consultation rates, Canada, by report week, 2007-2008 compared to 1996/97 through to 2006/07 seasons
![]()
Note: No data available for mean rate in previous years for weeks 19 to 39 (1996-1997 through 2002-2003 seasons).
Number of New Outbreaks in Long Term Care Facilities, Canada, by Report Week, 2007-2008
![]()
Please note that the above graphs may change as late returns come in.