
Public Health Agency of Canada
www.publichealth.gc.ca
Common menu bar links
Institutional links
Diseases & Conditions
Health & Safety
Research & Statistics
Agency Information
Search Box
E-mail this page

Injuries associated with Guns - 1998-2003, All ages

SOURCE OF THE STATISTICS
Injury data were obtained from the database of the Canadian Hospitals Injury Reporting and Prevention Program (CHIRPP). CHIRPP is an injury surveillance system operating in the emergency departments of 10 pediatric and 4 general hospitals in Canada. Data collection began in April 1990 at the pediatric hospitals and between 1991 and 1995 in the general hospitals. CHIRPP is a program of the Injury and Child Maltreatment Section of the Health Surveillance and Epidemiology Division, Centre for Health Promotion, Public Health Agency of Canada.
Briefs and reports are updated when there is reason to believe the injuries or circumstances surrounding the injuries have changed. For example, the report of injuries associated with a specific product would be updated if the manufacturing regulations for the product are changed to include a new safety element. There is no need to update reports on a regular basis because frequent updates would simply increase the number of records included in the report but not necessarily result in any change in the patterns and distributions found.
LIMITATIONS
It is important to note that the injuries described do not represent all injuries in Canada, but only those seen at the emergency departments of the 14 hospitals in the CHIRPP network. Since most of the data comes from the pediatric hospitals, which are in major cities, injuries suffered by the following people are under-represented in the CHIRPP database: older teenagers and adults, who are seen at general hospitals; First Nation and Inuit people; and other people who live in rural areas. Fatal injuries are also under-represented in the CHIRPP database because the emergency department data do not capture people who died before they could be taken to hospital or those who died after being admitted.
INCLUSION AND EXCLUSION CRITERIA
An October 2005 search of the CHIRPP database (All ages, 1,479,302 records total, spanning 1998- 2003) for injuries associated with powder and nonpowder guns (CHIRPP codes 791,792,793,794), all intents, was conducted. Cases were then reviewed individually to remove irrelevant records (e.g. "toy gun", "water gun"). Paintball guns were also excluded. The search identified a total of 463 records.
RECOMMENDED CITATION
Injury briefs and reports and data from them may be copied and circulated freely provided that the source is acknowledged. The following citation is recommended:
Health Surveillance and Epidemiology Division (Public Health Agency of Canada). Injuries associated with guns: Canadian Hospitals Injury Reporting and Prevention Program (CHIRPP) database, 1998-2003, all ages.
FOR MORE INFORMATION
Please contact the Injury and Child Maltreatment Section, Health Surveillance and Epidemiology Division, by PHONE at (613) 957-4689, by FAX at (613) 941-9927 or visit our website at:
http://www.phac-aspc.gc.ca/inj-bles/index-eng.php
Background
This report divides guns into powder and non-powder guns. Powder guns (PG) include rifles, handguns or shot guns, and use gun powder as the propellant. Non-powder guns (NPG), which include BB guns, air guns or pellet guns, use compressed air, gas or spring action as the propellant.
According to the Canadian Firearm Act, an airgun is considered a firearm, and requires registration as such, when it has both a high muzzle velocity (greater than 500 feet per second (fps)) and a high muzzle energy (greater than 4.2 foot-pounds)). The "muzzle velocity" is the speed of a projectile at the instant it leaves the muzzle of a gun and the "muzzle energy" is the energy of a projectile at the instant it leaves the muzzle of a gun, expressed in joules or foot-pounds.1 Airguns with a muzzle velocity of 130 fps can achieve ocular penetration.2 The velocity at which pellets penetrate skin and bone varies depending on many factors, one of which is the pellet's caliber, but ranges from 150 to 350 fps.2,3,4,5
Overview
Between 1998 and 2003, 463 cases of injuries associated with both powder and non-powder guns were identified.
Table 1. Injuries associated with all gun types, as a proportion of all CHIRPP cases, all ages, both sexes, 1998-2003.
| Year | Total/100,000‡ | Powder gun records/100,000‡ | Non-Powder gun records/100,000‡ |
| 1998 | 91.2 | 34.0 | 45.6 |
| 1999 | 65.3 | 28.1 | 30.9 |
| 2000 | 79.9 | 42.6 | 33.9 |
| 2001 | 61.5 | 22.5 | 35.5 |
| 2002 | 56.0 | 30.5 | 24.6 |
| 2003 | 52.3 | 20.9 | 28.8 |
†Number of cases per 100,000 CHIRPP cases of all types, all ages, for the given year. Injuries associated with other and unknown gun types (n=32) were not included in this chart, but make up the remaining number of cases.
Age and sex distribution
Table 2. Age and sex distribution of patients who experienced injuries associated with both gun types, CHIRPP, all ages, both sexes, 1998-2003.
| Age (months) | # cases (% of cases) |
% male | #cases/100,000 CHIRPP† |
| <1 | 2 (0.4) | 100.0 | 8.5 |
| 1-4 | 5 (1.1) | 80.0 | 3.2 |
| 5-9 | 49 (10.6) | 79.6 | 35.1 |
| 10-14 | 132 (28.5) | 84.9 | 76.4 |
| 15-19 | 115(24.8) | 87.8 | 160.2 |
| 20-24 | 24(5.2) | 100.0 | 114.1 |
| 25-44 | 69(14.9) | 82.6 | 125.9 |
| 45-65 | 51(11.0) | 90.2 | 181.6 |
| 65+ | 16(3.5) | 93.8 | 104.3 |
| Total | 463(100.0) | 86.4 | 67.6 |
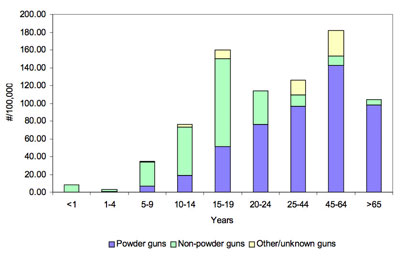
†Because CHIRRP collects information from ten children's hospitals and only four general hospitals, there is a high number of young children in the database. Using cases per 100,000 within an age group (instead of percentage by age group) adjusts for this uneven distribution.
Figure 1. Number of cases associated with gun type per 100,000 CHIRPP records in each age group, both sexes, 1998-2003.
Location
Table 3 shows the location where injuries associated with guns occurred, with a combined total of 45% occurring in and around private homes. There is a high proportion (51%) of unspecified location codes for powder gun cases when compared to other types.
Table 3. Location of injuries associated with guns, CHIRPP, all ages, both sexes, 1998-2003.
| Location | # cases (% of cases) |
Powder guns (% of PG) |
Non-powder guns (% of NPG) |
| Own home | 145(31.3) | 55(26.9) | 81(35.7) |
| Inside | 28 | 4 | 23 |
| Outside(garden/yard) | 46 | 7 | 37 |
| Unspecified | 71 | 44 | 21 |
| Other home | 63(13.6) | 9(4.4) | 50(22.0) |
| Inside | 18 | 0 | 17 |
| Outside(gardne/yard) | 22 | 3 | 17 |
| Unspecified | 23 | 6 | 16 |
| Road | 31(61.7) | 13(6.4) | 15(6.6) |
| Woods/Bush/Camp area | 22(4.8) | 10(4.9) | 9(4.0) |
| Public park and other sports/recreation area | 17(3.7) | 6(2.9) | 10(4.4) |
| School | 3(0.6) | 0(0.0) | 3(1.3) |
| Other specified | 163(35.2) | 104(51.0) | 51(22.5) |
| Total | 463(100.0) | 204(100.0) | 227(100.0) |
†Injuries associated with 'Other/Unknown' gun types (n=32) were not included in this chart, but are distributed across the locations and make up the remaining number of cases to total N=463.
Circumstance
Table 4 describes the patient's activity at time of injury. Figure 2, illustrates the different use of the two gun types. Non-powder guns most frequently result in an injury event when patient/other is involved in gun 'play'. This is contrasted by powder guns, where events are primarily intentional self-harm. In the 89 cases of intentionally self-inflicted injury, 43% occurred at patient's own home and another 44% were at an unspecified location.
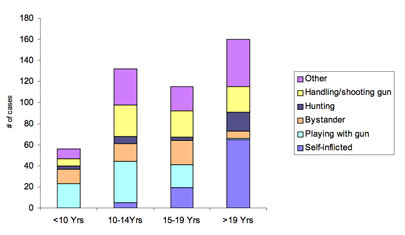
Figure 3 provides a breakdown of circumstance by age group. This chart demonstrates that it is the 10-19 year olds which when totalled, account for the majority of cases, due most frequently to 'playing with gun', as opposed to cases over the age of 19, where self-inflicted injury was most common.
Table 4. Activity at time of injury associated with gun, CHIRPP, all ages, both sexes, 1998-2003.
| Patient activity at time of injury | # cases (% of cases) | % cases of powder guns (n=204) | % cases of non-powder guns (n=227) | ||||||
| All Ages | <10 | 10-14 | 15-19 | >19 | <10 | 10-14 | 15-19 | >19 | |
| Intentionally self-inflicted | 89(19.2) | 0.0 | 2.0 | 7.4 | 28.9 | 0.0 | 0.0 | 0.4 | 0.4 |
| Playing alone/with friends with gun | 85(18.4) | 1.0 | 1.4 | 1.4 | 0.0 | 9.3 | 15.9 | 8.4 | 0.4 |
| Bystander | 1.4 | 2.5 | 1.4 | 1.4 | 0.0 | 9.3 | 15.9 | 8.4 | 0.4 |
| Handling gun (testing, cleaning, carrying) | 39(8.4) | 0.0 | 2.0 | 1.0 | 3.9 | 0.9 | 4.4 | 3.5 | 0.9 |
| Hunting | 31(6.7) | 1.0 | 1.0 | 1.0 | 5.3 | 0.0 | 2.2 | 0.4 | 0.9 |
| Shooting the gun | 26(5.6) | 0.0 | 0.0 | 0.0 | 2.0 | 0.4 | 2.6 | 3.5 | 1.8 |
| Target practise | 21(4.5) | 0.5 | 0.5 | 0.5 | 0.5 | 0.9 | 3.1 | 2.6 | 0.4 |
| Argument/fight | 9(1.9) | 0.0 | 0.5 | 1.5 | 1.0 | 0. | 0.4 | 0.4 | 0.0 |
| Alcohol/drugs involved | 8(1.7) | 0.0 | 0.0 | 0.0 | 2.0 | 0.0 | 0.0 | 0.0 | 0.9 |
| Illegal activity | 5(1.1) | 0.0 | 0.0 | 0.0 | 2.0 | 0.0 | 0.0 | 0.0 | 0.0 |
| Other/unknown | 89(19.2) | 1.5 | 5.9 | 3.9 | 13.7 | 2.6 | 7.5 | 3.5 | 1.3 |
| Total† | 463(100.0) | 11 | 32 | 37 | 124 | 43 | 94 | 71 | 19 |
†Injuries associated with 'Other/Unknown' gun types (n=32) were not included in this chart, but make up the remaining number of cases to total N=463.
Figure 2. Comparison of circumstance by gun type, CHIRPP, all ages, both sexes, 1998-2003.
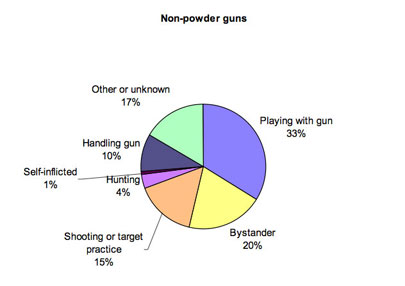
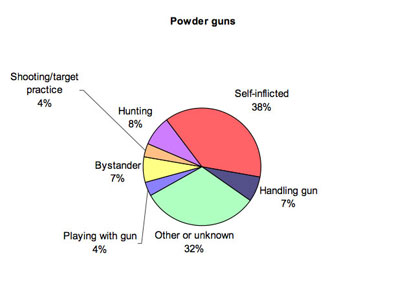
Figure 3. Comparison of circumstance by age group, CHIRPP, both sexes, 1998-2003.
How gun injuries occurred
Table 5 further describes what went wrong during the circumstance listed above, which then lead to the injury.
Table 5. How injury occurred in association with guns, CHIRPP, all ages, both sexes, 1998-2003.
| How gun injury occured | # cases (% of cases) |
Powder guns (% of PG) |
Non-powder guns (% of NPG) |
| Unintentional | 306 (66.1) | 79 (38.7) | 208 (91.6) |
| Shot, not further specified | 95 | 27 | 65 |
| Accidentally shot | 69 | 9 | 58 |
| Unexpected discharge/firing of gun | 42 | 19 | 20 |
| Unaware gun loaded/safety not on | 24 | 3 | 19 |
| Dropped gun/tripped while carrying gun | 16 | 9 | 5 |
| Moved into line of fire | 10 | 2 | 6 |
| Kickback | 9 | 6 | 0 |
| Hit/pinched/cut by gun (no discharge) | 14 | 2 | 10 |
| Ricochet | 26 | 2 | 24 |
| Other | 1 | 0 | 1 |
| Assault | 41(8.9) | 28(13.7) | 9(4.0) |
| Discharge of gun | 27 | 15 | 9 |
| Hit/cut by gun | 13 | 12 | 0 |
| Sexual assault at gunpoint | 1 | 1 | 0 |
| Intentional self-harm | 89(19.2) | 78(38.2) | 2(0.9) |
| Undetermined intent | 27(5.8) | 19(9.3) | 8(3.5) |
| Total† | 463(100.0) | 204(100.0) | 227(100.0) |
†Injuries associated with 'Other/Unknown' gun types (n=32) were not included in this chart, but make up the remaining number of cases to total N=463.
Gun handler
This table describes who was handling the gun at the time of injury. When examining all gun types combined, in just over half the cases, the patient was the handler, and in another 21% the handler was known to the victim.
Table 6. Person handling the gun at time of injury, CHIRPP, all ages, both sexes,1998-2003.
| Person handling the gun | # cases (% of cases) |
Powder guns (% of PG) |
Non-powder guns (% of NPG) |
| Patient | 237(51.2) | 114(55.8) | 105(46.3) |
| Friend or other known person | 46(9.9) | 7(3.4) | 37(16.3) |
| Patient or other known person | 24(5.2) | 2(1.0) | 20(8.8) |
| Sibling | 12(2.6) | 3(1.5) | 8(3.5) |
| Other relative | 12(2.6) | 3(1.5) | 9(4.0) |
| Hunter | 5(1.1) | 3(1.5) | 0(0.0) |
| Parent | 4(0.9) | 3(1.5) | 1(0.4) |
| Police | 2(0.4) | 2(0.9) | 0(0.0) |
| Other or unknown | 121(26.1) | 67(32.8) | 47(20.7) |
| Total† | 463(100.0) | 204(100.0) | 227(100.0) |
† Injuries associated with 'Other/Unknown' gun types (n=32) were not included in this chart, but make up the remaining number of cases to total N=463.
Type of gun
This table describes the type of gun involved in the injury event, by intent. In the cases involving nonpowder guns, 91.6% are unintentional events which contrasts with powder gun cases, where 39.2% are unintentional, 38.2% are self-inflicted and 13.7% are assault.
Table 7. Type of gun by intent, CHIRPP, all ages, both sexes,1998-2003.
| Type of gun | # cases (% cases) |
Self-inflicted (% self-inflicted) |
Unintentional (% unintentional) |
Assault† (% assault) | Other/ undetermined (% other) |
| Non-powder guns (pellet/air/BB) |
227(49.0) | 2(2.3) | 208(67.8) | 9(21.9) | 8(30.8) |
| Powder guns (gun/rifle/pistol) |
204(44.0) | 78(87.6) | 80(26.1) | 28(68.3) | 18(69.2) |
| Other/Unknown | 32(7.0) | 9(10.1) | 19(6.1) | 4(9.8) | 0(0.0) |
| Total | 463(100.0) | 89(100.0) | 307(100.0) | 41(100.0) | 26(100.0) |
†Includes one case of sexual assault at gunpoint and 3 cases of maltreatment.
Injuries associated with powder and non-powder guns
Table 8 shows the body region and the nature of injury. Overall the head, face and neck area were the most common body parts injured and overall, the most frequently observed injuries were embedded foreign bodies (34%), lacerations (20%) and eye injuries (9.5%). Of the eye injury cases, 80% were associated with non-powder guns.
Analyzing by gun type, changes this distribution. Non-powder gun injuries are concentrated in the head/face/neck and upper extremity portion of the body (85%) where powder gun injuries are more evenly distributed across the body. Injuries to the head/face/neck in the case of the powder guns consisted of intracranial injuries (27%), facial/skull fractures (23%) and lacerations (15%); 41% of these were selfinflicted. Injuries to the head/face/neck associated with non-powder guns displayed a different pattern, with embedded foreign bodies leading (42%), followed by eye injuries (32%) and no fractures.
Table 8. Body part and nature of injury, injuries associated with guns, CHIRPP, all ages, both sexes, 1998-2003.
| Body part† nature of injury | # of cases (% of cases) |
Powder guns (% of PG) |
Non-powder guns (% of NPG) |
| Head, Face, Neck | 193 (41.7) | 73 (35.8) | 109 (48.0) |
| foreign body eye injury laceration intracranial bruise/abrasion other head, face, neck facial fracture skull fracture |
54 44 30 24 12 12 11 6 |
6 7 11 20 4 8 11 6 |
46 35 16 2 7 3 0 0 |
| Upper Extremity | 131 (28.3) | 39 (19.1) | 86 (37.9) |
| foreign body laceration bruise/abrasion fractures nerve/muscle amputation other upper extremity |
74 29 9 8 5 1 5 |
12 13 2 6 4 1 1 |
62 15 4 2 0 0 3 |
| Trunk | 62 (13.4) | 43 (21.1) | 12 (5.3) |
| internal thorax/abdomen laceration foreign body bruise/abrasion spinal fracture other trunk |
25 20 8 4 3 2 |
22 11 4 2 3 1 |
0 5 4 2 0 1 |
| Lower Extremity | 49 (10.6) | 22 (10.8) | 19 (8.4) |
| foreign body laceration fractures bruise/abrasion other lower extremity |
21 14 7 2 5 |
6 8 6 0 2 |
13 3 1 1 1 |
| Multiple injuries | 23(5.0) | 23(11.2) | 0(0.0) |
| Other/unknown | 5(1.0) | 4(2.0) | 1(0.4) |
| Total†† | 463(100.0) | 204(100.0) | 227(100.0) |
†CHIRPP allows the reporting of up to 3 injuries. This table reports on the first, most serious injury.
†† Injuries associated with 'Other/Unknown' gun types (n=32) were not included in this chart, but make up the remaining
number of cases to total N=463.
Disposition
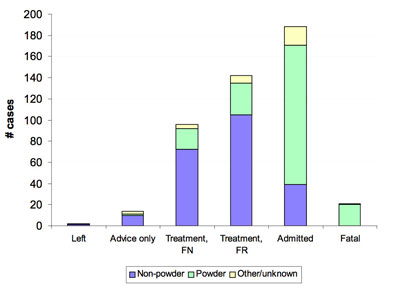
This section describes treatment for injuries associated with all gun types received in the emergency department (ED). Table 9 describes the severity of injuries experienced in association with powder guns, where almost 65% of cases required admission to hospital. Proportion of non-powder gun cases admitted was also higher than CHIRPP overall, at 17%.
Table 9. Treatment in the ED, injuries associated with guns, CHIRPP, all ages, both sexes, 1998-2003.
| Disposition | # cases(%) | CHIRPP Overall %† |
Powder guns (% of PG) |
Non-powder guns (% of NPG) |
| Left without being seen | 2(0.4) | 1.4 | 1(0.5) | 1(0.4) |
| Advice only | 14(3.0) | 17.6 | 1(0.5) | 10(0.4) |
| Treated, medical follow-up if necessary (FN) | 96(20.7) | 39.9 | 20(9.8) | 72(31.7) |
| Treated, medical follow-up required (FR) | 132(28.5) | 32.6 | 26(12.8) | 100(44.1) |
| Short stay, observed in ED | 10(2.2) | 1.8 | 4(2.0) | 5(2.2) |
| Admitted to hospital | 188(40.6) | 6.7 | 132(64.7) | 39(17.2) |
| Fatal | 21(4.5) | 0.04 | 20(9.8) | 0(0.0) |
| Total†† | 463(100.0) | 100.0 | 204(100.0) | 227(100.0) |
†The proportion of cases in the entire CHIRPP database for the given disposition, 1998-2003, all ages, both sexes.
††Injuries associated with 'Other/Unknown' gun types (n=32) were not included in this chart, but make up the
remaining number of cases to total N=463.
Analysis of admitted cases
Of the 40.6% of cases admitted to hospital (n=188), 46.3% were unintentional, 38.3% were intentionally self-inflicted and 8.0% were assaults. The majority of cases were due to lacerations (19.2%), followed by embedded foreign bodies (16.5%), internal injuries (11.7%), multiple injuries (10.6%), eye injuries (10.1%), intracranial head injuries (8.5%) and one amputation (finger or thumb). Overall, the head, face and neck were injured in 35.6% of admitted cases.
Analysis of fatal cases
There were 21 fatalities (20 in association with powder guns, 1 case unknown gun type), accounting for 8.6% of all CHIRPP fatalities, in this time-frame. The deaths fell into one of three circumstance categories: intentionally self-inflicted (66.7%), hunting (4.8%) or unknown (28.5%). Males accounted for 90.5% of the fatal cases.
Figure 4. Treatment required for injuries associated with powder versus non-powder guns, CHIRPP, all ages, both sexes, 1998-2003.
1 Canada Firearms Centre http://www.cfc-cafc.gc.ca/factsheets/airguns_e.asp
2 Laraque D. Injury risk of nonpowder guns.Pediatrics.2004 Nov;114(5):1357-61.
3 Chhetri D.K, Shapiro N.L A case of a BB-gun pellet injury to the ethmoid sinus in a child. Ear-Nose-Throat-J.2004
Mar;83(3):176,178,180.
4 Ford EG, Senac MO Jr, McGrath N. It may be more significant than you think: BB air rifle injury to a child's head. Pediatr Emerg
Care.1992 Dec;6(4)278-9.
5 Bond SJ, Schnier GC, Miller FB. Air-powered guns: Too much firepower to be a toy. J Trauma. 1996 Oct;(41)4:674-8.