Public Health Agency of Canada
www.publichealth.gc.ca
Common menu bar links
Institutional links
Diseases & Conditions
Health & Safety
Research & Statistics
Agency Information
Search Box
Canadian Perinatal Health Report - 2008 EDITION
An Overview of Perinatal Health in Canada - Part A
In 1995, Statistics Canada reported that Canada’s infant mortality rate in 1993 increased after a long series of successive annual declines over more than three decades.1 The increase in the infant mortality rate, from 6.1 per 1,000 live births in 1992 to 6.3 per 1,000 live births in 1993, was greeted with sensational headlines. The Globe and Mail 2 covered the story extensively:
“Rising deaths among infants stun scientists”
“Unexpectedly high mortality rate may be signal, demographers warn”
“Could this be the first indication that the environment is becoming increasingly toxic?”
This crisis was one of the first major challenges addressed by the then newly formed Canadian Perinatal Surveillance System (CPSS). The CPSS explained the unexpected rise in infant mortality as a consequence of changing birth registration practices, especially at the borderline of viability.3 An isolated, secular increase in the registration of live births with a birth weight <500 g was deemed to be responsible for the upturn in Canadian infant mortality. Not surprisingly, this prosaic explanation for a story with enormous potential for political rhetoric attracted little media attention.
Almost a decade later, Canadian infant mortality rates registered another upturn. The infant mortality rate increased from 5.2 per 1,000 live births in 2001 to 5.4 per 1,000 live births in 2002.4,5 The media reaction to this development was fortunately muted at the national level, although in Alberta, where the provincial infant mortality rate increased from 5.6 in 2001 to 7.3 per 1,000 live births in 2002, it was an altogether different story. Political and media groups in that province used the Statistics Canada press release6 to cast the mortality increase as a health care issue. This was not surprising given that Alberta was in the middle of an election campaign. The medical establishment was not beyond reproach either, with the Canadian Medical Association Journal carrying a news item blaming Alberta’s high infant mortality on babies from neighbouring provinces, multiple births and “a large First Nations population that experiences higher rates of alcohol and tobacco use.”7 The CPSS, in what has become a predictable lament, urged caution in interpreting an increasingly complex indicator, given regional and temporal variations in birth registration.8 On a related note, Canadian perinatologists involved in these controversies drew some measure of comfort from the fact that the United States simultaneously experienced a similar infant mortality hiccup. The infant mortality rate in the U.S. increased from 6.8 per 1,000 live births in 2001 to 7.0 per 1,000 live births in 2002, apparently the first increase in over four decades.9–11 The perinatal phenomena underlying such increases in infant mortality deserve close and dispassionate scrutiny as they are likely to become a regular feature of infant mortality statistics in industrialized countries.
Birth Registration Artefacts Influencing Infant Mortality Trends in Canada
Frequency of live births and stillbirths at the borderline of viability
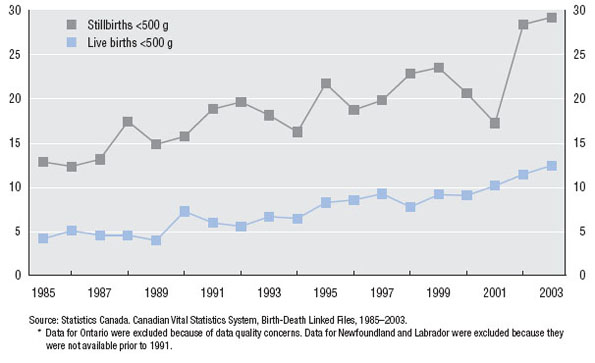
Live births <500 g have increased in frequency in recent years.3 Figure 1.A shows the frequency of live births <500 g as a proportion of all live births in Canada (excluding Ontario, and Newfoundland and Labrador). This proportion increased from 4.1 per 10,000 live births in 1985 to 12.4 per 10,000 live births in 2003. The rising rate of live births <500 g has an important bearing on temporal trends in infant mortality rates as such infants have very high rates of mortality (944 per 1,000 live births in Canada in 2000–2003). The rise in the registration of infants at the borderline of viability was not due to a decline in fetal, infant or maternal health because the frequency of other low birth weight categories did not alter substantially over this same period. Thus, low birth weight (<2,500 g) rates in Canada (excluding Ontario, and Newfoundland and Labrador) were 5.6% in 1985 and 5.7% in 2003.
Substantial changes have also occurred in stillbirths <500 g in Canada since the mid-1980s.12 In 1985, 12.8% of all stillbirths had a birth weight <500 g and this proportion increased to 29.2% in 2003 (Figure 1.A). Again, this relative increase in the registration of stillbirths <500 g was unrelated to any downturn in fetal or maternal health because similar increases did not occur in other low birth weight categories. The proportion of stillbirths with a birth weight between 500 and 2,499 g was 56.5% in 1985 and 48.6% in 2003.
FIGURE 1.A Rates of live births <500 g and stillbirths <500 g
Canada (excluding Ontario, and Newfoundland and Labrador),* 1985–2003
Live births <500 g per 10,000 live births (primary Y-axis)
Stillbirths <500 g per 100 stillbirths (secondary Y-axis)
Reasons for the increase in live births and stillbirths at the borderline of viability
Rules for live birth and stillbirth registration in Canada have not changed significantly in recent years. The definition of live birth used for the purposes of live birth registration was the standard World Health Organization (WHO) definition which includes all products of conception that show signs of life after birth;13 birth weight and gestational age criteria do not enter into this definition of live birth. The definition of stillbirth in Canada over this period included all fetal deaths with a birth weight ≥500 g or with a gestational age ≥20 weeks (or some variation of these criteria). Despite little change in these definitions over recent decades, the registration of live births and stillbirths at the borderline of viability has increased partly as a consequence of greater recognition of registration requirements. Such increases in birth registration have also been motivated by other factors including improvements in the survival of extremely low birth weight infants and social changes in attitudes towards the grieving process that accompanies the demise of such babies.
Contribution of prenatal diagnosis and pregnancy termination to trends in infant mortality
One major technologic change that has had a profound effect on the frequency of stillbirths and live births <500 g, and on trends in fetal and infant mortality as a whole, was the introduction and widespread uptake of prenatal diagnosis and pregnancy termination for serious congenital anomalies.14–17 Stillbirths <500 g that were due to congenital anomalies or pregnancy termination constituted 11.6% of all stillbirths <500 g in 1985 (Figure 1.B). This proportion increased to 40.4% in 2003. The proportion of neonatal deaths <500 g that were due to congenital anomalies or pregnancy termination increased from 3.6% in 1985 to 19.7% in 2003 (Figure 1.B). Note the change in the cause of death coding of stillbirths <500 g that (presumably) resulted from pregnancy termination following prenatal diagnosis—from the mid-1990s onwards, such deaths have been increasingly assigned pregnancy termination as the cause of death, rather than congenital anomaly.
FIGURE 1.B Cause- and birth weight-specific rates of stillbirth (Sb) <500 g and neonatal death (ND) <500 g
Canada (excluding Ontario, and Newfoundland and Labrador),* 1985–2003
Percentage of stillbirths <500 g due to CA or CA + PT (primary Y-axis)
Percentage of neonatal deaths <500 g due to CA or CA + PT (secondary Y-axis)
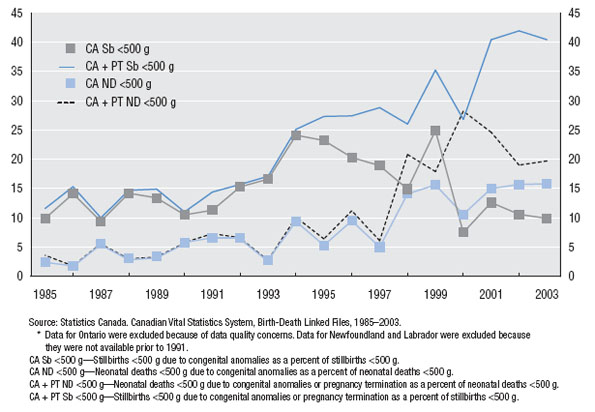
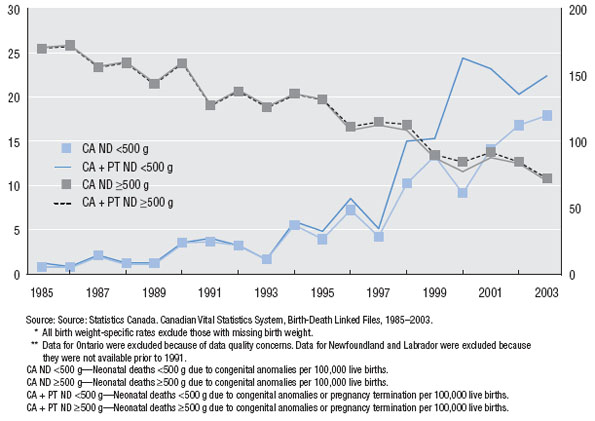
Figure 1.C shows the rate of neonatal death due to congenital anomalies or pregnancy termination expressed as a proportion of all live births. Neonatal deaths <500 g due to congenital anomalies or pregnancy termination increased from 1.3 per 100,000 live births in 1985 to 22.5 per 100,000 live births in 2003. Over the same period, neonatal deaths ≥500 g due to congenital anomalies or pregnancy termination decreased from 170.7 per 100,000 live births to 72.6 per 100,000 live births in 2003.
These patterns reflect the evolution of prenatal diagnosis and pregnancy termination over the last 15 years. Live births occasionally occur following prenatal diagnosis and pregnancy termination,18 and the increase in neonatal deaths <500 g due to congenital anomalies merely< reflects this uncommon event occurring against a background of secular increases in prenatal diagnosis (Figure 1.C). The beneficial effects of the technology are evident in the declining rate of late fetal deaths due to congenital anomalies and in infant deaths due to congenital anomalies among live births ≥500 g birth weight.15–17 Folic acid fortification of food in Canada19 since 1998 and improvements in surgical treatments for congenital malformations are other factors that have contributed to the decline in such late fetal and infant deaths.
FIGURE 1.C Cause- and birth weight-specific rates* of neonatal death (ND)
Canada (excluding Ontario, and Newfoundland and Labrador),** 1985–2003
CA and CA + PT neonatal deaths <500 g per 100,000 live births (primary Y-axis)
CA and CA + PT neonatal deaths ≥500 g per 100,000 live births (secondary Y-axis)
International Comparisons of Infant Mortality
A lack of standardization with regard to live birth and stillbirth registration undermines international comparisons of fetal and infant mortality rates.20–23 Some countries have systems of birth registration that are pragmatic rather than definition based, with live births being registered if they have a reasonable chance of survival. This results in lower rates of mortality, as compared with countries which closely adhere to WHO type definitions of live birth and fetal death. The fallacy inherent in international comparisons of infant mortality rates is highlighted by various examples:
- In 1994, the perinatal mortality rate in Germany increased by 20% from 5.5 per 1,000 total births to 6.6 per 1,000 total births24 due to a change in criteria for registering fetal deaths, from a birth weight requirement of 1,000 g and over to a birth weight requirement of 500 g and over.
- Sweden and Denmark do not register fetal deaths prior to 28 weeks of gestation, Italy does not register them before 180 days, the United Kingdom does not register them before 24 weeks, and France changed its definition from 28 weeks to 22 weeks in 2000.25
- Some European countries exclude all live births <500 g from their birth registers. The gestational age criterion for live birth registration in Sweden requires birth to occur after 27 weeks of gestation, while in Finland registration is limited to live births at 22 weeks of gestation and 500 g birth weight.25
Stillbirths and neonatal deaths in Canada versus England, Wales and Northern Ireland
A comparison of perinatal mortality indices in England, Wales and Northern Ireland (obtained from a recent Confidential Enquiry into Maternal and Child Health (CEMACH) publication26 ) with those from Canada illustrates some of the above-mentioned differences in birth registration and how these impact international comparisons. The stillbirth rate was 5.5 (95% CI: 5.5–5.6) per 1,000 total births in England, Wales and Northern Ireland in 2005, and 5.8 (95% CI: 5.5–6.2) per 1,000 total births in Canada (excluding Ontario) in 2003. The neonatal death rate in England, Wales and Northern Ireland in 2005 was 3.5 (95% CI: 3.4–3.7) per 1,000 live births, while in Canada in 2003 this rate was 3.6 (95% CI: 3.4–3.9) per 1,000 live births. Although both stillbirth and neonatal mortality rates were marginally higher in Canada, they are consistent with perinatal, neonatal and infant mortality rankings published by UNICEF and the Organisation for Economic Cooperation and Development (OECD), which place Canada and the United Kingdom in close proximity. UNICEF’s 2007 report,27 for instance, lists the neonatal and infant mortality rates in both countries in 2005 at 4 per 1,000 live births and 5 per 1,000 live births, respectively.
FIGURE 2.A Gestational age-specific stillbirth rates*
Canada (excluding Ontario),** 2003, and
England, Wales and Northern Ireland, 200526
Stillbirths per 1,000 fetuses at risk
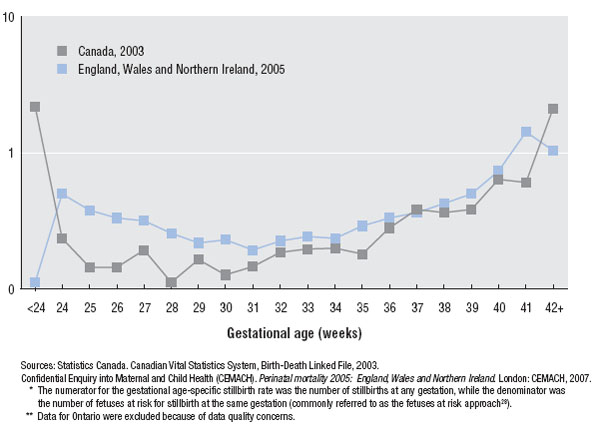
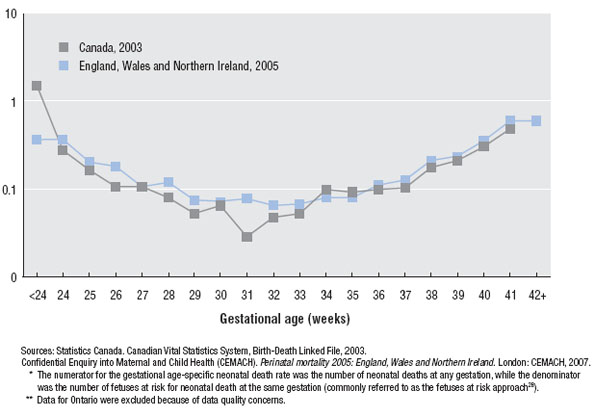
Gestational age-specific stillbirth rates, calculated according to the fetuses-at-risk approach,28–30 show lower rates of fetal death in Canada except at the extremes of gestation (Figure 2.A). At less than 24 weeks of gestation there were no stillbirths in England, Wales and Northern Ireland (per stillbirth registration practice). The low stillbirth rate at postterm in England, Wales and Northern Ireland may reflect reliance on menstrual dates for gestational age estimation,31 or practice differences related to clinical management of pregnancy at and after 41 weeks of gestation (the frequency of postterm birth, i.e., ≥42 weeks, was 4.4% in England, Wales and Northern Ireland versus 0.9% in Canada). The incidence of neonatal death, revealed a pattern similar to the stillbirth contrast, with lower neonatal mortality rates in Canada at virtually all gestational ages (Figure 2.B).
FIGURE 2.B Gestational age-specific rates of neonatal death*
Canada (excluding Ontario),** 2003, and
England, Wales and Northern Ireland, 200526
Neonatal deaths per 1,000 fetuses at risk
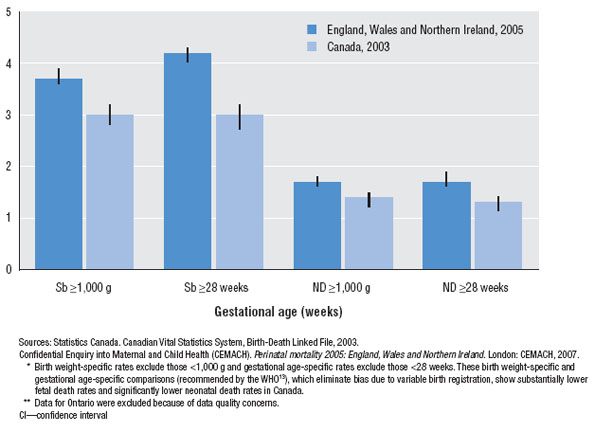
Correcting for the differences in birth registration, by examining mortality rates among births with a birth weight ≥1,000 g or with a gestational age ≥28 weeks, leads to substantial changes in mortality statistics, with rates in Canada being significantly lower than rates in England, Wales and Northern Ireland (Figure 2.C).* However, the purpose of this comparison is not to conclude that Canadian perinatal health status is superior to that in England, Wales and Northern Ireland, nor to speculate about potential differences in the provision of care services. Rather, these analyses highlight the lack of validity in contemporary rankings of countries by crude infant mortality rates and related indices due to differences in birth registration. Differences in the measurement of gestational age are another important issue which could underlie some of the differences in mortality rates noted above.31 Publications like the CEMACH report26 and this Canadian Perinatal Health Report will hopefully lead the movement towards a more rational and meaningful comparison of international health indices.
FIGURE 2.C Gestational age- and birth weight-specific stillbirth and neonatal death rates*
Canada (excluding Ontario),** 2003, and
England, Wales and Northern Ireland, 200526
Stillbirths (Sb) or neonatal deaths (ND) (95% CI) per 1,000 total/live births
Birth Weight-Specific Infant Mortality in Canada
Temporal trends
Figure 3.A shows Canadian infant mortality rates among all live births, live births with a birth weight ≥500 g and live births with a birth weight ≥1,000 g. Whereas the crude infant mortality rate in Canada (excluding Ontario) declined from 6.4 per 1,000 live births in 1991 to 4.9 per 1,000 live births in 2003 (a 23% decrease), the infant mortality rate among live births ≥500 g decreased from 5.8 per 1,000 live births to 3.7 per 1,000 live births (a 36% decrease), and the infant mortality rate among live births ≥1,000 g decreased from 4.4 to 2.5 per 1,000 live births from 1991 to 2003 (a 44% decrease). These estimates of birth weight-specific infant mortality permit a more valid assessment of temporal trends in infant death rates in Canada since they are free from confounding by simultaneous changes in the registration of live births at the borderline of viability.
Variations between provinces and territories
Figure 3.B shows crude and birth weight-specific rates of infant death in the provinces and territories of Canada for the three years 2001–2003 combined. Again, the alternative indices illustrate how rankings based on crude infant mortality rates can yield results that are at variance with those obtained from birth weight-specific estimates. For example, Saskatchewan had a lower crude infant mortality rate than Alberta (6.0 versus 6.3 per 1,000 live births). On the other hand, the infant mortality rate ≥500 g was higher in Saskatchewan compared with Alberta (5.5 versus 4.9 per 1,000 live births) as was infant mortality among live births ≥1,000 g (3.7 versus 3.3 per 1,000 live births).
FIGURE 3.A Temporal trends in infant mortality rates (IMR)
Canada (excluding Ontario),* 1991–2003
Infant deaths (95% CI) per 1,000 live births**
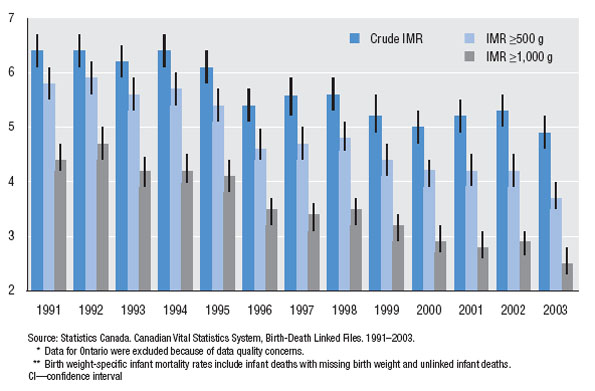
FIGURE 3.B Rates of infant mortality (IMR), by province/territory
Canada (excluding Ontario),* 2001–2003
Infant deaths (95% CI) per 1,000 live births**
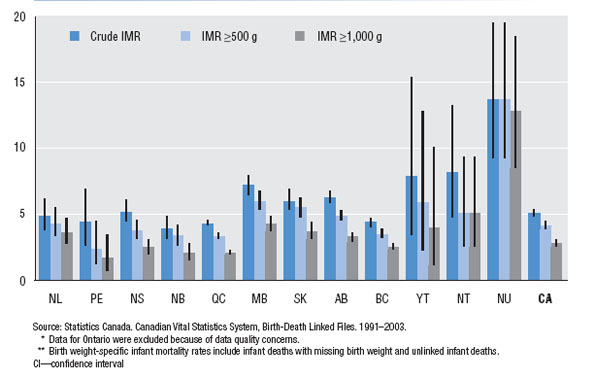
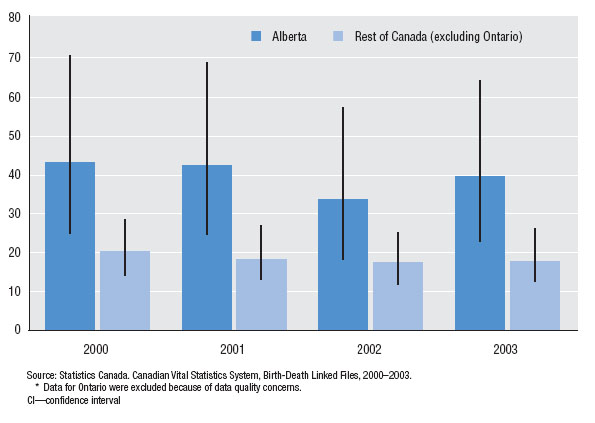
The situation in Alberta deserves mention, especially because of the unwarranted press it received over its infant mortality rate in 2002. In 2004, the rate of infant mortality in Alberta was 5.8 per 1,000 live births and this was lower than rates in Manitoba, Saskatchewan, the Yukon and Nunavut (page 146). Two features of perinatal outcomes in Alberta are worthy of note. First, the rate of preterm birth in Alberta in 2004 was higher than in any other province (rates in the three territories were higher, page 125), while the rate of small-for-gestational-age live births in Alberta was the highest in Canada (page 131). A second feature of Alberta that has an important bearing on its rate of infant death was the diligence with which live births at the borderline of viability were registered. Figure 4.A shows the higher frequency with which live births <500 g are registered in Alberta as compared with the rest of Canada. Figure 4.B shows the rate of neonatal deaths due to congenital anomalies or pregnancy terminations among live births with a birth weight <500 g. The higher rate of such births in Alberta likely reflects a more accurate and complete documentation of births at the borderline of viability, especially those that follow prenatal diagnosis and pregnancy termination for major congenital malformations. Clearly, differences in birth registration practices not only invalidate international comparisons of infant mortality but also undermine interprovincial/territorial comparisons within Canada. The birth weight-specific infant mortality rates provided in Figure 3.B allow more meaningful interpretation, while similar contrasts of stillbirth rates ≥500 g provided elsewhere in this Report allow standardized interprovincial and territorial comparisons of fetal mortality.
FIGURE 4.A Rates of live births <500 g*
Alberta and the rest of Canada (excluding Ontario),** 2000–2003
Live births <500 g (95% CI) per 10,000 live births
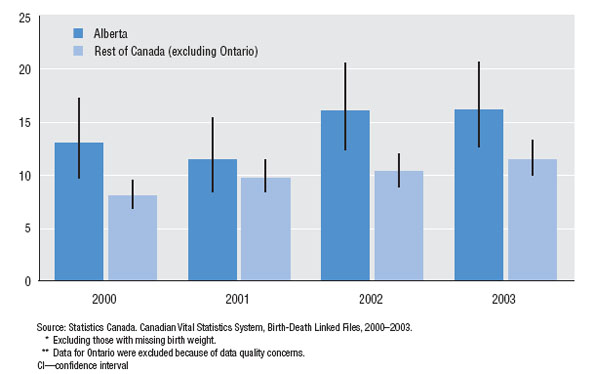
FIGURE 4.B Rates of neonatal deaths <500 g due to congenital anomalies (CA) or pregnancy
termination (PT)
Alberta and the rest of Canada (excluding Ontario),* 2000–2003
CA + PT neonatal deaths <500 g (95% CI) per 100,000 live births
Infant Mortality among First Nations, Inuit and Métis Populations
The lack of standardization that plagues international and interprovincial comparisons of fetal and infant mortality also clouds our understanding of perinatal health status among First Nations, Inuit and Métis populations. In fact, this issue is probably of greater consequence to Canada than international ranking of countries by infant mortality, as it has a direct bearing on policy and on the provision of health services.
Over a decade ago, the Royal Commission on Aboriginal Peoples32 documented the fact that the infant mortality rate among Aboriginal populations of Canada has been two-fold higher than that among the non-Aboriginal population for more than a century. Recently, however, the First Nations and Inuit Health Branch released a fact sheet33 stating that the infant mortality rate in the First Nations population had dropped to 6.4 per 1,000 live births in 2000 (almost on par with the infant mortality rate of 5.3 per 1,000 live births for Canada in 2000). Other federal publications echoed this finding stating that the infant mortality rate for First Nations peoples in 2000 was 6.2 per 1,000 live births.34 There is now fair consensus that these rates are underestimates.
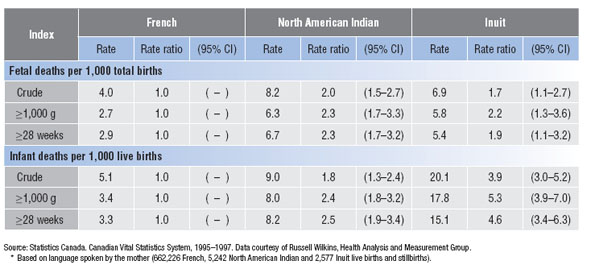
The argument that First Nations, Inuit and Métis populations have a sub-optimal perinatal health status requiring serious public health attention is difficult to make partly because of inadequate and poor quality surveillance information. This was borne out by a recently published research study on singleton births from Quebec35 which showed that stillbirth rates among French, English, Inuit and North American Indian populations (defined on the basis of the language spoken by the mother) in 1995–1997 were 3.9, 3.4, 2.7 and 9.3 per 1,000 total births, respectively, while infant mortality rates were 4.4, 4.2, 23.1 and 7.5 per 1,000 live births, respectively. Note the high rates of stillbirth in the North American Indian population (approximately two- to three-fold higher than among the French and English) and the high rates of infant mortality among the Inuit (five- to six-fold higher than among the French and the English). Such excess mortality among Aboriginal populations is congruent with the century-old pattern of a two-fold higher infant mortality rate documented by the Royal Commission.32 Nevertheless, there is evidence to suggest that even these mortality statistics for First Nations, Inuit and Métis populations are underestimates of true rates because of an under-registration of births at the borderline of viability.
Figure 5.A shows the incidence of birth28 among French, North American Indian and Inuit women from Quebec in 1995–1997. At gestational ages <32 weeks, North American Indian women experienced lower rates of birth compared with French women, while Inuit women experienced higher rates. When fetal and infant mortality rates were examined using a similar calculation, mortality beyond 24 weeks of gestation was substantially higher among North American Indian and Inuit women (Figure 5.B). A similar picture emerged when fetal and infant mortality rates were examined separately. Most of the patterns in these graphs are consistent with a priori expectation, but the low frequency of births between 20 and 23 weeks in the North American Indian population deserves comment. Although a low birth rate could represent healthier North American Indian fetuses and mothers (relative to French fetuses and mothers), the patterns of birth and fetal/infant mortality at subsequent gestational ages suggest otherwise. The low birth rate between 20 and 23 weeks in the North American Indian population probably represents an under-registration of births at the borderline of viability.
FIGURE 5.A Gestational age-specific birth rates,* by population group
Quebec, 1995–1997
Births per 1,000 fetuses at risk
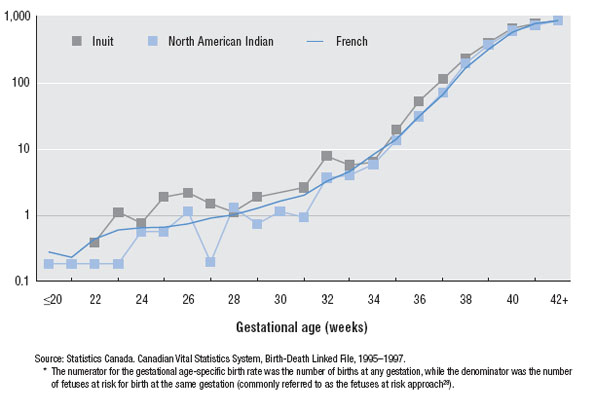
FIGURE 5.B Gestational age-specific rates of fetal and infant death,* by population group
Quebec, 1995–1997
Fetal and infant deaths per 1,000 fetuses at risk
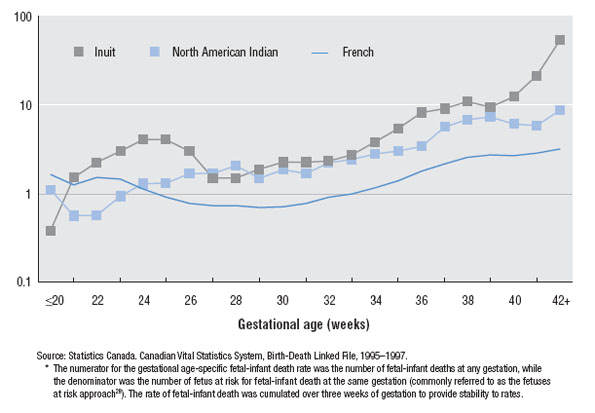
Figure 5.C shows stillbirth and infant mortality rates among the French, North American Indian and Inuit populations within birth weight and gestational age-specific categories where birth registration is likely to be complete. Most birth weight- and gestational age-specific rates of fetal and infant death were more than two-fold higher among the North American Indian and Inuit populations than among the French population. True fetal and infant mortality rate differentials between First Nations, Inuit and Métis populations and the rest of the Canadian population are likely to be higher than the two-fold excess highlighted by the Royal Commission.32
FIGURE 5.C Rates of fetal and infant mortality, by population group*
Quebec, 1995–1997
Birth Registration in Ontario
It is widely acknowledged that for the last 15 years, vital statistics data from our most populous province have been beset by a number of serious problems. Poor data quality on birth weight led to a public health crisis in the mid-1990s when it appeared that Ontario, and consequently Canada, faced an epidemic of low birth weight births.36 Similarly, errors in gestational age resulted in an increase in the preterm birth rate in 1994 and 1995, and data for these years remain uncorrected to date (page 297). Fees for obtaining birth certificates in Ontario (introduced in Ontario municipalities in mid-1996 and 1997 and not required in any other region of Canada) led to a documented under-registration of live births especially among vulnerable sub-populations, such as single mothers and infants born with a low birth weight.37,38 This issue, widely publicized in the media in early 2007, led to an undertaking from the provincial government to revoke such fees. Fees remain, however, and have in fact increased in some jurisdictions. The unresolved birth registration issues in the province represents an unfortunate weakness in national perinatal health surveillance.
The case of the missing birth registrations
Perhaps the most enigmatic of the problems that plague Ontario data is the issue of missing birth registrations for a substantial fraction of infant deaths. Statistics Canada (under a contract with the CPSS and the Public Health Agency of Canada) has annually undertaken a linkage of live birth and infant death registrations. This project provides valuable public health and clinical information (including gestational age-specific infant mortality rates and information on the antecedents of infant death). In all provinces of Canada, except Ontario, this linkage was almost entirely successful and birth registrations of all infants who died were identified in all but a handful of cases (10 of 969 infant deaths (1.1%) remained unlinked for the 2003 birth cohort). In Ontario, however, linkage was typically unsuccessful in a large fraction of infant deaths (295 of 697 infant deaths (42.3%) were unlinked in 2003). A brief description of the above-mentioned unlinked infant deaths in Ontario (i.e., those with missing birth registrations) is provided here in the hope that it will shed some light on this seemingly intractable problem.
Temporal trends in unlinked infant deaths
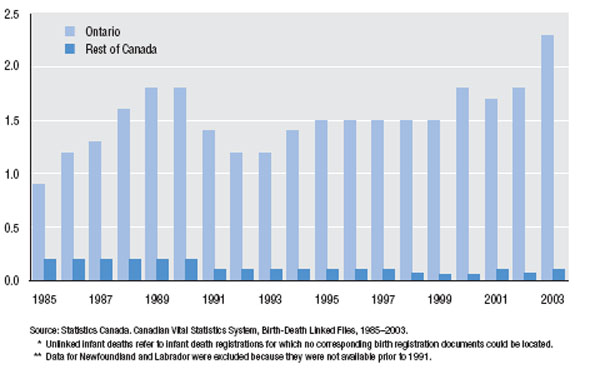
Of the 15,799 infant deaths in Ontario that occurred between 1985 and 2003, 3,987 did not appear to have been registered at the time of birth. The anomaly of unlinked live births in Ontario is not a new phenomenon and was evident in live birth and infant death registrations from the mid-1980s (Figure 6). Whereas the frequency of unlinked infant deaths has decreased in Canada (excluding Ontario) in recent years (Figure 6), the rate of such infant deaths increased in Ontario. Thus, in 1985, 43 infant deaths could not be linked to their birth registrations (0.18 per 1,000 live births) in Canada (excluding Ontario) and this number fell to 10 in 2003 (0.05 per 1,000 live births). In Ontario, the frequency of unlinked infant deaths increased from 122 (0.92 per 1,000 live births) in 1985 to 295 (2.25 per 1,000 live births) unlinked deaths in 2003. During this same period, the infant mortality rate among linked infant deaths in Ontario decreased from 6.3 per 1,000 live births in 1985 to 3.1 per 1,000 live births in 2003.
Time of death
The timing of death among unlinked infant deaths in Ontario was very different from the timing of death among linked infant deaths. Between 1985 and 2003, the neonatal mortality rate among linked infant deaths was 2.9 per 1,000 live births and the postneonatal mortality rate was 1.6 per 1,000 live births. The ratio of neonatal to postneonatal mortality rates was 1.9 among these linked infant deaths in Ontario (i.e., approximately 65% of such infant deaths occurred in the neonatal period). This ratio was identical to the same ratio for linked infant deaths in Canada (excluding Ontario). However, among unlinked infant deaths in Ontario, the neonatal death rate was 1.3 per 1,000 live births and the postneonatal death rate was 0.18 per 1,000 live births, yielding a ratio of 7.6 (i.e., approximately 88% of unlinked infant deaths occurred in the neonatal period). The same ratio among the smaller number of unlinked infant deaths in the rest of Canada was 3.2.
FIGURE 6 Frequency of unlinked infant deaths*
Ontario and the rest of Canada (excluding Newfoundland and Labrador),** 1985–2003
Unlinked infant deaths per 1,000 live births
Region of residence
Examination of linked and unlinked infant deaths by region of residence did not yield any unexpected patterns. An arbitrary geographic categorization of Ontario into eight regions (based on census subdivisions) showed that the linked infant death rate was approximately three- to six-fold higher than the unlinked death rate in each of the regions examined.
Cause of death
Analysis of the causes of death among linked and unlinked infant deaths showed that some causes of death were over-represented among the unlinked infant deaths whereas others were under-represented. The overall pattern appeared to be consistent with neonatal deaths being more likely to remain unlinked and postneonatal deaths being less likely to remain unlinked. Thus, the ratio of linked versus unlinked deaths (by cause of infant death) was 3.2 for congenital anomalies and 8.2 for sudden infant death syndrome (SIDS). Causes of neonatal death such as short gestation and low birth weight, maternal complications of pregnancy, respiratory distress syndrome, complications of the placenta cord and membranes, perinatal infection, hypoxia and birth asphyxia, as well as neonatal hemorrhage had ratios (of linked to unlinked infant death rates) under 3. On the other hand, causes of postneonatal death such as accidents, pneumonia and influenza had death ratios (of linked to unlinked infant deaths) which exceeded 3.
Other features of unlinked deaths
Unlinked infant deaths showed a preponderance of males, although to a lesser extent than linked infant deaths. Other analyses by month of death were uninformative, while place of death analyses showed that 93% of unlinked infant deaths had occurred in hospital (relative to 89% of hospital deaths among linked infant deaths).
“Whodunit”
A few tentative insights may be gleaned from this analysis regarding the cause of missing birth registrations in Ontario:
- The problem is longstanding and preceded the introduction of fees for birth registration.
- The problem is widespread across all regions of the province.
- The rate of unlinked infant deaths appears to be increasing in magnitude in recent years. The number of unlinked infant deaths has increased even as the number of live births and infant mortality rates have declined, and currently almost one in two (42%) infant deaths do not appear to have a birth registration.
- The excess of neonatal deaths, hospital deaths and deaths due to causes that operate in the perinatal period (among the unlinked infant deaths) raises the possibility that the missing birth registrations involve relatively complicated births.
- The significance of the small deficit of males among unlinked infant deaths is uncertain.
- The absence of a similar problem with infant deaths from other provinces and territories absolves the method used to link birth and infant death registrations.
Overall, this picture suggests a centralized problem in Ontario, possibly at the data collation level. Details such as the plurality, the birth weight and gestational age, etc., of the unlinked infant deaths cannot be obtained from the death registration as such details are only available in the birth registration (to which the death registration cannot be linked). Only a careful investigation can shed further light on this impediment to Canadian perinatal surveillance.
Trends in Preterm Birth and Low Birth Weight
Despite the recognition that preterm birth is the most important perinatal challenge facing industrialized countries, two decades of clinical and community efforts at preterm birth prevention have failed to reduce rates of preterm birth. In fact, preterm birth rates in Canada have increased from 6.4% in 198139 to 8.2% in 2004 (and to 7.9% in Canada (excluding Ontario) in 200540 ). The primary factors cited in connection with this increase include increased rates of obstetric intervention (i.e., medically indicated labour induction and cesarean delivery), increases in older maternal age and increases in multiple births. Although there is a tendency to view the contribution of obstetric intervention, older maternal age and multiple births are more likely to have multiple births both spontaneously and because they are more likely to require assisted reproduction. Older women and those pregnant with multiples are also more likely to deliver following a medically indicated preterm labour induction or preterm cesarean delivery.
Increases in preterm induction and preterm cesarean delivery have been concentrated at 34 to 36 weeks of gestational age and have occurred primarily among high-risk pregnancies.41 This latter point is well illustrated by increases in preterm birth among multiple births, a high-risk group which experiences substantially higher rates of perinatal mortality and serious neonatal morbidity. The frequency of preterm birth among multiple births has increased from about 30% in the 1970s,42 to 40% in the early 1980s, to 50% in the 1990s43 and to 58.4% in 2004 (page 270). The therapeutic efficacy of medically indicated iatrogenic preterm birth in preventing death is evident in the inverse relationship between population increases in preterm birth and simultaneous declines in stillbirth rates and perinatal mortality rates.41,43–47 With recent increases in preterm birth viewed as the product of obstetric efforts to reduce perinatal mortality, the preterm birth rate indicator, once a reliable barometer of population perinatal health, has become transformed into a more complex and heterogenous marker of both population perinatal health status and perinatal health care services. As for the increasing tendency towards iatrogenic preterm delivery (given fetal compromise), more research, especially through the long-term follow-up of babies born at 34–36 weeks, is needed to fully frame the cost-benefit equation.48 Although medically indicated obstetric intervention which prevents perinatal death is laudable, long-term effects such as neuro-developmental impairment, handicap and disability need to be a part of the equation that determines therapeutic indices such as the number needed to treat.
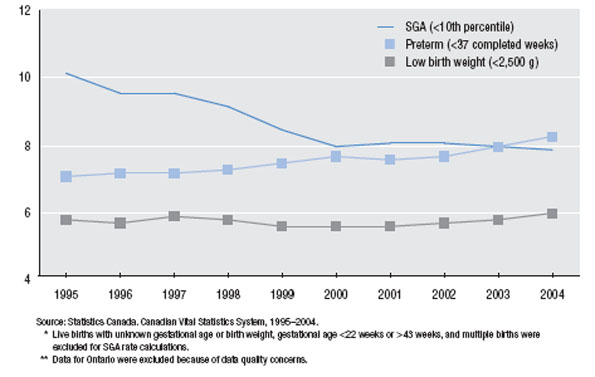
A second issue related to preterm birth that this Report highlights, concerns the temporal patterns in preterm birth versus small-for-gestational-age (SGA) live birth in Canada. Rates of preterm birth in Canada increased from 7.0% in 1995 to 8.2% in 2004, while rates of SGA declined substantially from 10.1% in 1995 to 7.8% in 2004 (pages 124 and 131). However, these dramatic changes in the perinatal landscape are mostly masked when perinatal health status is examined using the low birth weight index. As Figure 7 shows, the low birth weight rate in Canada has remained generally stable despite the above-mentioned changes in preterm birth and fetal growth restriction. In fact, it is the simultaneous increases in the preterm birth rate and the decline in SGA rate that is responsible for the stability of the low birth weight rate in Canada. This masking of important perinatal phenomena is one reason for focusing on preterm birth and SGA rates instead of low birth weight. Also, low birth weight is a heterogenous entity and its components, namely, preterm birth and SGA, are different from both an etiologic and prognostic standpoint.49,50 For these reasons, Canadian Perinatal Health Reports, past and current, have provided information on preterm birth and SGA rates in Canada, but not on low birth weight rates. The small increase in low birth weight rates evident in recent years (i.e., from 5.5% in 2001 to 5.9% in 2004) noted in a recent publication from the Canadian Institute for Health Information (CIHI)51 is best understood within the context of rising rates of preterm birth.
FIGURE 7 Rates of small-for-gestational-age (SGA) live birth, preterm birth and low birth weight*
Canada (excluding Ontario),** 1995–2004
Frequency (%)