
Public Health Agency of Canada
www.publichealth.gc.ca
Common menu bar links
Institutional links
Diseases & Conditions
Health & Safety
Research & Statistics
Agency Information
Search Box
E-mail this page
Report from the National Diabetes Surveillance System: Diabetes in Canada, 2008
[Previous] [Table of Contents] [next]
Health Services Utilization10
Two measures of health services utilization are the number of visits to physicians (family physicians and specialists) and the length (days) of hospital stays.
For Adults Aged 20 Years and Older:
- In 2005-2006, younger adults (aged 20 to 49) with diagnosed diabetes had about 2 times as many visits to family physicians (Figure 11) and 2 to 3 times as many visits to specialists (Figure 12) than individuals without diabetes. Even in the oldest age groups, individuals with diagnosed diabetes visited physicians about 1.5 times more than individuals without diabetes.
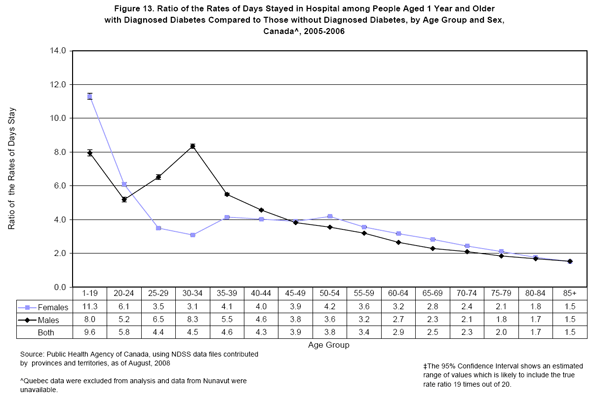
- During the 2005-2006 fiscal year, adults with diagnosed diabetes stayed more days in hospital than individuals without diabetes. For hospitalized adults with diagnosed diabetes, aged 20 to 29 and 35 to 54 years old, the number of days stayed in hospital was about 4 to 6 times the number of days stayed by individuals without diabetes. Among those older than 54 years, the ratio of days stay between those with diabetes and those without ranged from 2 to 3. (Figure 13)
For Children and Adolescents Aged 1 to 19 Years Old:
- Children and adolescents with diagnosed diabetes had about 1.5 times more visits to family physicians (Figure 11) and 4 times as many visits to specialists (Figure 12) as children and adolescents without diabetes, in 2005-2006.
- During 2005-2006, hospitalized children and adolescents with diagnosed diabetes, aged 1 to 19, stayed about 8 to 11 times the number of days in hospital than hospitalized individuals without diabetes. (Figure 13)
Figure 11. Ratio of the Rates* of Visits to Family Physicians among People Aged 1 Year and Older with Diagnosed Diabetes Compared to Those without Diagnosed Diabetes, by Age Group and Sex, Canada^, 2005-2006
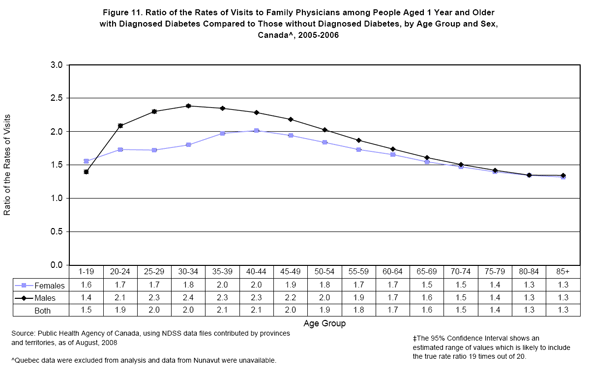
Figure 12. Ratio of the Rates* of Visits to Specialists among People Aged 1 Year and Older with Diagnosed Diabetes Compared to Those without Diagnosed Diabetes, by Age Group and Sex, Canada^, 2005-2006
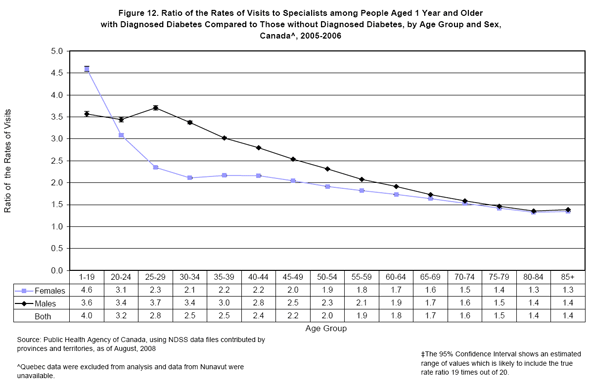
Figure 13. Ratio of the Rates* of Days Stayed in Hospital among People Aged 1 Year and Older with Diagnosed Diabetes Compared to Those without Diagnosed Diabetes, by Age Group and Sex, Canada^, 2005-2006
- Data are ratios of age-specific rates.
[Previous] [Table of Contents] [next]