| |
|||||||||||||||||
| |
||
|
|
||
|
Volume 27-11
|
RESPIRATORY VIRUS SURVEILLANCEFluWatch Project, 2000-2001
|
|
|
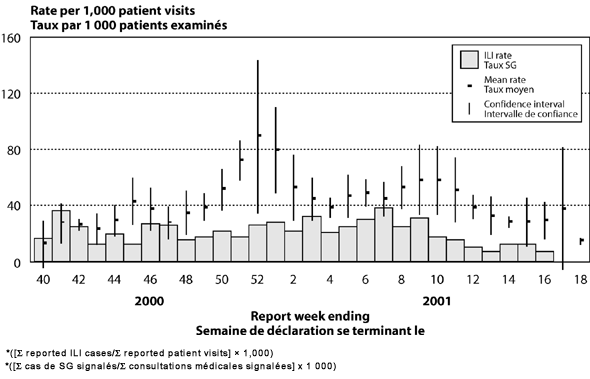
Figure 1: Census Division weighted age-standardised
influenza-like illness (ILI) rates*, Canada, by report week for the 2000-2001
Influenza season compared to 1996/97 through 1999/2000 seasons (mean rate
with 95% confidence intervals) Figure 2: Number of positive influenza tests by influenza type A and B and percentage of tests positive, Canada, by report week for the 2000-2001 influenza season 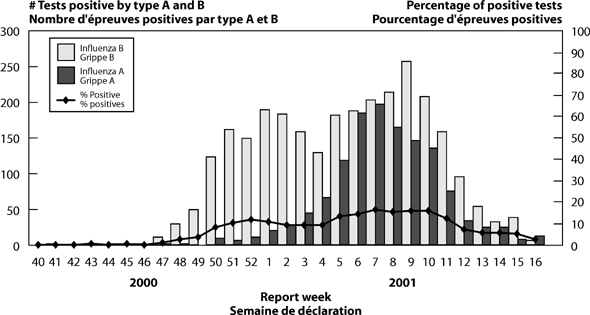 |
||
|
Twelve percent, (506/4,154) positive influenza isolates, were referred to the National Microbiology Laboratory (NML) for strain characterization. Of the influenza A isolates identified, 19% (248/1,324) were antigenically characterized: 99% (246) were H1N1 and 1% (two) were H3N2. Of the influenza A (H1N1) isolates, 98% (241/246) were similar to A/New Caledonia/20/99 and 2% (5/246) were similar to A/Johannesburg/82/96. Although, A/Johannesburg/82/96 (H1N1)-like viruses are antigenically distinct from A/New Caledonia/20/99 (H1N1)-like viruses, the A/New Caledonia/20/99 vaccine strain produces high titres of antibody that cross-react with A/Johannesburg/82/96 (H1N1)-like viruses(1). The two influenza A (H3N2) viruses that have been characterized were antigenically similar to the vaccine strain A/Panama/2007/99. Of the influenza B isolates, 9% (258/2,830) were antigenically characterized as B/Yamanashi/166/98. However, it has been noted that 89% of the influenza B isolates characterized by the Centers for Disease Control and Prevention (CDC) were more closely related antigenically to B/Sichuan/379/99, a reference strain which has been found to cross react with B/Yamanashi/166/98*. Preliminary results of genetic analyses completed at the NML showed that this antigenic change was found in a percentage of the Canadian influenza B isolates(2). It should also be noted that B/Sichuan/379/99 virus exhibits cross-reactivity with the 2000-2001 vaccine strain. The vaccine strains in the 2000-2001 influenza vaccine either matched or produced high titres of antibody that cross-reacted with all of the A and B strains characterized by the NML during the 2000-2001 season. In the USA, influenza activity peaked in late January and early February, 2001. During weeks three to five, the overall percentage of patient visits for ILI peaked at 4%, compared to a peak range of 5% to 6% in the previous 3 years. Likewise, the peak in the percentage of laboratory tests positive for influenza was 24% in week 4, compared to a peak range of 28% to 33% in the previous 3 years. The proportion of all deaths due to pneumonia and influenza has been below the epidemic threshold throughout the season(1). The overall percentage of positive laboratory tests for influenza A was 55%. Thirty eight percent of influenza A isolates were characterized, of which 95% were A/New Caledonia/20/99 (H1N1)-like and 5% were A/Bayern/07/95 (H3N2)-like. Six percent of influenza B isolates were characterized, of which 88% were B/Sichuan/379/99-like and 12% were B/Beijing/184/93-like. Internationally, influenza activity in the Northern hemisphere was initially reported during the third week of November 2000 and peaked in early to mid-February 2001. Influenza activity was mainly due to influenza A (H1N1) which co-circulated with influenza B. Influenza A (H3N2) viruses were isolated sporadically. Many countries reported outbreaks of both influenza A (H1N1) and influenza B. However, no countries reported any outbreaks of influenza A (H3N2). In most countries, children and young adults were most greatly affected(2). Since, 24 September, 2000, 22,568 influenza virus isolates have been reported to FluNet. Of these, 49% (11,132) were influenza B and 51% (11,436) were influenza A. Of the influenza A viruses, 8% (1,733) were influenza A (H1N1), 4% (805) were influenza A (H3N2) and 39% (8,898) were unsubtyped influenza A(2). The World Health Organisation recommends that the vaccine for the 2001-2002 season (Northern hemisphere, winter) should contain the following components:
* The CDC reports that although A/Bayern-like viruses are antigenically distinct from the A/New Caledonia-like viruses, the A/New Caledonia/20/99-like vaccine strain produces high titres of antibody that cross-react with A/Bayern/07/95-like viruses(1). Likewise, the B/Beijing/184/93-like vaccine strain (and the Canadian equivalent, B/Yamanashi/166/98-like vaccine strain) produce high titres of antibody that cross-react with B/Sichuan/379/99-like virus(1). † The widely used vaccine strain A/Panama/2007/99 (H1N1) is an A/Moscow/10/99(H1N1)-like virus. ‡ B/Johannesburg/5/99 and B/Victoria/504/2000 are B/Sichuan/379/99-like viruses, which have been used for vaccine production(2).
FluWatch reports are published weekly (October through April) and can be accessed through Health Canada's FluWatch website: <http://www.phac-aspc.gc.ca/fluwatch/index.html>.
Source: JF Macey, MA, MSc, Field Epidemiology Training Program, Centre for Surveillance Coordination and Division of Respiratory Diseases, Bureau of Infectious Diseases; B Winchester, BSc, MSc, SG Squires, MSc, T Tam, MD, Division of Respiratory Diseases; P Zabchuk, Division of Disease Surveillance, Bureau of Infectious Diseases, Centre for Infectious Disease Prevention and Control, Ottawa; Y Li, PhD, National Microbiology Laboratory, Winnipeg, Manitoba. |
||
| Last Updated: 2001-06-01 | |||