
Public Health Agency of Canada
www.publichealth.gc.ca
Common menu bar links
Institutional links
Diseases & Conditions
Health & Safety
Research & Statistics
Agency Information
Search Box
E-mail this page
Update Vaccine-Preventable Diseases
Volume 7, Number 1, April 1999
Dear Readers,
As you are probably aware Update: Vaccine-Preventable Diseases began as Measles Update in 1993. The original purpose of the news- letter was to provide quarterly updates on Canada's measles elimination campaign. In 1997, the mandate of the newsletter was expanded to incorporate all vaccine-preventable diseases (VPD's) and the title was changed to reflect the new focus. The newsletter is not a formal Health Canada publication but we hoped to provide a valuable forum for information exchange between the provinces and territories.
In the last couple of years, the majority of articles in this publication were either prepared by the Division of Immunization staff at Health Canada or reproduced from other publications, mostly international. In 1998, there were only two submissions from the provinces and territories. Considering the Division of Immunization prepares an Annual National Immunization Report and submits articles regularly to the Canada Communicable Disease Report and other scientific journals, we are being challenged to justify the validity of this newsletter given its current content.
We do believe that this newsletter is a great way for provinces/territories to share information and highlight achievements made in the management of vaccine-preventable diseases. We are, therefore, asking our readers to show their support for this newsletter by submitting reports on programmatic, policy or epidemiologic reviews that you would like to share with the over 1,200 public health persons currently receiving this newsletter.
Submissions can be made via fax (613-952-7948), e-mail (adwoa_bentsienchill@hc-sc.gc.ca or margaret_litt@hc-sc.gc.ca) or by mailing your document to: ATTN: VPDU editors, Division of Immunization, Tunney's Pasture PL 0603E1, Health Canada, Ottawa, Ontario K1A 0L2.
Sincerely,
VPDU editorial staff
The Effect of a Computerized Patient Recall List on Pneumococcal and Influenza Vaccination Rates
DL Alexander, Vaccine-Preventable Diseases/TB Control Unit, Disease Control Service, Ontario Ministry of Health (Adapted from Public Health and Epidemiology Report Ontario, Vol 9, No 4, April 1998)
Introduction
Pneumococcal disease accounts for 80,000 cases of pneumonia, 4,000 cases of bacteremia, and 500 cases of meningitis in Canada each year(1). Based on data collected by sentinel health units across Canada in 1996, the annual incidence rate for invasive pneumococcal disease (based on invasive isolates of Streptococcus pneumoniae) is estimated to be 15.1/100,000 population (L. Senzilet, Bureau of Surveillance and Field Epidemiology, Health Canada, Ottawa: personnal communication, 1998).
The groups listed in Table 1 are eligible for the Ontario Ministry of Health publicly-funded pneumococcal vaccine, consistent with the high-risk groups identified by Canada's National Advisory Committee on Immunization (NACI)(2). These groups account for 81% of cases and 94% of deaths due to pneumococcal disease(3). The mortality rates from pneumococcal disease in patients < 65 years of age with chronic disease and >= 65 years of age with chronic disease are 15% and 30%, respectively(3).
|
Table 1 |
|
All residents of nursing homes, homes for the aged, and chronic care facilities or wards. All individuals who are >= 65 years of age. All individuals who are at least 2 years of age with one of the following conditions:
*consistent with NACI guidelines(2) |
The 23-valent pneumococcal vaccine has been licensed for use in Canada since 1983. In a review of vaccine efficacy studies, Fedson et al. concluded that pneumococcal vaccination between 50% and 80% protective against the development of invasive pneumococcal disease in older and high-risk patients(4). Mild local reactions (e.g., soreness and erythema) occur in approximately 50% of vaccine recipients. More severe local or systemic reactions, such as fever and myalgias, occur in < 1% of vaccinated patients, whereas severe systemic reactions, including anaphylaxis, are rare(5). Only one dose of pneumococcal vaccine is recommended for the majority of high-risk patients.
Available data indicate that the pneumococcal vaccine coverage rate is very low among high-risk individuals. In a 1991 national survey(6), only 0.25 % of all respondents and 1 % of respondents >= 65 years of age stated that they had received pneumococcal vaccine in the year preceding the survey. In a 1996 telephone survey conducted in Ottawa, only 7 % of the population eligible for pneumococcal vaccine reported having ever received the vaccine. A survey of 1,000 Ontario primary care physicians in 1996 indicated that 8 % recommended the pneumococcal vaccine to their eligible patients (H. Kassam, unpublished data, 1996).
In response to the low pneumococcal vaccination rates, in 1996, the Ontario Ministry of Health initiated a publicly-funded pneumococcal immunization program for the high-risk groups defined by NACI. The goal of the program was to immunize an estimated 1.4 million high-risk persons over a 3 year "catch-up" period. The number of pneumococcal vaccine doses available in each year of the program were 400,000 in 1996/97, 500,000 in 1997/98, and 500,000 doses in 1998/99. Thereafter, an additional 80,000 doses per year will be made available for individuals turning 65 years of age or entering high-risk groups due to development of chronic medical conditions.
In accordance with this pneumococcal immunization program, the Public Health Branch also conducted a 1-year project (which ended March 1998) to develop, implement, and evaluate strategies on a pilot basis to promote pneumococcal and influenza immunization to eligible patients.
An Advisory Committee comprised of local experts was struck in early 1997 to provide guidance on the project. The project focused on three main health care settings: primary care physician offices, acute care hospitals, and high-risk specialty clinics. This paper presents the primary care research, and is the first in a three part PHERO series documenting each project's results.
Primary Care Immunization Strategy
Primary care physicians play a critical role in the immunization process, as most immunizations take place in the physician's office. Research indicates that physicians have substantial influence over their patients' decisions on whether to be vaccinated. In a study conducted by Buffington and Laforce(8), the most important reason why vaccinees were immunized against influenza was that their physician recommended it (55%). Furthermore, of those who were not immunized, 29% reported that a recommendation by their physician would convince them to be vaccinated against influenza.
Research has also shown the "target-based approach" to be effective in increasing pneumococcal immunization primary care physicians. In the context of this project, the target-based approach is a strategy for increasing immunization rates by assisting physicians in systematically identifying and targeting their patients who are eligible for the vaccine. The target-based approach was used in Monroe County, New York, as part of the Medicare Influenza Vaccination Demonstration Project, and met with considerable success. In this project, by generating lists of eligible patients and plotting the immunization progress on a wall chart, significantly higher vaccination rates were achieved (i.e., an increase of 30%)(9).
One of the challenges of this strategy is that the identification of eligible patients can be time-consuming. Although the Monroe County study focused on identifying only those individuals who were >= 65 years of age (not those < 65 years of age with chronic underlying disease), about 20 hours of clerical time were still required per practice to prepare patient lists from individual treatment files(9). The authors did note, however, that lists generated by computer could be done as part of routine office work. The ability to generate lists of eligible patients by computer was, therefore, considered an important factor in the feasibility of this strategy.
The overall purpose of the present study was to determine the feasibility and effectiveness of using the Ontario Health Insurance Plan (OHIP) billing data to provide computer-generated lists of high-risk patients to primary care physicians. The vast majority of physicians in Ontario submit billing data to OHIP electronically, as they are financially penalized for paper submissions.
Included in each OHIP billing submission is an OHIP diagnostic code for the patient's visit and basic demographic patient data, including date of birth. Since high-risk patients can be identified by age and diagnosis, the use of the OHIP data to generate computerized patient recall lists was considered a worthwhile strategy to explore. Six computer billing software companies were chosen to develop software for the pilot project using specifications provided by the Advisory Committee.
The specific research questions for the project were as follows:
#1: To determine whether pneumococcal and/or influenza immunization rates increase when physicians are provided with a computerized method of identifying their high-risk patients.
#2: To determine whether the computerized method of identifying high-risk patients is considered accurate when compared to information contained in patient's charts.
Methodology
(a) Procedure for Research Question #1
To evaluate Research Question #1, primary care physicians were randomized into an intervention group, which received a computer program enabling them to generate a list of their high-risk patients from OHIP billing data, and a control group, which did not. A sample size calculation indicated that 16 primary-care practices were required in each group to detect an effect size of one standard deviation unit, with 80% power and an alpha of 0.05.
A volunteer sample of primary care physicians from across Ontario was selected to participate in the study. The selection process involved approaching health units from a mix of urban, suburban, and rural areas in Ontario to identify interested physicians in their area. These physicians were then contacted by the Project Coordinator and considered eligible for inclusion in the study if they used a software company compatible with the project, had at least 2 years of data, and agreed to be randomized into either a control or intervention group. Physicians in solo practices, group practices, and large family-practice units were eligible for inclusion in the study. In total, 28 practices representing 73 physicians were included in the study. Fourteen practices were randomized into each of the intervention and control group.
Physicians in the intervention group received computer enhancement software to their office OHIP billing system (at no cost to the physician) in late August 1997. Control physicians did not receive this computer enhancement until early December 1997, when data collection for the project was complete.
The computer enhancement enabled physicians to generate a list of patients in their practice at high risk for pneumococcal disease (and, hence, also at high-risk for influenza). The computer enhancement worked by selecting patients based on age (i.e., those who were >= 65 years of age as of November 30, 1997 and were seen in the last 3 years) or diagnosis (i.e., those who had one of the OHIP diagnostic codes representing the high-risk groups in the last 2 years). The OHIP diagnostic codes used to represent high-risk patients are presented in Table 2.
The standard report produced by the computer listed the names of the high-risk patients in alphabetical order and categorized (for group practices) by physician identification code. The other variables reported were patient's chart number, telephone number, date of birth, eligibility group (65 years versus < 65 with chronic conditions), and the diagnostic codes used to select the patient (with text translations).
The list of high-risk patients could be used by pilot physicians to increase pneumococcal and influenza immunization in a number of ways. The simplest method was for the physician to consult the list for each patient seen to determine whether the patient was identified as being at high risk and eligible for the vaccine. Other methods were to use the list to flag the charts of high-risk patients as an immunization reminder or to recall high-risk patients for immunization by telephone or mail. Pilot physicians were encouraged to use the computer list in a way best suited for their individual practice.
|
Table 2 |
|
|
sarcoidosis: 135 |
myoneural disorders: 358 TOTAL = 107 codes |
Between September 15 and November 30, 1997, pilot physicians in both the control and intervention groups kept records of the patients they immunized against influenza and pneumococcal disease using "Vaccination Record" forms designed for the project. At the end of the data collection period (November 30, 1997), all participating physicians were asked to send copies of their Vaccination Records to the Project Coordinator for data analysis. Patient confidentiality was maintained by including only non-nominal information on these forms.
In order to evaluate the full impact of the strategy, the Public Health Branch arranged to provide all physicians in the study with sufficient pneumococcal vaccine to immunize all of their eligible patients. Thus, the usual requirements of limiting the number of available vaccine doses to one third of eligible patients for each year of the Ministry's 3 year catch-up program did not apply to participants in the project.
The influenza and pneumococcal vaccination rates were calculated for each participating practice. Numerators for these calculations were the number of patients identified on the Vaccination Records; denominators were the number of patients identified on the computer-generated list of high-risk patients. Since the denominators should reflect the number of patients eligible for the vaccine, and since most patients who were vaccinated previously with pneumococcal vaccine are no longer eligible, it was necessary to subtract previously-vaccinated patients from the denominators of the pneumococcal vaccination rates. The number of pneumococcal vaccine doses distributed to each participating practice during the year preceding the pilot project, minus doses returned, was used to estimate the number of previously vaccinated patients in each physician's practice.
The average pneumococcal and influenza vaccination rates were calculated for the control and intervention group, and the differences were assessed for statistical significance using the unpaired t-test at the 0.05 alpha level. To assist with interpreting the quantitative data, a questionnaire was distributed to all participating physicians. The questionnaire addressed issues such as the perceived usefulness and accuracy of the computer list, and any additional immunization strategies employed by physicians during the study time period.
(b) Procedure for Research Question #2
In order to evaluate the accuracy of the computer program in identifying high-risk patients, a sub-sample of nine physicians agreed to conduct a chart review of a systematic sample of 240 of their patients' charts. The chart review was conducted between November 15 and December 15, 1997, to avoid interference with data collection for Research Question #1.
Since selecting high-risk patients based on age was straight-forward and expected to be accurate, the chart review focussed on patients likely to be selected based on diagnosis (i.e., only charts of patients born between 1933 and 1993 were considered eligible for the chart review). A specially-designed Chart Review Form was used for data abstraction. Information on the form included whether or not the patient was in a high-risk group and whether or not the patient was also identified on the computer-generated list. Since knowledge of the computer classification of patient risk may bias the chart reviewers' classification, the chart reviewers were asked to consult the computer list only after the chart review were completed.
Completed chart review forms, containing non-nominal information only, were sent to the Project Coordinator for analysis, and the sensitivity and specificity of the computer list (using the chart review as the gold standard) were calculated. After completion of the initial chart review, the practices conducting chart reviews were also asked to provide information on the reasons for the false positives and false negatives using standardized forms.
Results
(a) Research Question #1
Average pneumococcal and influenza vaccination rates for the two groups are presented in Tables 3 and 4, respectively. Vaccination rate data were available for 13 intervention and 9 control group practices. For the pneumococcal vaccine, the intervention group had a lower average vaccination rate than the control group overall (13.0% and 15.9%, respectively), for patients >= 65 years of age (15.0% and 29.8%, respectively), and for patients < 65 years of age with high-risk conditions (7.3% and 13.6%, respectively). In contrast, for the influenza vaccine, the intervention group had a higher average vaccination rate in each of the three respective categories (25.2%, 28.5%, and 22.3%) than did the control group (18.9%, 27.6%, and 20.8%). None of the differences, however, were found to be statistically significant at the 0.05 alpha level.
|
Table 3 |
|||
|
Intervention |
Control Group |
t value |
|
|
(a) Overall |
13.0% |
15.9% |
t=0.447 |
|
(b) >= 65 Years |
15.0% |
29.8% |
t=1.249 |
|
(c ) < 65 Years |
7.3% |
13.6% |
t=0.941 |
Despite the lack of a significant intervention effect, data from the 21 physicians who completed the questionnaires indicated that the list may have some redeeming value. Sixty percent of these physicians indicated that they found the list to be "fairly" or "very" accurate with respect to identifying high-risk patients. Of the 14 intervention group physicians who completed the questionnaire, 48% found the list to be "fairly" or "very" useful in increasing their immunization rates. Furthermore, 76% of the 21 physicians who completed the questionnaire said they would use the list next year "as it is" or "with modifications" and 83% would recommend giving the list to all Ontario physician "as it is" or "with modifications".
|
Table 4 |
|||
|
Intervention |
Control Group |
t value |
|
|
(a) Overall |
25.2% |
18.9% |
t=1.141 |
|
(b) >= 65 Years |
28.5% |
27.6% |
t=0.095 |
|
(c
) < 65 Years |
22.3% |
20.8% |
t=0.140 |
The most significant finding from the questionnaire data was the realization that the computer lists were capturing some patients who were considered by physicians not to be part of their active practices. For instance, the list captured patients seen by physicians in the Emergency Department, as well as some patients from other practices seen as part of a rotation. Although the computer list may have correctly identified transient or inactive patients as high-risk, some of the pilot physicians felt they should not have been identified on their lists.
(b) Research Question #2
Nine practices (representing 2,122 charts) completed the chart review. The sensitivity and specificity of the computer list in identifying high-risk patients < 65 years of age were 72.2% and 92.3%, respectively. The relatively low sensitivity of the computer list indicated that a considerable proportion of high-risk patients were not being identified on the list. Specificity, however, was quite high, indicating that the majority of patients identified as high-risk on the computer list were identified correctly.
As intended by the design, the majority of high-risk patients identified through the chart review were < 65 years of age (299, or 82%) rather than >= 65 (64, or 18%). As expected, both the sensitivity and specificity of the computer program in identifying patients >= 65 years of age were very high (87.5% and 99.9%, respectively). In fact, excluding one outlying practice, the sensitivity of the computer list for this age group increased to 96.6%.
Of the nine practices conducting chart reviews, five provided follow-up information on the false positives and false negatives. In terms of sensitivity, 87 high-risk patients were not identified on the computer list, and follow-up information was available for 36 (41.4%).
Of these patients, 22% were not on the list because they were not seen in the preceding 2 years with the high-risk condition (i.e., the selection criteria used in the computer program); 19% were not diagnosed or seen until after the study began; 19% were not on the list because a mistake was made in the chart review (i.e., patient was not at high risk); 14% were not on the list because of a coding error; and 3% had a diagnostic code which was not (but possibly should have been) included in the computer program. No reason was found to explain why 22% of these patients were not included on the computer list.
In terms of specificity, there were 141 patients who were identified on the computer list but whose charts did not indicate a high-risk status. Follow-up information was available for 57 of these patients (40.4%). The vast majority of these patients (93.0%) were on the computer list because of the diagnostic code 493 (asthma, allergic bronchitis) or 466 (acute bronchitis). These patients were not considered to be at high risk by their physicians because they only had mild allergies, asthma, bronchitis, or cold symptoms.
Discussion
The pneumococcal and influenza vaccination rates in both the control and intervention group practices were surprisingly low. The l995 pneumococcal and influenza vaccination rates for individual >= 65 years of age in the United States were reported to be 35.6% and 58.1%, respectively(10). Comparatively, the average vaccination rates for all individuals >= 65 years of age in this study were 20.9% and 28.1%, respectively. It should be noted, however, that the vaccination rates from this study do not include vaccines administered in settings other than the physician's office, whereas the rates from the U.S. were based on community telephone surveys, thereby capturing vaccines administered in all health-care settings.
A few possible explanations exist for the low vaccination rates. One is that the Vaccination Records may not have been completed thoroughly, resulting in an artificially low number of vaccinated patients reported in each practice (i.e., artificially deflated numerators).
The second potential explanation for the low rates is that the denominators of the vaccination rates may have been artificially elevated. The chart review data indicated that only 72% of high-risk patients were identified on the computer list. Thus, if the computer list had a higher degree of sensitivity, the denominators would have been greater, resulting in even lower vaccination rates. The specificity of the computer list was high (92%), meaning that only a small percentage of patients who were not at risk were identified on the computer list. Both relatively low sensitivity and high specificity of the computer list argue against the theory that the denominators of the vaccination rates were artificially high.
Although the specificity of the list was quite high based on the chart review, there was a secondary specificity problem in that transient and inactive patients were being identified on the computer list. The chart review was conducted to assess the computer program's ability to accurately identify a patient's risk status, regardless of whether or not a physician considered that patient to be part of their active practice. Thus, the extent to which the secondary specificity problem resulted in an artificially inflated number of high-risk patients on the computer list could not be quantified. The problems with secondary specificity and sensitivity of the computer list work in opposite directions, and may have balanced out the denominator data. Nevertheless, caution must be used in interpreting these vaccination rates.
Although the vaccination rates may not reflect the true vaccination rates in the physicians' practices, the problems regarding the denominator data should have applied equally to both the control and intervention group practices due to the randomization process. Thus, if the intervention had been effective, significantly high vaccination rates would have been observed in the intervention group. The fact that this did not occur provides evidence that the use of computerized patient recall lists derived from basic OHIP billing data is not effective in increasing vaccination rates in primary care physicians' offices.
There were a number of limitations with the computer lists which may have reduced their utility. First, the computer list may have lost credibility with physicians because of the inclusion of transient and inactive patients. Furthermore, the fact that diagnostic codes were printed out for each high-risk patient resulted in lengthy and somewhat unmanageable print-outs (mean length was 34 pages). For instance, one patient had over two pages of diagnostic codes. The inclusion of the OHIP diagnostic codes for "asthma, allergic bronchitis" and "acute bronchitis" were mistakes which accounted for virtually every false positive on the computer list. Many of the false negatives were due to patients not having seen their physicians for the high-risk conditions in the 2 year time span used in the software's selection criteria. Nineteen percent of physicians also found generating the computer list to be "fairly" or "very" complicated, and some even had to send back-up files to their software company to have them generate the list.
Had these problems been resolved, the questionnaire data indicated that the majority of physicians reported that they would use the computer list in the future (76%) and would recommend that all Ontario physicians receive it (83%). It should be noted, however, that these responses may partially reflect the participants' desire to respond positively to the Project Coordinator's questionnaire. Nevertheless, if the computer list is to be effective in the future, the identified problems need to be addressed. Some of these problems may be resolvable, such as the removal of inappropriate diagnostic codes in the selection criteria, the exclusion of the diagnostic code field in the reporting format, the extension of the 2-year time period used in the computer's selection criteria, and the working-out of problems in the generation of the computer lists.
The most substantial problem, however, was the inability of the computer list to exclude patients who were considered inactive, transient, or not part of the physicians' practices. The exclusion of these patients from the list would require the availability of special codes to flag these patients, and the routine use of these codes by physicians. Given that there are an estimated 120 vendors selling OHIP billing software on a commercial basis to the thousands of primary care physicians in the province (P.J. Berwick, OMA Practice Advisory Services, Toronto: personal communication, 1998), it would be impractical for the Ministry to coordinate the use of such codes and provide the specialized software needed to resolve this issue. The attraction of the computerized recall list strategy was in the simplicity of using basic OHIP billing information to generate the lists. If additional fields need to be coded by physicians' offices and included in the selection criteria, then the strategy loses its broad-based applicability to all Ontario physicians, and hence, its usefulness as a provincial immunization strategy.
Conclusion
We conclude that computerized patient recall lists using basic OHIP billing data (age and diagnostic code) are ineffective in increasing pneumococcal and influenza immunization rates. Future research could focus on evaluating the impact of more specialized computerized programs using more detailed fields in the selection criteria to exclude inactive, transient, or deceased patients. It should be recognized, however, that the trade-off of such an approach would be a reduction in the broad-based application to primary care physicians across the province.
Acknowledgements
We gratefully acknowledge the participation of the primary care pilot practices, and the hard work and guidance of the Advisory Committee members: Dr. Branimir Brcic, Ms. Brenda Guarda, Ms. Margaret MacArthur, Dr. Allison McGeer, Dr. Andrew McIvor, Mr. Eric Peterson, Dr. Susan Tamblyn, Ms. Jane Thurston, and Dr. Elaine Wang.
References
1. McIvor RA. Pneumococcus: Don't Wait - Vaccinate!
Medicine North America 1996;19-23.
2. NACI. Canadian immunization guide. 4th ed. Ottawa, Ont:
Health Canada, 1993. Supply and Services Canada, Cat. No.
H49-8/1993E.
3. McGeer A, Landry L, Goldenberg E et al. Population-based
surveillance for invasive pneumococcal infections in Toronto,
Canada: implications for prevention. Mount Sinai Hospital, the
University of Toronto, Toronto, Canada and the Centers for Disease
Control and Prevention, Atlanta, Georgia. 1996.
4. Fedson DS, Shapiro ED, LaForce FM et al. Pneumococcal
vaccine after 15 years of use. Arch Intern Med
1994;154:2531-35.
5. Fiebach N, Beckett W. Prevention of respiratory infections
in adults: influenza and pneumococcal vaccines. Arch Intern
Med 1994;154:2545-57.
6. Duclos P. Evaluation of immunization coverage in the adult
population of Canada. Can J Infect Dis 1994;5(5)227-31.
7. Duclos P. Adult immunization survey - Ottawa, 1996. Can
Commun Dis Rep 1996;22:181-82.
8. Buffington J, Laforce FM. Achievable influenza immunization
rates in the elderly. New York State J Med
1991;91(10):433-35.
9. Buffington J, Bell KM, Laforce FM, and the Genessee Hospital
Medical Staff. A target-based model for increasing influenza
immunizations in private practice. J Gen Intern Med
1991;6(3):204-09.
10. CDC. Pneumococcal and influenza vaccination levels among
adults aged 65 years - United States, 1995. MMWR
1997;46(39):913-19.
Contacts
. Dianne L. Alexander, MHSc, Project Coordinator,
Vaccine-Preventable Diseases and TB Control Unit, Disease Control
Service.
. Kristen Rottensten, MD, MHSc, FRCPC, Senior Medical Consultant,
Vaccine-Preventable Diseases and TB Control Unit, Disease Control
Service.
Pertussis Outbreak: Update
(Adapted from the New Brunswick Epidemiological Report, October 1998, Vol 9, No. 2)
Figure 1
Number of pertussis cases reported in the province and Health
Region VI, by month, 1988
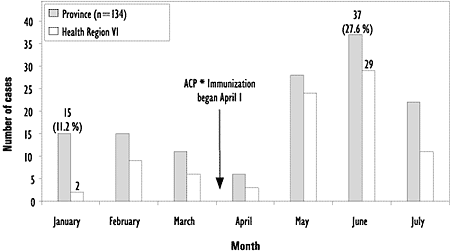
Figure 2
Number of pertussis cases reported in New Brunswick by Health
Region between January 1 to July 31, 1998
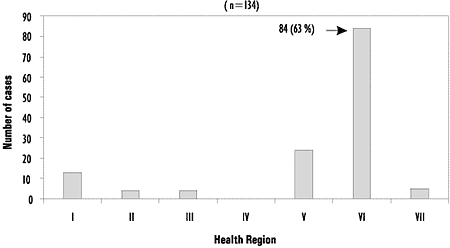
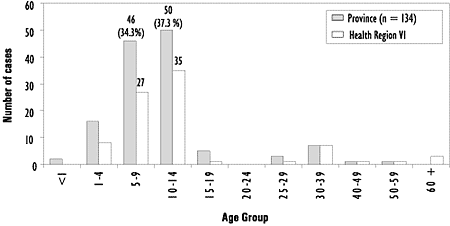
Figure 3
Number of reported cases of pertussis in the province and Heath
Region VI, by age group
A total of 134 cases of pertussis were reported in New Brunswick between January 1 and July 31, 1998. Figure 1 shows that the number of reported cases of pertussis was 15 (11.2%) in January compared to 37 cases (27.6%) in June 1998. Figure 2 shows that 84 cases (63%) occurred in Health Region VI.
As of September 15, 1998, the majority of pertussis cases were females with 72 cases (53.7%) reported. Figure 3 shows that the highest number of reported cases of pertussis was in the 10 to 14 year age group with 50 cases (37.3%). The second highest number was in the 5 to 9 year age group with 46 cases (34.3%) reported.
The outbreak investigation is on going and information will be disseminated when completed.
Contact
. Dr. B. Christofer Balram, Provincial Epidemiologist, Director,
Provincial Epidemiology Service, Public Health and Medical
Services, P.O. Box 5100, Carleton Place, Fredericton, NB E3B 5G8,
Tel: (506) 453-3092 or Fax: (506) 453-2780
Vaccine Safety Notes
Doing Well Still Needs to Sell: How Should Vaccines Justify Themselves?
R Pless, Division of Immunization, Bureau of Infectious Diseases, LCDC, Ottawa
Abstracted from "Doing well still needs to sell: bringing vaccine-preventable diseases under further control in Canada requires a shift in thinking." Paediatrics and Child Health (PCH) 1999. In Press. This issue of PCH, which is the official journal of the Canadian Paediatric Society, features several other articles related to immunization including a summary of the 3rd Canadian National Immunization Conference held in Calgary, Alberta, December 6-9, 1998.
In a paper published in 1998, Gangarosa and colleagues described the impact of anti-vaccination movements on the control of pertussis(1). When perceptions of vaccine risk take over and sway individuals or governments away from immunization, disease can resurface. In one of the examples used, 2 deaths unscientifically linked to DPT vaccine led to the official discontinuation of a national vaccination program in Japan. The outbreaks that followed were responsible for 13,000 cases of pertussis and 41 deaths due to this disease.
We are now in a phase with our immunization programs of achieving herd immunity through optimal coverage levels, however we risk losing ground to increasingly vocal and misinformed opponents of vaccination. Surveys suggest that, overall, only 1% to 2% of the population are opposed to immunization, but, at the same time, recent experiences with the introduction of new vaccination programs in Canada demonstrate the immediate impact of intense negative and misleading publicity. Parents in Manitoba who had signed consent for their children to be vaccinated against hepatitis B actually faxed the schools to revoke permission when misinformation was propagated through the media and directly to some schools, just before the program was to get under way (G. Hammond, Manitoba Health, Winnipeg: personal communication, 1998).
The fragile nature of trust is such that once destroyed by concerns about vaccine safety - even those that are unproven - the impact on immunization coverage can be profound and difficult to counter. Recovery of confidence could take years. Today, in the late 1990s, it is paradoxical that we are actually beginning to express a "concern" about the impact of low incidence of disease. The concern is that as these diseases are fading from memory and a population of patients and practitioners is emerging that has no experience with the devastation once wrought, efforts to prevent the diseases will relax. There is concern that should some diseases reappear, they will not be recognized and will spread before control measures can be put in place. There is also the possibility that some diseases, previously acquired in infancy with low risk of morbidity (such as varicella), may shift into adult populations and cause even more harm, if not adequately controlled by vaccination.
Complete immunization coverage, even in the absence of disease, is conceptually an easy pill to prescribe. Unfortunately, it is a bitter pill to swallow for those misled by anti-vaccination messages. The questions we all must ask are: What are we more comfortable with, and what do we want? Do we want a return to the days when susceptibility to disease was universal, and every member of society "risked" illness (of greater or lesser severity, or even death) at some point? Or do we prefer the situation today, having universal immunization with a product that cannot be completely safe but has proven itself extremely safe, when administered on a controlled schedule? If, indeed, we prefer the latter, we must educate the public to stop considering the risks and benefits of vaccine against disease TODAY, but consider instead the risks of vaccine today compared with the risks of disease YESTERDAY.
As mentioned in the opening paragraph, experience has shown that if we stop vaccinating before total eradication, diseases return. For some diseases, such as tetanus, which has no herd immunity, it is only vaccination that protects us and our infants. As Phyllis Freeman points out(2): "The very biology of vaccines makes the choice to employ them far more than a collection of individual decisions...The study of vaccine adverse events is not an effort to provide individuals with a basis for deciding whether to vaccinate but rather an effort to improve the safety and effectiveness of vaccines...It will be far easier to achieve herd immunity when risks associated with vaccines are known to be so small that public confidence in the safety of vaccines is secure."
References
1. Gangarosa EJ, Galazka AM, Wolfe CR et al. Impact of
anti-vaccine movements on pertussis control: the untold story.
Lancet 1998; 351:356-61.
2. Freeman P. The biology of vaccines and community decisions
to vaccinate. Public Health Reports 1997;112:21.
[Table of Contents]
Enhanced Measles Surveillance Report
|
Confirmed Measles Cases in Canada by
Week of Onset |
||
|
Week Ending |
Onset of Rash |
Confirmed Cases |
|
2 Jan |
53 |
0 |
|
9 Jan |
1 |
0 |
|
16 Jan |
2 |
0 |
|
23 Jan |
3 |
0 |
|
30 Jan |
4 |
1 |
|
6 Feb |
5 |
1 |
|
13 Feb |
6 |
0 |
|
20 Feb |
7 |
1 |
|
27 Feb |
8 |
0 |
|
06 Mar |
9 |
0 |
|
13 Mar |
10 |
0 |
|
20 Mar |
11 |
0 |
|
27 Mar |
12 |
0 |
|
Total |
3 |
|
SPOTlight on Research
In this issue of the Update, this section highlights selected abstracts of poster presentations at the Canadian National Immunization Conference held in Calgary, Canada from December 6 to 9, 1998.
1. History of Varicella in Children Aged 8 to 10 Years Old and the Perception of Their Parents of the Varicella Vaccine
Boulianne N1,3 Duval B1, De Serres G1, Gravel D1, Massé R2
Introduction
A varicella vaccine will likely be introduced in Canada within a few months. Recommendations for this vaccine should take into account the epidemiology of varicella in the population. In a cohort of 8 to 10 year old children recruited for a hepatitis B vaccine immunogenicity study, we sought parents' reports on the clinical history of varicella in their child and their opinion of the vaccine's usefulness.
Method
In May 1997, a questionnaire looking for history of varicella was mailed to and completed by the parents of a first group of 1,129 children. A second group (1,126) completed the questionnaire at home in the presence of a nurse.
Results
A total of 2,227 parents (98%) responded. Among their children, 1,135 (51%) had contracted varicella before kindergarten and 2,026 (91%) had done so before 11 years of age. The illness led to a medical consultation for 951 children (47%). More than half (56%) of the parents considered that a varicella vaccine would be useful while 13% judged that such a vaccine would be totally useless. A vaccine was deemed most useful by parents who had to consult a doctor (RR 1.3, IC 95%: 1.2 - 1.4) and those whose child had not already contracted varicella (RR 1.3, IC 95%: 1.2 - 1.4).
Conclusion
Despite a general perception that the illness is benign, about half of the cases resulted in a medical consultation. If a vaccination program is implemented, design of catch-up program should take into account the proportion of susceptible remaining at 5 and 10 years of age. Because a fairly large proportion of parents does not consider varicella vaccination as useful, it should also be anticipated that large education programs will be needed to get good participation.
____________________
1 Centre de santé
publique du Québec
2 Direction régionale de
santé publique du Bas-St-Laurent, Rimouski
3 Corresponding author
2. Variation in the Number of Paediatric Doses Recovered from Multidose Vials of Hepatitis B Vaccine
Duval B1,3, Scheifele D2, De Serres G1, Boulianne N1
Introduction
It has been observed that the number of doses recovered from multidose vials occasionally differs from the expected number. We wanted to measure the number of doses it was possible to extract from multidose vials of hepatitis B vaccine using different types of syringes, vaccines and dosages for children and adolescents.
Methods
Three nurses in each of three locations (Quebec, Toronto, Vancouver) working in seven clinical situations withdrew the greatest possible number of doses using three types of syringes (1 mL, 3 mL, 3 mL hubless), two dosages (0.5 mL, 0.25 mL) and two types of vaccines (Engerix-BT 10 mL, RecombivaxT 3 mL). Dose fractions remaining in the vials were measured using 1 mL syringes. Each clinical situation was evaluated using 30 vials, 10 per location. Comparing expected doses to recovered doses yielded the recovery percentage.
Results
The lowest result (-14.1%) was obtained using RecombivaxT 0.25 mL and a 1 mL syringe and the highest (27.6%) was obtained using Engerix-BT 0.5 mL and a 3 mL hubless syringe. Considering adjustments for other variables in the model; the 3 mL hubless syringe allowed 18% more doses to be withdrawn than did ordinary syringes; the 0.5 mL dose yielded 12.2% more doses than the 0.25 mL dose and the 10 mL vials of Engerix-B yielded 10.6% more doses than did the 3 mL vials of RecombivaxT.
Conclusion
These results confirm that the actual number of doses in a multidose vial may be much different than expected. Given the significant impact on cost, these factors should be taken into consideration when planning and carrying out vaccination programs.
____________________
1 Centre de santé
publique du Québec, Beauport
2 Vaccine Evaluation Center,
Vancouver
3 Corresponding author
Provincial/Territorial Round Table, February 25, 1999 Excerpts from the Canadian Nursing Coalition on Immunization (CNCI) Teleconference
British Columbia: imported red measles case.
Looking for secondary cases.
Saskatchewan: recent increase in influenza
activity; the incidence appears to have peaked the last week in
January and first week in February with 48 and 45 cases of
influenza A respectively and one case of influenza B in each of the
peak weeks.
Manitoba: imported red measles case. Looking for
secondary cases.
Quebec: recent increase in influenza activity.
There were 307 cases of influenza A laboratory confirmed between
January 15 and February 22, 1999.
Prince Edward Island: examining breaks in cold
chain at courier level.
Vaccine-Preventable Diseases Summary
Cumulative number of cases reported* for selected vaccine-preventable diseases, Canada January 1997 - December 1998
Divisions of Immunization and
Disease Surveillance,
Bureau of Infectious Diseases, LCDC, Ottawa
|
Disease |
January-December 1997 |
January-December 1998 |
|
Diphtheria |
1 |
0 |
|
Haemophilus influenzae type b |
60 |
50 |
|
Hepatitis B |
1,591 |
1,702 |
|
Measles§ |
581 |
12 |
|
Mumps |
264 |
110 |
|
Pertussis |
4,439 |
7,519 |
|
Paralytic poliomyelitis |
0 |
0 |
|
Rubella¶ |
4,007 |
67 |
|
Congenital rubella syndrome |
1 |
1 |
|
Tetanus |
3 |
2 |
|
* Based on cases reported to the Notifiable Disease Reporting System, Division of Disease Surveillance, LCDC; 1997 and 1998 data are provisional. Also cumulative totals for the current year to date may not represent national totals due to incomplete reports from the provinces/territories. § Measles data are based on cases reported to the Enhanced Measles Surveillance System, Division of Immunization. ¶ Approximately 98% of rubella cases reported in 1997 were reported from Manitoba where an outbreak of rubella occurred, starting October 1996 through December 1997. |
||
Upcoming Conferences/Events
National Immunization Awareness Week October 25-30, 1999
National Immunization Registry "Trade Show" Regina December 6-8, 1999
Announcement
Please note that there will only be three issues of the Update: Vaccine-Preventable Diseases in 1999.