Common menu bar
Chapter 3
SINGLE PERSON WITH A DISABILITY
WIDE VARIATION CONTINUED ACROSS THE COUNTRY
At the provincial level:
- The highest total welfare income1 in 2009 for a single person with a disability was $12,905 in Ontario.
- Under Alberta’s Assured Income for the Severely Handicapped (AISH) program, the total income was $14,297.
- The lowest total welfare income was $8,665 in New Brunswick.
- The median value was $10,881 or in other words, half of the 2009 total welfare incomes were below $10,881 and half were above it.
At the territorial level:
- Amounts were much higher than at the provincial level, due to the higher cost of living. Nunavut’s incomes were the highest, with average monthly rents in excess of $2,800.
Alberta, in addition to its Income Support Program, also has a distinct program for persons with severe and permanent disabilities: the Assured Income for the Severely Handicapped (AISH) program. The AISH program differs from other social assistance programs in significant ways and provides some interesting comparisons. All other programs in this report are needs tested – including Alberta’s Income Support Program – with benefits based on family size and other factors. AISH clients, in contrast, are provided with a flat rate living allowance benefit which is not contingent on family size. Other differences include asset limits that take into account the income of a co-habiting partner.
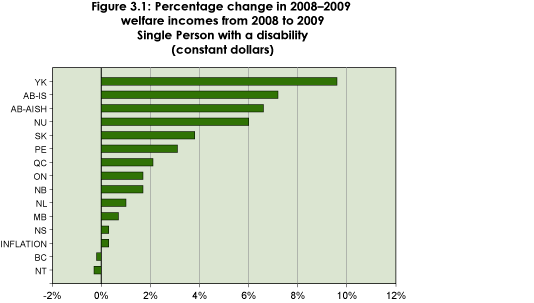
INCREASE OVER LAST YEAR BUT DECREASE OVER TIME
Generally, single persons with a disability saw an increase in their total welfare incomes between 2008 and 2009 in all jurisdictions other than the Northwest Territories and British Columbia. Almost all increases were due to provincial and territorial changes, with the increase of the federal GST counting for only a slight part of the total increase. In New Brunswick and Alberta, the provincial increases were implemented at the end of 2008. Ten jurisdictions implemented rate increases in 2009: Newfoundland and Labrador, Prince Edward Island, Nova Scotia, Quebec, Ontario, Manitoba, Saskatchewan, Nunavut and the Yukon. Benefits under the AISH program in Alberta also increased.
|
Table 3.1: 2009 Welfare Incomes for Single Person with a disability |
|||||
|---|---|---|---|---|---|
|
Basic Social Assistance |
Other P/T* Benefits |
GST Credit |
Other P/T* Tax Credits |
2009 Total Income |
|
|
Newfoundland and Labrador (NL) |
$8,085 |
$2,700 |
$298 |
$40 |
$11,123 |
|
Prince Edward Island (PE) |
$8,812 |
- |
$255 |
- |
$9,067 |
|
Nova Scotia (NS) |
$8,934 |
- |
$263 |
- |
$9,197 |
|
New Brunswick (NB) |
$7,416 |
$1,000 |
$249 |
- |
$8,665 |
|
Quebec (QC) |
$10,595 |
- |
$286 |
- |
$10,881 |
|
Ontario (ON) |
$12,284 |
- |
$324 |
$297 |
$12,905 |
|
Manitoba (MB) |
$7,397 |
$1,770 |
$256 |
- |
$9,423 |
|
Saskatchewan (SK) |
$9,567 |
$840 |
$277 |
$219 |
$10,902 |
|
Alberta-Income Support (AB-IS) |
$8,244 |
$936 |
$253 |
- |
$9,433 |
|
Alberta-Assured Income for |
$13,956 |
- |
$341 |
- |
$14,297 |
|
British Columbia (BC) |
$10,877 |
$35 |
$303 |
$178 |
$11,392 |
|
Yukon (YK) |
$14,873 |
$3,155 |
$374 |
- |
$18,402 |
|
Northwest Territories (NT) |
$17,100 |
$4,044 |
$374 |
- |
$21,518 |
|
Nunavut (NU) |
$43,592 |
$2,100 |
$374 |
- |
$46,066 |
*Provincial/Territorial
The cost of living affects the value of welfare incomes and it increased by only 0.3% between 2008 and 2009. When adjusted for inflation, the increase in total welfare incomes between 2008 and 2009 ranged from 0.3% in Nova Scotia to 9.6% in Yukon.2
For the period 1990–2009, single persons with a disability saw an increase in their welfare incomes in only three jurisdictions: Alberta3 (6%), Quebec (6%) and Yukon (48%). Inflation increased by 45.9% during the 19-year period, however, so only in Yukon did the increase exceed the cost of living.
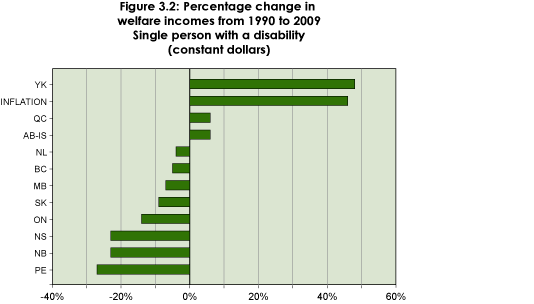
Data for 1990 are not available for the Northwest Territories. Nunavut became a separate territory in 1999.
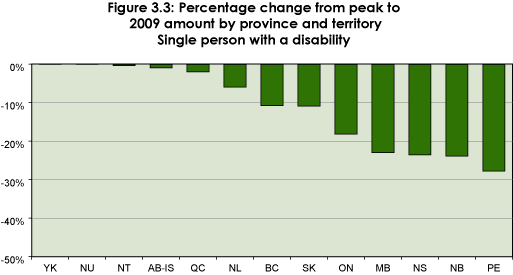
Table 3.2 further illustrates the extent of the decline in welfare incomes over the years. It shows the year in which welfare incomes were at their peak and the year they were at their lowest then compares these amounts to the 2009 welfare incomes. Note that the dollar amounts are in constant dollars.
- The vast majority of welfare incomes peaked many years ago. In seven cases, the peak was in the period 1991–1994.
- The amount of the decrease in total welfare incomes was severe in some cases. In seven cases the loss was more than $1,000, including the two worst cases, Prince Edward Island ($3,466) and Nova Scotia ($2,823).
- Most low years are in the current decade.
ADEQUACY OF 2009 WELFARE INCOMES
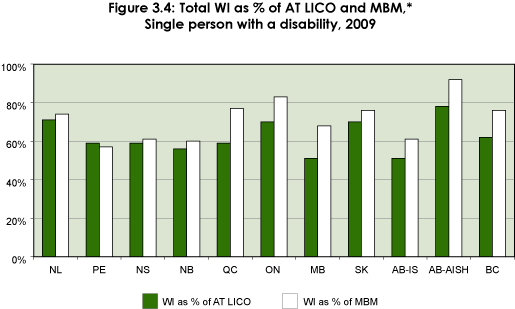
Table 3.3 compares 2009 total welfare incomes for single persons with a disability with a number of low income measures, including the after-tax Low-income cut-offs (AT LICO) and the Market Basket Measure (MBM), as well as with median after tax income and the average after tax income.4
The Market Basket Measure provides a good estimate of the cost of living because it is sensitive to differences in the cost of the basket of goods – including transportation, shelter, clothing and food components – and services in different parts of Canada.5
All 2009 welfare incomes were below the AT LICO by at least $4,000, up to a gap of almost $9,000 in Manitoba. The 2009 welfare incomes missed the MBM by more than $6,000 in the case of Prince Edward Island and Alberta. Benefits under the AISH program in Alberta were about $1,200 below the MBM.
| Table 3.2: Change in welfare incomes, from peak year and low year to 2009 | |||||||
|---|---|---|---|---|---|---|---|
| 2009 Amount(1) | Peak Year(2) | Peak Amount (3) | $ Change from Peak to 2009 (4 = 1-3) | Low Year(5) | Low Amount(6) | $ Change from Low Amount to 2009 (7 = 1-6) | |
| NL | $11,123 | 1997 | $11,820 | -$697 | 2005 | $10,399 | $724 |
| PE | $9,067 | 1992 | $12,533 | -$3,466 | 2005 | $8,642 | $425 |
| NS | $9,197 | 1991 | $12,021 | -$2,823 | 2008 | $9,167 | $30 |
| NB | $8,665 | 1989 | $11,373 | -$2,708 | 2007 | $8,490 | $174 |
| QC | $10,881 | 1994 | $11,097 | -$216 | 1989 | $9,769 | $1,112 |
| ON | $12,905 | 1992 | $15,762 | -$2,858 | 2008 | $12,685 | $220 |
| MB | $9,423 | 1992 | $12,214 | -$2,791 | 2005 | $9,194 | $228 |
| SK | $10,902 | 1989 | $12,217 | -$1,314 | 2005 | $9,507 | $1,396 |
| AB-IS | $9,433 | 1991 | $9,516 | -$83 | 2005 | $8,393 | $1,041 |
| BC | $11,392 | 1994 | $12,755 | -$1,363 | 2004 | $10,726 | $666 |
| YK | $18,402 | 2009 | $18,402 | $0 | 1994 | $11,988 | $6,414 |
| NT | $21,518 | 2008 | $21,574 | -$56 | 1998 | $12,383 | $9,135 |
| NU | $46,066 | 2009 | $46,066 | $0 | 2007 | $41,971 | $4,095 |
*Peak amounts and low amounts are in 2009 constant dollars.
Green colour is for peak years and orange colour is for low years during this decade.
When compared with the median and average after-tax incomes, the gap between welfare incomes and these incomes was larger. Welfare incomes of a single person with a disability in all provinces were below the average after-tax income of all single persons in those provinces by at least $14,000.
- Expressed as a percentage of the after-tax LICO, the lowest welfare income was in Manitoba at 51%. In Newfoundland and Labrador, it reached 71%.
- Expressed as a percentage of the MBM, the lowest welfare income was in Prince Edward Island at 57%. In Ontario it reached 83%.
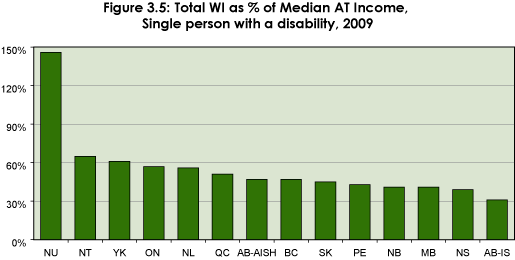
- The median income is the only measure available for the territories. Expressed as a percentage of the after-tax median income, the lowest welfare income was in Alberta at 31%. Among the provinces, it reached a maximum of 57% in Ontario. Among the territories, it reached a maximum of 146% in Nunavut.
| Table 3.3: Measuring the adequacy of welfare incomes | |||||
|---|---|---|---|---|---|
| 2009 Total Welfare Incomes | AT LICO | MBM* | Median AT Income* | Average AT Income* | |
| NL | $11,123 | $15,579 | $14,968 | $20,006 | $25,166 |
| PE | $9,067 | $15,384 | $15,852 | $21,111 | $26,870 |
| NS | $9,197 | $15,579 | $15,044 | $23,444 | $25,868 |
| NB | $8,665 | $15,579 | $14,373 | $20,988 | $25,968 |
| QC | $10,881 | $18,421 | $14,158 | $21,346 | $26,870 |
| ON | $12,905 | $18,421 | $15,633 | $22,667 | $32,686 |
| MB | $9,423 | $18,421 | $13,795 | $23,229 | $31,783 |
| SK | $10,902 | $15,579 | $14,368 | $24,028 | $30,580 |
| AB-IS | $9,433 | $18,421 | $15,491 | $30,515 | $41,609 |
| AB-AISH | $14,297 | $18,421 | $15,491 | $30,515 | $41,609 |
| BC | $11,392 | $18,421 | $15,032 | $24,437 | $34,691 |
| YK | $18,402 | n/a | n/a | $29,942 | n/a |
| NT | $21,518 | n/a | n/a | $33,176 | n/a |
| NU | $46,066 | n/a | n/a | $31,641 | n/a |
*Estimated
*Estimated
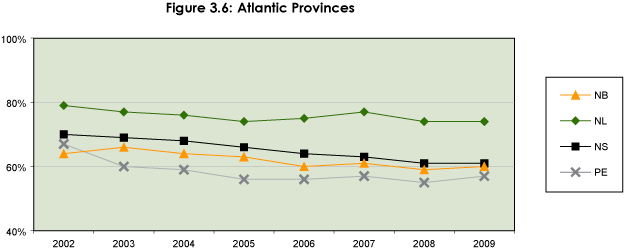
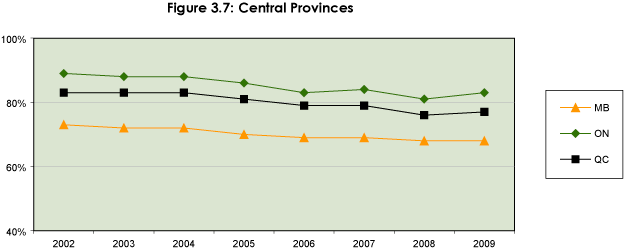
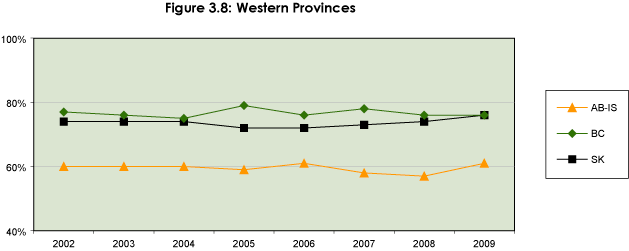
WELFARE INCOMES COMPARED TO MBM, 2002–2009
Compared to 2008, the welfare income of a single person with a disability in 2009 improved in six provinces, with the greatest improvement in Alberta. In the four other provinces, the situation remained the same.
Figures 3.6 to 3.8 show longer-term patterns. Overall, between 2002 and 2009, provincial welfare incomes were at more than 80% of the MBM in only 16 cases. Four of these 16 cases were in Quebec between 2002 and 2005, and eight cases were in Ontario between 2002 and 2009. Alberta AISH cases were above 80% in the 2006–2009 period.
WI of a person with a disability as a percentage of MBM*
*Estimated
*Estimated
1 Note that to ensure the comparability of the data as much as possible, we made a number of assumptions in calculating the levels of assistance. These assumptions include: where welfare households lived; the employability of the household head; the type of housing and entitlement to additional assistance. See Methodology.
2 All welfare incomes over time are expressed in 2009 constant dollars to factor out the effects of inflation.
3 We began to collect rates for the AISH program only in 2006, so it is not part of this ranking.
4 Definitions of these measures can be found in the Methodology Bulletin of Poverty Profile 2007: http://www.cnb-ncw.gc.ca/l.3bd.2t.1ils@-eng.jsp?lid=11
5 The MBM for year 2009 was estimated based on the MBM for the year 2008. A review process changed the MBM thresholds (base 2008) and therefore the incidence of low income has been impacted.