Common menu bar
Piste de navigation
- Accueil >
- Aide >
- Archivée - Questionnaire sur la stratégie anti-pauvreté et la sécurité du revenu - Pour les organismes >
- Résoudre la pauvreté : Recherches et publications >
- CHAPTER 2 - SINGLE PERSON CONSIDERED EMPLOYABLE
Chapter 2
SINGLE PERSON CONSIDERED EMPLOYABLE
WIDE VARIATION CONTINUED ACROSS THE COUNTRY
At the provincial level:
- The highest total welfare income1 in 2009 for a single person considered employable was $9,593 in Newfoundland and Labrador.
- The lowest total welfare income was $3,773 in New Brunswick.
- The median value was $7,277 or in other words, half of the 2009 total welfare incomes were below $7,277 and half were above that amount.
At the territorial level:
- Amounts were much higher than at the provincial level, due to higher cost of living. Nunavut's incomes were the highest, with average monthly rents in excess of $2,800.
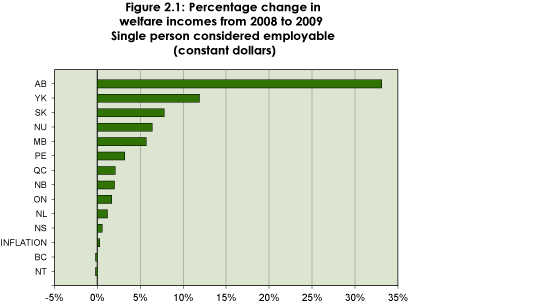
INCREASE OVER LAST YEAR BUT DECREASE OVER TIME
Generally, single employable persons saw an increase in their total welfare incomes between 2008 and 2009. Almost all increases were due to provincial changes, with the increase of the federal GST counting for only a slight part of the total increase. In New Brunswick, Alberta and partially for Manitoba, the provincial increases were implemented mid-2008 or at the end of 2008. Nine jurisdictions implemented rate increases in 2009: Newfoundland and Labrador, Prince Edward Island, Nova Scotia, Quebec, Ontario, Manitoba, Saskatchewan, British Columbia and Yukon. In Nunavut and Northwest Territories, there were no changes between the 2008 and 2009 amounts.
The cost of living affects the value of welfare incomes, and it increased by only 0.3% between 2008 and 2009. In British Columbia, the Northwest Territories and Nunavut, the overall welfare income increases were so small that once inflation was taken into consideration, they became a decrease. When adjusted for inflation, the increase in total welfare incomes between 2008 and 2009 ranged from 0.6% in Nova Scotia to 33.1% in Alberta.2
| Table 2.1: 2009 Welfare Incomes for Single Person Considered Employable | |||||
|---|---|---|---|---|---|
| Basic Social Assistance | Other P/T* Benefits | GST Credit | P/T* Tax Credits | 2009 Total Income |
|
| Newfoundland and Labrador (NL) | $8,085 | $1,200 | $268 | $40 | $9,593 |
| Prince Edward Island (PE) | $6,661 | - | $245 | - | $6,906 |
| Nova Scotia (NS) | $6,114 | - | $245 | - | $6,359 |
| New Brunswick (NB) | $3,528 | - | $245 | - | $3,773 |
| Quebec (QC) | $7,067 | - | $245 | - | $7,312 |
| Ontario (ON) | $6,877 | - | $245 | $379 | $7,501 |
| Manitoba (MB) | $6,060 | $510 | $245 | - | $6,815 |
| Saskatchewan (SK) | $8,316 | - | $245 | $219 | $8,780 |
| Alberta (AB) | $6,996 | - | $245 | - | $7,241 |
| British Columbia (BC) | $7,320 | $35 | $245 | $178 | $7,778 |
| Yukon (YK) | $14,873 | $155 | $341 | - | $15,369 |
| Northwest Territories (NT) | $16,942 | - | $374 | - | $17,316 |
| Nunavut (NU) | $43,452 | - | $374 | - | $43,826 |
*Provincial/Territorial
Data for 1990 are not available for the Northwest Territories. Nunavut became a separate territory in 1999.
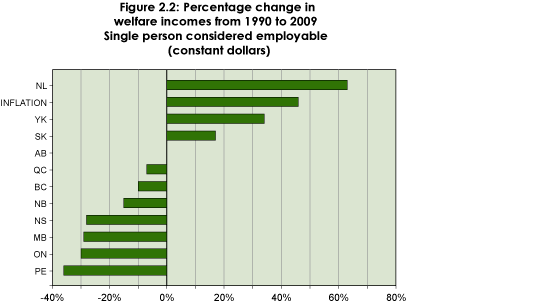
For the period 1990–2009, single employable persons saw an increase in their welfare incomes in only three jurisdictions: Saskatchewan (17%), Yukon (34%) and Newfoundland and Labrador (63%). However, inflation increased by 45.9% during the 19-year period; thus only in Newfoundland and Labrador did the welfare income increase exceed the cost of living.
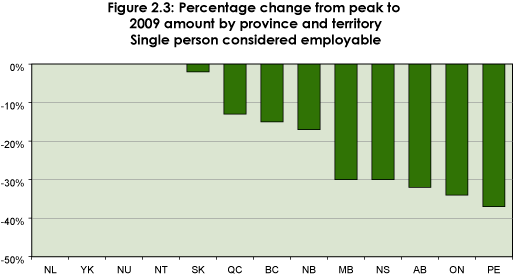
Table 2.2 further illustrates the extent of the decline in welfare incomes over the years. It shows the year in which welfare incomes were at their peak and the year they were at their lowest, then compares these amounts to the 2009 welfare incomes. Note that the dollar amounts are in constant dollars.
- Only two provinces had their peak years in this decade – Newfoundland and Labrador (2009) and Saskatchewan (2006). The vast majority of welfare incomes peaked many years ago. In six cases, the peak was in the period 1991–1994.
- The amount of the decrease in total welfare incomes was severe in some cases. In seven cases the loss was more than $1,000 including the two worst cases, Prince Edward Island ($4,110) and Ontario ($3,933).
- Most low years were in the current decade.
| Table 2.2: Changes in welfare incomes, from peak year and low year to 2009 | |||||||
|---|---|---|---|---|---|---|---|
| 2009 Amount(1) | Peak Year (2) | Peak Amount(3) | $ Change from Peak to 2009 (4 = 1-3) | Low Year (5) | Low Amount(6) | $ Change from Low Amount to 2009(7 = 1-6) | |
| NL | $9,593 | 2009 | $9,593 | $0 | 1989 | $5,804 | $3,789 |
| PE | $6,906 | 1992 | $11,016 | -$4,110 | 2005 | $6,643 | $263 |
| NS | $6,359 | 1989 | $9,098 | -$2,739 | 2000 | $5,487 | $872 |
| NB | $3,773 | 1991 | $4,537 | -$764 | 2006 | $3,658 | $115 |
| QC | $7,312 | 1993 | $8,438 | -$1,126 | 2008 | $7,165 | $147 |
| ON | $7,501 | 1992 | $11,434 | -$3,933 | 2008 | $7,374 | $127 |
| MB | $6,815 | 1992 | $9,667 | -$2,852 | 2007 | $5,978 | $837 |
| SK | $8,780 | 2006 | $8,960 | -$180 | 2004 | $6,830 | $1,950 |
| AB | $7,241 | 1986 | $10,572 | -$3,331 | 2007 | $5,190 | $2,051 |
| BC | $7,778 | 1994 | $9,097 | -$1,319 | 2006 | $6,776 | $1,001 |
| YK | $15,369 | 2009 | $15,369 | $0 | 1986 | $8,973 | $6,396 |
| NT | $17,316 | 2008 | $17,353 | -$37 | 1998 | $9,669 | $7,647 |
| NU | $43,826 | 2009 | $43,826 | $0 | 2007 | $39,649 | $4,177 |
*Peak amounts and low amounts are in 2009 constant dollars.
Green colour is for peak years and orange colour is for low years during this decade.
General observations
Most Canadians would find it extremely difficult to cope with the substantial income losses that welfare households have experienced. Coping is even harder for those who are at the bottom of the income scale, given their already meagre incomes. The decline in rates has been a particular shock to singles hit by the recession who did not expect to ever find themselves needing welfare. Peter's story is an example.
Peter lost his job last year and has now used up all of his Employment Insurance benefits. He turns to his provincial social assistance program hoping he will be able to receive some financial help. He soon learns to his surprise that the maximum he could receive from Ontario Works for 2009 would be $585 a month. He worries, since he has to pay a monthly rent of $780 for his Toronto apartment. He was under the impression that people on welfare had it easy? He even remembers having a neighbour who told him, back in 1992, that a welfare check was above $10,000 yearly! How could it be smaller these days than it was back then? He knows that it costs much more to live now than in 1992, so ?Why? He doesn't get it?
(The Market Basket Measure of poverty for a person living in Toronto in 2009 is estimated by the NCW at $15,633.)
ADEQUACY OF 2009 WELFARE INCOMES
The 2009 total welfare incomes for single employable persons were compared with a number of low income measures, including the after-tax Low-income cut-offs (AT LICO) and the Market Basket Measure (MBM), as well as with the after tax median income and the after tax average income.3
| Table 2.3: Measuring the adequacy of welfare incomes | |||||
|---|---|---|---|---|---|
| 2009 Total Welfare Incomes | AT LICO | MBM* | Median AT Income* | Average AT Income* | |
| NL | $9,593 | $15,579 | $14,968 | $20,006 | $25,166 |
| PE | $6,906 | $15,384 | $15,852 | $21,111 | $26,870 |
| NS | $6,359 | $15,579 | $15,044 | $23,444 | $25,868 |
| NB | $3,773 | $15,579 | $14,373 | $20,988 | $25,968 |
| QC | $7,312 | $18,421 | $14,158 | $21,346 | $26,870 |
| ON | $7,501 | $18,421 | $15,633 | $22,667 | $32,686 |
| MB | $6,815 | $18,421 | $13,795 | $23,229 | $31,783 |
| SK | $8,780 | $15,579 | $14,368 | $24,028 | $30,580 |
| AB | $7,241 | $18,421 | $15,491 | $30,515 | $41,609 |
| BC | $7,778 | $18,421 | $15,032 | $24,437 | $34,691 |
| YK | $15,369 | n/a | n/a | $29 942 | n/a |
| NT | $17,316 | n/a | n/a | $33 176 | n/a |
| NU | $43,826 | n/a | n/a | $31,641 | n/a |
*Estimated
*Estimated
The Market Basket Measure provides a good estimate of the cost of living because it is sensitive to differences in the cost of the basket of goods – including transportation, shelter, clothing and food components – and services in different parts of Canada.4
All 2009 welfare incomes were below both low-income measures by at least $5,000, and in the case of Ontario, New Brunswick and Alberta, by $10,000.
When compared with median and average after-tax incomes, the gap between welfare incomes and these incomes was larger. Welfare incomes of a single person in New Brunswick, Ontario, Manitoba, Saskatchewan, Alberta and British Columbia were below the average after-tax income of single persons in those provinces by at least $20,000.
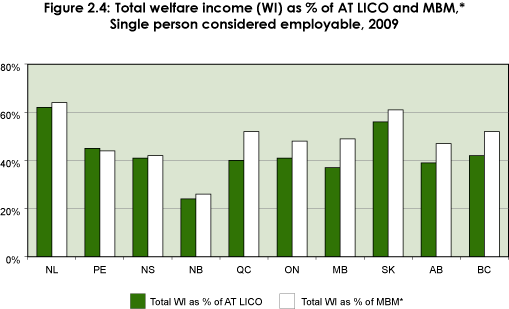
- Expressed as a percentage of the after-tax LICO, the lowest welfare income was in New Brunswick at 24%. In Newfoundland and Labrador, it reached 62%.
- Expressed as a percentage of the MBM, the lowest welfare income was in New Brunswick at 26%. In Newfoundland and Labrador, it reached 64%.
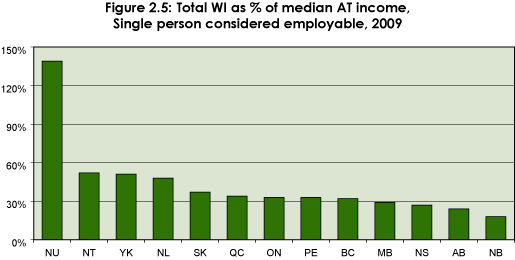
- The median income is the only measure available for the territories. Expressed as a percentage of the median after-tax income, the lowest welfare income was in New Brunswick at 18%. Among the provinces, it reached a maximum of 48% in Newfoundland and Labrador. Among the territories, it reached a maximum of 130% in Nunavut.
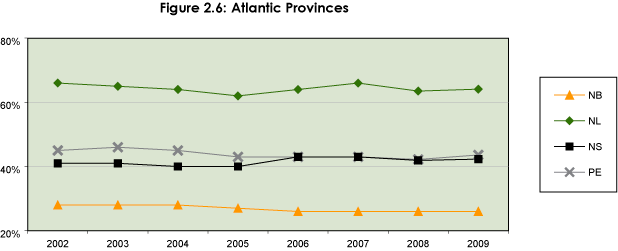
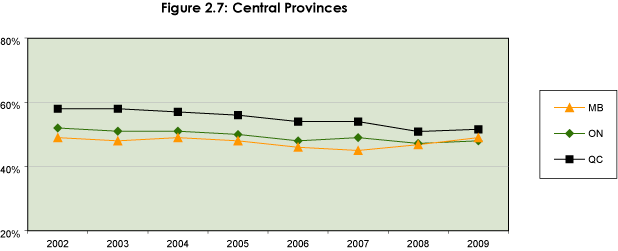
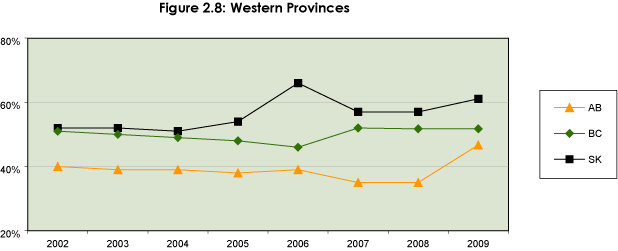
WELFARE INCOMES COMPARED TO MBM, 2002–2009
Compared to 2008, welfare incomes for a single employable person in 2009 improved everywhere, with the greatest improvement in Saskatchewan and Alberta. There was about a 1% overall increase in the ratio of welfare incomes compared to the MBM. Overall, between 2002 and 2009, provincial welfare incomes were at more than 60% of the MBM in only ten cases. Eight of these ten cases were in Newfoundland and Labrador between 2002 and 2008, and the other cases were in Saskatchewan in 2006 and in 2009.
WI of a single person considered employable as a percentage of MBM*
*Estimated
*Estimated
1 Note that to ensure the comparability of the data as much as possible, we made a number of assumptions in calculating the levels of assistance. These assumptions include: where welfare households lived; the employability of the household head; the type of housing and entitlement to additional assistance. See Methodology.
2 All welfare incomes over time are expressed in 2009 constant dollars to factor out the effects of inflation.
3 Definitions of these measures can be found in the Methodology Bulletin of Poverty Profile 2007: http://www.cnb-ncw.gc.ca/l.3bd.2t.1ils@-eng.jsp?lid=11
4 The MBM for year 2009 was estimated based on the MBM for the year 2008. A review process changed the MBM thresholds (base 2008) and therefore the incidence of low income has been impacted.