Common menu bar
Piste de navigation
- Accueil >
- Communauté : Le coût de la pauvreté >
- CHAPTER 4 - LONE PARENT WITH A CHILD AGED TWO
Chapter 4
LONE PARENT WITH A CHILD AGED TWO
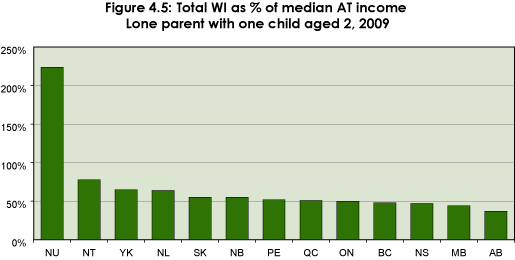
WIDE VARIATION CONTINUED ACROSS THE COUNTRY
At the provincial level:
- The highest total welfare income1 in 2009 for a lone parent with one child was $19,297 in Newfoundland and Labrador.
- The lowest total welfare income was $14,829 in Manitoba.
- The median value was $16,715. In other words, half of the 2009 total welfare incomes were below $16,715 and half were above it.
At the territorial level:
- Incomes were considerably higher in the territories, due to the higher cost of living. Nunavut’s incomes were the highest, with average monthly rents in excess of $2,800.
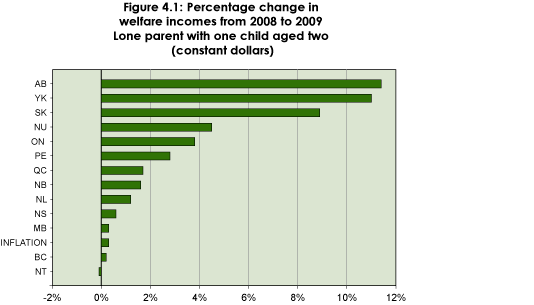
INCREASE OVER LAST YEAR BUT DECREASE OVER TIME
Between 2008 and 2009, lone parents with one child saw an increase in their total welfare incomes across the country, except for the Northwest Territories. Most of these were due to welfare rate increases for families with children. In New Brunswick, Saskatchewan, Alberta and the Yukon, the increases were implemented mid-to late 2008. Six provinces implemented increases in 2009: Newfoundland and Labrador, Prince Edward Island, Nova Scotia, Quebec, Ontario and Saskatchewan. Both Ontario and the Yukon also increased their child benefit rates substantially – Yukon in July 2008 and Ontario in July 2009.
Between 2008 and 2009, the cost of living increased by 0.3 percent. When adjusted for inflation, most welfare incomes for this period exceeded inflation. The increases ranged from 0.2% in British Columbia to 11.4% in Alberta.2
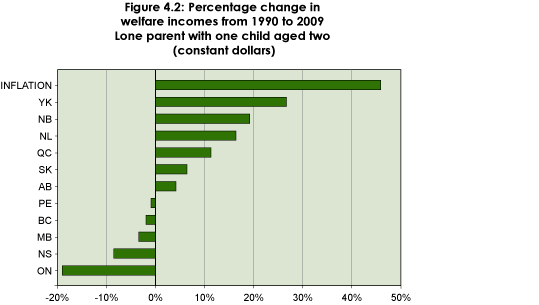
For the period 1990 to 2009, lone parents with one child saw increases in six instances. These occurred in Yukon (26.7%), New Brunswick (19.2%), Newfoundland and Labrador (16.4%), Quebec (11.3%), Saskatchewan (6.4%), and Alberta (4.2%). However, none of the increases came close to the 45.9% increase in the cost of living over the 19 years. Further, in Ontario welfare incomes decreased by close to 20%.
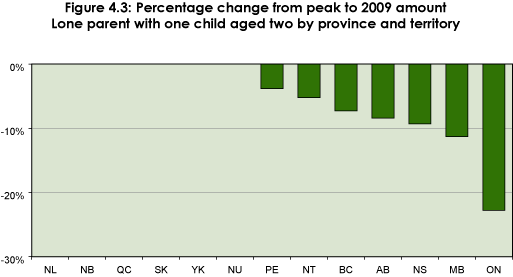
Table 4.2 further illustrates the extent of the decline in welfare incomes for a lone parent with one child over the years. It shows the year in which welfare incomes were at their peak and the year they were at their lowest, then compares these amounts to the 2009 welfare incomes.
Six jurisdictions had their peak years in the current decade – Newfoundland and Labrador, New Brunswick, Quebec, Saskatchewan, Yukon and Nunavut.
- The provinces with their lowest years during this decade are Nova Scotia, Ontario, Manitoba, Saskatchewan, Alberta and British Columbia.
- The amount of the decrease in total welfare incomes is severe in some cases. Ontario shows the highest overall decrease, at $5,138. This represents a loss of over 20%.
| Table 4.1: 2009 Welfare Incomes for a lone parent with a child aged two | |||||||
|---|---|---|---|---|---|---|---|
| Basic Social Assistance | Other P/T* Benefits | Federal Child Benefits | P/T* Child Benefit | GST Credit | Provincial Tax Credits | 2009 TotalIncome | |
| Newfoundland and Labrador (NL) |
$12,474 | $1,200 | $4,574 | $331 | $619 | $100 | $19,297 |
| Prince Edward Island (PE) | $11,339 | - | $4,574 | - | $619 | - | $16,531 |
| Nova Scotia (NS) | $9,354 | - | $4,574 | $445 | $619 | - | $14,992 |
| New Brunswick (NB) | $9,708 | $1,020 | $4,574 | $250 | $619 | - | $16,171 |
| Quebec (QC) | $8,507 | $960 | $4,574 | $2,924 | $619 | - | $17,583 |
| Ontario (ON) | $10,937 | - | $4,574 | $850 | $619 | $392 | $17,372 |
| Manitoba (MB) | $9,636 | - | $4,574 | - | $619 | - | $14,829 |
| Saskatchewan (SK) | $12,293 | - | $4,574 | - | $619 | $437 | $17,923 |
| Alberta | $10,668 | - | $4,462 | - | $619 | - | $15,749 |
| British Columbia (BC) | $11,347 | $80 | $4,574 | - | $619 | $280 | $16,899 |
| Yukon (YK) | $19,347 | $260 | $4,574 | $690 | $619 | - | $25,489 |
| Northwest Territories (NT) | $20,930 | - | $4,574 | $328 | $619 | - | $26,450 |
| Nunavut (NU) | $46,716 | - | $2,028 | $0 | $129 | - | $48,873 |
*Provincial/Territorial
Data for 1990 are not available for the Northwest Territories. Nunavut became a separate territory in 1999.
| Table 4.2: Change in welfare incomes, from peak year and low year to 2009 | |||||||
|---|---|---|---|---|---|---|---|
| 2009 Amount (1) | Peak Year(2) | Peak Amount(3) | $ Change from Peak to 2009(4 = 1-3) | Low Year(5) | Low Amount(6) | $ Change from Low Amount to 2009(7 = 1-6) | |
| NL | $19,297 | 2009 | $19,297 | $0 | 1989 | $16,327 | $2,970 |
| PE | $16,531 | 1992 | $17,187 | -$656 | 1999 | $14,366 | $2,165 |
| NS | $14,992 | 1991 | $16,530 | -$1,539 | 2005 | $13,808 | $1,183 |
| NB | $16,171 | 2009 | $16,171 | $0 | 1989 | $13,480 | $2,691 |
| QC | $17,583 | 2009 | $17,583 | $0 | 1989 | $14,663 | $2,920 |
| ON | $17,372 | 1992 | $22,510 | -$5,138 | 2005 | $15,448 | $1,924 |
| MB | $14,829 | 1992 | $16,723 | -$1,894 | 2000 | $13,928 | $901 |
| SK | $17,923 | 2009 | $17,923 | $0 | 2004 | $13,894 | $4,029 |
| AB | $15,749 | 1986 | $17,196 | -$1,447 | 2005 | $13,176 | $2,572 |
| BC | $16,899 | 1994 | $18,238 | -$1,338 | 2005 | $14,910 | $1,989 |
| YK | $25,489 | 2009 | $25,489 | $0 | 1986 | $17,968 | $7,521 |
| NT | $26,450 | 1993 | $27,913 | -$1,463 | 2007 | $19,742 | $6,709 |
| NU | $48,873 | 2009 | $48,873 | $0 | 2007 | $46,118 | $2,755 |
*Peak amounts and low amounts are in 2009 constant dollars.
Green colour is for peak years and orange colour is for low years during this decade.
ADEQUACY OF 2009 WELFARE INCOMES
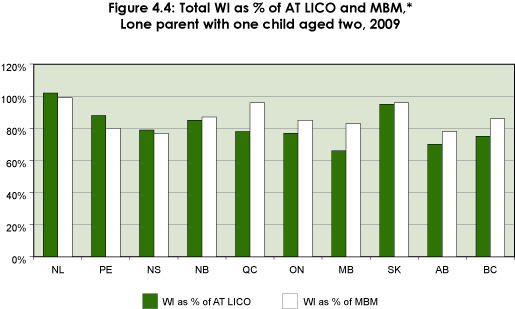
The 2009 total welfare incomes for a lone parent with one child were compared with a number of low-income measures, including the after-tax Low-income cut-offs (AT LICO) and the Market Basket Measure (MBM), as well as with the median after tax income and the average after tax income.3
All 2009 welfare incomes for a lone parent with one child were below the after tax LICO by $1,000 or more, except for Newfoundland and Labrador, where they exceeded the measure by $337. The second smallest gap was in Saskatchewan, at $1,037. Manitoba, Alberta and British Columbia had the largest differences, between $5,500 and $7,500.
The Market Basket Measure (MBM) provides a good estimate of the cost of living because it is sensitive to differences in the cost of the basket of goods – including transportation, shelter, clothing and food components– and services in different parts of Canada.4 The welfare incomes of lone parents with one child in Newfoundland and Labrador missed the MBM by $161. The largest gap was in Nova Scotia at $4,566 below the MBM.
When compared with median and average after-tax incomes, the gap between welfare incomes and these incomes was larger. Welfare incomes of a parent with one child were below the average after-tax income of all lone parents with one child5 by $15,000 or more in seven provinces. The gap between welfare incomes and the median after-tax incomes exceeded $7,000 in all provinces and territories except for Nunavut.
- All welfare incomes of a lone parent with one child reached at least two-thirds of the after-tax LICO. In four cases, they reached 80% or more of the after-tax LICO.
- All provinces other than Alberta and Nova Scotia reached 80% or more of the MBM.
The median income is the only measure available for the territories.
- Welfare incomes for lone parents with one child were below 50% of the after-tax median income in Alberta, Manitoba, Nova Scotia, and British Columbia.
- Among the provinces, welfare incomes for lone parents with one child reached a high of 64% in Newfoundland and Labrador. Among the territories, it reached a maximum of 216% in Nunavut.
| Table 4.3: Measuring the adequacy of welfare incomesLone parent with one child aged two | |||||
|---|---|---|---|---|---|
| 2009 Total Welfare Incomes | AT LICO | MBM* | Median AT Income* | Average AT Income* | |
| NL | $19,297 | $18,960 | $19,458 | $30,086 | $27,773 |
| PE | $16,531 | $18,725 | $20,607 | $31,815 | $26,169 |
| NS | $14,992 | $18,960 | $19,557 | $31,876 | $32,485 |
| NB | $16,171 | $18,960 | $18,685 | $29,615 | $27,873 |
| QC | $17,583 | $22,420 | $18,405 | $34,517 | $34,891 |
| ON | $17,372 | $22,420 | $20,323 | $35,008 | $41,910 |
| MB | $14,829 | $22,420 | $17,933 | $33,708 | $32,686 |
| SK | $17,923 | $18,960 | $18,679 | $32,511 | $33,889 |
| AB | $15,749 | $22,420 | $20,138 | $42,447 | $45,720 |
| BC | $16,899 | $22,420 | $19,542 | $35,509 | $36,295 |
| YK | $25,489 | n/a | n/a | $38,927 | n/a |
| NT | $26,450 | n/a | n/a | $33,718 | n/a |
| NU | $48,873 | n/a | n/a | $21,776 | n/a |
*Estimated for all lone parents with one child
*Estimated
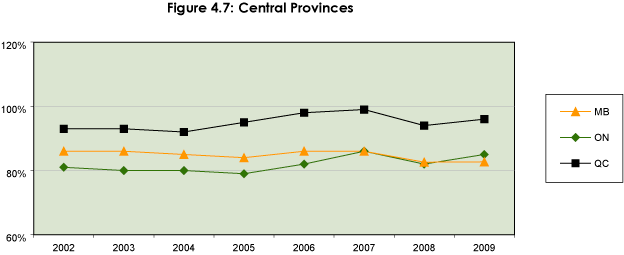
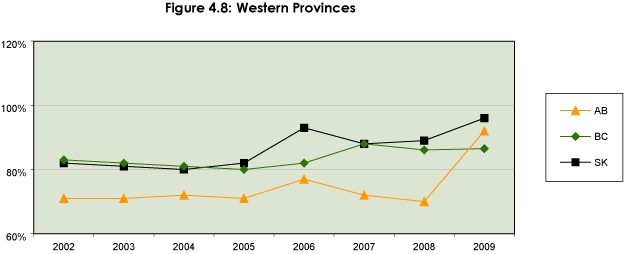
WELFARE INCOMES COMPARED TO MBM, 2002–2009
Between 2008 and 2009, using the MBM, welfare incomes for a lone parent with one child improved everywhere. Most increases were around 1%. In Alberta the ratio increased by 22%, bumping Alberta from a 10th place ranking to 4th. Newfoundland and Labrador, Quebec and Saskatchewan hold the top three rankings in both 2008 and 2009.
The charts below show longer-term patterns from 2002 to 2009. Every jurisdiction showed an increase, except for Manitoba where it decreased by almost 4%.
WI of a Lone parent with one child aged two as a percentage of MBM*
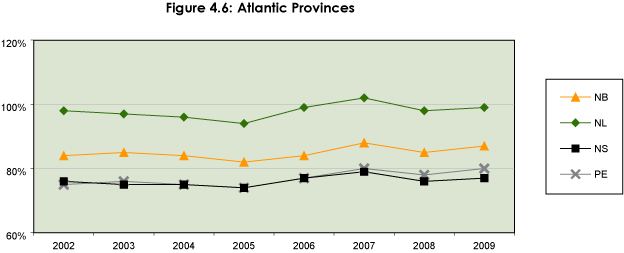
*Estimated
*Estimated
1 Note that to ensure the comparability of the data as much as possible, we made a number of assumptions in calculating the levels of assistance. These assumptions include: where welfare households lived; the employability of the household head; the type of housing and entitlement to additional assistance. See Methodology.
2 All welfare incomes over time are expressed in 2009 constant dollars to factor out the effects of inflation.
3 Definitions of these measures can be found in the Methodology Bulletin of Poverty Profile 2007: http://www.cnb-ncw.gc.ca/l.3bd.2t.1ils@-eng.jsp?lid=11
4 The MBM for year 2009 was estimated based on the MBM for the year 2008. A review process changed the MBM threshold (base 2008) and therefore the incidence of low income has been impacted.
5 Note that median and average incomes of lone parents are already much less than for other families with children.