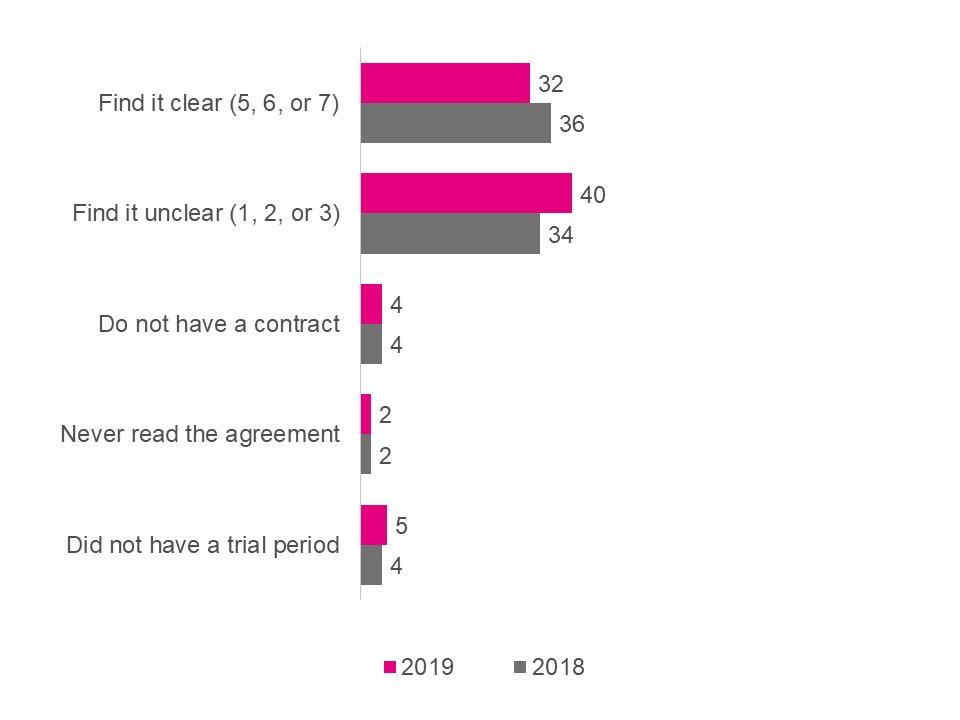
This horizontal bar graph shows the proportion of people who find it clear or who find it unclear to understand the explanation of the trail period. The 1322 respondents in the 2019 survey answered as follows:
- Find it clear (5, 6 or 7), 32%
- Find it unclear (1, 2 or 3), 40%
- Do not have a contract, 4%
- Never read the agreement, 2%
- Did not have a trial period, 5%
The 1111 respondents in the 2018 survey answered as follows:
- Find it clear (5, 6 or 7), 36%
- Find it unclear (1, 2 or 3), 34%
- Do not have a contract, 4%
- Never read the agreement, 2%
- Did not have a trial period, 4%