The Canadian Radio-television and Telecommunications Commission (CRTC) commissioned Kantar TNS to conduct a public opinion research survey to obtain tracking data on how consumers understand their wireless service contracts and their related rights as well as to further explore a variety of topics such as wireless complaints, data usage, bill shock, and ease of switching service providers. This wave of research will again explore Canadians perceptions of the CRTC as well as issues related to the TV Service Provider Code. This publication reports on the findings of this research.
This publication may be reproduced for non-commercial purposes only. Prior written permission must be obtained from the CRTC. For more information on this report, please contact the CRTC at communications@crtc.gc.ca or at:
Canadian Radio-television and Telecommunications Commission (CRTC)
1 Promenade du Portage
Gatineau, Quebec J8X 4B1
Catalogue Number:
BC92-96/2019E-PDF
International Standard Book Number (ISBN):
978-0-660-30163-1
Related publications (registration number: POR # 084-18):
Catalogue Number: BC92-96/2019F-PDF (Final Report, French)
ISBN 978-0-660-30164-8
The Wireless Code, which was established in 2013 by the CRTC, is a mandatory code of conduct for wireless service providers and applies to all retail mobile wireless voice and data services provided to individual and small business consumers in Canada. The Wireless Code applied to all wireless contracts as of June 3, 2015.
The CRTC committed to evaluating the effectiveness of the Wireless Code and the first review was completed in 2017 to assess whether the Wireless Code meets and continues to meet its objectives, which includes ensuring that consumers are empowered to make informed decisions about wireless services. On June 15, 2017, the CRTC announced multiple changes to the Wireless Code, which came into effect on December 1, 2017.
The information collected in the 2019 Wireless Code public opinion research (POR) will help the CRTC assess whether Canadians are satisfied with the changes and whether further changes are required to ensure the objectives of the Wireless Code continue to be met. The 2019 research further explores a variety of topics such as wireless complaints, data usage, bill shock, and ease of switching service providers. This wave of research further explores Canadians perceptions of the CRTC as well as issues related to the TV Service Provider Code.
The methodology was designed to ensure consistency with previous iterations of Wireless Code PORs conducted from 2014-2018.
This research was designed to address the following objectives:
Better understand some of the issues that affect Canadians the most as it relates to their wireless services to support the ongoing evaluation of the Wireless Code.
Obtain data to assess whether the Wireless Code continues to meet its objectives, which include ensuring that consumers are empowered to make informed decisions about wireless services.
Better understand Canadians’ perception of the CRTC and how it is changing over time.
Better understand issues that affect Canadians the most as they relate to their television services.
1.2. Summary of Findings
Wireless Data Usage
The composition of wireless plans has changed over the past year, with Canadians increasingly selecting plans that include data (83% compared to 70-76% in previous years). The majority of wireless plans continue to include limited data – a mere eight per cent of Canadians have unlimited wireless data, and nearly all Canadians with limited plans take steps to manage their data so as not to incur additional costs (97%).
The majority of Canadians continue to report they find it easy to manage their data (77%), with many relying on switching to Wi-Fi (92%) as a means of data management. Despite this, a considerable portion (48%) of Canadians with wireless contracts report having paid data overages in the last 12 months, a finding that has remained consistent over the past three years. This suggests that data management in a way that does incur additional costs continues to occur for many Canadians.
Bill shock and Roaming fees
One quarter of Canadians (25%) continue to experience bill shock suggesting that there is continued room for improvement in this area. Bill shock is more prevalent among those with shared or family plans than those with individual plans (31% vs. 23%), as well as those on tab contracts compared to those who are not (30% vs. 22%). Similar to previous years, data overage fees are the predominant source of bill shock and have increased over the past year (56% vs. 43%), while international roaming and long-distance fees continue to be secondary sources of bill shock.
The amount of unexpected charges varies greatly – from less than $50 to over $1,000 per billing cycle, however, there is a directional decrease in the number of bills exceeding $250. Most of the unexpected charges continue to be $100 or less (64%).
Interestingly, even though Canadians are more likely to report data overages as the primary source of bill shock, they tend to express a greater ease for managing data compared to managing roaming fees while travelling. This disconnect suggests that Canadians may still not fully understand how to manage their data in a way that prevents bill shock. Only half (53%) of Canadians report they find it easy to manage roaming fees, while less than a fifth (16%) find it difficult to manage roaming fees while travelling.
Understanding of Contracts
Little has changed compared to 2018 regarding Canadians’ understanding of their wireless contracts, with the majority (61%) continuing to find their wireless contract clear and easy to understand.
However, despite having been in place for over a year, the trial period explanation is somewhat unclear to many Canadians, with only one-third indicating it was clear and easy to understand (32%). Canadians also continue to have some challenges related to the explanation of cancellation fees. Close to one-in-three (30%) find the explanation unclear, an increase over 2018 findings (26%).
Changes
When it comes to changes to contracts, a small but significant portion of Canadians state that changes to wireless services were made without expressly making them aware of the new terms and conditions (16%), an increase from 2018 (12%).
Consistent with 2018, only a small number of Canadians (18%) have switched service providers in the last two years, with the main reason being to obtain a better deal (45%). A minority of those who switched providers found this process difficult (11%), with one-third of switchers indicating that the process was difficult due to the high costs of ending their contract (32%).
Complaints
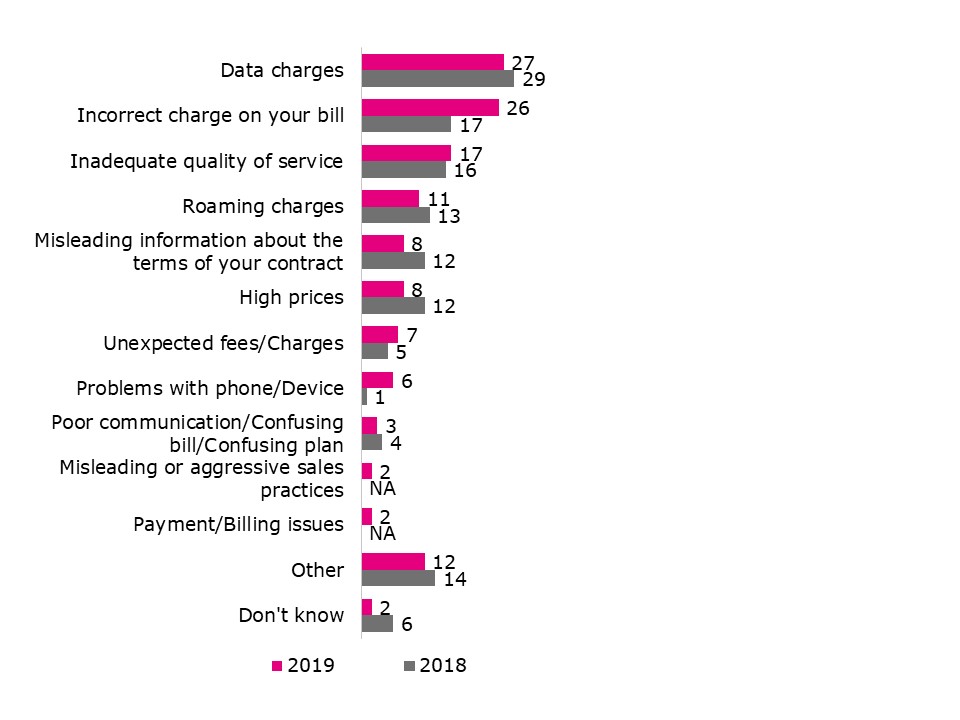
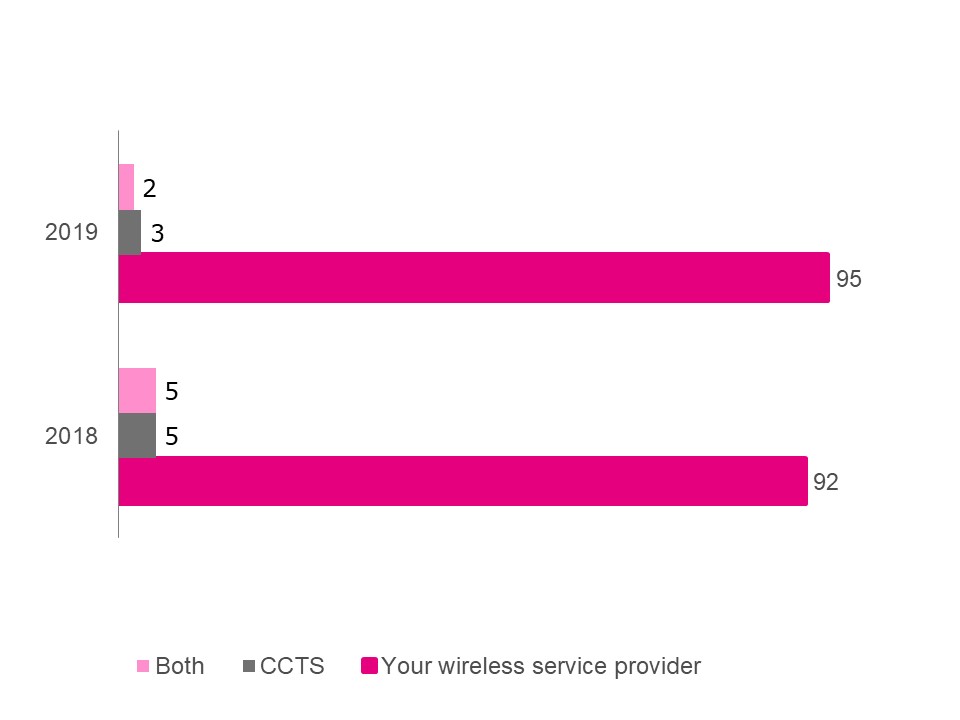
Canadians are making fewer complaints than in the past, suggesting the Wireless Code is having a positive impact for wireless consumers. Levels of complaints have remained steady over the past year, decreasing six percent overall from 2014 (20% vs. 26%). The leading reasons for complaints continue to be data overage charges (27%), incorrect charges on bills (26%), inadequate quality of service (17%), and roaming charges (11%). Consumers continue to primarily complain to their service providers (95%) with few of these complaints (3%) also going to the Commissioner for Complaints for Telecommunications Services (CCTS). The CCTS responds to complaints from consumers if the consumer believes the complaint remains unresolved by the service provider.
Canadians’ Wireless Plans
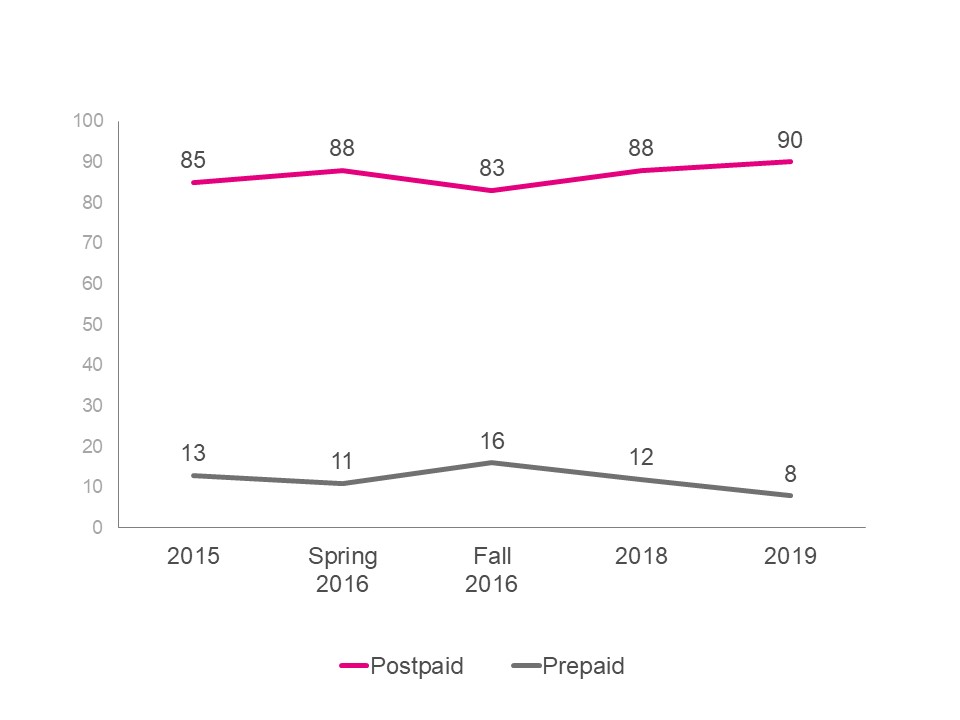
The type of plans Canadians purchase has undergone some change since 2016. While most continue to purchase post-paid services in 2019 (90%), fewer have purchased pre-paid services in 2019 (8%) compared to 2018 (12%), a decline that has continued steadily since Fall 2016 (16%).
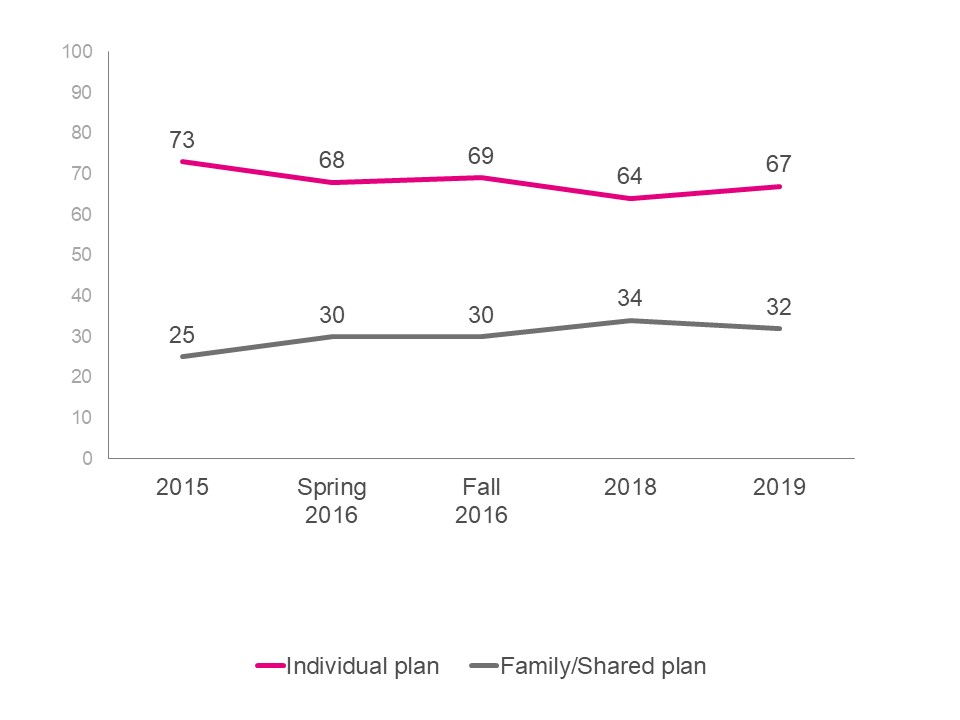
Further, while the majority of Canadians continue to use an individual plan (67%), family plans continue to see increased use compared to 2015 (32% vs. 25%).
Demographic Differences
A number of additional demographic analyses were also undertaken, including age, gender, education, income and language. Differences between demographic groups have dissipated compared to 2018, particularly when it comes to income and education level, suggesting that the Wireless Code is having a positive impact on creating equitable outcomes for Canadians.
Demographic differences tend to persist in the following areas:
Age:
Canadians aged 18-54 are substantially different than their older counterparts (55+) in a number of ways:
Younger Canadians continue to be more likely to employ activities to manage or limit data usage. This is true for switching to Wi-Fi when available (94-97% for 18-54-year-olds vs. 86% for 55+), using tools to track data (47-56% for 18-54-year-olds vs. 37% for 55+) as well as reducing data usage when notified (70-74% for 18-54-year-olds vs. 53% for 55+);
They are more likely to have text (98% vs. 88%), calling minutes (86-90% vs. 79%) and data (88-91% vs. 74%) included in their wireless plan. However, older Canadians are increasingly including these options in their wireless plans;
They continue to be more likely to experience bill shock than their older counterparts (18-54: 26-30% vs. 55+:20%), primarily driven by data overages. Relatedly, they are also more likely to have made a complaint in the past 12 months (22-23% vs. 16%);
Those in the youngest age group (18-34) are more likely to find their wireless contract easy to understand than those 35+ (67% vs. 54-56%); and
They are more likely to have a tab contract (38-48% vs. 30%).
Region:
Quebecers differ from those in other regions of Canada in a few key ways
Quebecers are less likely to make complaints compared to those in other regions of Canada (11% vs. 19-30%);
Quebecers are more likely to have an individual than shared or family plan (80% vs. 48-65%); and
Quebecers are less likely to have made a complaint about their TV services in the past 12 months (16% vs. 26-38%).
Television Service Provider Code
Despite having been introduced more than a year ago, awareness of the Television Service Provider (TVSP) remains low. The number of Canadians who do not recall hearing or seeing anything about the TVSP Code has remained steady compared to 2018 (56%).
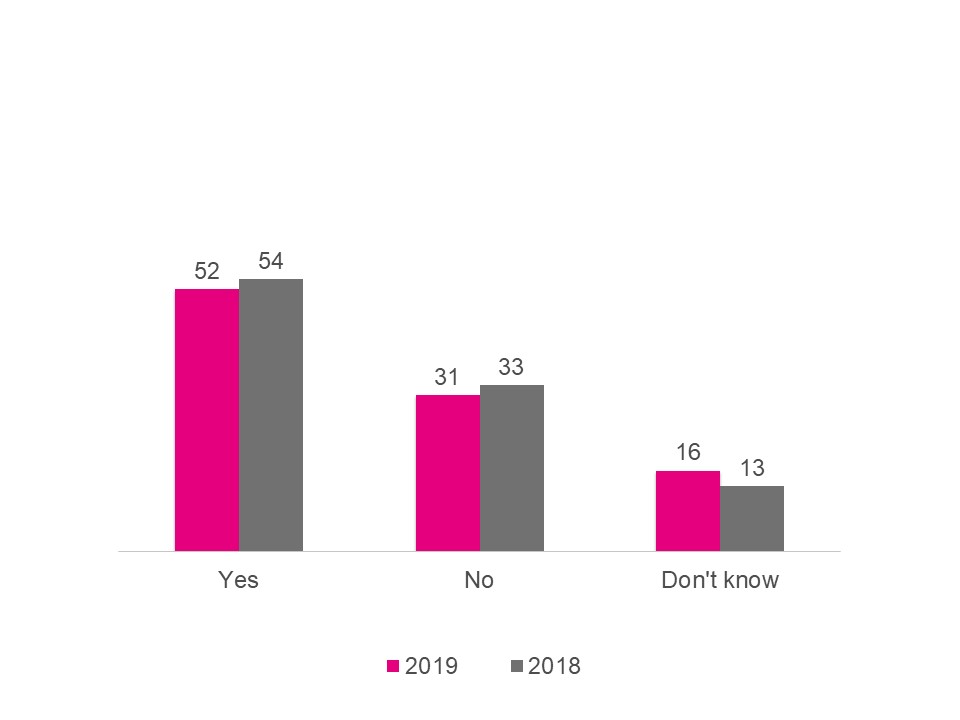
Similarly, only half of TV subscribers (52%) believe they have been informed of their entry-level service offering, despite the requirement that all customers should have been informed. Given that this has remained steady over time, it may signal issues with the way in which the information is being disseminated to Canadians.
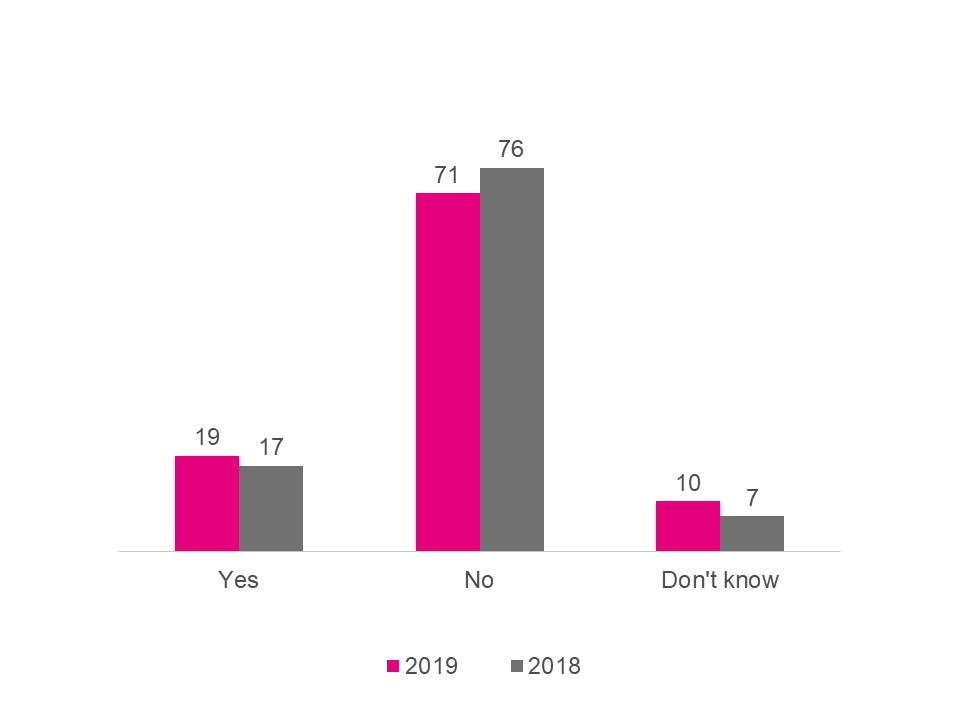
At an overall level, most Canadians continue to find their TV contracts clear and easy to understand (54%) and few (14%) have experienced difficulties related to TV service calls. TV subscribers are usually informed of price changes (71%), though this has decreased somewhat compared to 2018 (76%).
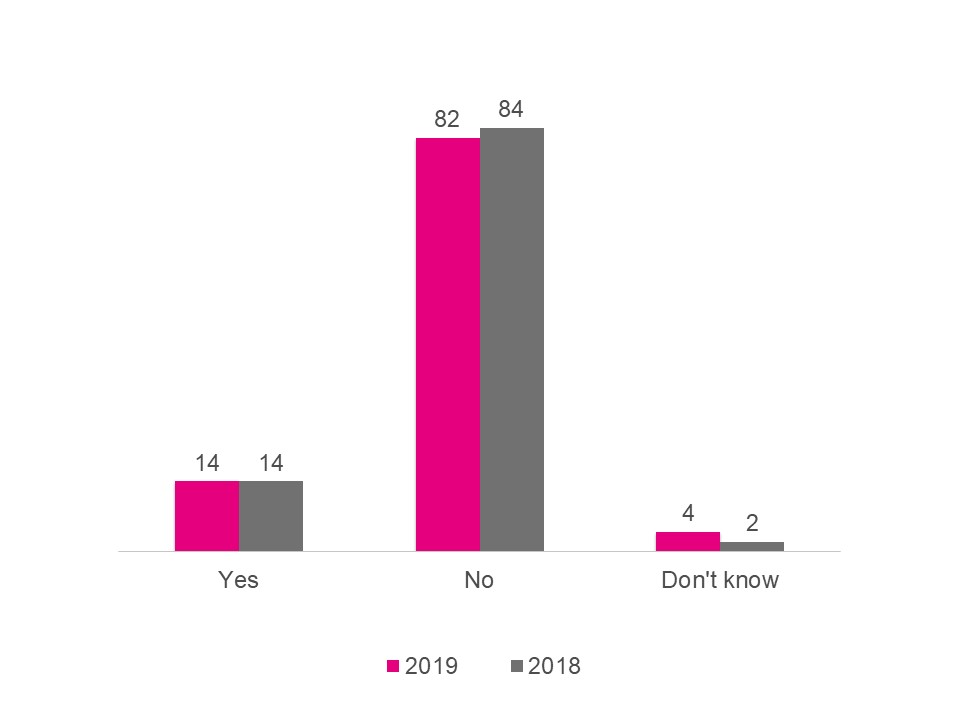
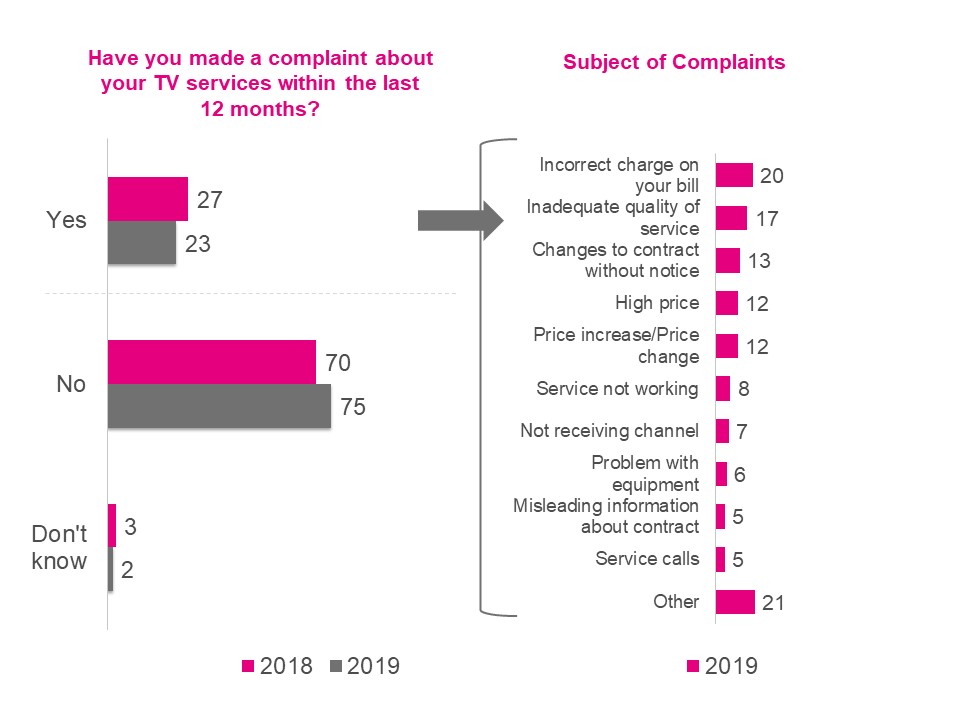
Interestingly, the number of Canadians who have made a complaint about their TV services in the past 12 months has increased compared to 2018 (27% vs. 23%). The nature of these complaints varies, but most center around incorrect charges (20%), inadequate quality of service (17%), changes to their contract without notice (13%), or price changes/high prices (12%).
CRTC
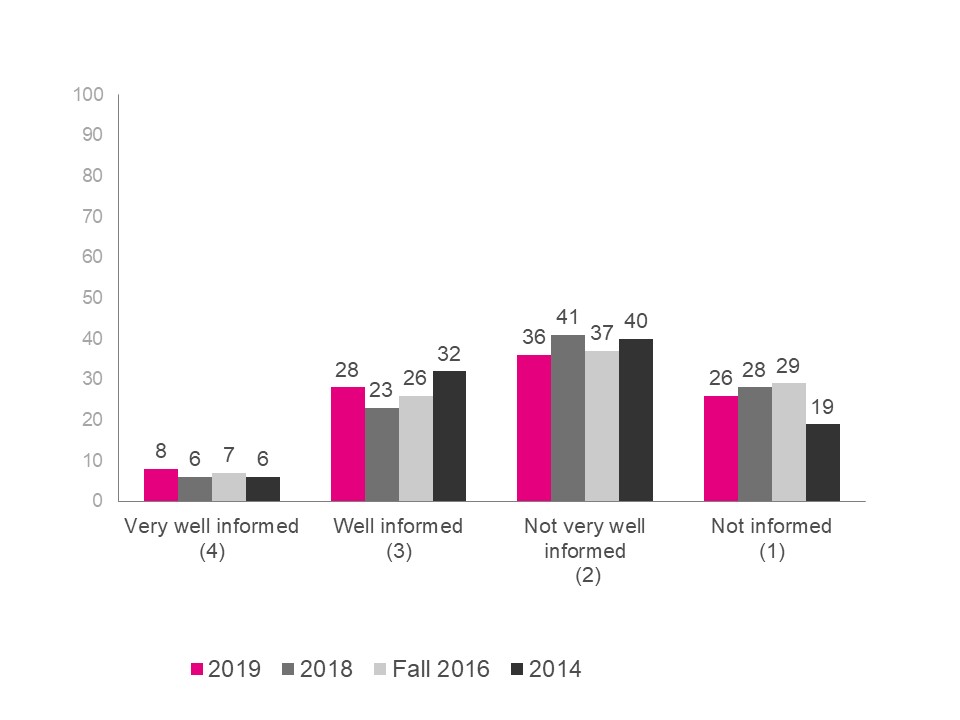
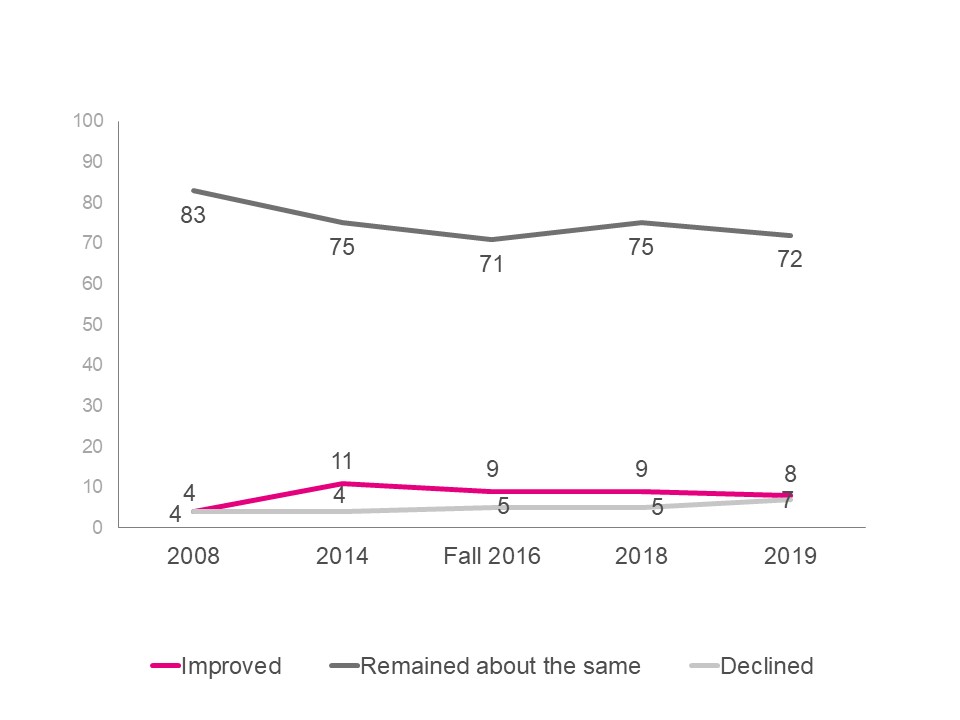
Canadians’ understanding of the mandate and role of the CRTC has improved compared to 2018. Thirty-six per cent now consider themselves very well or well informed about the CRTC, compared to 29 per cent in 2018. These levels are comparable to 2015, when knowledge levels were at their highest (38% very well/well informed).
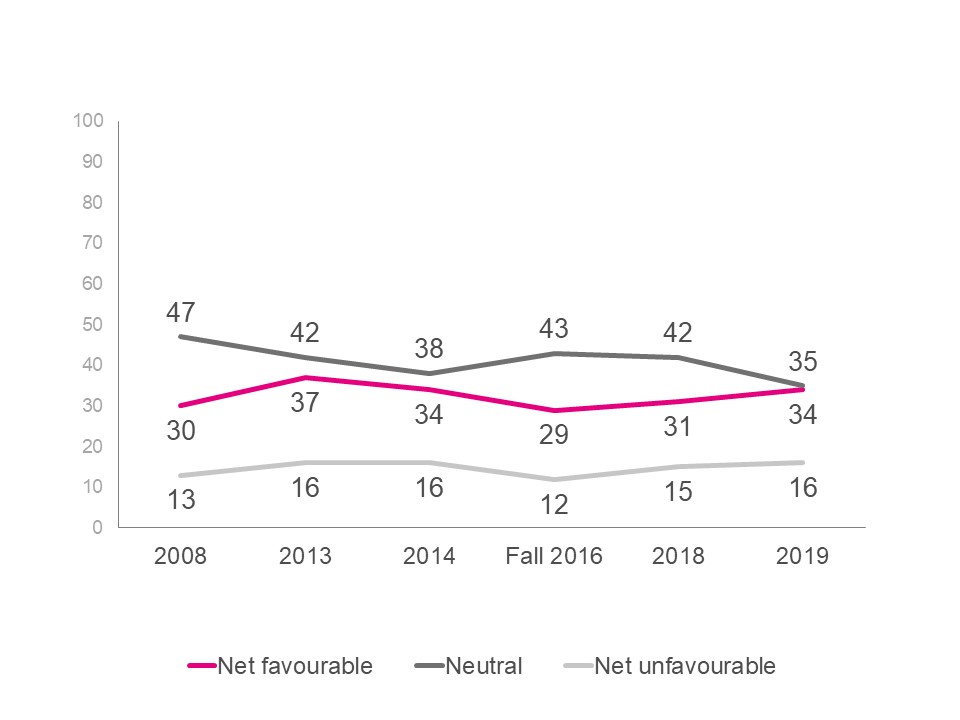
Canadians’ impressions of the CRTC are less neutral than they were in 2018, and show slight improvements from Fall 2016. This is likely a product of the increase in Canadians who feel well informed about the role of the CRTC.
Strategic implications
The results of this research provide evidence that suggests the Wireless Code continues to have positive impacts on Canadians. It also provides information to be considered for future updates of the Wireless Code and/or the Television Service Provider Code.
Data continues to be increasingly important to Canadians, particularly those in older age cohorts, and thus effective and accessible methods of data management continue to be of primary importance. A considerable portion of Canadians still pay overage fees with data overages being the main cause, implying Canadians continue to struggle with data management and changes to the Wireless Code may be able to further support consumers in this area.
A sizeable number of Canadians still experience bill shock. Those who experienced bill shock are more likely to report difficulty with management and understanding of their wireless and television contracts. While causation cannot be established, it is possible that these charges are a result of some Canadians experiencing greater difficulty with management of their contracts, and/or that incurring these overage charges has made this group feel like they have less control over or understanding of their services. This suggests that those who have experienced bill shock continue to lack the clarity and tools they need to effectively manage their services and are at risk of incurring future overage charges. Given that data overage and roaming charges are primary causes of bill shock, there may be ways for the Wireless Code to further assist Canadians with managing these fees.
The explanation of cancellation fees and the trial period needs to be clearer and more easily understood by Canadians, as Canadians are finding these areas increasingly difficult to understand. Results suggest that there continues to be a number of Canadians who do not fully understand these aspects of their contracts.
The lack of changes in understanding of the TVSP Code suggest there is room for improvement in relation to the clarity of contracts, informing customers about the basic cable package and general awareness of the TVSP Code.
Understanding of the CRTC is still somewhat low, and even among those who are well informed perceptions are mixed. This implies that the need to improve understanding of the CRTC and its role, as well as address public perceptions.
1.3. Methodology
The methodology was designed to ensure consistency with previous waves of Wireless Code surveys conducted from 2014-2018. The sample was split into two distinct segments: Canadians who currently have a personal (or retail) wireless plan covering services such as voice, text and data and Canadians who do not currently have a personal (or retail) wireless plan. A telephone survey was conducted among 1,524 Canadians aged 18 years and older; 1,322 with those who have their own wireless plan and 202 with those who do not have a wireless plan. Included in this sample were Canadians that are under contract with TV service providers (n=1,107), along with Canadians who reside in cell phone only households (n=516).
Interviews were conducted using a combination of random digit dialing (RDD) for the landline sample frame and pre-screened cell-phone only (CPO) sample. The RDD approach ensures that all telephone numbers are given an equal probability of being selected thereby minimizing sampling bias for this portion of the sample. Random sampling for CPO households is cost prohibitive and as such pre-screened CPO sample was used for the CPO household subsample.
A pre-test consisting of 10 completed English interviews and 10 completed French interviews was completed before fielding the survey on January 21st, 2019. No changes were made after the pretest and as such the completes were included in the final data set. The survey was in field from January 22nd – February 6th, 2019.
Due to the inclusion of pre-screened cell phone only sample, the sample is a non-probability sample and as such margin of error does not apply.
1.4. Contract Value
The total contract value for the project was $105,021.83 including applicable taxes.
1.5. Statement of Political Neutrality
I hereby certify as a representative of Kantar TNS that the deliverables fully comply with the Government of Canada political neutrality requirements outlined in the Communications Policy of the Government of Canada and Procedures for Planning and Contracting Public Opinion Research. Specifically, the deliverables do not include information on electoral voting intentions, political party preferences, standings with the electorate or ratings of the performance of a political party or its leaders.
Tanya Whitehead
Kantar TNS
Senior Director, Public Practice Leader
2. Foreword
2.1. Background
The Wireless Code, which was established in 2013 by the CRTC, is a mandatory code of conduct for wireless service providers. The Code serves two primary goals: to ensure consumers are empowered to make informed decisions about wireless services; and to make it easier for consumers to take advantage of competitive offers. The Code includes provisions that address clarity; contracts and related documents; changes to contracts; bill management; mobile device issues; and cancellation.
The Code applies to all retail mobile wireless voice and data services (wireless services) provided to individual and small business consumers in Canada. The Code applies to all wireless contracts as of June 3, 2015.
The CRTC has committed to evaluating the effectiveness of the Code and to use the results in formal reviews and the first formal review was completed in 2017. The review of the Wireless Code over time assesses whether it meets and continues to meet its objectives, which includes ensuring that consumers are empowered to make informed decisions about wireless services. Benchmarks were collected in 2014 and further tracking was conducting in 2015, 2016, 2017, 2018 and 2019.
On June 15, 2017, the CRTC announced multiple changes to the Wireless Code. The information collected in the Fall 2017 survey helped the CRTC assess whether Canadians were satisfied with the changes and whether further changes were required to ensure the objectives of the Wireless Code continued to be met. The Commission needs to obtain an additional year of data to continue tracking the Code’s effectiveness and Canadians’ opinions over time.
2.2. Research Objectives
The overall objective of this research was to obtain tracking data on how consumers understand their wireless service contracts and their related rights as well as to further explore a variety of topics such as wireless complaints, data usage, bill shock, and ease of switching service providers. This wave of research will again explore Canadians perceptions of the CRTC as well as issues related to the TV Service Provider Code.
To ensure consistent tracking and comparability over time, the survey used for Wireless Code POR in 2018 was used with minimal changes.
More specifically, the survey was designed to address the following objectives:
Better understand some of the issues that affect Canadians the most as it relates to their wireless services to support the ongoing evaluation of the Wireless Code.
Obtain data to assess whether the Wireless Code continues to meet its objectives, which include ensuring that consumers are empowered to make informed decisions about wireless services.
Better understand Canadians’ perception of the CRTC and how it is changing over time.
Better understand issues that affect Canadians the most as they relate to their television services.
2.3. Methodological Overview
For tracking purposes and comparability over time, most questions remained the same or similar to the ones used for the 2018 Wireless Code POR survey.
A telephone survey was conducted among 1,524 Canadians age 18 years and older; 1,322 with those who have their own wireless plan and 202 with those who do not have their own wireless plan. Interviews were conducted using a combination of random digit dialing (RDD) for the landline sample frame and pre-screened cell phone only households (CPO) sample. Since this survey included pre-screened sample it is considered a non-probability sample and as such margin of error does not apply and conclusions from these results cannot be generalized to any population.
A pre-test consisting of 10 completed English interviews and 10 completed French interviews was completed before fielding the survey on January 21st, 2019. The survey was in field from January 22nd – February 6th, 2019.
A detailed methodology can be found in Chapter 4.10.
Please note: Analysis was undertaken to establish the extent of the relationship among variables such as gender, age, region, level of education attained, language spoken, household income, type of plan (family vs. individual; prepaid vs, postpaid; employee; limited vs. unlimited data; tab contract), ease of managing data, recall of Television Service Provider code, informed role of the CRTC, complaints, bill shock, and CPO sample. Only differences significant at the 95% confidence level are presented in this report. Any differences that are statistically significant between subgroups are indicated with an uppercase letter to refer to the applicable column.
The numbers presented throughout this report are rounded to the closest full number. Due to this rounding, in some cases it may appear that ratings collapsed together are different by a percentage point from when they are presented individually, and totals may not add up to 100%. Also, the data for 2014 and 2015 was taken directly from the 2014 and 2015 Wireless Code Public Opinion Research reports. Kantar TNS has incorporated these results as well as results from Spring and Fall 2016, 2017 & 2018 research into the 2019 report for year-over-year comparison where applicable.
3. Highlights and Strategic Implications
Wireless Data Usage
The composition of wireless plans has changed over the past year, with Canadians increasingly selecting plans that include data (83% compared to 70-76% in previous years). The majority of wireless plans continue to include limited data – a mere eight per cent of Canadians have unlimited wireless data, and nearly all Canadians with limited plans take steps to manage their data so as not to incur additional costs (97%).
The majority of Canadians continue to report they find it easy to manage their data (77%), with many relying on switching to Wi-Fi (92%) as a means of data management. Despite this, a considerable portion (48%) of Canadians with wireless contracts report having paid data overages in the last 12 months, a finding that has remained consistent over the past three years. This suggests that data management in a way that does incur additional costs continues to occur for many Canadians.
Bill shock and Roaming fees
One quarter of Canadians (25%) continue to experience bill shock suggesting that there is continued room for improvement in this area. Bill shock is more prevalent among those with shared or family plans than those with individual plans (31% vs. 23%), as well as those on tab contracts compared to those who are not (30% vs. 22%). Similar to previous years, data overage fees are the predominant source of bill shock and have increased over the past year (56% vs. 43%), while international roaming and long-distance fees continue to be secondary sources of bill shock.
The amount of unexpected charges varies greatly – from less than $50 to over $1,000 per billing cycle, however, there is a directional decrease in the number of bills exceeding $250. Most of the unexpected charges continue to be $100 or less (64%).
Interestingly, even though Canadians are more likely to report data overages as the primary source of bill shock, they tend to express a greater ease for managing data compared to managing roaming fees while travelling. This disconnect suggests that Canadians may still not fully understand how to manage their data in a way that prevents bill shock. Only half (53%) of Canadians report they find it easy to manage roaming fees, while less than a fifth (16%) find it difficult to manage roaming fees while travelling.
Understanding of Contracts
Little has changed compared to 2018 regarding Canadians’ understanding of their wireless contracts, with the majority (61%) continuing to find their wireless contract clear and easy to understand.
However, despite having been in place for over a year, the trial period explanation is somewhat unclear to many Canadians, with only one-third indicating it was clear and easy to understand (32%). Canadians also continue to have some challenges related to the explanation of cancellation fees. Close to one-in-three (30%) find the explanation unclear, an increase over 2018 findings (26%).
Changes
When it comes to changes to contracts, a small but significant portion of Canadians state that changes to wireless services were made without expressly making them aware of the new terms and conditions (16%), an increase from 2018 (12%).
Consistent with 2018, only a small number of Canadians (18%) have switched service providers in the last two years, with the main reason being to obtain a better deal (45%). A minority of those who switched providers found this process difficult (11%), with one-third of switchers indicating that the process was difficult due to the high costs of ending their contract (32%).
Complaints
Canadians are making fewer complaints than in the past, suggesting the Wireless Code is having a positive impact for wireless consumers. Levels of complaints have remained steady over the past year, decreasing six percent overall from 2014 (20% vs. 26%). The leading reasons for complaints continue to be data overage charges (27%), incorrect charges on bills (26%), inadequate quality of service (17%), and roaming charges (11%). Consumers continue to primarily complain to their service providers (95%) with few of these complaints (3%) also going to the Commissioner for Complaints for Telecommunications Services (CCTS). The CCTS responds to complaints from consumers if the consumer believes the complaint remains unresolved by the service provider.
Canadians’ Wireless Plans
The type of plans Canadians purchase has undergone some change since 2016. While most continue to purchase post-paid services in 2019 (90%), fewer have purchased pre-paid services in 2019 (8%) compared to 2018 (12%), a decline that has continued steadily since Fall 2016 (16%).
Further, while the majority of Canadians continue to use an individual plan (67%), family plans continue to see increased use compared to 2015 (32% vs. 25%).
Demographic Differences
A number of additional demographic analyses were also undertaken, including age, gender, education, income and language. Differences between demographic groups have dissipated compared to 2018, particularly when it comes to income and education level, suggesting that the Wireless Code is having a positive impact on creating equitable outcomes for Canadians.
Demographic differences tend to persist in the following areas:
Age:
Canadians aged 18-54 are substantially different than their older counterparts (55+) in a number of ways:
Younger Canadians continue to be more likely to employ activities to manage or limit data usage. This is true for switching to Wi-Fi when available (94-97% for 18-54-year-olds vs. 86% for 55+), using tools to track data (47-56% for 18-54-year-olds vs. 37% for 55+) as well as reducing data usage when notified (70-74% for 18-54-year-olds vs. 53% for 55+);
They are more likely to have text (98% vs. 88%), calling minutes (86-90% vs. 79%) and data (88-91% vs. 74%) included in their wireless plan. However, older Canadians are increasingly including these options in their wireless plans;
They continue to be more likely to experience bill shock than their older counterparts (18-54: 26-30% vs. 55+:20%), primarily driven by data overages. Relatedly, they are also more likely to have made a complaint in the past 12 months (22-23% vs. 16%);
Those in the youngest age group (18-34) are more likely to find their wireless contract easy to understand than those 35+ (67% vs. 54-56%); and
They are more likely to have a tab contract (38-48% vs. 30%).
Region:
Quebecers differ from those in other regions of Canada in a few key ways
Quebecers are less likely to make complaints compared to those in other regions of Canada (11% vs. 19-30%);
Quebecers are more likely to have an individual than shared or family plan (80% vs. 48-65%); and
Quebecers are less likely to have made a complaint about their TV services in the past 12 months (16% vs. 26-38%).
Television Service Provider Code
Despite having been introduced more than a year ago, awareness of the Television Service Provider (TVSP) remains low. The number of Canadians who do not recall hearing or seeing anything about the TVSP Code has remained steady compared to 2018 (56%).
Similarly, only half of TV subscribers (52%) believe they have been informed of their entry-level service offering, despite the requirement that all customers should have been informed. Given that this has remained steady over time, it may signal issues with the way in which the information is being disseminated to Canadians.
At an overall level, most Canadians continue to find their TV contracts clear and easy to understand (54%) and few (14%) have experienced difficulties related to TV service calls. TV subscribers are usually informed of price changes (71%), though this has decreased somewhat compared to 2018 (76%).
Interestingly, the number of Canadians who have made a complaint about their TV services in the past 12 months has increased compared to 2018 (27% vs. 23%). The nature of these complaints varies, but most center around incorrect charges (20%), inadequate quality of service (17%), changes to their contract without notice (13%), or price changes/high prices (12%).
CRTC
Canadians’ understanding of the mandate and role of the CRTC has improved compared to 2018. Thirty-six per cent now consider themselves very well or well informed about the CRTC, compared to 29 per cent in 2018. These levels are comparable to 2015, when knowledge levels were at their highest (38% very well/well informed).
Canadians’ impressions of the CRTC are less neutral than they were in 2018, and show slight improvements from Fall 2016. This is likely a product of the increase in Canadians who feel well informed about the role of the CRTC.
Strategic implications
The results of this research provide evidence that suggests the Wireless Code continues to have positive impacts on Canadians. It also provides information to be considered for future updates of the Wireless Code and/or the Television Service Provider Code.
Data continues to be increasingly important to Canadians, particularly those in older age cohorts, and thus effective and accessible methods of data management continue to be of primary importance. A considerable portion of Canadians still pay overage fees with data overages being the main cause, implying Canadians continue to struggle with data management and changes to the Wireless Code may be able to further support consumers in this area.
A sizeable number of Canadians still experience bill shock. Those who experienced bill shock are more likely to report difficulty with management and understanding of their wireless and television contracts. While causation cannot be established, it is possible that these charges are a result of some Canadians experiencing greater difficulty with management of their contracts, and/or that incurring these overage charges has made this group feel like they have less control over or understanding of their services. This suggests that those who have experienced bill shock continue to lack the clarity and tools they need to effectively manage their services and are at risk of incurring future overage charges. Given that data overage and roaming charges are primary causes of bill shock, there may be ways for the Wireless Code to further assist Canadians with managing these fees.
The explanation of cancellation fees and the trial period needs to be clearer and more easily understood by Canadians, as Canadians are finding these areas increasingly difficult to understand. Results suggest that there continues to be a number of Canadians who do not fully understand these aspects of their contracts.
The lack of changes in understanding of the TVSP Code suggest there is room for improvement in relation to the clarity of contracts, informing customers about the basic cable package and general awareness of the TVSP Code.
Understanding of the CRTC is still somewhat low, and even among those who are well informed perceptions are mixed. This implies that the need to improve understanding of the CRTC and its role, as well as address public perceptions.
4. Wireless Code
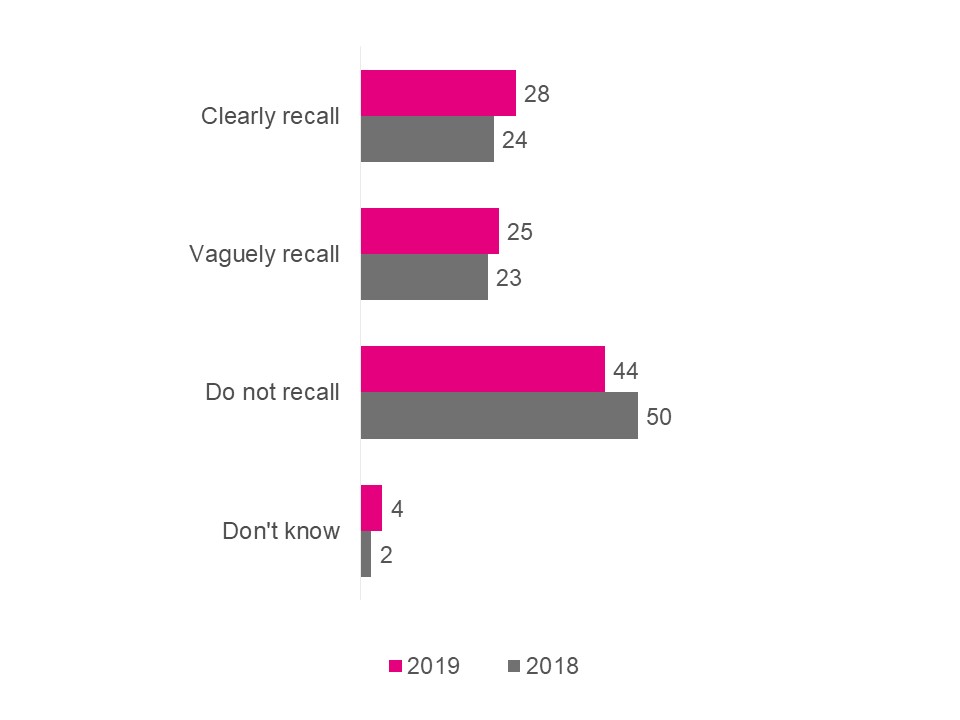
4.1. Recall of the Wireless Code
The Wireless Code came into effect in 2013 and was updated in 2017. As a result, the Wireless Code now ensures that customers will be provided with unlocked devices, gives families/share plans more control over data overages, sets minimum usage limits for the trial period that correspond to at least half of the monthly usage limits of the customer’s plan, and clarifies that data is a key contract term that cannot be changed during the commitment period without the customer’s consent.
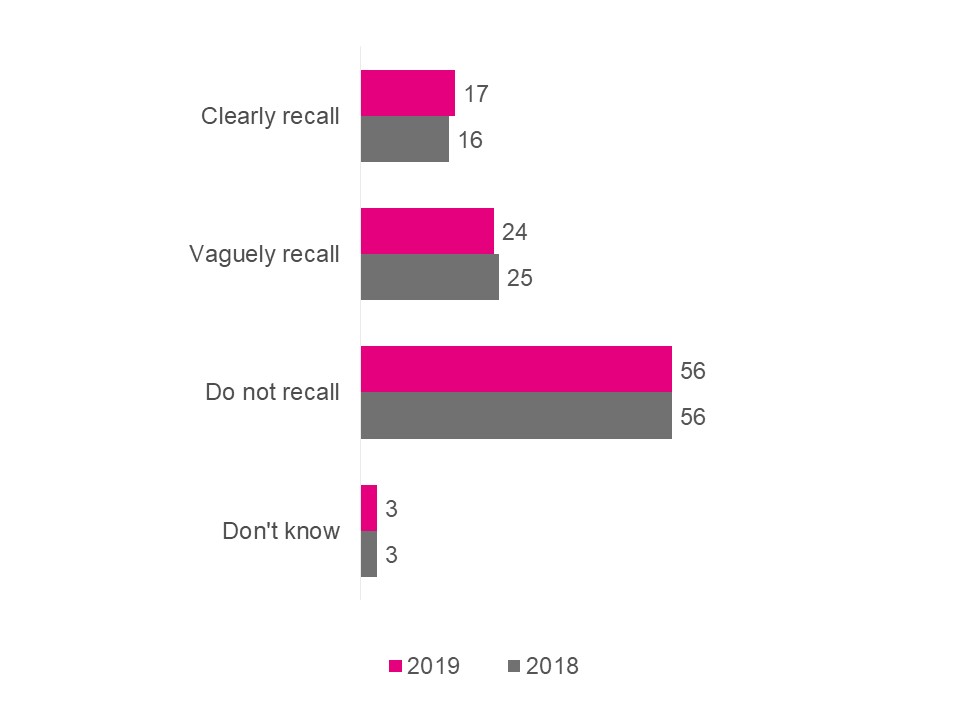
Compared to 2018, more Canadians are aware of the Wireless Code, with fewer saying they do not recall hearing anything about it (44% vs. 50% in 2018). There is higher awareness of the Wireless Code among men than women (clearly recall 32% vs. 24% respectively) and those with a higher education level (clearly recall 31-33% for College or University graduates vs. 16% for those with no tertiary education). Those with higher incomes ($100k+) are also more likely to recall the Wireless Code than those who make less than $100k (36-44% vs. 21-28%).
WC1. In 2013 a Wireless Code was created to make wireless contracts clearer, limit early cancellation fees, and to contribute to a more competitive wireless marketplace. In 2017, the Code was updated to end unlocking fees. To what extent, if any would you say you recall hearing or seeing anything about this Code? Would you say you clearly recall, vaguely recall or do not recall?
Base: Total respondents 2019 (n=1,524); 2018 (n=1,345)
4.1.b Recall of the Wireless Code by gender, education and income
Gender
Education
Income
Recall of the Wireless Code
Total
(A)
Men
(B)
Women
(C)
HS or less
(P)
College
(Q)
University or More
(R)
<$40K
(E)
$40K- <$60K
(F)
$60K- <$100K
(G)
$100K- <$150K
(H)
$150K+
(I)
Base = actual
(1524)
%
(822)
%
(702)
%
(392)
%
(392)
%
(710)
%
(309)
%
(204)
%
(339)
%
(228)
%
(221)
%
Do not recall
44
39
48B
58 QR
42
36
57 GHI
47 GHI
36
30
34
Clearly Recall
28
32 C
24
16
31 P
33 P
22
21
28
44 EFG
36 EF
Vaguely Recall
25
25
24
19
24
29 P
14
25 E
35 EF
26 E
27 E
Don’t know
4
4
4
7 R
4
2
7 GH
7 GH
*
1
3
QWC1. In 2013 a Wireless Code came into effect establishing guidelines for wireless service providers. The Code ensures that wireless consumers are empowered to make informed decisions and that there is a more competitive wireless marketplace. The Code was updated in 2017 to end unlocking fees and offer longer trial periods for new contracts. To what extent, if any would you say you recall hearing or seeing anything about this Code? Would you say you clearly recall, vaguely recall or do not recall?
Note: Letters denote statistically significant difference. For example, if there is a B then the result is significantly higher than the corresponding result in column B.
* Denotes less than 1%
4.2. Wireless Data Usage
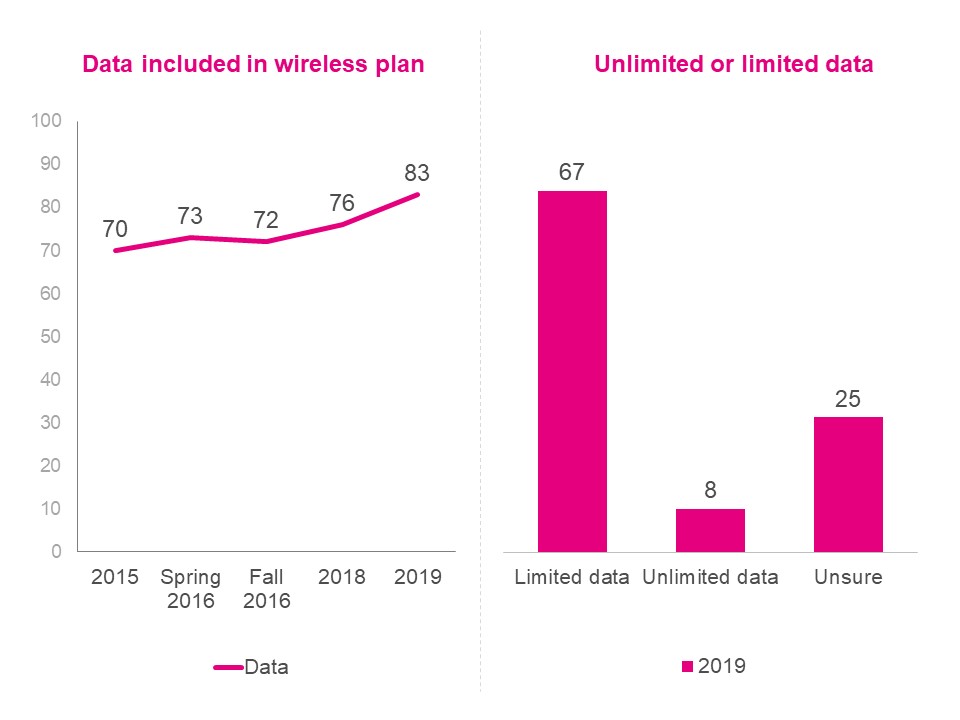
Wireless plans that include data continue to be increasingly common in Canada; over eighty per cent of Canadians have wireless plans that include data (83% compared to 76% in 2018). A quarter of Canadians (25%) are unsure if they have limited or unlimited data. Limited data plans are the most common type of plan (67%), with most limited data plans including 4-9 GB or 10-100GB (25% and 16% respectively). Few (8%) Canadians have unlimited data plans.
Exhibit 4.2.a. Data included in wireless plan over time and limited or unlimited plans
QB2a. Which of the following are included in your wireless plan?
Base: Respondents who own a cell phone, 2019 (n=1,322)
QB4. Does your plan include unlimited or limited data?
Base: Respondents who have data included in the wireless plan, 2019 (n=1,076)
A variety of demographic factors continue to influence whether or not Canadians have wireless plans that include data:
Age – Younger Canadians (18-54) continue to be more likely to have data included in their wireless plans than Canadians 55+ (88-91% vs. 74%). However, wireless plans with data are on the rise among older Canadians (60% in 2018 vs. 74% in 2019).
Education – those with higher levels of education are more likely to have data included in their wireless plan (87% college, 86% university vs. 73% high school).
Income – those with higher household incomes ($60K per year or more) are more likely to have data included in their wireless plans than those with lower household incomes (88-91% vs. 74-80%).
Region - those who live in the Prairies are more likely than those who live in the Atlantic, Ontario, or BC regions to have an unlimited data plan (14% vs. 3-6%). Those in Quebec are also more likely to have unlimited data plans (11%) than those who live in BC (3%), and, while not significant, more likely to have these plans than those in the Atlantic and Ontario regions (4-6%).
Exhibit 4.2.b. Data included in wireless plan by age and region
Data included in wireless plan
Total
(A)
Age
18-34
(D)
35-54
(E)
55+
(F)
Base=actual
(1322)
%
(219)
%
(428)
%
(654)
%
Yes
83
91 F
88 F
74
QB2a.Which of the following are included in your wireless plan?
Note: Letters denote statistically significant difference. For example, if there is a B then the result is significantly higher than the corresponding result in column B.
Exhibit 4.2.c. Data included in wireless plan by income and education
Data included in wireless plan
Total
(A)
Income
Education
<$40K
(E)
$40K- <$60K
(F)
$60K- <$100K
(G)
$100K- <$150K
(H)
$150K+
(I)
High school or less
(P)
College
(Q)
University or more
(R)
Base=actual
(1322)
%
(249)
%
(186)
%
(312)
%
(201)
%
(191)
%
(316)
%
(345)
%
(638)
%
Yes
83
74
80
88 EF
91 EF
89 EF
73
87 P
86 P
QB2a. Which of the following are included in your wireless plan?
Note: Letters denote statistically significant difference. For example, if there is a B then the result is significantly higher than the corresponding result in column B .
Exhibit 4.2.d. Type of data included in wireless plan by region
Data included in wireless plan
Total
(A)
Regions
Atlantic
(G)
Quebec
(H)
Ontario
(I)
Prairies
(J)
British Columbia
(K)
Territories
(O)
Base=actual
(1076)
%
(109)
%
(185)
%
(292)
%
(330)
%
(126)
%
(34)
%
Limited Data
67
71
68
66
61
73
79
Unlimited Data
8
4
11 K
6
14 GIK
3
-
Don’t know
25
25
20
27
25
24
21
QB4. Some wireless plans have unlimited data and some have limited data. When a plan includes a monthly data limit, you may have to pay data overage fees if you use more data in a month than is included in your plan.
Note: Letters denote statistically significant difference. For example, if there is a B then the result is significantly higher than the corresponding result in column B .
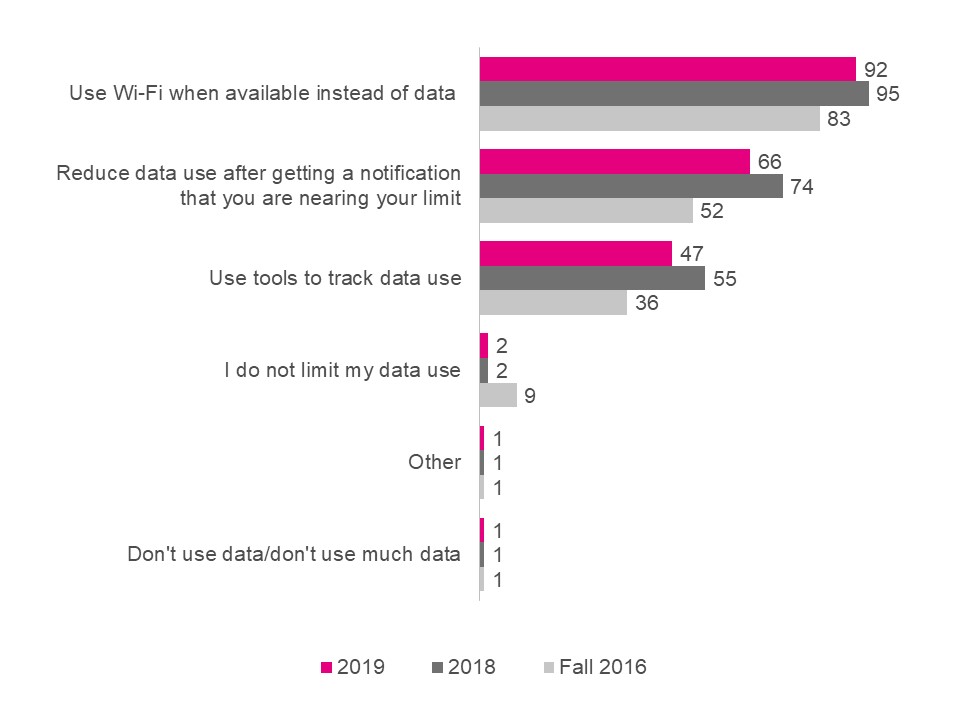
4.2.1. Activities to Manage or Limit Data Use
The vast majority of Canadians who have data in their wireless plans try to manage or limit their data use (97%). The primary method for doing this continues to be using Wi-Fi where available (92%). Compared to 2018, Canadians are less likely to state they reduce data use when notified (66% vs. 74%) or actively monitoring data usage (47% vs. 66%). This suggests Canadians increasingly rely on switching off their data usage, rather than actively reducing or tracking their usage.
As in 2018, younger Canadians (18-54) are more likely to employ activities to manage or limit data usage than their older counterparts (55+) (99-100% vs. 92%). This is also true for switching to Wi-Fi when available (94-97% for 18-54-year olds vs. 92% for 55+), reducing data usage when notified (70-74% for 18-54-year olds vs. 53% for 55+), and monitoring data usage with tools (47-56% for 18-54-year olds vs. 37% for 55+). This suggests older Canadians may be less aware of ways they can manage their data usage.
As expected, those who have experienced bill shock in the past are more likely to reduce data usage when notified (75% vs. 62%), suggesting that they may be depending on this strategy to avoid reoccurrence of bill shock.
Exhibit 4.2.1.a. Activities to manage or limit data use
QB5a. [ASK If do not answer “Unlimited or None” to B4] Which of the following activities, if any, do you use to manage or limit your data use? Select all that apply.
Base: Respondents who have data included in the wireless plan, 2019 (n=971), 2018 (n=651), fall 2016 (n=831)
Exhibit 4.2.1.b. Activities to manage to limit data use by age and past bill shock
Activities to manage to limit data use
Total
(A) )
Age
Bill Shock
18-34
(D)
35-54
(E)
55+
(F)
Yes
(P)
No
(Q)
Base=actual
(971)
%
(184)
%
(348)
%
(427)
%
(262)
%
(703)
%
ANY (NET)
97
100 F
99 F
92
99
96
Use Wi-Fi
92
97 F
94 F
86
93
92
Reduce your data use after you get a notification that you are nearing your limit
66
74 F
70 F
53
75 Q
62
Monitor data usage using phone/Application on phone
47
56 F
47 F
37
51
45
Turn off data when reached data limit
2
3
1
1
2
1
Monitor data usage/Review bill
3
4
3
2
4
3
Avoid activities that use large amounts of cellular data (e.g. streaming video, games, etc.)
2
3
3
1
3
2
I do not limit my data use
2
-
2
3 D
1
2
Notifications when reached/close to data limit
2
2
2
1
2
1
Don’t use cellular data at all
1
-
1
1
1
*
Use another device (e.g. computer) to access Internet
1
-
2
1
2
1
Purchase more data
*
-
1
*
*
*
Other
1
2
1
1
3
1
None
3
-
1
8 DE
1
4
QB5a. Which of the following activities, if any, do you use to manage or limit your data use? Select all that apply.
Note: Letters denote statistically significant difference. For example, if there is a B then the result is significantly higher than the corresponding result in column B .
* Denotes less than 1%
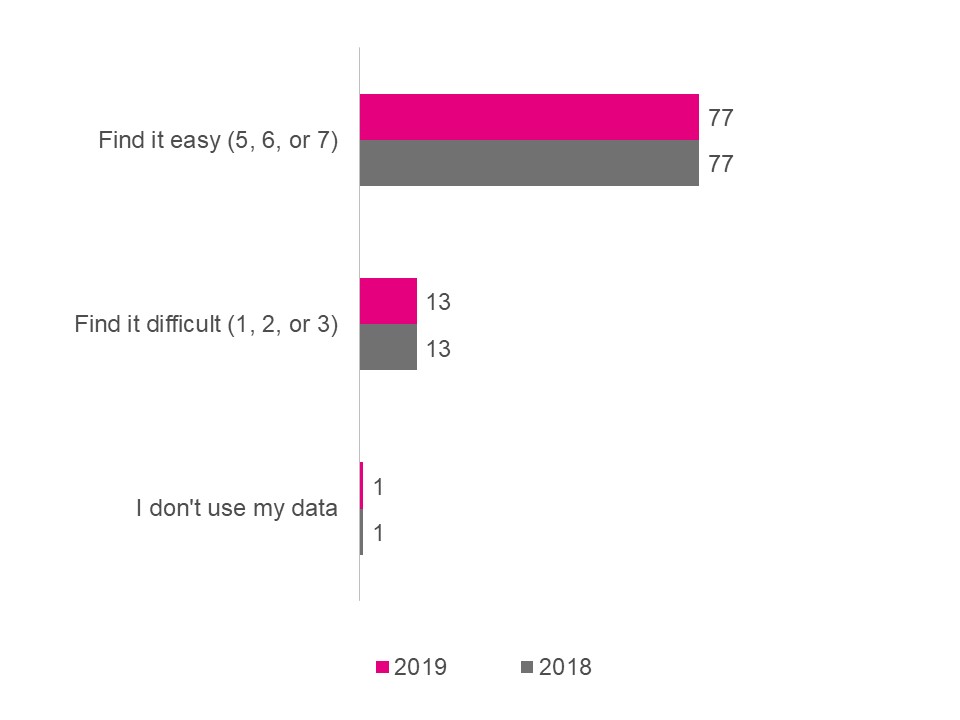
4.2.2. Ease of Managing Data Use
In-line with 2018, most Canadians continue to report they find it easy to manage their data each month. More than three-in-four Canadians (77%) consider it easy (5, 6 or 7 on a scale of 1-7).
Exhibit 4.2.2.a. Level of difficulty managing data use each month among those with data
WC6. [ASK If answered “Data” to B2a and not code 3 (NO DATA) at B4]
How easy do you find it to manage the data used by yourself and/or your family each month?
Please use a 7-point scale where 1 means extremely difficult and 7 means extremely easy.
Base: Total respondents who have data included in their plan, 2019 (n=1,069), 2018 (n=792)
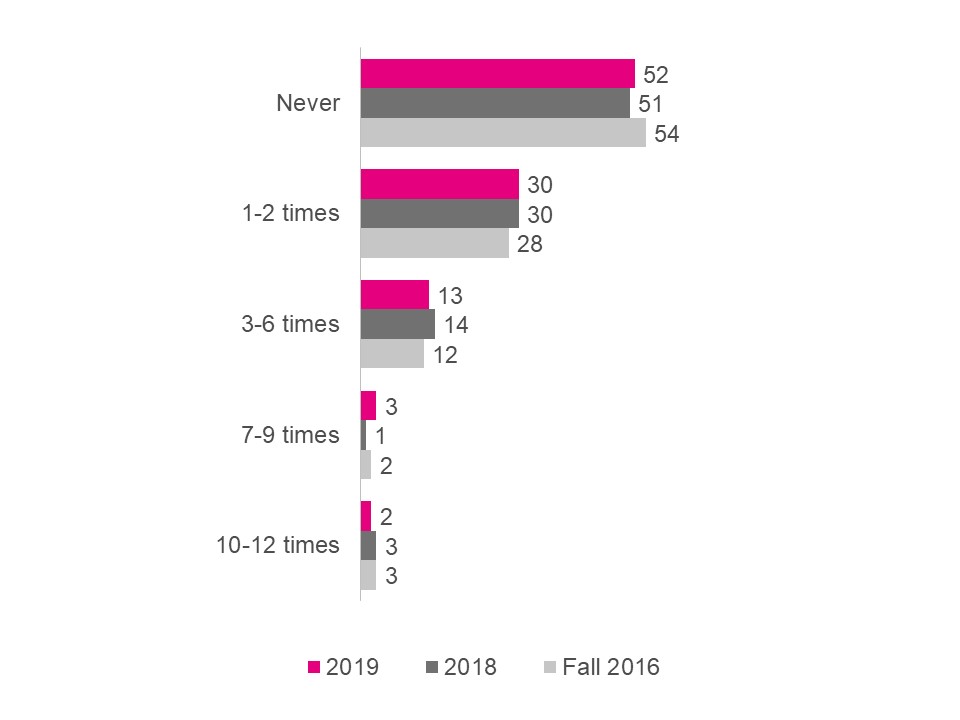
4.2.3. Data Overage Fees
While the majority of Canadians consider it easy to manage their data, close to half (48%) continue to have paid data overages in the past 12 months, in-line with overages in 2018 and Fall 2016 (46-49%). Furthermore, those who have experienced bill shock are significantly more likely to have paid data overage fees (89% vs 36%) suggesting that some Canadians are, experiencing difficulty managing their data in a way that prevents additional fees, and that this has not improved with time. Others however, may be choosing to pay additional data fees as and when needed to reduce overall costs. Most of those (62%) that have paid data overages have done so only once or twice in the past 12 months.
Unlike in 2018, demographics play little role in data overage fees, with the exception of older Canadians (55+) who are less likely to have paid data overages in the past year than younger Canadians (42% vs. 51-52%). This is likely a function of lower data usage by older Canadians rather than better management.
As in 2018, those who find data management difficult are more likely to have paid data overage fees in the past 12 months (74% vs. 41%).
Exhibit 4.2.3.a. Data overage fees paid in the past 12 months
QB8. In the past 12 months, how often have you paid data overage fees?
Base: Respondents who have data included in their plan, 2019 (n=1,069), 2018 (n=796), fall 2016 (n=831)
Exhibit 4.2.3.b. Data overage fees paid in the past 12 months by plan and data
Data overage fees paid in the past 12 months
Total
(A)
Age
Manage data
18-34
(D)
35-54
(E)
55+
(F)
Easy
(G)
Difficult
(H)
Base=actual
(1069)
%
(200)
%
(375)
%
(481)
%
(821)
%
(132)
%
Never
52
49
48
58 E
59 H
26
1-2 times
30
29
32
28
28
35
3-6 times
13
12
16 F
10
10
25 G
7-9 times
3
4
1
3
1
8 G
10-12 times
2
2
2
1
2
1
Don’t know
2
4 E
*
1
1
5 G
QB8. In the past 12 months, how often have you paid data overage fees?
Note: Letters denote statistically significant difference. For example, if there is a B then the result is significantly higher than the corresponding result in column B.
* Denotes less than 1%
4.3. Bill Shock and Roaming Fees
4.3.1. Bill Shock
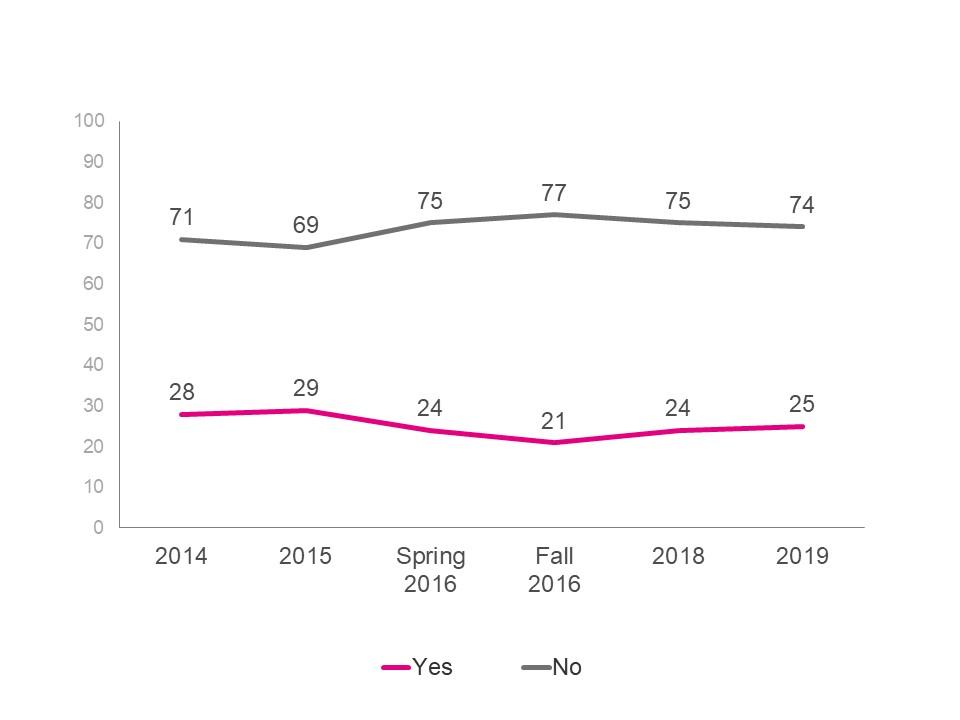
Incidence
The overall incidence of bill shock continues to be low, with a small but significant portion of the population continuing to experience it in 2019 (25%). This suggests that despite changes to the code in 2017, Canadians continue to experience levels of bill shock on par with that of 2016.
QB10/B6. During the last year, have you experienced ‘bill shock’, meaning a surprisingly high bill?
Base: Respondents who own a cell phone, 2019 (n=1,322), 2018 (n=1,111), fall 2016 (n=1,277), total respondents winter 2016 (n=925), 2015 (n=1,005), 2014 (n=1,016)
Younger Canadians (18-54) continue to be more likely to experience bill shock than their older counterparts (26-30% vs. 20%). Not unexpectedly, bill shock is higher among and those who find data management difficult (54% vs. 21%).
Plan type also appears to play a role in bill shock, as those on family plans are more likely to experience bill shock compared to those on individual plans (31% vs. 23%), as are those with tab contracts (30% on tab contract vs. 22% not on tab contract). Interestingly, although few Canadians have unlimited data plans, twenty per cent of those with unlimited data also report experiencing bill shock, signaling that the importance of addressing bill shock in all areas: data, minutes and texting.
Exhibit 4.3.1.b. Experienced bill shock by tab contract, age and plan
Experienced Bill Shock
Total
(A)
Tab Contract
Age
Plan
Yes
(B)
No
(C)
18-34
(D)
35-54
(E)
55+
(F)
Family
(J)
Individual
(K)
Base = actual
(1322)
%
(299)
%
(541)
%
(219)
%
(428)
%
(654)
%
(447)
%
(854)
%
Yes
25
30 C
22
30 F
26 F
20
31 K
23
No
74
70
77
69
74
79 D
67
77 J
Don’t Know
1
*
1
2
*
1
2K
*
QB10. During the last year, have you experienced ‘bill shock’, meaning a surprisingly high bill?
Note: Letters denote statistically significant difference. For example, if there is a B then the result is significantly higher than the corresponding result in column B.
*Denotes less than 1%
Exhibit 4.3.1.c. Experienced bill shock by data and data management
Experienced Bill Shock
Total
(A)
Data
Data Management
Unlimited
(D)
Limited
(E)
Easy
(F)
Difficult
(G)
Base = actual
(1322)
%
(98)
%
(679)
%
(821)
%
(132)
%
Yes
25
20
28
21
54F
No
74
80
71
79G
46
Don’t Know
1
-
*
1
-
QB10. During the last year, have you experienced ‘bill shock’, meaning a surprisingly high bill?
Note: Letters denote statistically significant difference. For example, if there is a B then the result is significantly higher than the corresponding result in column B.
*Denotes less than 1%
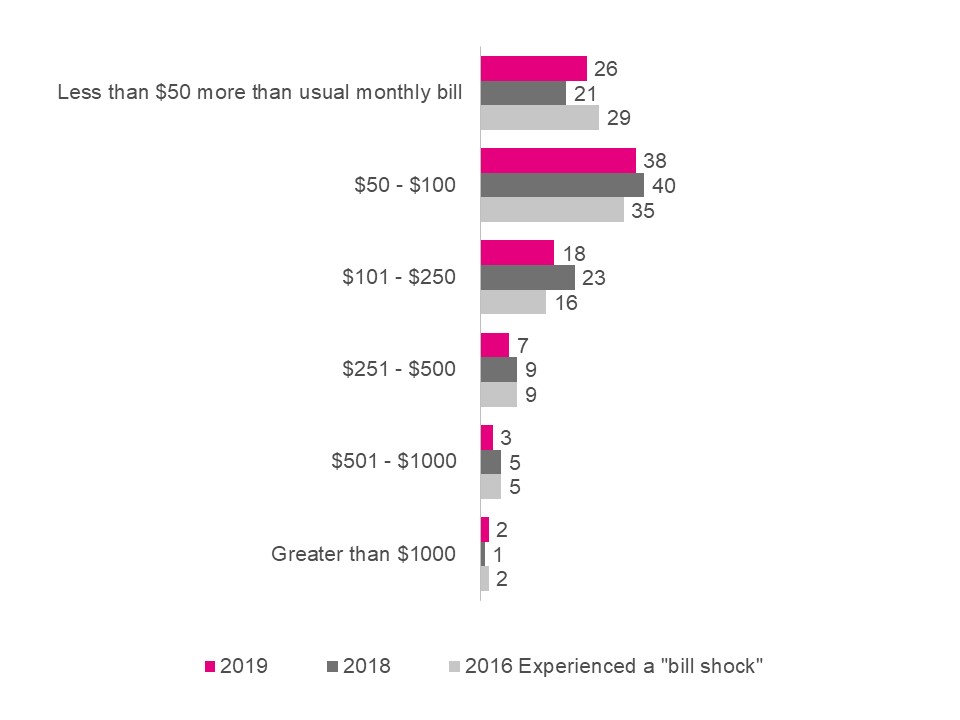
Amount
The wireless code mandates that providers must suspend data overage charges once they exceed $50 unless an authorized user consents to paying additional fees. Despite this, Canadians continue to experience a range of unexpected charges, varying from less than $50 to over $1,000 per billing cycle. As in 2016 and 2018, most of the unexpected charges continue to be less than $50 (26%) or between $50-$100 (38%). While not significant, we are starting to see the amount of the unexpected charge is beginning to decline over time.
Exhibit 4.3.1.d. Amount of unexpected charges on bill among those who have experienced a “bill shock”
Q10b. What was the amount of the unexpected charges on your bill?
Base: Respondents who have experienced a “bill shock”, 2019 (n=320), 2018 (n=211); Fall 2016 (n=285)
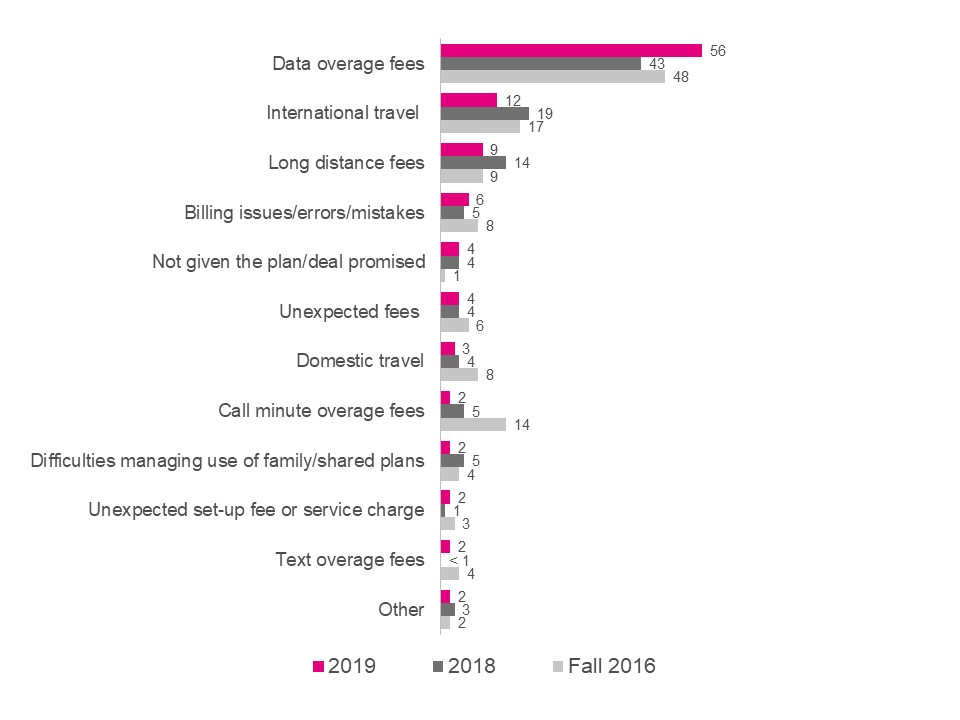
Reason
As in 2018, data overage fees are the main reason for bill shock and appears to be on the rise over the past year (56% in 2019 vs. 43% in 2018). Data overage fees are higher among younger Canadians (18-54) (60-64%) than older Canadians (55+) (45%), and not unexpectedly, those who report difficulty managing data (75% vs. 51% who find it easy).
Bill shock caused by long-distance fees, minute overage fees and international roaming fees has declined in 2019 (9%;2%; 12% respectively, vs. 14%; 5%; 19% in 2018).
QB10/B6. During the last year, have you experienced ‘bill shock’, meaning a surprisingly high bill?
Base: Respondents who own a cell phone, 2019 (n=1,322), 2018 (n=1,111), Fall 2016 (n=1,277)
Exhibit 4.3.1.f. Main reason for bill shock by age and data management
Main reason for bill shock
Total
(A)
Age
Data Manage
18-34
(D)
35-54
(E)
55+
(F)
Easy
(G)
Difficult
(H)
Base = actual
(320)
%
(68)
%
(111)
%
(135)
%
(166)
%
(72)
%
Data overage fees
56
64 F
60 F
45
51
75 F
International travel – roaming fees
12
10
15
12
13
14
Long distance fees
9
12
8
7
8
7
Billing issues/errors/mistakes
6
5
7
8
4
5
Unexpected fees (Network access fee/911, etc.)
4
7
1
3
6
1
I was not given the plan/deal I was promised
4
-
5
6
2
6
Domestic travel – roaming fees
3
3
2
2
3
2
Family/shared plans – difficulties managing use
2
2
-
4
2
2
Call minute overage fees
2
-
2
6
4
-
Text overage fees
2
2
2
1
3
1
Unexpected set-up fee or service charge
2
4
-
1
2
-
Other (Specify)
2
2
4
2
4
1
Don’t know
5
1
4
11 D
5
2
QB10a. [If answered “Yes” to B10]What was the main reason for the ‘bill shock you experienced?
Note: Letters denote statistically significant difference. For example, if there is a B then the result is significantly higher than the corresponding result in column B.
4.3.2. Roaming Fees
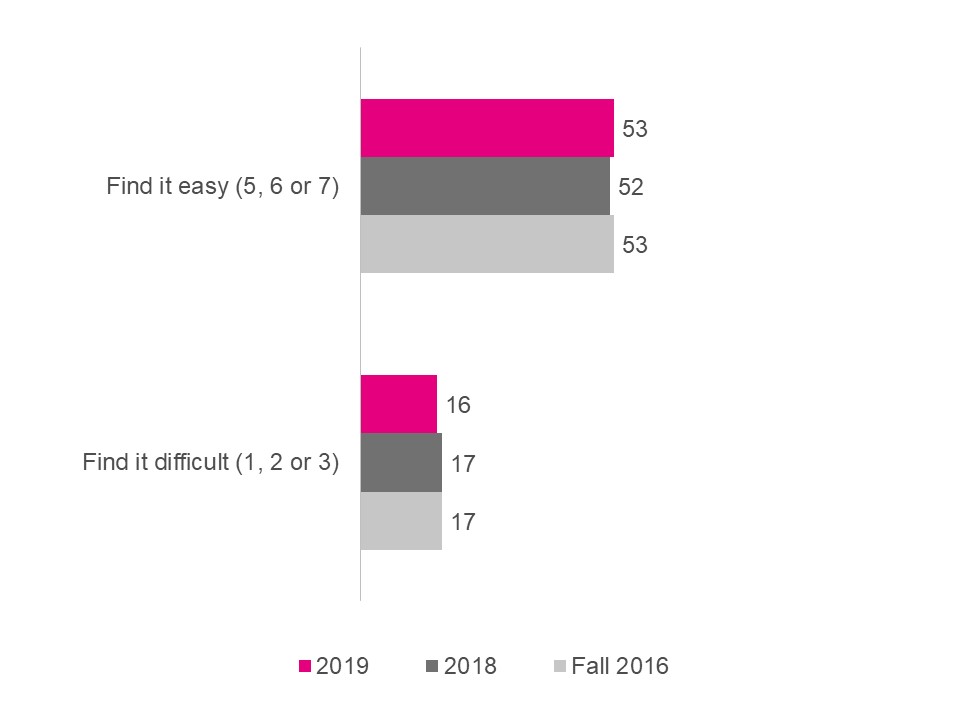
Most Canadians feel they are able to manage their roaming charges while travelling and little had changed since 2016. More than half of Canadians (53%) continue to find it easy to manage roaming charges (5, 6 or 7 on a scale of 1-7) while 16 per cent Canadians find it difficult (1, 2 or 3 on a scale of 1-7) to manage roaming fees.
Exhibit 4.3.2.a. Level of difficulty managing roaming charges when travelling
QB9. If you use your plan while traveling, you may be charged roaming fees. How easy do you find it to manage your roaming charges when you are traveling? Please use a 7-point scale where 1 means extremely difficult and 7 means extremely easy.
Base: Respondents who own a cell phone, 2019 (n=1,322), 2018 (n=1,111); fall 2016 (n=1,277)
Unsurprisingly, those who have made a complaint (31%) are more likely to find it difficult to manage roaming charges than those who have not (12%), as are those who have experienced bill shock compared to those who have not (33% vs. 11%).
Exhibit 4.3.2.b. Level of difficulty managing roaming charges by bill shock and complaint
Level of difficulty managing
roaming charges when travelling
Total
(A)
Bill Shock
Complaints
Yes
(P)
No
(Q)
Made one
(S)
Did not make one
(T)
Base = actual
(1322)
%
(320)
%
(990)
%
(255)
%
(1062)
%
Find it easy (5,6,7)
53
36
58 P
43
55 S
Find it difficult (1, 2, 3)
16
33 Q
11
31 T
12
QB9. If you use your plan while traveling, you may be charged roaming fees. How easy do you find it to manage your roaming charges when you are traveling?
Note: Letters denote statistically significant difference. For example, if there is a B then the result is significantly higher than the corresponding result in column B.
4.4. Understanding of Contracts
4.4.1. Understanding of Contract
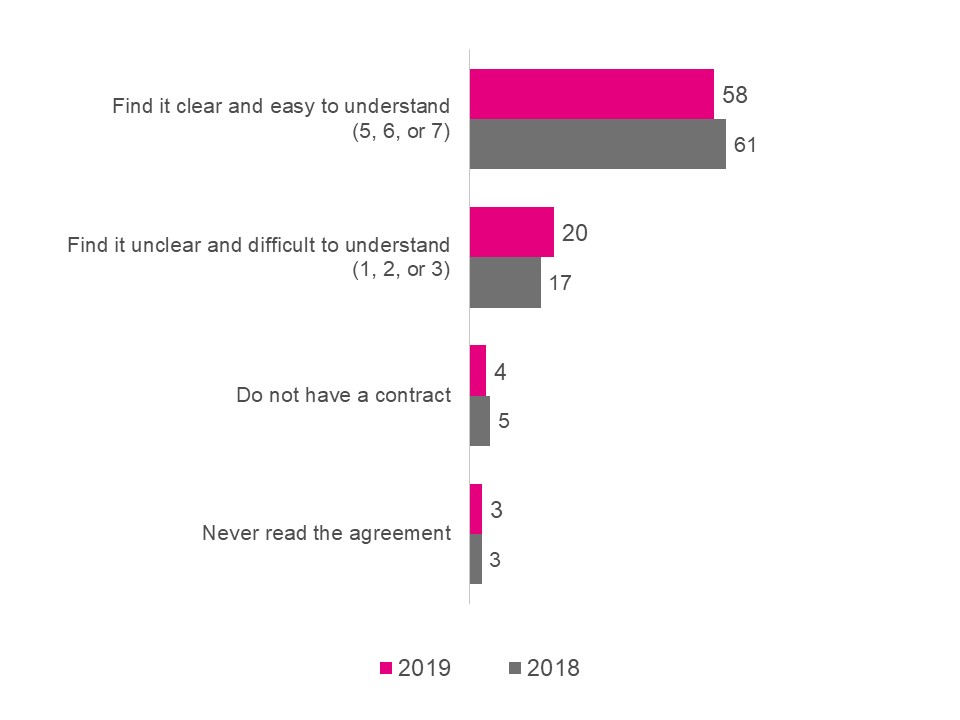
Little has changed compared to 2018 regarding Canadians’ understanding of their wireless contracts, with the majority (61%) continuing to find their wireless contract clear and easy to understand (5, 6 or 7 on a scale of 1-7). This is especially true for those aged 18-34 when compared to those aged 35+ (67% vs. 54-56%).
Not unexpectedly, those who have experienced bill shock are much more likely to state they find their contract hard to understand (1,2 or 3 on a scale of 1-7), which may signal continued confusion among those with past negative billing experiences (40% vs. 14%) or that finding their contract confusing is a precursor to bill shock.
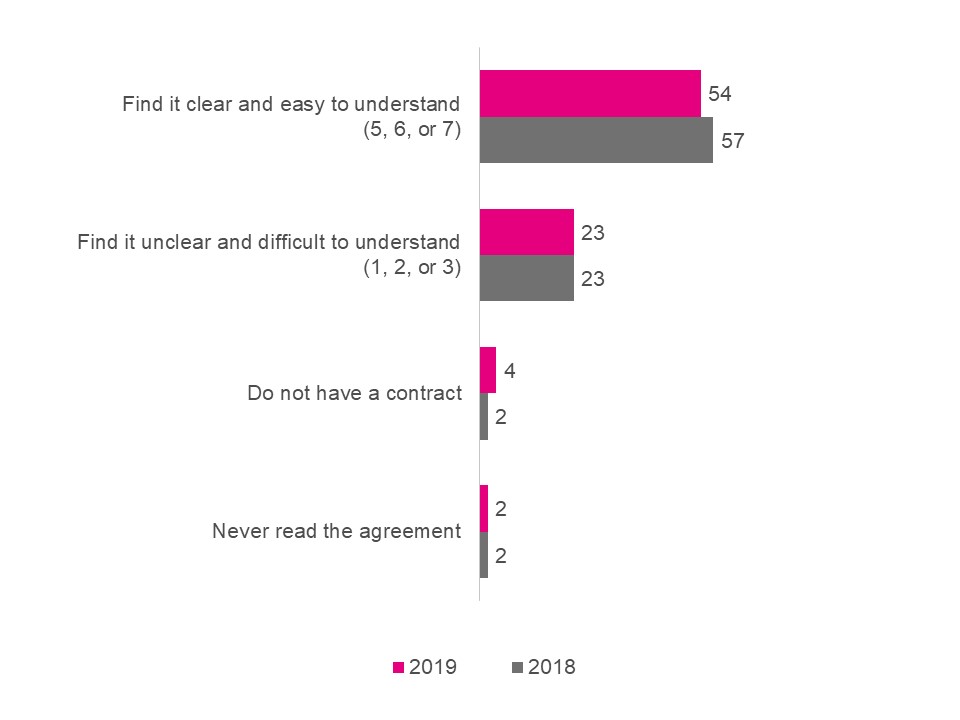
Exhibit 4.4.1.a. Level of ease of understanding wireless contract
WC10. Do you find your contract clear and easy to understand? Please use a 7-point scale where 1 means extremely unclear and difficult to understand and 7 means extremely clear and easy to understand.
Base: Total respondents who own a cell phone, 2019 (n=1,322), 2018 (n=1,111)
Exhibit 4.4.1.b. Level of ease of understanding wireless contract by age and bill shock
Level of ease of understanding wireless contract
Total
(A)
Age
Bill Shock
18-34
(D)
35-54
(E)
55+
(F)
Yes
(P)
No
(Q)
Base=actual
(1322)
%
(219)
%
(428)
%
(654)
%
(320)
%
(990)
%
Find it easy (5, 6 or 7)
58
67 EF
56
54
45
63 P
Find it difficult (1, 2 or 3)
20
15
22
22 D
40 Q
14
WC10. Do you find your contract clear and easy to understand? Please use a 7-point scale where 1 means extremely unclear and difficult to understand and 7 means extremely clear and easy to understand.
Note: Letters denote statistically significant difference. For example, if there is a B then the result is significantly higher than the corresponding result in column B
4.4.2. Trial Period
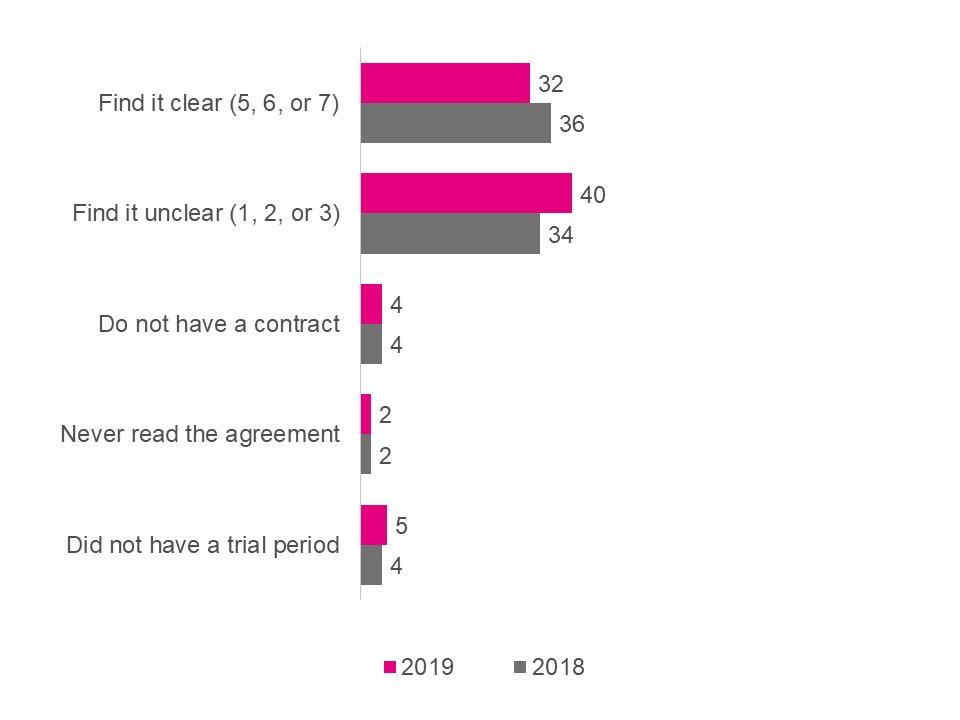
Since 2013, the Wireless Code has required service providers to include a trial period for new contracts that includes an early cancellation fee. During the trial period, wireless contract holders can cancel their contract without penalty. This trial period must be a minimum of 15 days service and as of December 1st, 2017, it must permit the customer to use up to half the voice, text, and data usage amounts included in their monthly plan.
As in 2018, Canadians were asked how clear their explanation of the trial period was when they took out their wireless contract. Compared to the previous year, Canadians are more likely to believe the explanation of their trial period was unclear (40% vs. 34%; 1, 2 or 3 on a scale of 1-7). A minority continue to have not read the contract (2%) or state they do not have a contract (4%) or trial period (5%).
Exhibit 4.4.2.a. Ease of understanding explanation of the trial period
WC8. The Code requires service providers to include a trial period for new contracts that include a device. During the trial period, you can cancel your contract without penalty. This trial period now has to be half of a month of service and include half the service included in your monthly plan.
How clearly did your service provider explain the trial period to you?
Please use a 7-point scale where 1 means extremely unclear and 7 means extremely clear.
Base: Total respondents who own a cell phone, 2019 (n=1,322), 2018 (n=1,111)
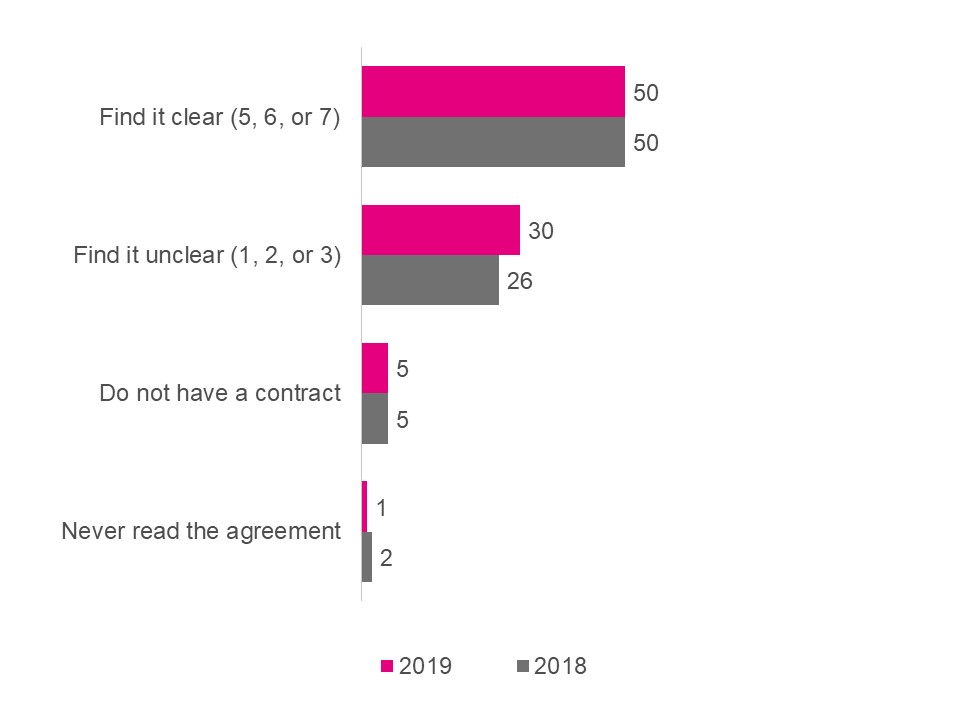
4.4.3. Cancellation Fees
Most service providers require customers to pay a cancellation fee if they cancel their contracts before the agreed upon end date. This needs to be carefully explained to the consumer for them to be fully aware of the implications of early cancellation. Consistent with 2018, half (50%) of Canadians who have wireless plans find the explanation to be clear, while there is an increase in the number who find it to be unclear (30% in 2019 vs. 26% in 2018; rated 1, 2 or 3 on a scale from 1-7). This signals a need for service providers to provide greater clarity around cancellation fees, or that current contracts may be difficult for the average consumer to understand.
Exhibit 4.4.3.a. Clear explanation of early cancellation of contract
WC9. When you signed your contract or accepted your service agreement, how clearly did your service provider explain any fees that would apply if you cancel your contract or agreement early? Please use a 7-point scale where 1 means extremely unclear and 7 means extremely clear.
Base: Total respondents who own a cell phone, 2019 (n=1,322), 2018 (n=1,111)
4.5. Change
4.5.1. Changes to Contract
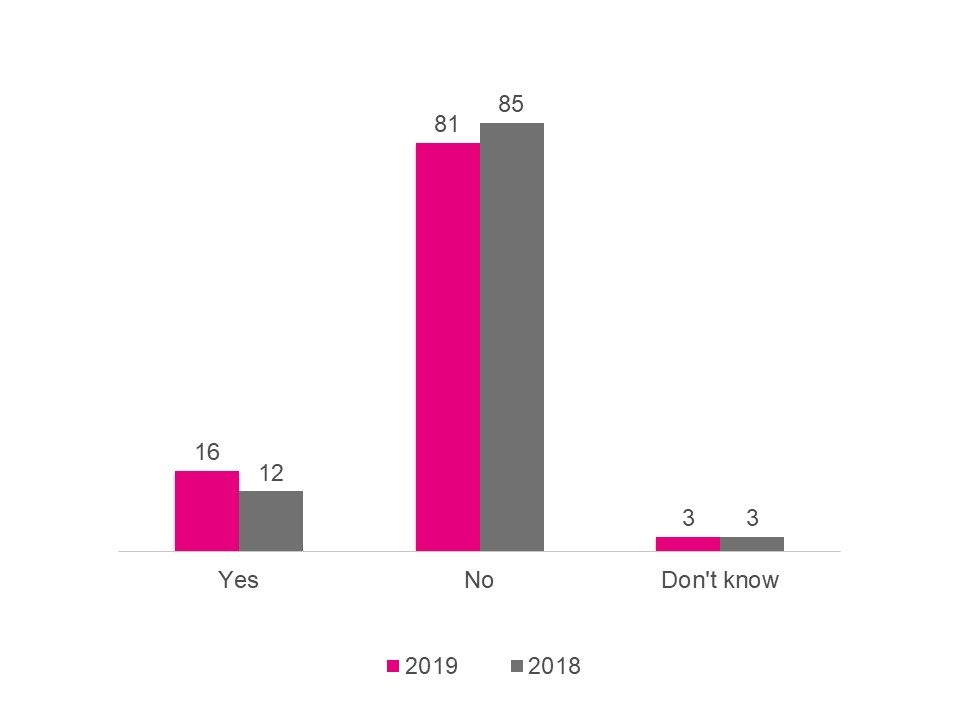
A small but significant portion of Canadians state that changes to wireless services were made without expressly making the consumer aware of the new terms and conditions (16%), an increase of four percent from 2018 (12%). As in 2018, changes to wireless services without expressly making the consumer aware of the new terms and conditions is reported more often by those who have made a complaint in the last 12 months (31% vs. 12%) as well as by those who report bill shock (32% vs. 11%), which suggests both may be a product of an underlying factor, such as unexpected service changes or an unclear contract.
Exhibit 4.5.1.a. Changes to contract without disclosure of changes in terms and conditions
WC11. Have you ever become aware that your service provider changed your plan without expressly making you aware of how the terms and conditions had changed?
Base: Total respondents who own a cell phone, 2019 (n=1,322), 2018 (n=1,111)
Exhibit 4.5.1.b. Changes to contract without disclosure of changes in terms and conditions by complaint and bill shock
Changes to contract without disclosure of changes in terms and conditions
Total
(A)
Lodged Complaint
Bill Shock
Yes
(S)
No
(T)
Yes
(P)
No
(Q)
Base=actual
(1322)
%
(255)
%
(1062)
%
(320)
%
(990)
%
Yes
16
31 T
12
32 Q
11
No
81
64
86 S
64
87 P
Don’t know
3
5
2
4
2
WC11. Have you ever become aware that your service provider changed your plan without expressly making you aware of how the terms and conditions had changed?
Note: Letters denote statistically significant difference. For example, if there is a B then the result is significantly higher than the corresponding result in column B.
4.5.2. Service Provider Changes
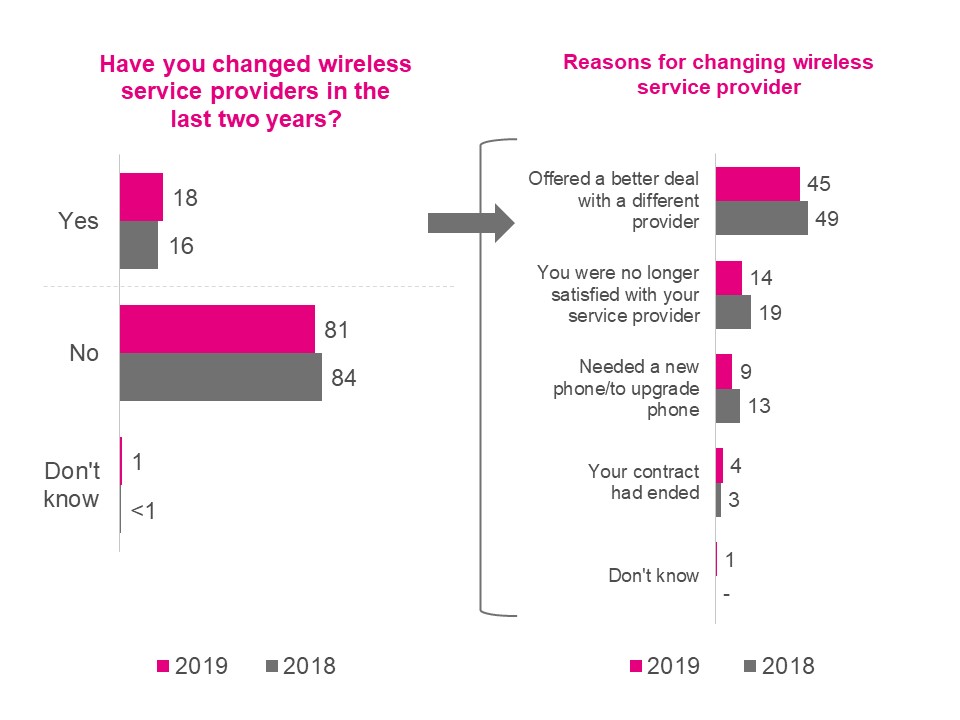
Few Canadians report having changed their service provider in the past two years (18%). This remains consistent with the previous year’s results.
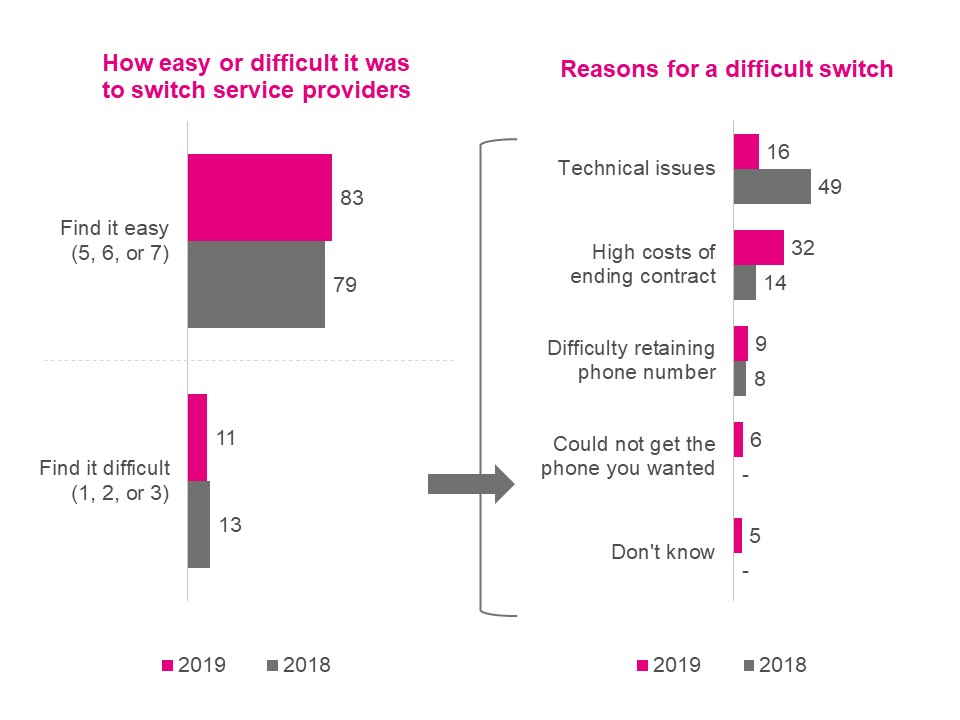
Among those that have changed their provider, most cite finding a better deal (45%), and a small proportion state lack of satisfaction with service provider (14%) or needing a new or upgraded phone (9%) as reasons. Most also state that they were easily able to navigate this process, with over four-fifths (83%) saying it was easy to switch providers (5, 6 or 7 on a scale of 1-7).
Exhibit 4.5.2.a. Switching wireless service providers and reasons for it
WC16. Have you changed wireless service providers in the last two years?
Base: Total respondents who own a cell phone, 2019 (n=1,322), 2018 (n=1,111)
WC12. [If answered “Yes” to WC16] Why did you change service provider?
Base: Total respondents who changed their service provider in P2Y, 2019 (n=231), 2018 (n=152)
Among the eleven per cent of Canadians who found the process difficult (rated 1, 2 or 3 on a scale from 1-7), most state that the high costs of ending their contract (32%) or technical issues (16%) were the reasons for difficulties. While technical issues are stated as reasons less often in 2019 compared to 2018 (16% vs. 49%), while high costs are stated more often (32% vs. 14%), these results should be interpreted with caution due to a small sample size.
Exhibit 4.5.2.b. Switching wireless service providers and reasons for it
WC13. [If answered “Yes” to WC16] How easy or difficult was it to switch service providers? Please use a 7-point scale where 1 means extremely difficult and 7 means extremely easy.
Base: Total respondents who changed their service provider in P2Y, 2019 (n=231), 2018 (n=152)
WC14. [If answered 1,2 OR 3 at WC13] Was there a reason why switching providers was difficult for you?
Base: Total respondents who find it difficult to switch, 2019 (n=24), 2018 (n=19)
4.6. Complaints
4.6.1. Complaints in the Last 12 Months
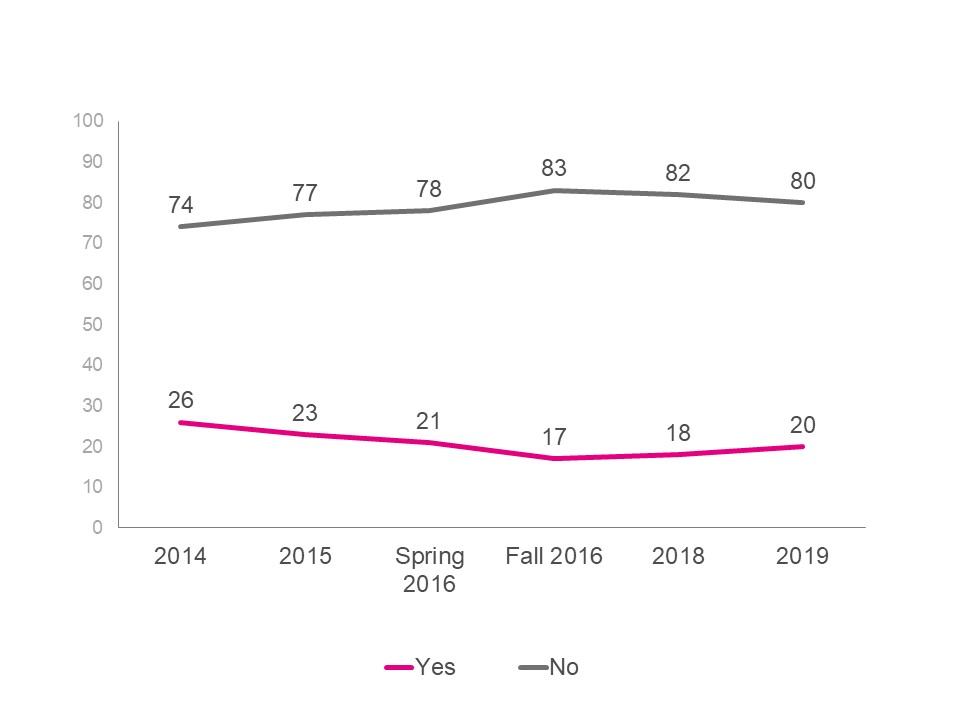
Incidence
The incidence of Canadians who have made complaints about their wireless service has remained stable, increasing slightly but not significantly compared to 2018 (20% vs. 18%) and continuing to remain lower than in 2014 (26%).
Exhibit 4.6.1.a. Wireless service complaint made in the past 12 months
QB11a/QB11/QB4 Have you made a complaint about your wireless services in the past 12 months?
Base: Respondents who own a cell phone, 2019 (1,322), 2018 (n=1,111), Fall 2016 (n=1,277), W inter 2016 (n=925), 2015 (n=1,005), 2014 (n=1,016)
As found in 2018, Quebecers are least likely to make complaints compared to those in other regions of Canada (11% vs. 19-30%). This is likely due to the provincial consumer protection legislation that Quebec has had in place since 2009 - Quebec’s Bill 60. Younger Canadians (18-54) are also more likely to have made a complaint than those 55+ (22-23% vs. 16%).
Not unexpectedly, those who find managing data difficult are still more likely to have made a complaint over the past year (52% vs. 15%).
Exhibit 4.6.1.b. Wireless service complaint made in the past 12 months by age and region
Wireless Service Complaint Made
Total
(A)
Age
Region
18-34
(D)
35-54
(E)
55+
(F)
Atlantic
(G)
Quebec
(H)
Ontario
(I)
Prairies
(J)
B.C.
(K)
Territories
(O)
Base = actual
1322
(%)
219
(%)
428
(%)
654
(%)
129
(%)
250
(%)
350
(%)
389
(%)
153
(%)
51
(%)
Yes
20
23 F
22 F
16
20 H
11
23 H
19 H
30 HJ
14
No
80
76
78
84 DE
80
89 GIJK
76
81 K
69
86
Don’t know
1
1
1
*
-
-
1
*
1
-
QB11a. Have you made a complaint about your wireless services in the past 12 months?
Note: Letters denote statistically significant difference. For example, if there is a B then the result is significantly higher than the corresponding result in column B.
*Denotes less than 1%
Exhibit 4.6.1.c. Wireless service complaint made in the past 12 months by data management
Wireless Service Complaint Made
Total
(A)
Manage Data
Easy
(F)
Difficult
(G)
Base = actual
1322
(%)
821
(%)
132
(%)
Yes
20
15
52 F
No
80
85 G
48
Don’t know
1
*
-
QB11a. Have you made a complaint about your wireless services in the past 12 months?
Note: Letters denote statistically significant difference. For example, if there is a B then the result is significantly higher than the corresponding result in column B.
*Denotes less than 1%
Reasons
The top reasons behind complaints have remained consistent with those stated in 2018, including:
Data charges (27%)
Incorrect charges on bill (26%)
Inadequate quality of service (17%)
Roaming charges (11%)
Misleading information about the terms of contract (8%)
High prices (8%)
Compared to 2018, Canadians in 2019 are more likely to cite incorrect charges on their bill (26% vs. 17%) or problems with their phone/device (6% vs. 1%) as reasons for their complaint.
B11b. [ASK If answered “Yes” to B11a] What was your complaint about?
Base: Total respondents who made a complaint about the wireless services in the P12M, 2019 (n=255), 2018 (n=183)
Complaint Issued to Service Provider
Consistent with previous findings, more than nine-in-ten Canadians who make a complaint make the complaint to their service provider (95%). Few complaints are escalated to the Commission for Complaints for Telecom-Television Services (CCTS) (3%), which is mandated to review complaints from customers who are unsatisfied with how their complaint was addressed by their service provider.
Exhibit 4.6.1.e. Complaints to wireless service provider
WC7. [ASK If answered “Yes” to B11a] Who did you complain to? Was it your service provider, the Commission for Complaints for Telecom-Television Services, also knowns as the CCTS, or both?
Base: Total respondents who made a complaint about the wireless services in the P12M, 2019 (n=255), 2018 (n=183)
4.7. Canadian’s Wireless Plans
4.7.1. Type of Plan
The majority of Canadians continue to purchase post-paid services in 2019 (90%). Significantly fewer report purchasing pre-paid services in 2019 (8%) compared to 2018 (12%), a decline that has continued steadily since Fall 2016 (16%).
QB1c. And is it a monthly plan, or a prepaid or pay-as-you-go plan?
Base: Total respondents who own a cell phone, 2019 (n=1,322), 2018 (n=1,111), fall 2016 (n=1,277), total respondents winter 2016 (n=925), 2015 (n=1,005)
While the majority of Canadians use an individual plan (67%), family plans continue to see increased use over 2015 (32% vs. 25%).
Demographics tend to play a role in the type of plan that Canadians choose. More specifically, Quebecers are much more likely than those in other regions to use an individual plan (80% vs. 48-65%) and younger Canadians (18-34) are more likely to have an individual plan compared to their older counterparts (32-36%).
Exhibit 4.7.1.c. Individual or family/shared plan by age and region
Individual or family/shared plan
Total
(A)
Age
Region
18-34
(D)
35-54
(E)
55+
(F)
Atlantic
(G)
Quebec
(H)
Ontario
(I)
Prairies
(J)
B.C.
(K)
Territories
(O)
Base=actual
(1322)
%
(219)
%
(428)
%
(654)
%
(129)
%
(250)
%
(350)
%
(389)
%
(153)
%
(51)
%
Individual plan
67
74E
62
66
56
80 GIJKO
65
63
64
48
Family / shared plan
32
26
36D
32
44 HI
19
33 H
36 H
35 H
47 H
Other
*
-
*
-
-
-
*
-
-
-
Don’t know
1
*
1
1
-
*
1
1
1
3
QB1a. Is it an individual plan or a family or shared plan?
Note: Letters denote statistically significant difference. For example, if there is a B then the result is significantly higher than the corresponding result in column B.
* Denotes less than 1%.
Promotion through Employer or Association
Only a small number of Canadians have a wireless plan that is part of a promotion through their employer or an association they belong to. Those aged 35-54 are more likely to have a promotion through an employer or association compared to older (55+) or younger (18-34) Canadians (10% vs. 4-5%) which is likely due to more Canadians in this age group being in the workforce and thus having access to an employee purchase plan. Men are more likely than women to have these types of plans (8% vs. 5%), as are those with incomes above $60k compared to those making less than $60k (9-10% vs. 3%).
Exhibit 4.7.1.d. Promotion through employer or association
QB1d. Is your plan part of a promotion through your employer or an association you belong to, sometimes also called an employee purchase plan?
Base: Respondents who own a cell phone, 2019 (n=1,322), 2018 (n=1,111), fall 2016 (n=1,277)
QB9d. And finally, is your plan part of a promotion through your employer or an association you belong to, sometimes also called an employee purchase plan?
Base: Total Respondents winter 2016 (n=925), 2015 (n=1,005)
Exhibit 4.7.1.e. Promotion through employer or association by gender and age
Promotion through employer or association
Total
(A)
Gender
Age
Male
(B)
Female
(C)
18-34
(D)
35-54
(E)
55+
(F)
Base=actual
(1322)
%
(708)
%
(614)
%
(219)
%
(428)
%
(654)
%
Yes
6
8 C
5
5
10 F
4
No
93
92
94
93
90
95 E
Don’t know
1
*
1
2
-
1
QB1d. Is your plan part of a promotion through your employer or an association you belong to, sometimes also called an employee purchase plan?
Note: Letters denote statistically significant difference. For example, if there is a B then the result is significantly higher than the corresponding result in column B.
* Denotes less than 1%.
Exhibit 4.7.1.f. Promotion through employer or association by income
Promotion through employer or association
Total
(A)
Income
Under $40K
(E)
$40K to under $60K
(F)
$60K to under $100K
(G)
$100K to under $150K
(H)
$150K +
(I)
Base=actual
(1322)
%
(249)
%
(186)
%
(312)
%
(201)
%
(191)
%
Yes
6
3
3
9 EF
10 EF
10 EF
No
93
96 GHI
95
91
90
90
Don’t know
1
1
3
-
-
-
QB1d. Is your plan part of a promotion through your employer or an association you belong to, sometimes also called an employee purchase plan?
Note: Letters denote statistically significant difference. For example, if there is a B then the result is significantly higher than the corresponding result in column B.
4.7.2. Plan Inclusions
Minutes, Texts and Data
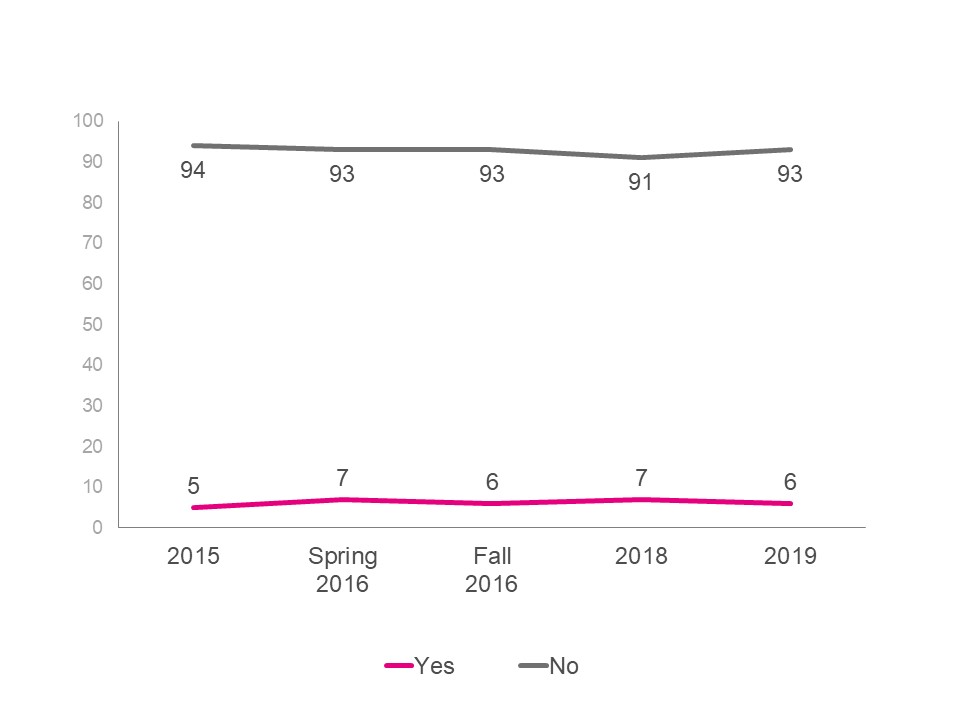
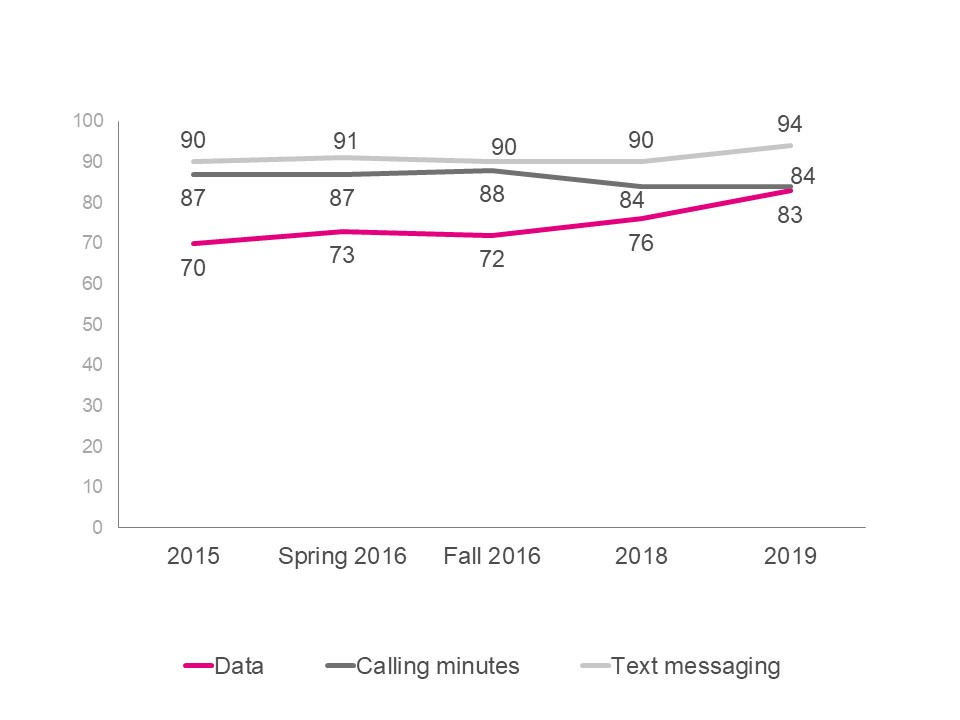
The composition of service features on wireless plans has shifted over the past year. While the majority of wireless plans continue to include text messaging (94%) and calling minutes (84%), data is now much more likely to be included in wireless plans (83% vs. 76% in 2018), an increase of thirteen percent since 2015.
QB2a. Which of the following are included in your wireless plan?
Base: Respondents who own a cell phone, 2019 (n=1,322), 2018 (n=1,111), Fall 2016 (n=1,277)
QB9c1. Are Calling minutes included as part of your plan?
QB9c2. Is Text messaging included as part of your plan?
QB9c3. Is Data included as part of your plan?
Base: Total Respondents, Winter 2016 (n=925), 2015 (n=1,005)
Not unexpectedly, younger Canadians (18-54) continue to be more likely to have text (98% vs. 88%), calling minutes (86-90% vs. 79%) and data (88-91% vs. 74%) included in their wireless plan. There is, however, an increased uptake among older Canadians (55+) of text messages (88% vs. 80%) and data (74% vs. 60%) compared to last year.
Exhibit 4.7.2.b. Service features by age
Service features
Total
(A)
Age
18-34
(D)
35-54
(E)
55+
(F)
Base=actual
(1322)
%
(219)
%
(428)
%
(654)
%
ANY (NET)
98
100F
99F
96
Text messages
94
98F
98F
88
Calling minutes
84
90F
86F
79
Data
83
91F
88F
74
No / Don’t know
2
*
1
4DE
QB2a. Which of the following are included in your wireless plan?
Note: Letters denote statistically significant difference. For example, if there is a B then the result is significantly higher than the corresponding result in column B.
* Denotes less than 1%.
4.7.3. Devices
Phone included or BYOD
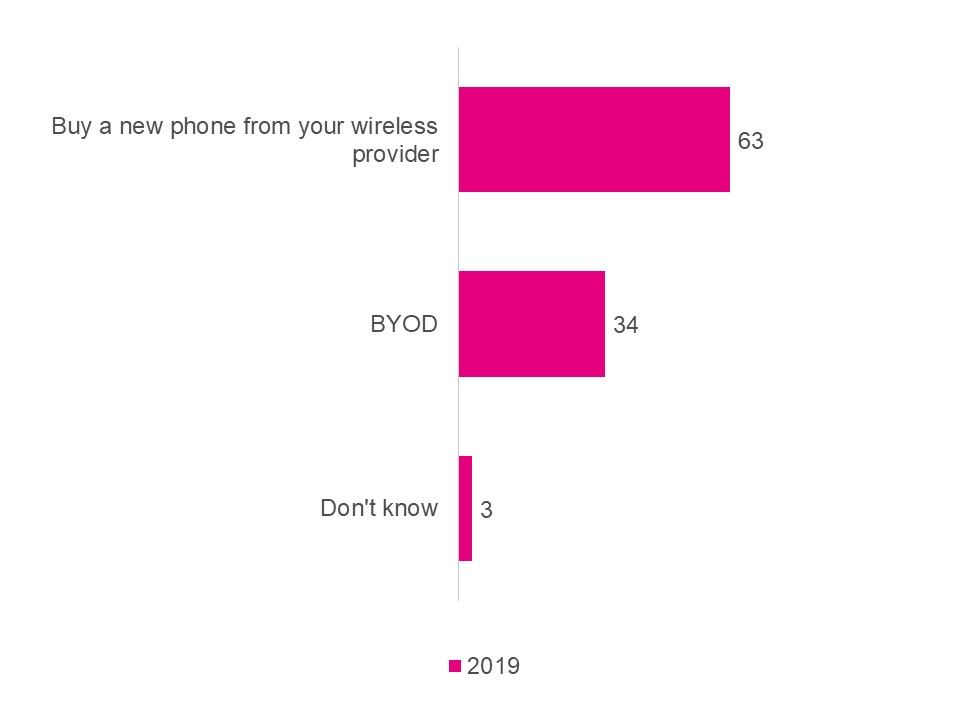
Nearly one third of Canadian wireless plans include a new phone purchased from a wireless provider (63%). Where the 2018 results showed a prevalence among older (55+) Canadians for bring your own device (BYOD) plans, this is not the case in 2019. However, those living in the Prairies are much more likely to have a BYOD plan (76% vs. 53-63% in other regions). Canadians who have individual plans are more likely to purchase a new device (36%) than those with family plans (29%).
WC4. And does your plan include a phone that was sold to you at a reduced price as part of your contract or did you bring your own device also known as a BYOD plan?
Base: Total respondents who own a cell phone, 2019 (n=1,322)
Exhibit 4.7.3.b. Phone included with contract by region and plan type
Phone included with contract
Total
(A)
Region
Plan Sharing
Atlantic
(G)
Quebec
(H)
Ontario
(I)
Prairies
(J)
B.C.
(K)
Territories
(O)
Family
(P)
Individual
(Q)
Base=actual
(1322)
%
(129)
%
(250)
%
(350)
%
(389)
%
(153)
%
(51)
%
(447)
%
(854)
%
Buy a new phone from your wireless provider
63
53
63
60
76
GHIKO
61
53
67
61
Bring your own device
34
43 J
33 J
37 J
23
36 J
42 J
29
36 J
Don’t know
3
4
4 J
3
1
3
5
4
2
WC4. When you signed up for your latest wireless plan, did you bring your own device, or did you buy a new phone from your wireless provider?
Note: Letters denote statistically significant difference. For example, if there is a B then the result is significantly higher than the corresponding result in column B .
Among those who purchased a new phone, few paid full price (11%), while most were given a discount on the device (42%). An alternative option, called a tab balance, involves the purchase of a phone at a reduced upfront cost, with the leftover cost added to an individual’s monthly bill to pay down this balance. Four in ten (38%) chose this option when purchasing a device.
Tab balances are much more common among younger Canadians (18-54; 38-48%) than older Canadians (55+; 30%), as well as in the Atlantic provinces (52%) than in Quebec, Ontario, or the Prairies (34-40%).
WC4a. [ IF QWC4 is Buy a new phone from your wireless provider] Did you:
Base: Total respondents who own a cell phone, 2019 (n=840)
Exhibit 4.7.3.d. Type of new phone purchase by age and region
Type of new phone purchase
Total
(A)
Region
Age
Atlantic
(G)
Quebec
(H)
Ontario
(I)
Prairies
(J)
B.C.
(K)
Territories
(O)
18-34
(D)
35-54
(E)
55+
(F)
Base=actual
(840)
%
(68)
%
(159)
%
(206)
%
(290)
%
(89)
%
(28)
%
(144)
%
(286)
%
(399)
%
Get a discount on your phone
42
36
43
41
48 K
29
44**
38
44
42
Start a tab balance
38
52 HJ
34
40
33
46
24**
48F
38 F
30
Pay your wireless provider full price for our phone
11
8
15
9
10
10
21**
9
9
15 E
Don’t know
9
3
7
9
9
15 G
11**
5
9
13 D
WC4a. [ IF QWC4 is Buy a new phone from your wireless provider] Did you:
Note: Letters denote statistically significant difference. For example, if there is a B then the result is significantly higher than the corresponding result in column B .
** Very Low Base < 30
4.8. Television Service Provider Code
4.8.1. Recall of Television Service Provider Code
In September 2017, a Television Service Provider (TVSP) Code came into effect establishing guidelines for television service providers. The TVSP Code ensures that television consumers are empowered to make informed decisions and that there is a more competitive television marketplace. Despite having been introduced more than a year ago, awareness remains low. Only 17 per cent clearly recall the TV service provider code while another 25 per cent can vaguely recall the code. More than half of Canadians do not recall hearing or seeing anything about this code (56%).
Exhibit 4.8.1.a. Recall of TV Service Provider Code
TVSP1. In September 2017, a Television Service Provider Code came into effect establishing guidelines for television service providers. The Code ensures that television consumers are empowered to make informed decisions and that there is a more competitive wireless marketplace. To what extent, if any would you say you recall hearing or seeing anything about this Code? Would you say you clearly recall, vaguely recall or do not recall?
Base: Total respondents who subscribe to a TV service, 2019 (n=1,107), 2018 (n=1,096)
Demographics continue to play a role in recall of the TVSP Code, as Canadians aged 18-34 are still less likely to be aware of the TVSP Code (73% do not recall vs. 52-54%), as are those with no tertiary education (68% vs. 52%). Language also appears to play a role, as French speaking Canadians are less likely than English speaking Canadians to recall the TVSP Code (61% vs. 52%).
Exhibit 4.8.1.b. Recall of TV Service Provider Code by age, education and language
Recall of TV Service Provider Code
Total
(A)
Age
Education
Language
18-34
(D)
35-54
(E)
55+
(F)
HS or less
(P)
College
(Q)
University or more
(R)
English
(B)
French
(C)
Other
(D)
Base=actual
(1107)
%
(108)
%
(323)
%
(660)
%
(297)
%
(280)
%
(508)
%
(735)
%
(215)
%
(146)
%
Do not recall
56
73 EF
54
52
68 QR
52
52
52
61 B
62
Vaguely Recall
24
10*
28 D
26 D
17
24
27 P
25 D
26
16
Clearly Recall
17
10*
17
19 D
9
20 P
20 P
20 C
10
19 C
Don’t Know
3
7 E*
1
3
6 R
4 R
1
3
4
3
TVSP1. In September 2017, a Television Service Provider Code came into effect establishing guidelines for television service providers. The Code ensures that television consumers are empowered to make informed decisions and that there is a more competitive wireless marketplace. To what extent, if any would you say you recall hearing or seeing anything about this Code? Would you say you clearly recall, vaguely recall or do not recall?
Note: Letters denote statistically significant difference. For example, if there is a B then the result is significantly higher than the corresponding result in column B.
4.8.2. Clarity of TV Contracts
Over half of Canadians continue to claim they find their TV contracts clear and easy to understand (54%; rated 5, 6 or 7 on a scale from 1-7) with only a small portion (23%; rated 1, 2 or 3 on a scale from 1-7) finding it difficult to understand. This is consistent with findings in 2018, although in 2019 there are fewer disparities between demographics, including region and language.
TVSP2. To what extent do you find your TV contract clear and easy to understand? Please use a 7-point scale where 1 means extremely unclear and difficult to understand and 7 means extremely clear and easy to understand.
Base: Total respondents who subscribe to a TV service, 2019 (n=1,107), 2018 (n=1,096)
4.8.3. Awareness of Basic Service Package
The TVSP Code requires television service providers to ensure that customers are aware of the availability, price and content of their entry-level service offering (i.e., basic service package). Close to half of TV service subscribers believe they were informed of this (52%) while one-in-three (31%) do not believe they were informed even though service providers were required to inform new and old clients, regardless of when their contracts were signed. These results are consistent with findings in 2018, suggesting that while this information may be available to consumers in some form, they are not being actively directed to it.
Exhibit 4.8.3.a. Awareness of Basic Service Package
TVSP4. The TVSP Code requires television service providers to ensure that customers are aware of the availability, price and content of their entry-level service offering, also known as the basic service package. Has your service provider informed you about their entry-level offering? This may have been by email, on the phone or via your monthly billing?
Base: Total respondents who subscribe to a TV service, 2019 (n=1,107), 2018 (n=1,096)
4.8.4. Service Calls
The TVSP Code requires television service providers to provide customers with a timeframe for when a service call to a residence will begin, explain potential charges associated with the service call, and explain how they may cancel or reschedule the service call. As in 2018 this appears to be working well, as few Canadians report problems related to service calls (14%).
TVSP3. The TVSP Code requires television service providers to provide a customer with a timeframe for when a service call to a residence will begin, explain potential charges associated with the service call, and explain how you may cancel or reschedule the service call. Have you experienced problems related to service calls?
Base: Total respondents who subscribe to a TV service, 2019 (n=1,107), 2018 (n=1,096)
4.8.5. Changes in Price
Service providers are not allowed to change the price of a TV channel or package of channels without informing their customers. When asked if their service provider had changed the price of their channels or packages without informing them, most Canadians continue to say they have not experienced this (71%). However, a small but significant minority believe this has occurred (19%).
TVSP5. In the past twelve months, has your TV service provider changed the price of a TV channel or package of channels without informing you in advance?
B ase: Total respondents who subscribe to a TV service, 2019 (n=1,107), 2018 (n=1,096)
4.8.6. Complaints
The number of Canadians who have made a complaint about their TV services in the past 12 months has increased compared to 2018 (27% vs. 23%). The nature of the complaints vary, but most center around incorrect charges (20%), inadequate quality of service (17%), changes to their contract without notice (13%), or price changes/high prices (12%).
As with wireless services, those in Quebec are less likely to have made a complaint than those in other regions of Canada (16% vs. 26-38%).
TVSP6. Have you made a complaint about your TV services within the last 12 months?
Base: Total respondents who subscribe to a TV service, 2019 (n=1,107), 2018 (n=1,096)
TVSP6b. [ASK If answered “Yes” to TVSP6] What was your complaint about?
Base: Total Respondents who made a complaint, 2019 (n=303)
Exhibit 4.8.6.b. Complaints by region
Complaints
Total
(A)
Regions
Atlantic
(G)
Quebec
(H)
Ontario
(I)
Prairies
(J)
British Columbia
(K)
Territories
(O)
Base=actual
(1107)
%
(114)
%
(216)
%
(285)
%
(317)
%
(136)
%
(39)
%
Yes
27
38 HJN
16
31 H
26 H
34 H
15
No
70
60
80 GIK
66
72 G
61
83
Don’t know
3
2
4
2
2
5
2
TVSP6. Have you made a complaint about your TV services within the last 12 months?
Note: Letters denote statistically significant difference. For example, if there is a B then the result is significantly higher than the corresponding result in column B .
4.9. CRTC
4.9.1. Canadians’ Understanding of the CRTC Mandate
Canadians’ understanding of the mandate and role of the CRTC has improved compared to 2018, though it remains lower overall since 2014. Thirty-six per cent now consider themselves very well/well informed about the CRTC, compared to 29 per cent in 2018.
Men continue to consider themselves better informed about the role of the CRTC (40% vs. 32%), though understanding among women has increased significantly over the past year (32% vs. 23%). Likewise, Canadians aged 35+ continue to be better informed about the CRTC’s role than their younger counterparts (38-40% vs. 28%). Younger Canadians however, have shown a significant lift in understanding compared to 2018 (28% vs. 17%).
University educated Canadians as well as Canadians living in high income households ($150+) also continue to be more likely to consider themselves informed (40% vs. 31-35% and 49% vs. 29-40%).
Exhibit 4.9.1.a. Level of informed with the mandate and role of the CRTC
C1. Overall, how informed are you about the mandate and role of the CRTC?
Base: Total respondents, 2019 (n=1,524), 2018 (n=1,345), fall 2016 (n=1,483), 2014 (n=1,289)
Exhibit 4.9.1.b. Level of informed with the mandate and role of the CRTC by gender and age
Level of informed with the mandate and role of the CRTC
Total
(A)
Gender
Age
Male
(B)
Female
(C)
18-34
(D)
35-54
(E)
55+
(F)
Base=actual
(1524)
%
(822)
%
(702)
%
(237)
%
(481)
%
(782)
%
Informed
(4 and 3)
36
40 C
32
28
38 D
40 D
Uninformed
(2 and 1)
62
59
65 B
69 F
61
58
QC1. Overall, how informed are you about the mandate and role of the CRTC?
Note: Letters denote statistically significant difference. For example, if there is a B then the result is significantly higher than the corresponding result in column B.
Exhibit 4.9.1.c. Level of informed with the mandate and role of the CRTC by income and education
Level of informed with the mandate and role of the CRTC
Total
(A)
Income
Education
<$40K
(E)
$40K- <$60K
(F)
$60K- <$100K
(G)
$100K- <$150K
(H)
$150K+
(I)
High school or less
(P)
College
(Q)
University or more
(R)
Base=actual
(1524)
%
(309)
%
(204)
%
(339)
%
(228)
%
(221)
%
(392)
%
(392)
%
(710)
%
Informed
(4 and 3)
36
29
34
40 E
40 E
49 EF
31
35
40 P
Uninformed
(2 and 1)
62
68 I
65 I
59
60
51
67 R
62
59
QC1. Overall, how informed are you about the mandate and role of the CRTC?
Note: Letters denote statistically significant difference. For example, if there is a B then the result is significantly higher than the corresponding result in column B.
4.9.2. Impression of the CRTC
Canadians’ impressions of the CRTC are less neutral than they were in 2018, and have improved from Fall 2016 (34% vs. 29%; rated 4 or 5 on a 1-5 scale). This may be reflecting the increase in Canadians who feel well informed about the role of the CRTC over the past year. However, as in 2018 it is worth noting that two thirds of Canadians say they are not well informed about the role of the CRTC, which implies that consumers’ impressions of the CRTC are based on little to no knowledge.
Consistent with 2018, those who consider themselves very well or well informed about the CRTC’s role are more positive about the organization (49-54% vs. 14-30%).
Base: Total respondents, 2019 (n=1,524), 2018 (n=1,345), Fall 2016 (n=1,483), 2014 (n=1,289)
Exhibit 4.9.2.b. Impression of the CRTC by Role of CRTC
Impression of the CRTC
Total
(A)
Role of CRTC
Very well
(K)
Well
(L)
Not very well
(M)
Not
(N)
Base = actual
(1524)
%
(119)
%
(459)
%
(563)
%
(354)
%
Favourable (4 and 5)
34
49 MN
54 MN
30 N
14
Neutral (3)
35
22
31
43 KL
36 K
Unfavourable (1and 2)
16
22
14
18
15
QC2. What is your impression of the CRTC? Would you say it is:
Note: Letters denote statistically significant difference. For example, if there is a B then the result is significantly higher than the corresponding result in column B.
Despite an upward trend in impressions of the CRTC, Canadians are not any more likely to say their opinion of the CRTC has changed in 2019. Few report an improved (8%) or worsened (7%) opinion, with most remaining the same (72%). As stated previously, given that most Canadians continue to state that they are not well informed about the CRTC’s role, this is unsurprising.
Age appears to be a factor in improved opinion, with those 18-34 more likely to say their opinion has improve versus those 55+ (12% vs. 5%), likely reflecting a spike in feeling informed among this age group.
Opinion in the territories is significantly lower than that of other regions (19% vs. 5-9%), however, these results should be interpreted with caution due to low sample size.
Language is also a determining factor in changed opinion, with Anglophones more likely to report a decline in opinion than Francophones (8% vs. 3%). Again, being informed of the role of CRTC has an impact on opinion, though in contrast to 2018 those who report being very well informed are now more likely to say their opinion has declined (13% in 2019 vs. 4% in 2018). See exhibit 4.9.2.f. for more information.
QC3. Over the past year, would you say your impression of the CRTC has:
Base: Total respondents, 2019 (n=1,524), 2018 (n=1,345), fall 2016 (n=1,483), 2014 (n=1,289)
Exhibit 4.9.2.d. Impression of the CRTC over time by age and region
Impression of the CRTC
Total
(A)
Age
Region
18-34
(D)
35-54
(E)
55+
(F)
Atlantic
(G)
Quebec
(H)
Ontario
(I)
Prairies
(J)
B.C.
(K)
Territories
(O)
Base = actual
(1524)
%
(237)
%
(481)
%
(782)
%
(149)
%
(291)
%
(400)
%
(450)
%
(183)
%
(51)
%
Remained about the same
72
61
75 D
79 D
77
72
72
74
68
68
Improved
8
12 F
7
5
7
8
8
7
7
6
Declined
7
7
8
5
6
5
6
6
9
19 GHIJ
Don’t know
14
20 EF
11
11
10
15
14
13
16
7
QC3. Over the past year, would you say your impression of the CRTC has:
Note: Letters denote statistically significant difference. For example, if there is a B then the result is significantly higher than the corresponding result in column B.
Exhibit 4.9.2.e. Impression of the CRTC over time by Role of CRTC
Impression of the CRTC
Total
(A)
Role of CRTC
Very well
(K)
Well
(L)
Not very well
(M)
Not
(N)
Base = actual
(1524)
%
(119)
%
(459)
%
(563)
%
(354)
%
Remained about the same
72
68
81 KN
77 N
60
Improved
8
11 N
9 N
9 N
4
Declined
7
13 MN
7
6
6
Don’t know
14
8 L
2
8L
31 KLM
QC3. Over the past year, would you say your impression of the CRTC has:
Note: Letters denote statistically significant difference. For example, if there is a B then the result is significantly higher than the corresponding result in column B.
Appendix A: Methodology
4.10. Methodological Overview
Survey Administration
A telephone survey was conducted among 1,524 Canadians aged 18 years and older; 1,322 with those who have their own wireless plan and 202 with those who do not have a wireless plan. Interviews were conducted using a combination of random digit dialing (RDD) for the landline sample frame and pre-screened cell phone only households (CPO) sample. Included in this sample were Canadians that are under contract with TV service providers. Natural fall-out resulted in 1,107 respondents who subscribe to cable, satellite or IPTV TV services, along with 516 Canadians who reside in cell phone only households.
A pre-test consisting of 10 completed English interviews and 10 completed French interviews was completed before fielding the survey on January 21st, 2019.
The survey was in field from January 22nd to February 6th, 2019. Since this survey included pre-screened sample it is considered a non-probability sample and as such margin of error does not apply and conclusions from these results cannot be generalized to any population.
To allow for regional analyses, regional quotas were also set as follows:
Table 5.1.1.a: Survey Quotas
Region
Wireless
Quota
Completions
Territories
With wireless
50
50
Without wireless
0
0
British Columbia
With wireless
150
151
Without wireless
30
30
Alberta
With wireless
125
125
Without wireless
20
20
Manitoba
With wireless
125
130
Without wireless
20
20
Saskatchewan
With wireless
125
133
Without wireless
20
21
Ontario
With wireless
350
354
Without wireless
50
50
Quebec
With wireless
250
250
Without wireless
40
41
Atlantic
With wireless
125
127
Without wireless
20
20
Survey data were weighted using the 2016 Census statistics with regard to region, age, gender and language. Further details about the methodology follow.
Questionnaire
This is a tracking survey and the overall objectives have not changed, although some questions were removed or added to the survey since the fall 2016 wave. CRTC provided Kantar TNS with both English and French versions of the survey. The survey took approximately 15 minutes to complete.
Pre-test
A pre-test was undertaken on January 21st, 2019 obtaining 10 English and 10 French completed interviews. The results were reviewed to ensure the survey was working as expected and that the questions were being interpreted as expected. Based on the results of the pre-test, minimal changes were required for the survey and as such the results of the 20 completes were included in the final data set.
Sample Design and Selection
A regionally stratified sample was drawn to achieve completions among Canadians who have a wireless plan that is not paid for by their employer and those who do not have any wireless plan. The sample was regionally stratified to ensure regional quotas were met.
A landline sample was provided by an internal random number generator that randomizes the last four digits of the phone number based on known area code/exchange combinations. Landline respondents were screened to ensure they qualified for the study. The person answering the phone was selected for the study if they were 18 years of age or older. Regional quotas were assigned by those with and without personal wireless plans.
Survey Administration
The telephone survey was conducted using computer assisted telephone interviewing (CATI) technology. CATI ensures the interview flows as it should with pre-programmed skip patterns. It also controls responses to ensure appropriate ranges and data validity. Sample is imported directly into the survey to ensure accurate recording of sample variables such as region. The system also controls automated scheduling and call-backs to ensure all appointments are adhered to.
Surveys were conducted in English or French as chosen by the respondent. Interviewing was conducted by fully trained interviewers and supervisors. A minimum of five per cent of all interviews were independently monitored and validated in real time.
All participants were informed of the general purpose of the research, they were informed of the sponsor and the supplier and that all of their responses would be confidential.
Margin of Errors
Since this survey included pre-screened sample it is considered a non-probability sample and as such margin of error does not apply and conclusions from these results cannot be generalized to any population.
Weighting
Data were weighted by region, age, gender and language using 2016 Census Data.
Table 4.1.c. 2016 Census Data by Region, Age, Gender
Region
Age
Gender
Population
(N)
Population
(%)
Atlantic
18-34
Male
222,130
0.79
Female
223,220
0.79
35-54
Male
307,195
1.09
Female
328,985
1.17
55+
Male
392,955
1.40
Female
441,700
1.57
Quebec
18-34
Male
848,250
3.02
Female
842,360
3.00
35-54
Male
1,098,175
3.90
Female
1,097,760
3.90
55+
Male
1,259,920
4.48
Female
1,434,415
5.10
Ontario
18-34
Male
1,488,215
5.29
Female
1,483,160
5.27
35-54
Male
1,791,645
6.37
Female
1,916,435
6.81
55+
Male
1,904,450
6.77
Female
2,182,830
7.76
Prairies
18-34
Male
782,730
2.78
Female
762,790
2.71
35-54
Male
874,845
3.11
Female
870,205
3.09
55+
Male
803,335
2.86
Female
877,060
3.12
BC & Territories
18-34
Male
524,675
1.87
Female
517,040
1.84
35-54
Male
627,710
2.23
Female
668,600
2.38
55+
Male
734,570
2.61
Female
815,140
2.90
Total
28,122,500
100.00
Table 4.1.d. 2016 Census Data by Language
Language
Population
(N)
Population
(%)
English
16,032,637
57.01
French
5,908,537
21.01
Other
6,181,326
21.98
Total
34,766,911
100.00
Response Rate
A total of 116,827 Canadian phone numbers were dialed, of which n=1524 completed the survey. The overall response rate achieved for the study was 2.79%. The following table outlines the sample disposition and response rate as per the MRIA guidelines.
Table 5.1.1.e: Response Rate Calculation
Total
Cell Phone Only (Prescreened)
Landline (Random Digit Dialing)
Total Numbers Attempted
116827
1031
115796
Invalid
43419
3
43416
NIS
41307
3
41304
Fax/modem
2095
0
2095
Business/non-residential
17
0
17
Unresolved (U)
58910
127
58783
Busy
2391
0
2391
No answer
39162
117
39045
Answering machine
17357
10
17347
Unresolved (IS)
12258
127
12131
Language problem/illness, incapable
293
5
288
Selected respondent not available
6326
12
6314
Refusal
5291
55
5236
Qualified respondent break-off
348
55
293
In-scope - Responding units (R)
2240
774
1466
Quota Full
396
137
259
Other disqualify - No Device not paid by employer (NWT/NU/YK only)
15
0
15
Other disqualify - Occupation
105
48
57
Completed interviews
1524
516
1008
Response Rate = R/(U+IS+R)
2.79%
73.40%
1.85%
Non-response Bias
The response rate for this survey was 2.79%.n order to maximize response TNS undertakes the following:
A minimum of 8 callbacks were made before retiring a number.
Call backs are rescheduled at different times and days in order to maximize the possibility of an answer.
Appointments and call backs are offered at flexible times so respondents may take the survey at the most convenient time.
Tabulated Data
Detailed tables are included under separate cover.
Appendix B: Survey Instrument
Background Information for the Interviewers
The Wireless Code came into effect in 2013 and was updated in 2017.
Here are the main features of the Wireless Code (2013): The Wireless Code makes it easier for individual and small business consumers to get information about their contracts with wireless service providers and about their associated rights and responsibilities, establish standards for industry behaviour, and contribute to a more dynamic marketplace. The Code significantly limits the early cancellation fees that are currently sought by retail wireless service providers, which will enable consumers to take advantage of competitive offers at least every two years. The Wireless Code requires service providers to unlock wireless devices, to offer a trial period for wireless contracts, and to set default caps on data overage charges and data roaming charges.
Here are the main updates to the Wireless Code (2017): The Code now ensures that customers will be provided with unlocked devices, gives families more control over data overages, sets minimum usage limits for the trial period that correspond to at least half of the monthly usage limits of the customer’s plan, and clarifies that data is a key contract term that cannot be changed during the commitment period without the customer’s consent.
The TV Service Provider Code came into effect in 2017.
Here are the main features of the TV Service Provider (TVSP) Code (2017):The Code makes it easier for Canadians to understand their television service agreements and empowers customers in their relationships with TVSPs (i.e. your cable, satellite or IPTV provider). Among other things, the Code requires TVSPs to ensure written agreements and offers are clear. It also sets out new rules for trial periods for persons with disabilities, changes to programming options, service calls, service outages and disconnections.
Section A: Introduction and Screening
Hello/Bonjour. My name is _______________ and I am calling from Kantar TNS on behalf of the Government of Canada. We are conducting a survey with Canadians 18+ to get their attitudes and opinions towards issues of importance to Canadians. Would you prefer that I continue in English or French? Préférez-vous continuer en français ou en anglais?
Your participation in this survey is voluntary. Please be assured that your responses are confidential and will not be reported individually nor attributed to you personally. The information will be used to develop communications related policy. The survey will take 15 minutes or less to complete.
Yes
CONTINUE
No, other time
SCHEDULE CALLBACK
No/Refused
THANK AND TERMINATE
[IF ASKED: Kantar TNS is a professional research company hired by the Government of Canada to conduct this survey]
[ASK ALL] A1b. Do you have your own cell phone, smartphone or other wireless device? In other words, a phone that is not paid for by your employer?
YES
1
NO
2
HV1. Hidden Variable: CPO Household
RECORD FROM SAMPLE
YES - CPO Household
NO
A1d. Does your household subscribe to a cable, satellite or IPTV TV service?
Yes
1
No
2
DK/NR (VOLUNTEERED)
9
[IF ASKED: IPTV is a different way of getting traditional TV, similar to cable or satellite TV. IPTV is different from Netflix or other streaming services. (IPTV does not include Netflix)]
A2. Are you or is any member of your household or immediate family employed in any of the following businesses? [READ LIST]
Market Research
1 [THANK AND TERMINATE]
Public or media relations or advertising
2 [THANK AND TERMINATE]
Any media company such as print, radio, TV
3 [THANK AND TERMINATE]
Media monitoring
4 [THANK AND TERMINATE]
Any telecommunications company
5 [THANK AND TERMINATE]
No
6 [CONTINUE]
Section: Wireless Code
[ASK ALL]
I. RECALL OF WIRELESS CODE
WC1. In 2013 a Wireless Code was created to make wireless contracts clearer, limit early cancellation fees, and to contribute to a more competitive wireless marketplace. In 2017, the Code was updated to end unlocking fees. To what extent, if any would you say you recall hearing or seeing anything about this Code? Would you say you clearly recall, vaguely recall or do not recall?
Clearly Recall
1
Vaguely Recall
2
Do not recall
3
DK
99
PROGRAMMING INSTRUCTION:
IF NO AT A1B AND YES AT A1D SKIP TO SECTION TVSP Code
IF NO AT A1B AND NO AT A1D SKIP TO SECTION CRTC
II. TYPE OF WIRELESS CONTRACT
The next few questions are about your cell or wireless phone service contract or plan.
[Interviewer note: If say “I don’t have a plan/I have pay-as-you-go/month-to-month,” say: “this question is about your service agreement or plan, regardless of whether you have signed a contract for a specific time period, are month-to-month or use pre-paid cards.”]
INDIVIDUAL, FAMILY AND SHARED PLANS
B1a. Is it an individual plan or a family or shared plan?
[Interviewer note: If unsure about the difference, say “Do you pay only for one person (which is an individual plan) or do you share a plan with your family and pay together (which is a family plan)?”]
Individual plan
1
Family/shared plan
2
[DO NOT READ] Other [SPECIFY]
77
DK (DO NOT READ)
99
WC2. [ASK If answered “family/shared plan” to B1a]
How many members are on your shared plan?
2
1
3
2
4
3
5+
4
DK (DO NOT READ)
99
MONTHLY, PREPAID, AND PAY-AS-YOU-GO PLANS
B1c. And, is it a monthly plan, or a prepaid or pay-as-you-go plan?
[Interviewer note: If unsure about the difference, say “If you pay your bill after you use your wireless service, it’s a monthly or post-paid plan. If you pay before you use your wireless service, it’s a prepaid or pay-as-you-go plan.“]
Monthly/post-paid (paying after)
1
Prepaid/pay-as-you-go (paying before)
2
[DO NOT READ] Other [SPECIFY]
77
DK (DO NOT READ)
99
CORPORATE CONTRACTS (EMPLOYEE PURCHASE PLANS)
B1d. Is your plan part of a promotion through your employer or an association you belong to, sometimes also called an employee purchase plan?
Yes
1
No
2
DK (D NOT READ)
99
III. SERVICES INCLUDED IN THE WIRELESS PLAN
(TEXT, VOICE, DATA)
DISPLAY: Now I would like to ask you a few questions about the services that are included in your wireless plan.
B2a. Which of the following are included in your wireless plan?
Calling minutes [Interviewer note: If unsure about the meaning, say “This is what you need to make or receive phone calls.”]
Text messages [Interviewer note: If unsure about the meaning, say “This can include both text messages and multimedia messages, like pictures or video sent via text.”]
Data [Interviewer note: If unsure about the meaning of data, say “This is what you need to browse the Internet, access applications or your emails with your wireless device.”]
PROGRAMMING NOTE: PLEASE ALLOW YES NO AND DON’T KNOW AS OPTIONS
IV. DEVICES
PHONE INCLUDED WITH CONTRACT (BYOD, TAB CONTRACTS, AND OTHER DEVICE SUBSIDIES)
WC4. When you signed up for your latest wireless plan, did you bring your own device, or did you buy a new phone from your wireless provider?
[Interviewer note: If unsure about the meaning of bring your own device, say “bring your own device is where you already own your mobile device and are simply purchasing the cellular service from a wireless company.”
Bring your own device
1
Buy a new phone from your wireless provider
2
DK (DO NOT READ)
99
PROGRAMMING INSTRUCTION: ONLY ASKWC4A IF QWC4 is Buy a new phone from your wireless provider
QWC4A: Did you:
Pay your wireless provider full price for your phone
1
Get a discount on your phone
2
Start a tab balance
3
DK (DO NOT READ)
99
INTREVIEWER INSTRUCTION: If unsure about the meaning of a tab balance, say “Tab balances are when you buy a phone at a reduced upfront cost and the leftover cost of the phone goes onto your account, creating a tab balance. Each month, a percentage of your monthly bill is used to pay down your tab”]
V. DATA SERVICES
[ASK If answered “Data” to B2a]
Now, I would like to ask you a few questions about the data services that are included in your wireless plan.
DATA PLANS
B4. Some wireless plans have unlimited data and some have limited data. When a plan includes a monthly data limit, you may have to pay data overage fees if you use more data in a month than is included in your plan.
How much data is currently included in your plan each month?
[Interviewer note: If unsure about the meaning of data, say “This is what you need to browse the Internet, access applications or your emails with your wireless device when it is not connected to wifi.”]
[DO NOT READ LIST]
PROGRAMMING INSTRUCTION: PLEASE PROGRAM TO ALLOW NUMBERICAL ENTRY AS FOLLOWS
_____Mega Bytes (MB) – DO NOT ALLOW ENTRY UNDER 100
_____Giga Bytes (GB) – DO NOT ALLOW ENTRY OVER 100
Unlimited
None – no data in plan
Don’t Know
[Interviewer note: If respondent indicates an number under 100 MegaBytes please ask them if they mean MegaBytes or GigaBytes. If there is confusion, please code as Don’t Know”]
HOW TO MANAGE DATA USE
PROGRAMMING NOTE: PLEASE ALLOW YES NO AND DONT KNOW AS OPTIONS
B5a. [ASK If do not answer “Unlimited or None” to B4] Which of the following activities, if any, do you use to manage or limit your data use? Select all that apply.
Use tools to track your data use
1
Reduce your data use after you get a notification that you are nearing your limit
2
Use WIFI when available instead of data
3
Other (specify)
4
I do not limit my data use (DO NOT READ)*
5
DK (DO NOT READ)
99
EASE OF MANAGING DATA
WC6. [ASK If answered “Data” to B2a and not code 3 (NO DATA) at B4]
How easy do you find it to manage the data used by yourself and/or your family each month?
Please use a 7-point scale where 1 means extremely difficult and 7 means extremely easy.
[Interviewer note: If unsure about the meaning of data, say “This is what you need to browse the Internet, access applications or your emails with your wireless device.”]
7 – Extremely easy
07
6
06
5
05
4
04
3
03
2
02
1 – Extremely difficult
01
I DON’T USE MY DATA (DO NOT READ)
09
DK (DO NOT READ)
99
DATA OVERAGE FEES
B8. [“Data” to B2a and not code 3 (NO DATA) at B4.] In the past 12 months, how often have you paid data overage fees?
READ LIST
[Interviewer note: If unsure about the meaning of data, say “This is what you need to browse the Internet, access applications or your emails with your wireless device.”]
Never
1
1-2 times
2
3-6 times
3
7-9 times
4
10-12 times
5
DK- DO NOT READ
99
VI. BILL SHOCK
B10. During the last year, have you experienced ‘bill shock, meaning a surprisingly high bill?
READ LIST
Yes
1
No
2
DK DO NOT READ
99
REASON FOR BILL SHOCK
B10a. [If answered “Yes” to B10] What was the main reason for the ‘bill shock you experienced?
DO NOT READ LIST – SELECT ALL THAT APPLY
INTERVIEWER NOTE: IF RESPONDENT SAYS ‘ROAMING/ROAMING FEES, CLARIFY WHETHER THIS WAS WITHIN CANADA OR IN ANOTHER COUNTRY
Family/shared plans – difficulties managing use
01
International travel – roaming fees
02
Domestic travel – roaming fees
03
Data overage fees
04
Call minute overage fees
05
Long distance fees
06
Text overage fees
07
Billing issues/errors/mistakes
08
Unexpected set-up fee or service charge
09
Unexpected fees (Network access fee/911, etc.)
10
I was not given the plan/deal I was promised
11
Other (Specify)
77
DK (DO NOT READ)
99
AMOUNT OF BILL SHOCK
B10b. [If answered “Yes” to B10] What was the amount of the unexpected charges on your bill?
READ LIST
Less than $50 more than your usual monthly bill
01
$50 - $100
02
$101 - $250
03
$251 - $500
04
$501 - $1000
05
Greater than $1000
06
Don’t Know DO NOT READ
99
ROAMING FEES WHILE TRAVELING
B9. If you use your plan while traveling, you may be charged roaming fees. How easy do you find it to manage your roaming charges when you are traveling?
Please use a 7-point scale where 1 means extremely difficult and 7 means extremely easy.
7 – Extremely easy
07
6
06
5
05
4
04
3
03
2
02
1 – Extremely difficult
01
I don’t travel with my phone (DO NOT READ)
08
DK (DO NOT READ)
99
VII. COMPLAINTS
B11a. Have you made a complaint about your wireless services in the past 12 months?
Yes
1
No
2
DK (DO NOT READ)
99
SUBJECT OF COMPLAINTS
B11b.[ASK If answered “Yes” to B11a] What was your complaint about? READ LIST IF NEEDED CHOOSE ALL THAT APPLY
Misleading information about the terms of your contract
1
Misleading or aggressive sales practices
13
Incorrect charge on your bill
2
Legitimacy or amount of early cancellation fee
3
Inadequate quality of service
4
Credit or refund not received
5
Data charges
6
Breach of contract
7
Change to contract without notice
8
30 day cancellation policy
9
Unlocking phone
10
Credit reporting
11
Other [specify]
77
DK(Do not read)
99
NOTES TO INTERVIEWER: PLEASE FAMILIARIZE YOURSELF WITH THE FOLLOWING BEFORE INTERVIEW READ IF REQUIRED
Misleading information about terms: Some examples are what is included in a contract or how the contract should be interpreted, or whether the providers conduct meets its contractual obligations, or misunderstandings about the particulars of a contract or term.
Misleading or aggressive sales practices: Some examples include salespeople providing details of wireless products or services you are not interested in or which end up being false, promotional offers changing over the course of the term, rebate or discount offers where terms differ from the original information provided by the service provider, or technical support representatives trying to sell you products or services during the support call or interaction.
Incorrect charge: Some examples include complaints about customers having agreed to one price and subsequently being charged more, being overcharged due to either a billing system error or a price that is different than advertised, or about being billed for per-use services which they claim they did not use.
Early cancellation fee: This would be a complaint about the amount or the legitimacy of an early cancellation fee charged to the customer when they cancel their service.
Inadequate quality of service: This can include the installation, repair or disconnection of service, including the quality of the service or unreasonable interruptions to service and transfers of service from one provider to another.
Credit or refund not received: This is fairly straightforward – refunds would normally be due upon cancellation of a service.
Data charges: Any complaints relating to a customer’s data plan or data services, including disputes over data overage fees, the ability of multiple users on family or shared plans to consent to exceeding data overage caps.
Breach of contract: This would include disputes about compliance with terms and conditions of a customer’s contract.
Change to contract without notice: This is when a service provider changes a material term in a customer’s contract without providing notice.
Credit reporting: This issue relates to a customer’s credit score and/or debt collection. For example, a customer is overbilled in error and does not pay the outstanding amount, this may impact their credit or they may have to deal with debt collection agencies while the complaint is being addressed.
WHO DID YOU COMPLAIN TO?
WC7. [ASK If answered “Yes” to B11a] Who did you complain to? Was it your service provider, theCommission for Complaints for Telecom-Television Services, also knowns as the CCTS, or both?
Service provider
1
CCTS
2
Both
3
DK (DO NOT READ)
99
VIII. CLARITY AND EXPLANATIONS
Now, I would like to ask you a few questions about how clear and easy you find your wireless contract to understand.
EXPLANATION OF TRIAL PERIOD
WC8. The Code requires service providers to include a trial period for new contracts that include a device. During the trial period, you can cancel your contract without penalty. This trial period now has to be half of a month of service and include half the service included in your monthly plan.
How clearly did your service provider explain the trial period to you?
Please use a 7-point scale where 1 means extremely unclear and 7 means extremely clear.
7 – Extremely clear
07
6
06
5
05
4
04
3
03
2
02
1 – Extremely unclear
01
DO NOT READ: Do not have a contract
08
DO NOT READ: Never read the agreement
09
DO NOT READ: Did not have a trial period
10
DO NOT READ: Don’t Know
99
EXPLANATION OF CANCELLATION FEES
WC9. When you signed your contract or accepted your service agreement, how clearly did your service provider explain any fees that would apply if you cancel your contract or agreement early? Please use a 7-point scale where 1 means extremely unclear and 7 means extremely clear.
7 – Extremely clear
07
6
06
5
05
4
04
3
03
2
02
1 – Extremely unclear
01
DO NOT READ: Do not have a contract
08
DO NOT READ: Never read the agreement
09
DO NOT READ: Don’t Know
99
WC10. Do you find your contract clear and easy to understand? Please use a 7-point scale where 1 means extremely unclear and difficult to understand and 7 means extremely clear and easy to understand.
7 – Extremely clear and easy to understand
07
6
06
5
05
4
04
3
03
2
02
1 – Extremely unclear and difficult to understand
01
DO NOT READ: Do not have a contract
08
DO NOT READ: Never read the agreement
09
DO NOT READ: Don’t Know
99
IX. CHANGES
CHANGES TO YOUR CONTRACT
WC11. Have you ever become aware that your service provider changed your plan without expressly making you aware of how the terms and conditions had changed?
Yes
1
No
2
DK
99
[ASK ALL]
CHANGING SERVICE PROVIDERS
WC16. Have you changed wireless service providers in the last two years?
Yes
1
No
2
DK
99
REASONS FOR CHANGING SERVICE PROVIDER
WC12. [If answered “Yes” to WC16] Why did you change service provider? (DO NOT READ LIST - SELECT ALL THAT APPLY)
Your contract had ended
1
You were no longer satisfied with your service provider
2
Offered a better deal with a different provider
3
Needed a new phone / to upgrade phone
4
Other [open ended]
77
DK
99
EASE OF SWITCHING
WC13[If answered “Yes” to WC16] How easy or difficult was it to switch service providers? Please use a 7-point scale where 1 means extremely difficult and 7 means extremely easy.
7 – Extremely easy
07
6
06
5
05
4
04
3
03
2
02
1 – Extremely difficult
01
DO NOT READ: Don’t Know
99
REASONS SWITCHING WAS DIFFICULT
WC14. [If answered 1,2 OR 3 at WC13] Was there a reason why switching providers was difficult for you? (DO NOT READ LIST – SELECT ALL THAT APPLY)
Technical issues
01
Difficulty retaining phone number
02
High costs of ending contract
03
Could not get the phone you wanted
04
Other [open ended]
77
Don’t Know
99
Section: TVSP Code
ASK TVSP CODE section if yes at A1d
The next few questions are about your TV service provider. By this we mean your cable, satellite or IPTV provider. Please do not include streaming services such as Netflix
INTERVIEWER INSTRUCTION: IF RESPONDENT INDICATES THEY DO NOT HAVE CABLE, SATELITE OR IPTV SERVICES SKIP THIS SECTION
TVSP1. In September 2017, a Television Service Provider Code came into effect establishing guidelines for television service providers. The Code ensures that television consumers are empowered to make informed decisions and that there is a more competitive wireless marketplace. To what extent, if any would you say you recall hearing or seeing anything about this Code? Would you say you clearly recall, vaguely recall or do not recall?
Clearly Recall
1
Vaguely Recall
2
Do not recall
3
DK(DO NOT READ)
99
TVSP2. To what extent do you find your TV contract clear and easy to understand? Please use a 7-point scale where 1 means extremely unclear and difficult to understand and 7 means extremely clear and easy to understand.
7 – Extremely clear and easy to understand
07
6
06
5
05
4
04
3
03
2
02
1 – Extremely unclear and difficult to understand
01
DO NOT READ: Do not have a contract
08
DO NOT READ: Never read the agreement
09
DO NOT READ: Don’t Know
99
TVSP3. The TVSP Code requires television service providers to provide a customer with a timeframe for when a service call to a residence will begin, explain potential charges associated with the service call, and explain how you may cancel or reschedule the service call. Have you experienced problems related to service calls?
Yes
1
No
2
DK
99
TVSP4. The TVSP Code requires television service providers to ensure that customers are aware of the availability, price and content of their entry-level service offering, also known as the basic service package. Has your service provider informed you about their entry-level offering? This may have been by email, on the phone or via your monthly billing?
Yes
1
No
2
DK
99
TVSP5. In the past twelve months, has your TV service provider changed the price of a TV channel or package of channels without informing you in advance?
Yes
1
No
2
DK
99
TVSP6. Have you made a complaint about your TV services within the last 12 months?
Yes
1
No
2
DK
99
SUBJECT OF COMPLAINTS
TVSP6b.[ASK If answered “Yes” to TVSP6] What was your complaint about? READ LIST IF NEEDED CHOOSE ALL THAT APPLY
Misleading information about the terms of your contract
1
Misleading or aggressive sales practices
2
Incorrect charge on your bill
3
Legitimacy or amount of early cancellation fee
4
Inadequate quality of service
5
Credit or refund not received
6
Breach of contract
7
Change to contract without notice
8
30 day cancellation policy
9
Credit reporting
10
Installation
11
Service calls
12
Other [specify]
77
DK(Do not read)
99
NOTES TO INTERVIEWER: PLEASE FAMILIARIZE YOURSELF WITH THE FOLLOWING BEFORE INTERVIEW READ IF REQUIRED
Misleading information about terms: Some examples are what is included in a contract or how the contract should be interpreted, or whether the providers conduct meets its contractual obligations, or misunderstandings about the particulars of a contract or term.
Misleading or aggressive sales practices: Some examples include salespeople providing details of television products or services you are not interested in or which end up being false, promotional offers changing over the course of the term, rebate or discount offers where terms differ from the original information provided by the service provider, or technical support representatives trying to sell you products or services during the support call or interaction.
Incorrect charge: Some examples include complaints about customers having agreed to one price and subsequently being charged more, being overcharged due to either a billing system error or a price that is different than advertised, or about being billed for per-use services which they claim they did not use.
Early cancellation fee: This would be a complaint about the amount or the legitimacy of an early cancellation fee charged to the customer when they cancel their service.
Inadequate quality of service: This can include the quality of the service, unreasonable interruptions to service, disconnections, and issues transferring service from one provider to another.
Credit or refund not received: This is fairly straightforward – refunds would normally be due upon cancellation of a service.
Breach of contract: This would include disputes about compliance with terms and conditions of a customer’s contract.
Change to contract without notice: This is when a service provider changes a material term in a customer’s contract without providing notice, including changes to television programming options (e.g. channels provided or rate increases).
Credit reporting: issues related to a consumers credit score and/or debt collection. For example, a customer is overbilled in error and does not pay the outstanding amount, this may impact their credit or they may have to deal with debt collection agencies while the complaint is being addressed.
Installation: issues related to the installation of services.
Service calls: issues related to service calls, including repair services, such as failure to arrive within the promised timeframe or charges related to service calls.
Section CRTC: CRTC ASK ALL
The Canadian Radio-television and Telecommunications Commission or CRTC is an independent agency of government, responsible for regulating Canada's broadcasting and telecommunications systems.
C1. Overall, how informed are you about the mandate and role of the CRTC? (READ LIST)
Very well informed
1
Well informed
2
Not very well informed
3
Not informed
4
DK (do not read)
99
C2. What is your impression of the CRTC? Would you say it is: (READ LIST)
[Repeat CRTC definition, if necessary: The Canadian Radio-television and Telecommunications Commission or CRTC is an independent agency of government, responsible for regulating Canada's broadcasting and telecommunications systems.
Very favourable
1
Somewhat favourable
2
Neutral
3
Somewhat unfavourable
4
Very unfavourable
5
DK (Do not read)
99
C3. Over the past year, would you say your impression of the CRTC has: (READ LIST)
[Repeat CRTC definition, if necessary: The Canadian Radio-television and Telecommunications Commission or CRTC is an independent agency of government, responsible for regulating Canada's broadcasting and telecommunications systems].
Improved
1
Declined
2
Remained about the same
3
DK (Do not read)
99
Section: Demographics
Thank you, now we have a few questions for classifications purposes. Please be assured that your responses will remain confidential.
D1. Record gender [DO NOT ASK]
Male
1
Female
2
D2. Can you tell me, in what year were you born?
_____________ [RECORD YEAR TO CALCULATE AGE] DK/refused D3 [IF D2 = DK/refused] For classification purposes, could you tell me whether your age is: [READ LIST]
between 18 and 34
1
between 35 and 49
2
between 50 and 54
3
Between 55 and 64
4
65 or older
5
REFUSED (DO NOT READ)
[ASK ALL]
D4. In which province or territory do you live? [READ LIST]
Alberta
1
British Columbia
2
Manitoba
3
New Brunswick
4
Newfoundland
5
Nova Scotia
6
Ontario
7
Prince Edward Island
8
Quebec
9
Saskatchewan
10
Yukon
11
Nunavut
12
Northwest Territories
13
D5. What is the highest level of formal education that you have completed? [READ IF NECESSARY - CODE ONE ONLY]
Grade 8 or less
1
Some high school
2
High School diploma or equivalent
3
Registered Apprenticeship or other trades certificate or diploma
4
College, CEGEP or other non-university certificate or diploma
5
University certificate or diploma below bachelors level
6
Bachelor’s degree
7
Post graduate degree above bachelors level
8
[DO NOT READ] Prefer not to answer
99
D6. What is your mother tongue, that is, the language you first learned at home?
(DO NOT READ)
[CODE ONE ONLY]
English
1
French
2
Other (SPECIFY____________)
8
DK/NR (VOLUNTEERED)
99
D7. Which of the following categories best describes your total household income? That is, the total income of all persons in your household combined, before taxes? [READ - CODE ONE ONLY]
Under $20,000
1
$20,000 to just under $40,000
2
$40,000 to just under $60,000
3
$60,000 to just under $80,000
5
$80,000 to just under $100,000
6
$100,000 to just under $150,000
7
$150,000 and above
8
[DO NOT READ] Refused
99
D8. Which of the following categories best describes your current employment status? Are you…? [READ - CODE ONE ONLY]
Working full-time (35 or more hours per week)
1
Working part-time (less than 35 hours per week)
2
Self-employed
3
Unemployed, but looking for work
4
A student attending school full-time
5
Retired
6
Not in the workforce (Full-time homemaker or unemployed but not looking for work
7
Other employment status
8
[DO NOT READ] Refused
99
Those are all the questions I have for you today. Thank you for your time on this important study! The results, once compiled, can be found on the Library and Archives website. [ IF ASKED: at https://www.bac-lac.gc.ca/].