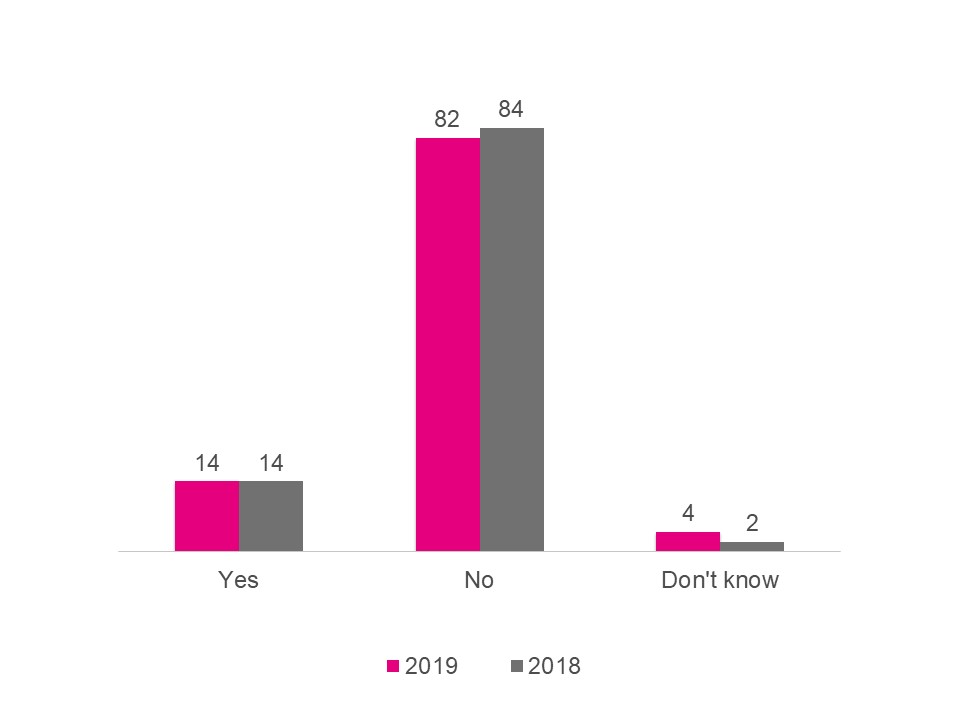
This bar graph shows the proportion of people who have experienced problems related to TV service calls. The 1107 respondents who subscribe to a TV service in the 2019 survey answered as follows:
The 1096 respondents who subscribe to a TV service in the 2018 survey answered as follows: