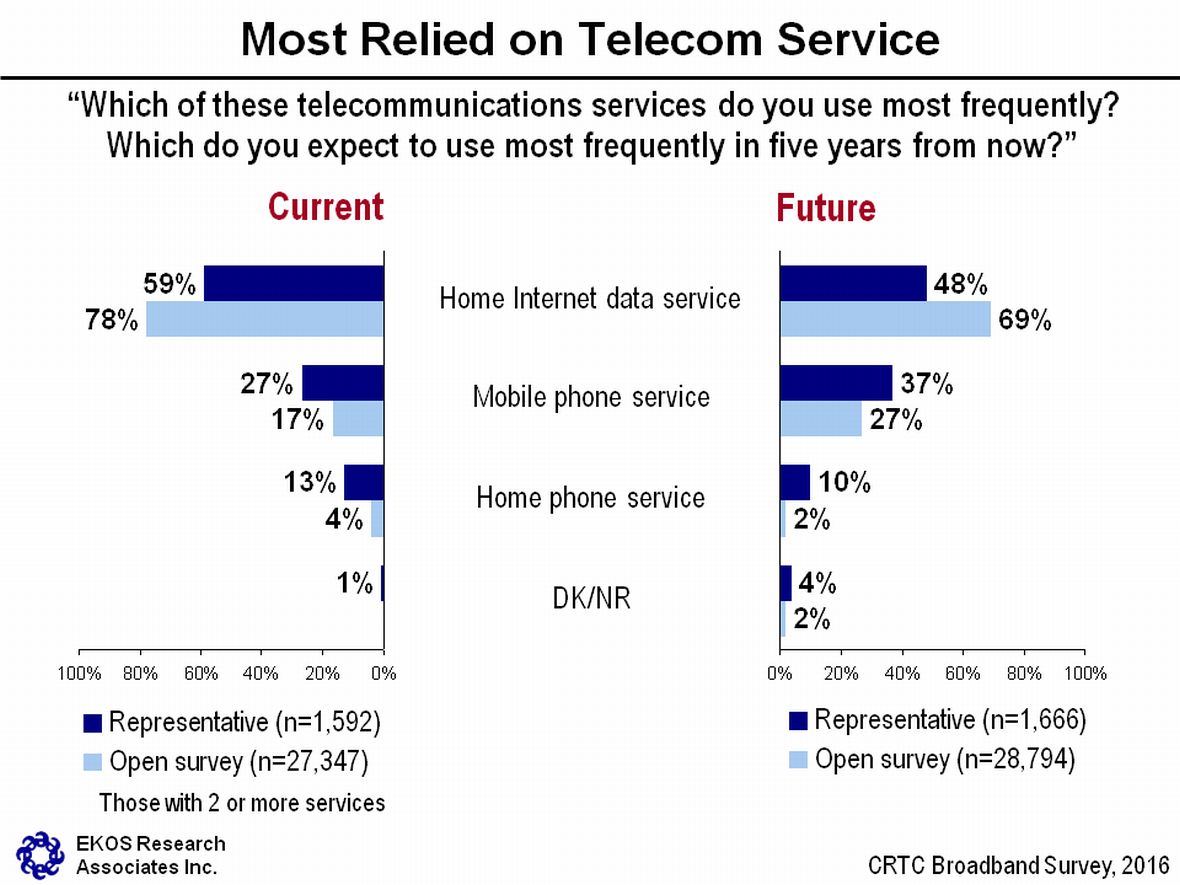
This figure titled “Most Relied on Service” contains two horizontal bar graphs. For both the representative and open surveys, they show the breakdown of answers to the question, “Which of these telecommunications services do you use most frequently? Which do you expect to use most frequently in five years from now?” The first bar graph deals with the services that are used most currently, and the second bar graph deals with the services that are expected to be used most frequently in the future. The 1,592 respondents who answered about current use, and the 1,666 who answered about future use in the representative survey, all of whom have home Internet, answered as follows:
The 27,347 respondents who answered about current use, and the 28, 794 who answered about future use in the open survey, all of whom have home Internet, responded as follows:
Source: CRTC Broadband Survey, 2016