Submitted to:
Canadian Radio-television and Telecommunications Commission
PWGSC Contract #82082160225/001/CY
POR Registration #82082-160225
Contract Award Date: January 8, 2016
EKOS Research Associates Inc.
March 18, 2016
www.ekos.com
The goal of the current study is to understand which telecommunications services are necessary for Canadians to participate in the digital economy, and what part the CRTC should play in ensuring that all Canadians have the access they need. Two sample sources were used to gather survey results profiling Internet service and use (a representative panel sample, and an open link advertised on the CRTC website and in social media). It is noteworthy that 28,794 Canadians participated in the open link indicating the strong interest in this topic across the country. A series of focus groups and interviews were also held with residents of rural communities that were identified as under-served to further understand the daily needs and opinions of those with the least access.
Survey evidence highlights widespread subscription to home Internet, mobile and home telephone services. Further, while one in five do not have home telephone service, only half as many do not have a mobile phone. The majority receive home Internet service through cable, however, rural residents are considerably more likely to have Internet service delivered through telephone line, satellite, or fixed wireless. Although many do not know their download speed or monthly data transfer capacity, the large majority of those who do report unlimited Internet and download speeds over 25 Mbps. Dramatically lower download speeds and monthly caps are reported by residents in rural areas.
Exploring the types and frequency of activities Canadians participate in online, and comparing results with a Statistics Canada survey taken in 2010, shows a dramatic increase in online engagement over the last five years. Participation in the majority of activities has increased by 50 per cent or more, and in some cases 100 per cent or more (e.g. downloading software, making online video calls, researching investments, and contributing content in discussions). Rural focus group and interview participants described use of the Internet to stay connected to the world through news websites, staying in touch with family and friends using Skype and social media, online banking, education, employment, and finding products and services that are not readily available in the community (e.g. health services).
Just over one in five Canadians in the representative survey said that they have limited their use of Internet services at some point in the last 12 months, although this is considerably more prominent in rural areas. Among Canadians in the open survey this skyrockets to over half. By far, the most common reasons given for limiting Internet use are cost and capacity. Discussion participants from rural and underserved areas spoke at length about needing to limit their Internet use as a result of speed, capacity, or both. Many described difficulties using websites with pictures or using flash, streaming video, uploading and downloading documents, playing games online and making online video calls.
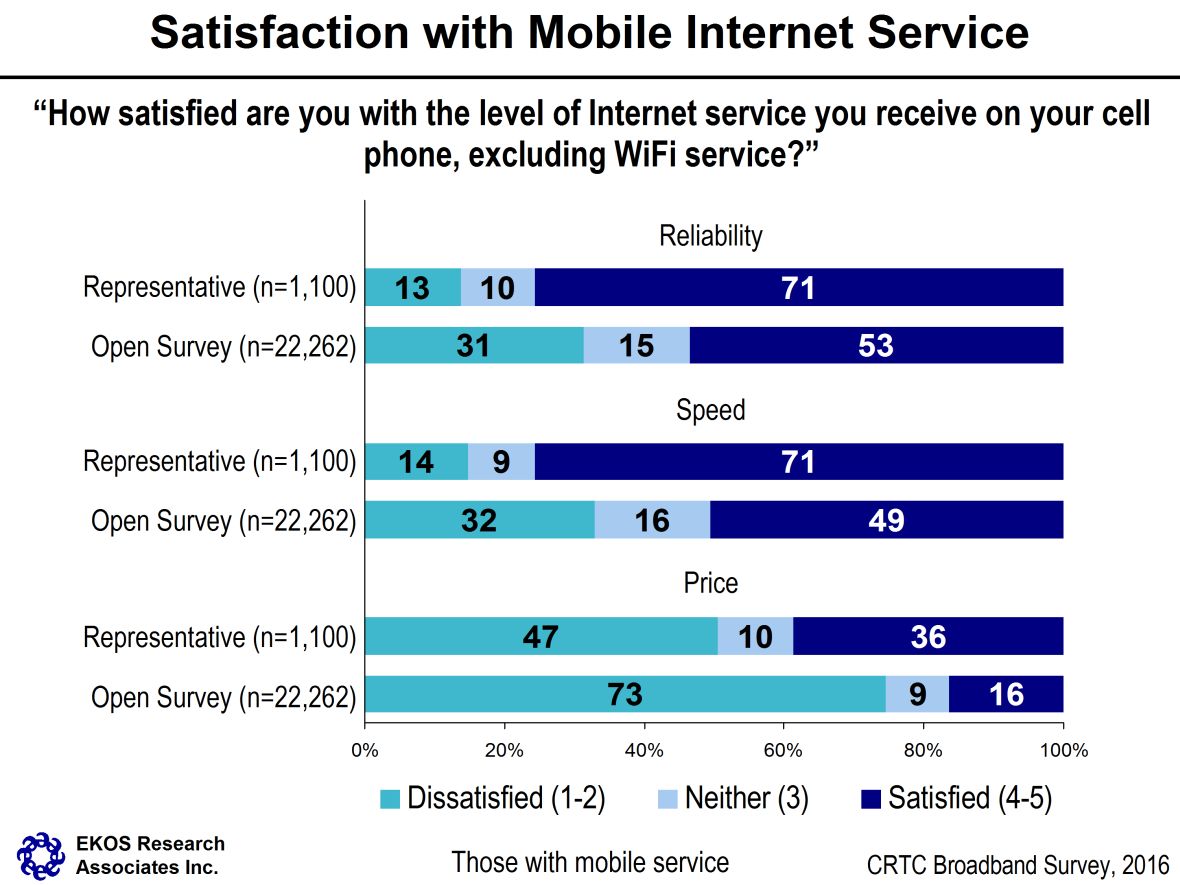
Seven in ten Canadians or more from the representative survey, are satisfied with the reliability and speed of their home Internet service, and only one in five or fewer are dissatisfied. Contrastingly, Canadians are far less positive about the price of their home internet service. Only about one in three respondents reported satisfaction with price, while half said they are dissatisfied. Consumers who have limited their online activity due to cost or capacity, particularly rural residents, are the most likely to be dissatisfied on each of the dimensions. In terms of mobile service satisfaction, consumers’ views are remarkably similar to their feelings about home Internet service.
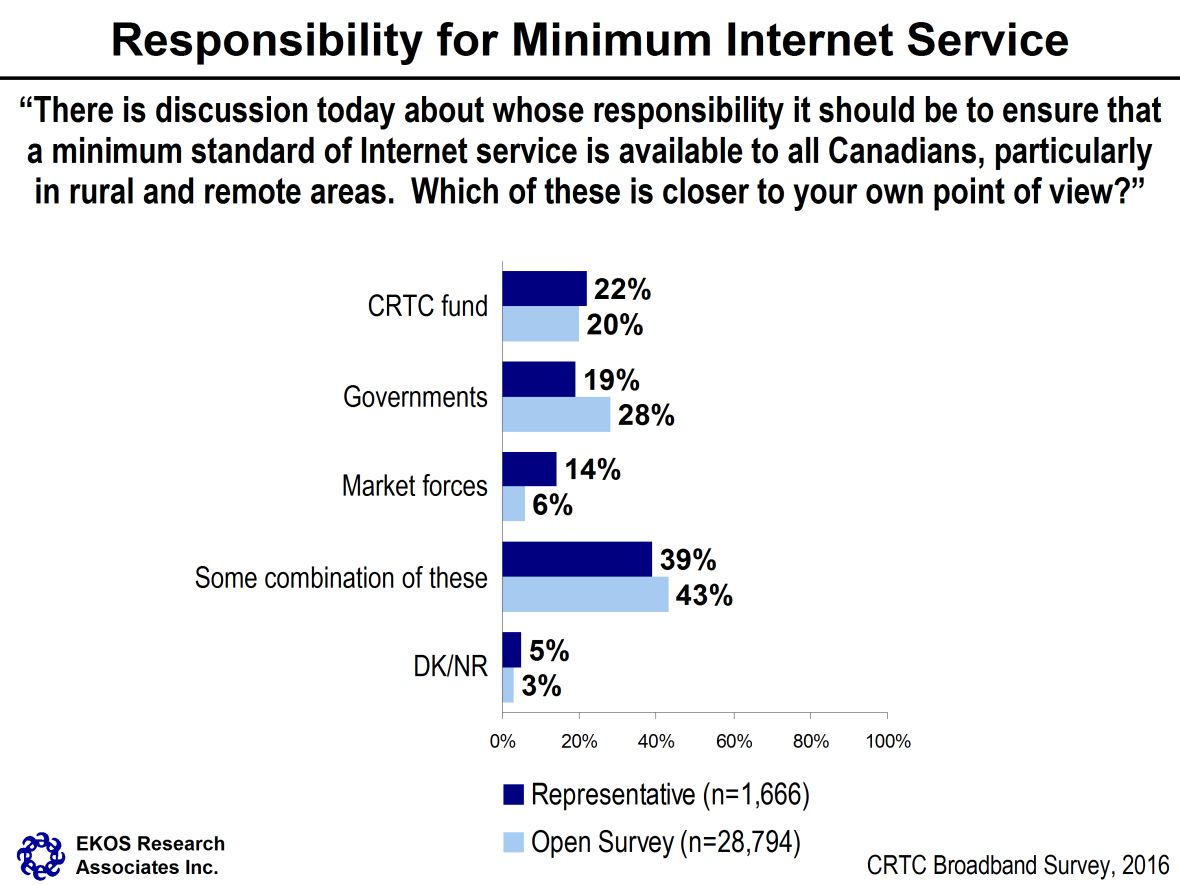
When presented with the idea of a minimum standard of Internet service available to all Canadians, the majority favour a combined effort by service providers, governments and the CRTC to ensure a minimum standard of service. The majority of people believe that market forces alone should not be responsible for delivering this standard level of service.
By and large, Canadians agree that pricing for Internet services in rural and remote areas should be the same as for urban areas of the country. The remainder believe pricing should be only “a little bit higher”, virtually no one believes it should be significantly higher. Naturally, support for equal pricing is higher among rural residents, although there are surprisingly limited differences between urban and rural residents on their views about comparative pricing.
The Canadian Radio-television and Telecommunications Commission is an administrative tribunal that supervises and regulates telecommunications and broadcasting in the public interest and is committed to ensuring that Canadians have access to a world class communications system.
Telecommunications play an important role in the lives of all Canadians. Modern telecommunications enable Canadians to participate in today’s digital economy and provide access to services, such as health care, education, government, public safety, and banking services. While modern telecommunications services are available in most areas of Canada, some regions, particularly in rural and remote areas, are affected by limited availability, high cost, and unreliable telecommunications services.
In 2015, the CRTC launched a comprehensive national consultation to examine which telecommunications services are necessary for Canadians to participate meaningfully in the digital economy, and to determine the CRTC’s role regarding the provision of telecommunication services to all Canadians.
The first phase of this consultation began in April 2015, and examined information from industry sources and Canadians in order to determine what telecommunications services are offered across Canada, and to determine what areas, if any, are under-served or unserved.
The second phase of the project began in early 2016, and gathered opinions from Canadians using multiple approaches, including a nationally representative survey and an online opt-in survey, in order to determine the types of telecommunication services necessary for Canadians to participate in the digital economy. The Notice of Consultation invited Canadians “who wish to provide further views beyond the questionnaire may submit interventions on the issues and questions identified in the Notice.”
EKOS Research was engaged in this second phase of its national consultation, in which the CRTC sought to understand Canadians’ opinions and needs regarding telecommunications services.
The methodology for this study included two surveys using the same questionnaire. The primary evidence is drawn from a nationally representative survey of 1,666 Canadians 18 years of age and older. The sample source used was the EKOS Probit panel; a pool of pre-screened respondents featuring random rather than opt in recruitment, offering good coverage of the Canadian population. The methodology for the nationally representative survey involved a mixed approach of collecting cases online, and by telephone in order to include those who are not typically online 1. The 13-minute survey was collected early in 2016 with a participation rate of 21 per cent. This survey sample size yields a level of precision of up to +/-2.4 per cent, 19 times out of 20, for the sample overall and +/- 7 to 11 per cent for most sub-groups isolated in the analysis. More detail is presented in Appendix B.
The survey was also made available in an open link announced on the CRTC website and in communications and advertising circulated through social media. The open consultation was completed by 28,794 individuals who accessed the link online or filled out paper copies (mail/fax) between mid-January and the end of February 2016. Given that the respondents were self-selected and therefore do not comprise a random sample, the survey is not considered to be representative of the Canadian population and no margin of error can be applied to the results. This open survey was expected to include a stronger representation of invested consumers of the Internet, including those who are more heavily engaged in online activities and those with higher levels of dissatisfaction with Internet services.
Six focus groups were conducted along with nine individual telephone interviews. Focus groups took place with between five and 11 community residents in each of: Tofino, BC; Slave Lake, Alberta; Kirkland Lake, Ontario; Ottawa, Ontario; Mont Tremblant, Quebec; and Guysborough, Nova Scotia. One focus group was held in each centre. In four of the focus groups (Tofino, Slave Lake, Kirkland Lake, and Guysborough), participants were recruited from a randomly selected sample of residents living within 30 minutes of the centre. In the case of Ottawa, participants were not randomly selected. Instead, sessions were held with ten 18-26 year olds who are residents of communities in Nunavut attending an eight-month college program at Nunavut Sivuniksavut 2. In the case of Mont Tremblant, participants were recruited from the area surrounding, but excluded residents of Mont Tremblant itself. A focus group guide (provided in Appendix C) was developed by EKOS in consultation with the client.
The nine interviews were conducted with residents of Iqaluit, by telephone using the same questions as posed in the focus groups. In total, 57 residents of small, rural or remote communities participated in the qualitative component of the research. The summarized syntheses of findings from this component are presented with survey findings for rural residents in Chapter Three. A series of detailed, illustrative profiles of some individuals who participated in the research is also presented in Appendix D.
When compared with each other and population figures, the two sample sources are fairly representative of the population distribution across the regions of the country, with slight over representations in BC. The representative sample is under represented in Alberta and Quebec, and over represented in the Prairies in terms of who responded to the survey. Both samples are over represented in rural areas of the country compared with the population, which was increased by design in order to maximize the opportunity to look at rural results.
The representative sample has an under-representation in the 35 to 54 age cohort in terms of who responded to the survey, and an over-representation in the 55 to 64 cohort, and a slight over-representation in the 65 and over segment of the population. Both samples under-represent those with a high school level of education in terms of who responded to the survey, and over-represent those with university levels of education.
|
Representative Survey
(n=1,666) |
Open Survey
(n=28,794) |
Population
(18+) |
|
|---|---|---|---|
| Region | |||
| British Columbia | 15% | 16% | 13% |
| Alberta | 8% | 12% | 11% |
| Saskatchewan & Manitoba | 9% | 5% | 6% |
| Ontario | 37% | 33% | 38% |
| Quebec | 21% | 22% | 24% |
| Atlantic | 9% | 10% | 8% |
| Territories | .4% | .3% | .3% |
| Urban/Rural | |||
| Urban | 71% | 71% | 83% |
| Rural | 29% | 29% | 17% |
| Age | |||
| <35 | 26% | 32% | 28% |
| 35-54 | 23% | 37% | 37% |
| 55-64 | 28% | 17% | 16% |
| 65+ | 23% | 11% | 19% |
| Gender | |||
| Male | 49% | 66% | 48% |
| Female | 51% | 29% | 52% |
| Education | |||
| High school or less | 19% | 15% | 43% |
| College, CEGEP or other non-university certificate or diploma | 37% | 32% | 32% |
| University | 43% | 49% | 27% |
Based on a comparison of the representative sample to the population, the representative survey results were weighted to adjust for age, region and gender. All results presented in this report are based on weighted percentages, with the exception of the previous table (Table 1.1), which provides unweighted results for the representative survey. Results were not weighted for the open survey sample.
One in six members of the sample in the representative survey (17 per cent) reported household incomes of under $40,000. One in four said that they have a household income that is between $40,000 and $80,000. Slightly fewer (23 per cent) report incomes of $80,000 to $120,000, and 21 per cent said their combined household income is $120,000 or higher. The income profile of individuals responding to the open survey is very similar. There may be a slightly lower representation from households with incomes under $40,000, however, this may simply be a result of a higher segment that “preferred not to say”.
Just over four in ten members of the representative sample are working full-time (42 per cent). Considering full-time and part-time work, as well as self-employment, 59 per cent are in the work force. In the open survey this is 69 per cent. Students and those who are unemployed make up eight per cent, and another five per cent are not in the work force. These segments are slightly smaller in the open survey. The representative survey also includes 24 per cent who are retired (16 per cent in the open survey).
Household sizes are relatively similar in the two surveys, although slightly more live alone in the representative survey (19 per cent) and slightly fewer are two and three person families (54 per cent). There is a considerably younger profile of children in the homes of parents found in the representative survey, compared with the open survey, where more of the children in the home are 18 or older.
|
Representative Survey
(n=1,666) |
Open Survey
(n=28,794) |
|
|---|---|---|
| Total Annual Household Income | ||
| Under $20,000 | 6% | 4% |
| $20,000 to just under $40,000 | 11% | 10% |
| $40,000 to just under $60,000 | 13% | 13% |
| $60,000 to just under $80,000 | 12% | 13% |
| $80,000 to just under $100,000 | 13% | 13% |
| $100,000 to just under $120,000 | 10% | 10% |
| $120,000 to just under $150,000 | 9% | 8% |
| $150,000 and above | 12% | 11% |
| Prefer not to answer | 14% | 19% |
| Current Employment Status | ||
| Working full-time (35 or more hours per week) | 42% | 53% |
| Working part-time (less than 35 hours per week) | 7% | 6% |
| Self-employed | 10% | 10% |
| Student attending full time school (not working) | 3% | 4% |
| Unemployed, but looking for work | 5% | 3% |
| Not in the workforce | 5% | 2% |
| Retired | 24% | 16% |
| Other | 3% | 2% |
| Prefer not to answer | 1% | 4% |
| Household Size | ||
| 1 person | 19% | 14% |
| 2 - 3 | 54% | 58% |
| 4 or more | 26% | 25% |
| Prefer not to answer | 1% | 4% |
| Children’s Ages | ||
| Under 5 | 36% | 25% |
| 5 to 11 | 40% | 31% |
| 12 to 17 | 26% | 29% |
| 18 to 24 | 29% | 41% |
| Prefer not to answer | 1% | 2% |
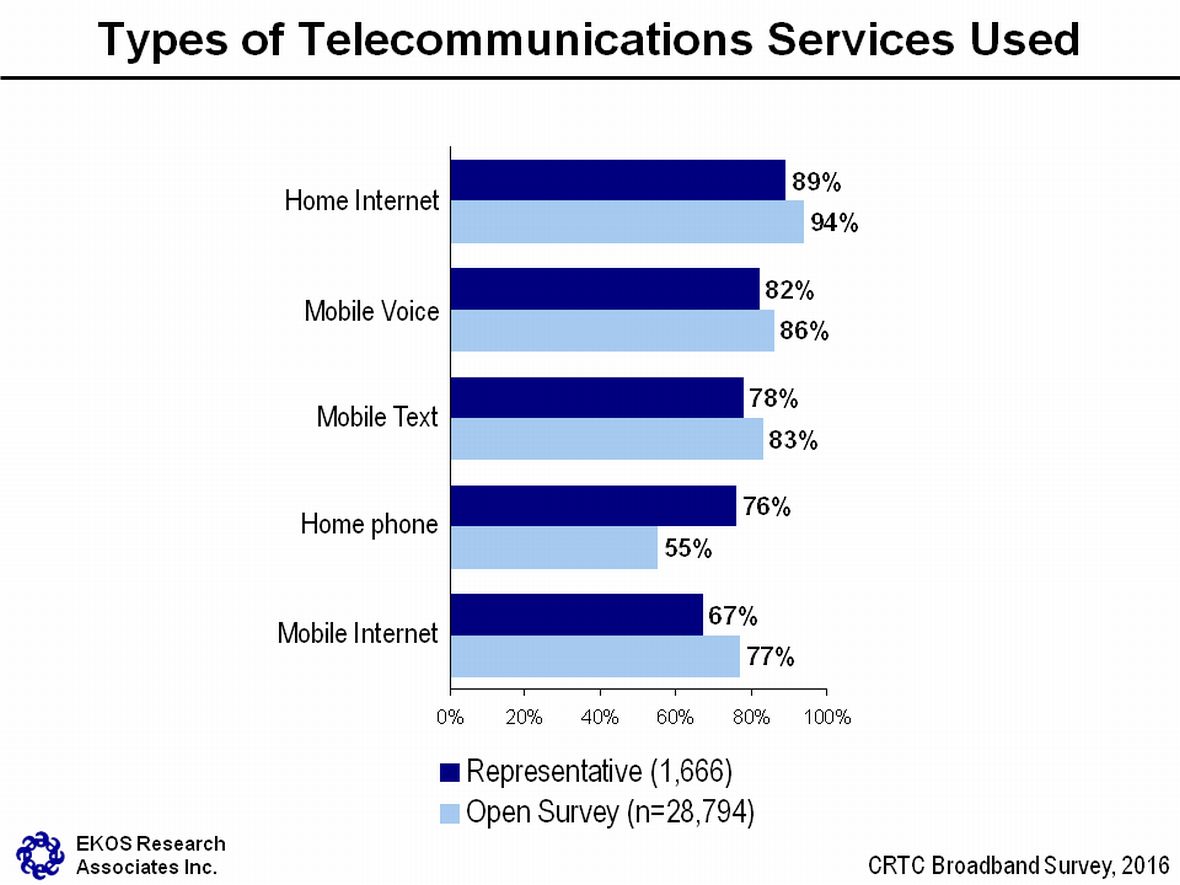
Just over four in ten Canadians have a home telephone and home Internet service and full mobile service (talk, text and data), while one in five have home Internet service and full mobile service, but no home telephone service.
Households subscribing to each of the telecommunications services are more common among those with an income of $80,000 or higher.
One in five respondents in the Territories have only a home telephone, but no home Internet and no mobile phone.
In order to understand respondents’ experiences with telecommunications services, the survey first asked if respondents subscribe to each of home telephone service, home Internet data service and/or mobile phone service, including voice text, and/or data service. Exploring combinations of tele-communications services Canadians have, results from the representative survey indicate that four in ten households subscribe to all five of these services (43 per cent). Another one in five have full mobile phone service (i.e., voice, text and data), but they do not have home telephone service. Seventeen per cent have home telephone, and mobile phone service for voice and text, but they do not have a mobile data plan, although most have home Internet. Ten per cent have home Internet and home telephone, but no mobile. Eleven per cent overall do not have Internet at home.
In the open survey, fewer have all five services, although this describes just over one in three (36 per cent). The same proportion (38 per cent) has no home telephone, but full mobile service, which is almost twice as large a proportion as found in the representative survey. Just over one in ten has a mobile phone, but without data service (11 per cent). Only seven per cent have no mobile phone.
In the representative survey the incidence of having all five services is highest in Alberta (61 per cent) and the Territories (59 per cent). In the Territories this is largely driven by the near universal ownership of a home telephone, likely because cell phone service and home Internet are less reliable.
Households with mobile phone service only (i.e., no home telephone) is highest among those under 35) where 38 per cent rely on mobile phone service only (no home telephone). This is also more often the case in Ontario (25 per cent) and among households with incomes of $120,000 or higher.
Not having a mobile phone or not having a data plan for a mobile phone are more common in households reporting less than $40,000.
One in five respondents in the representative survey who live in the Territories have only a home telephone, but no home Internet and no mobile phone.
| Representative Survey (n=1,666) | Open Survey (n=28,794) | |||||||
|---|---|---|---|---|---|---|---|---|
| All services | No home telephone | No mobile data | No home Internet | All services | No home telephone | No mobile data | No home Internet | |
| Overall | 43% | 24% | 33% | 11% | 36% | 45% | 22% | 5% |
| Region | ||||||||
| British Columbia | 40% | 27% | 31% | 14% | 32% | 50% | 21% | 4% |
| Alberta | 61% | 18% | 15% | 8% | 39% | 53% | 11% | 3% |
| Saskatchewan & Manitoba | 47% | 18% | 33% | 10% | 40% | 45% | 16% | 6% |
| Ontario | 38% | 30% | 32% | 8% | 35% | 49% | 19% | 4% |
| Quebec | 38% | 21% | 44% | 16% | 32% | 38% | 33% | 10% |
| Atlantic | 53% | 21% | 25% | 6% | 42% | 34% | 27% | 5% |
| Territories | 59% | 0% | 37% | 21% | 43% | 41% | 21% | 5% |
| Age | ||||||||
| Under 35 | 37% | 43% | 21% | 11% | 26% | 67% | 11% | 3% |
| 35-49 | 58% | 20% | 22% | 9% | 41% | 45% | 17% | 4% |
| 50-64 | 42% | 18% | 39% | 14% | 42% | 29% | 31% | 8% |
| 65 or older | 32% | 8% | 57% | 10% | 34% | 20% | 47% | 9% |
| Income | ||||||||
| $40,000 or less | 19% | 27% | 56% | 26% | 19% | 51% | 37% | 8% |
| $40,000-$80,000 | 37% | 24% | 39% | 11% | 29% | 49% | 25% | 6% |
| $80,000-$120,000 | 56% | 24% | 20% | 6% | 40% | 46% | 16% | 4% |
| $120,000 or higher | 56% | 28% | 14% | 6% | 48% | 42% | 11% | 4% |
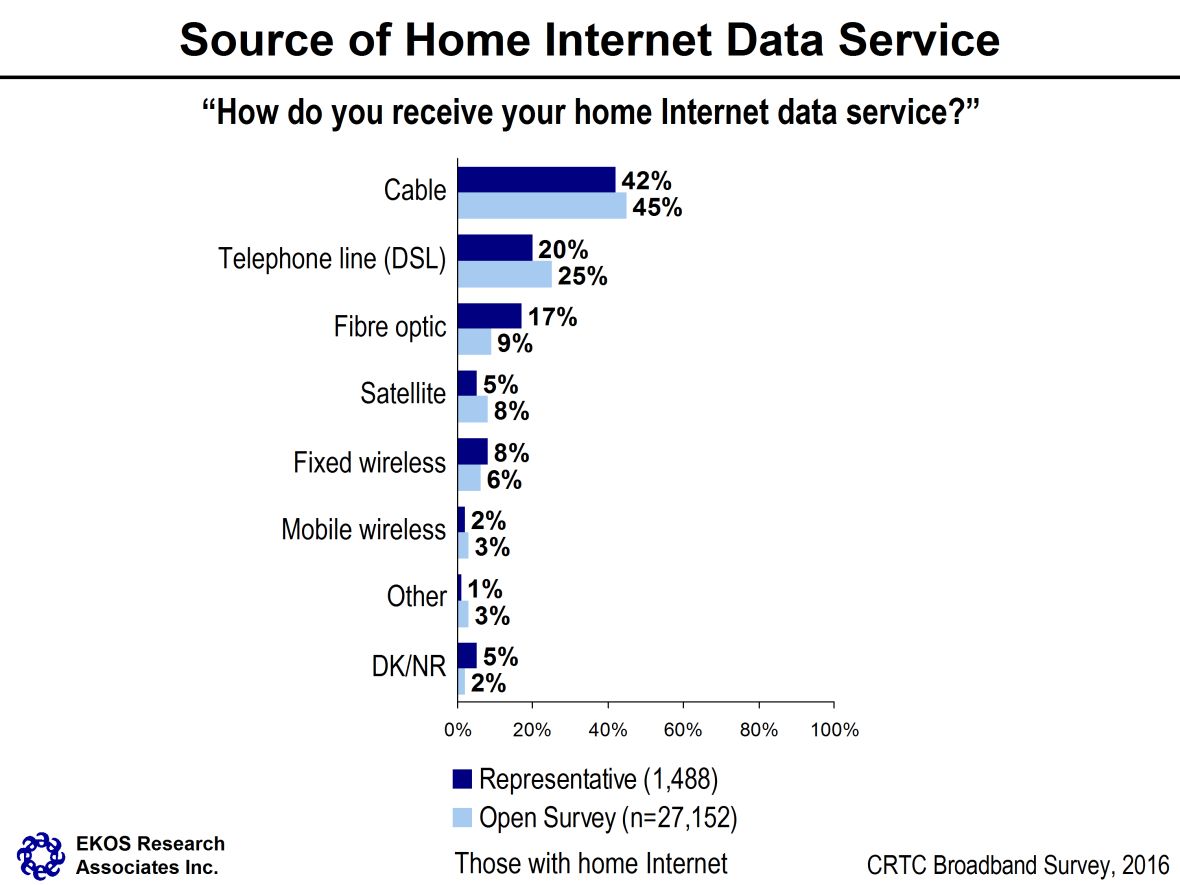
Almost four out of five Canadians reported that they receive their home Internet data service through cable (42 per cent), telephone line (20 per cent) or fibre optic cable (17 per cent).
Home Internet delivered by cable (48 per cent) or fibre optic cable (19 per cent) is more common among urban residents, while rural residents more often use services delivered through telephone line (33 per cent), satellite (10 per cent) or fixed wireless (12 per cent).
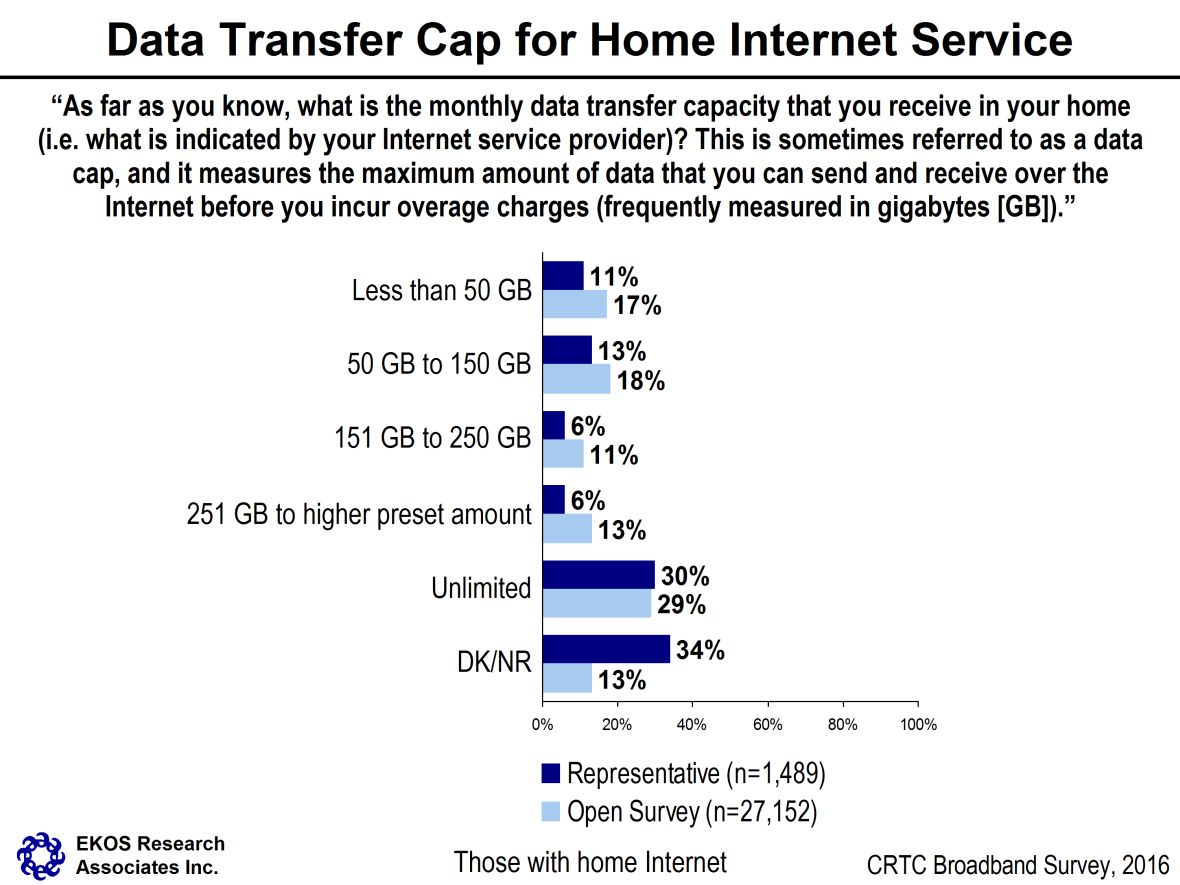
While the majority of respondents do not know their capacity (34 per cent), most of those who do, reported unlimited service (30 per cent).
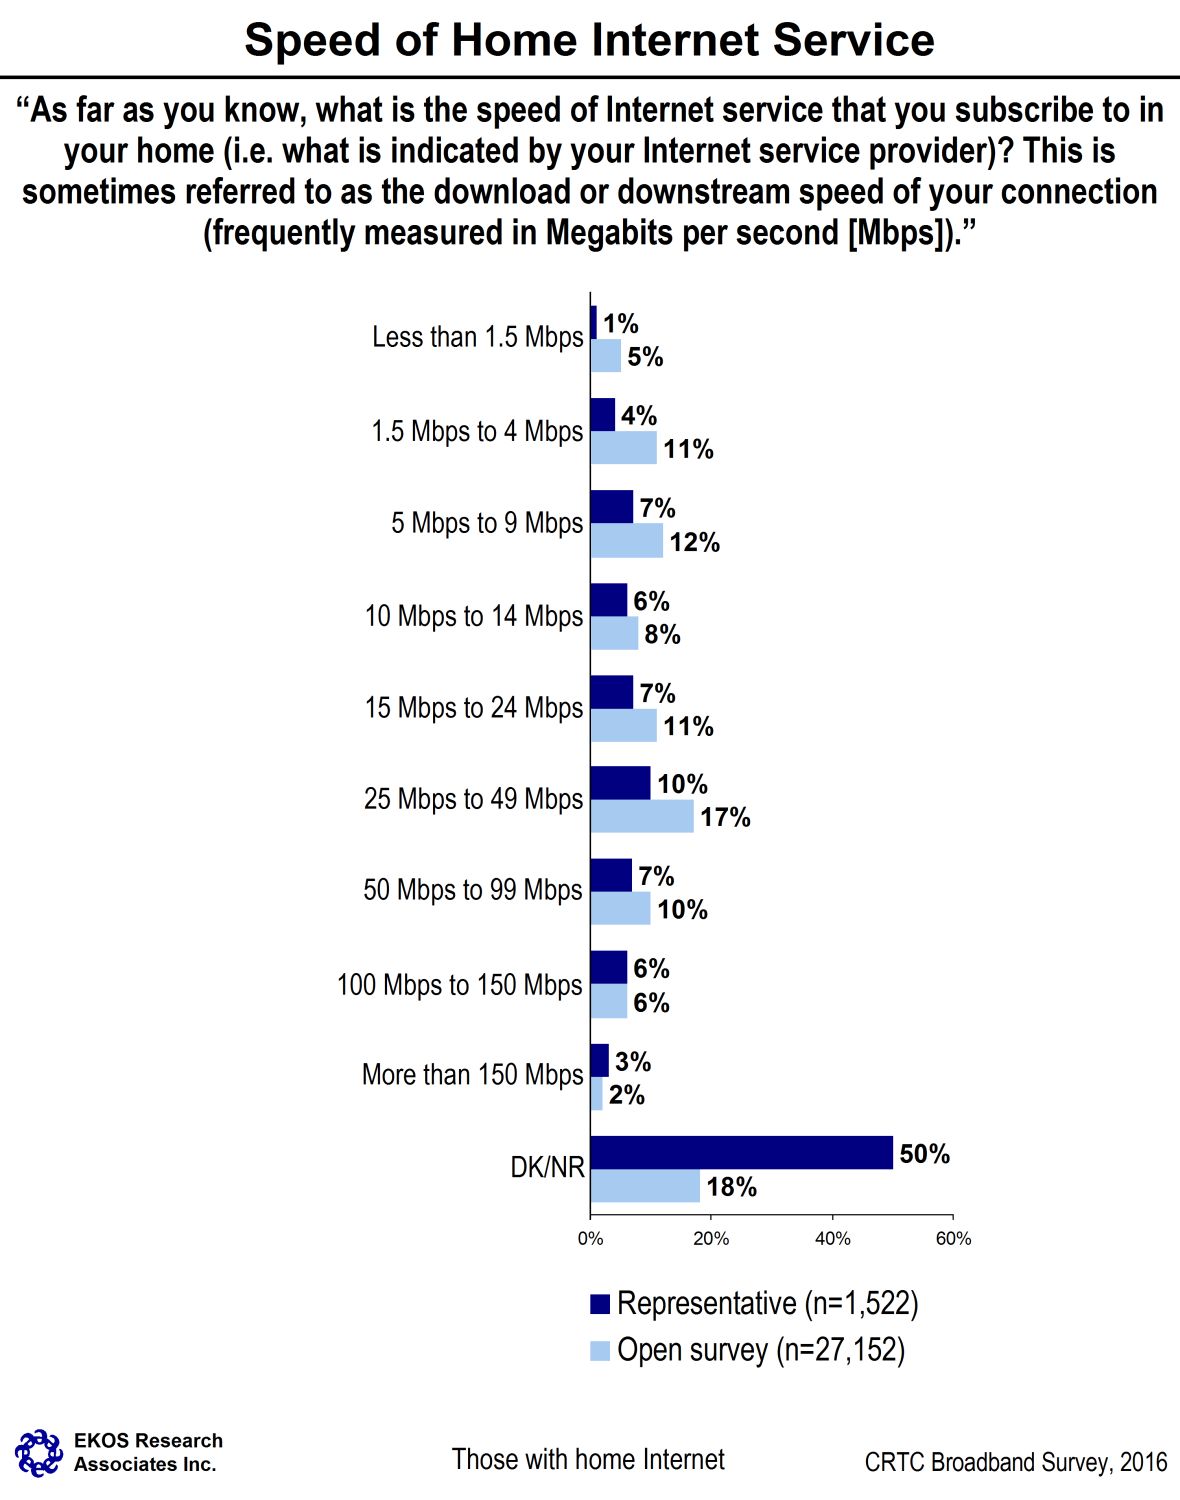
Similarly, half of Canadian consumers do not know their download speed. Among those who do, about a third report it to be under 15 Mbps, while a third report it to be 15 to 50 Mbps, and a third report it to be faster than 50 Mbps.
The lowest monthly caps were reported by rural residents, with one in three reporting caps of 150GB or less. Similarly, most reported download speeds of less than 10Mbps.
Service by phone line or satellite, featuring slower speeds and lower data caps are far more prominent in the Territories.
Both respondents to the representative survey and the open survey were first asked to indicate how they receive their home Internet data service. As shown in the chart below, cable is the main source for receiving Internet service into the home, followed by telephone line. As indicated by the dark bars, 42 per cent of respondents to the representative survey said that they receive Internet service through cable, and another 20 per cent indicated telephone line as the source for their home Internet service. Fibre optic is a close third option according to 17 per cent. Fixed wireless is used by eight per cent of respondents and another two per cent rely on mobile wireless. Five per cent of Canadians receive their Internet signal through satellite according to the representative survey. (Another five per cent do not know and one per cent said something else or did not provide enough information to accurately categorize their Internet source.)
In the open survey, as portrayed by the lighter colour bars in the chart below, there is a higher concentration of households receiving their home Internet by cable (45 per cent) or by telephone line (25 per cent). Households receiving their Internet service through fibre optic cable or through satellite are represented to a much smaller degree in the open survey (nine and eight per cent, respectively). A smaller proportion also obtained their Internet through a fixed wireless configuration.
In the representative survey, individuals who do not have a home telephone are more likely than average to receive their home Internet service by cable (50 per cent).
In terms of geography, there are large differences in the types of services used to receive Internet at home. As shown in the following table, urban residents are considerably more likely than rural residents to receive Internet by cable (48 per cent) or fibre optic cable (19 per cent). Rural residents, on the other hand, are more likely to use services delivered through telephone line (33 per cent), satellite (19 per cent) or, to a lesser extent, fixed wireless (12 per cent).
Cable is the most popular among residents of BC, Quebec, and Ontario compared with others across the country. While fibre optic is reported by roughly 10 to 13 per cent of residents in some regions, 44 per cent of Atlantic residents say that this is how they receive their service, followed by 25 per cent of Quebeckers saying the same. Residents of the Territories are three times more likely than other residents to receive their Internet by telephone line (48 per cent) or directly through satellite (20 per cent).
Generally, these patterns are also found in the open survey with regard to geographic concentrations of use of different methods of receiving Internet at home.
| Representative Survey (n=1,488) | Open Survey (n=27,152) | |||||||||
|---|---|---|---|---|---|---|---|---|---|---|
| Telephone Line (DSL) | Cable | Satellite | Fibre Optic |
Fixed Wire-
less |
Telephone Line (DSL) | Cable | Satellite | Fibre Optic |
Fixed Wire-
less |
|
| Overall | 20% | 42% | 5% | 17% | 8% | 25% | 45% | 8% | 9% | 6% |
| Urban/Rural | ||||||||||
| Urban | 17% | 48% | 2% | 19% | 7% | 23% | 56% | 3% | 10% | 3% |
| Rural | 33% | 18% | 19% | 8% | 12% | 29% | 17% | 20% | 4% | 15% |
| Region | ||||||||||
| British Columbia | 21% | 51% | 5% | 12% | 7% | 25% | 57% | 5% | 5% | 3% |
| Alberta | 18% | 36% | 9% | 10% | 15% | 24% | 49% | 6% | 8% | 7% |
| Saskatchewan & Manitoba | 24% | 35% | 2% | 13% | 13% | 38% | 30% | 8% | 7% | 9% |
| Ontario | 20% | 46% | 5% | 13% | 8% | 26% | 47% | 6% | 6% | 6% |
| Quebec | 13% | 47% | 3% | 25% | 3% | 20% | 45% | 11% | 11% | 5% |
| Atlantic | 18% | 23% | 3% | 44% | 6% | 25% | 24% | 8% | 21% | 13% |
| Territories | 48% | 24% | 20% | 0% | 6% | 33% | 35% | 18% | 1% | 3% |
Although 34 per cent of Canadians in the representative sample are not familiar with their monthly data transfer capacity prior to incurring overage charges, 66 per cent were able to provide this figure, based on what is indicated by their service provider. Therefore, readers should assume that these results are only representative of those who are sufficiently familiar with their service to know their data cap. The large majority of those who could provide a figure said that they do not have a monthly cap (i.e., unlimited use of the Internet). Another six per cent reported their cap prior to overage charges to be in excess of 250 gigabytes (GB) per month, and the same proportion said that their allowance is between 151 and 250 GB. Thirteen per cent said that they have an allotment of between 50 and 150 GB. Eleven per cent of Canadians in the sample, however, said that they have a monthly cap of 50 GB or less before they are charged with overage fees (per GB).
In the open survey it is not surprising to see that those engaged enough in the issue to complete the survey from an open invitation are more apt to know the amount of their monthly cap. Over and above the 13 per cent of participants who do not know, just under three in ten (29 per cent) said that they have unlimited access and another 13 per cent have an allowance in excess of 250 GB. Eleven per cent are allotted more than 150 GB, but capped at 250 GB. A third, however, are capped at 150 GB prior to overage fees, of which just under half of these (17 per cent) are capped at only 50 GB or less. This is considerably higher than found in the representative sample. These results may point to a higher level of participation in the open survey among those with lower monthly transfer caps, or a larger proportion of the representative sample with lower caps are not familiar with this detail about their level of service.
The largest proportions of consumers with Internet received through DSL and fibre optic report unlimited usage, while the fewest satellite customers have unlimited use of Internet. Three in ten consumers in the representative sample with fixed wireless Internet have a cap of 150 GB or less per month, with one-third of these reporting a cap less than 50 GB. Just over four in ten consumers receiving Internet service through satellite have a cap of 150 GB or less per month, with most saying their cap is under 50 GB.
The lowest monthly caps in the representative survey are more often reported by residents in rural areas (34 per cent reporting caps of 150 GB or less, of which two in three say it is under 50 GB).
By far, the groups in the representative survey reporting the lowest caps are found in the Territories where half report a cap of 50 GB or less. In fact, virtually no one from the Territories reports a cap of more than 150 GB. Residents of the Atlantic Provinces are the most likely to report unlimited capacity for transfer, followed by Ontario where almost half report a cap of 250 GB or higher (including those with unlimited use).
In terms of demographic patterns, age is a key factor. Almost half (46 per cent) of those under 35 in the representative survey report a cap of 250 GB or higher (including those with unlimited use).
| Representative Survey (n=1,489) | ||||||
|---|---|---|---|---|---|---|
|
Less than
50 GB |
50 GB to
150 GB |
151 GB to 250 GB | 251 GB to higher preset amount | Unlimited | Don't know / No response | |
| Overall | 11% | 13% | 6% | 6% | 30% | 34% |
| Home Internet Services | ||||||
| Phone DSL | 15% | 14% | 4% | 6% | 35% | 26% |
| Cable | 8% | 13% | 8% | 9% | 27% | 37% |
| Satellite | 33% | 10% | 3% | 2% | 21% | 31% |
| Fibre optic | 9% | 11% | 4% | 6% | 40% | 30% |
| Fixed wireless | 10% | 21% | 6% | 3% | 27% | 33% |
| Urban/Rural | ||||||
| Urban | 8% | 13% | 6% | 7% | 29% | 36% |
| Rural | 22% | 12% | 4% | 4% | 32% | 26% |
| Region | ||||||
| British Columbia | 7% | 12% | 4% | 7% | 14% | 57% |
| Alberta | 8% | 19% | 10% | 4% | 17% | 42% |
| Saskatchewan & Manitoba | 5% | 7% | 2% | 2% | 38% | 46% |
| Ontario | 8% | 12% | 8% | 11% | 36% | 26% |
| Quebec | 15% | 16% | 5% | 4% | 29% | 30% |
| Atlantic | 4% | 5% | 2% | 1% | 46% | 41% |
| Territories | 52% | 14% | 2% | 0% | 0% | 31% |
Patterns in the open survey are similar with regard to the caps associated with different Internet services, and those offered in urban and rural areas. The pattern is also the same with regard to age. Further, almost half of 35 to 49 year olds also report caps of 250 GB or higher (including unlimited use).
There is also a dichotomy in residents of the Atlantic and Quebec that report either unlimited use in the open survey (30 per cent in Quebec and 50 per cent in the Atlantic), or a cap of less than 150 GB (44 per cent in Quebec and 24 per cent in the Atlantic).
Again, in the open survey it is residents of the Territories that report almost exclusively lower caps of 150 GB or less, with half (52 per cent) saying that they have a cap of 50 GB or less.
Respondents in the representative survey are even less likely to know the download speed 3 of their Internet than their monthly transfer allotment, so the results of this question are not indicative of Canadian’s actual subscriptions. Half were unable to provide the speed of their Internet. Five per cent indicated this speed to be less than five megabits per second (Mbps), while another 13 per cent said that it is between 5 Mbps and 15 Mbps, and another seven per cent reported it to be between 15 and 25 Mbps. Ten per cent can download at 25 to 50 Mbps, seven per cent say that their speed is 50 to 100 Mbps, and nine per cent say that their speed is in excess of 100 Mbps.
Again, considerably more respondents in the open survey can provide information about their download speed. Naturally then, results point to higher proportions than the representative survey in almost all categories of Internet speed, simply because a larger proportion are responding across the board. One in six place it at less than five Mbps, and one in five report it to be between five and 15 Mbps. Another 11 per cent say that their speed is between 15 and 25 Mbps, 17 per cent place it at 25 to 50 Mbps, and 10 per cent say that it is between 50 and100 Mbps. The remaining eight per cent have a download speed in excess of 100 Mbps.
In the representative survey, consumers with cable and fibre optic Internet service subscribe to the fastest downloads speeds. The largest segment of those receiving their Internet through phone line subscribe to downloads speeds of less than 10 Mbps, which is also true of those relying on fixed wireless. The largest proportion of those relying on satellite delivery report their speed to be less than 5 Mbps.
Internet speed and monthly data transfer cap also go hand in hand. More than half of those reporting data caps of less than 50 GB in the representative survey also subscribe to download speeds of less than 10 Mbps. The largest majority of consumers reporting caps of 50 to 150 GB place their download speed between 10 and 50 Mbps. Those with very high or no data caps generally subscribe to download speeds in excess of 50 Mbps.
Speeds reported in urban areas are similarly faster, compared with speeds reported in rural areas. In fact, most of the rural residents who can report their download speed place it under 10 Mbps, while most of their urban counterparts say their speed is in excess of 25 Mbps.
| Representative Survey (n=755) | Open Survey (n=22,374) | |||||||
|---|---|---|---|---|---|---|---|---|
| <5 Mbps | 5-14 Mbps | 15-49 Mbps | 50+ Mbps | <5 Mbps | 5-14 Mbps | 15-49 Mbps | 50+ Mbps | |
| Overall | 10% | 24% | 34% | 31% | 20% | 25% | 34% | 21% |
| Home Internet Service | ||||||||
| Phone DSL | 18% | 36% | 29% | 16% | 26% | 35% | 29% | 10% |
| Cable | 4% | 19% | 41% | 36% | 6% | 19% | 47% | 29% |
| Satellite | 45% | 33% | 11% | 11% | 52% | 37% | 6% | 6% |
| Fibre optic | 1% | 17% | 40% | 42% | 3% | 11% | 35% | 51% |
| Fixed wireless | 26% | 27% | 17% | 29% | 58% | 29% | 9% | 4% |
| Rural/Urban | ||||||||
| Urban | 5% | 22% | 37% | 36% | 11% | 22% | 41% | 26% |
| Rural | 31% | 36% | 18% | 15% | 47% | 33% | 13% | 7% |
| Monthly Data Transfer Capacity (GB) | ||||||||
| Under 50 | 30% | 43% | 22% | 5% | 54% | 30% | 12% | 5% |
| 50-150 | 12% | 27% | 37% | 23% | 18% | 37% | 35% | 10% |
| 151-250 | 6% | 27% | 33% | 34% | 6% | 17% | 56% | 20% |
| 251 or higher | 2% | 7% | 44% | 47% | 3% | 9% | 49% | 39% |
| Unlimited | 8% | 22% | 33% | 38% | 16% | 24% | 31% | 30% |
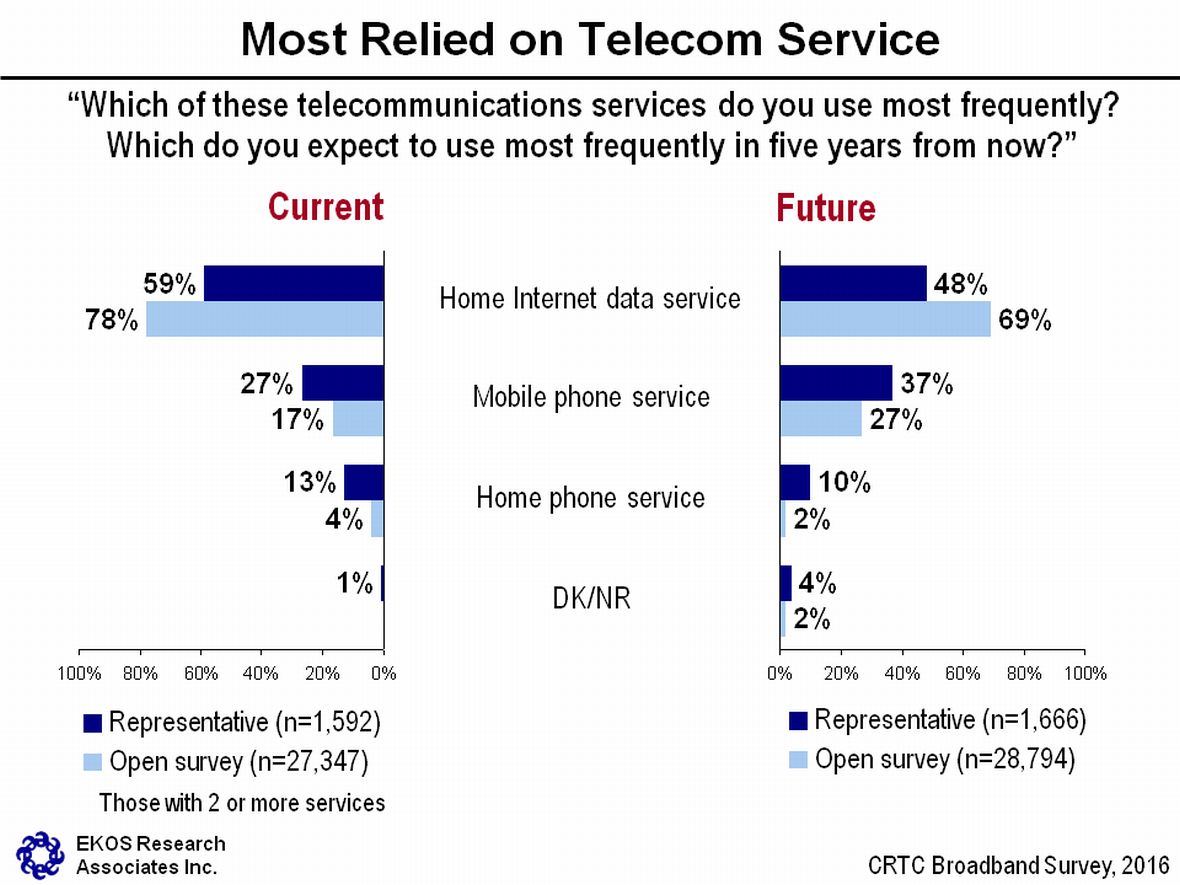
More than half of Canadians report using their home Internet data service the most, and expect to continue using it most often five years from now. There is a slight shift anticipated to reliance on mobile phone service in the future (from 27 per cent to 35 per cent).
Expected future reliance on a cell phone is more prominent among rural residents.
Reliance on a home telephone is most concentrated among senior citizens (31 per cent) and those reporting household incomes of under $40,000 (22 per cent) in the representative survey.
According to the representative survey, 59 per cent of people with some Internet service use their home Internet service most frequently. Another one in four (27 per cent) use their mobile service most frequently and 13 per cent use their home telephone the most. The response to the open survey shows a higher concentration of individuals that rely on their home Internet service (78 per cent), and very few that rely on their home telephone over home or mobile Internet access.
When asked about expected future use in five years from now, results from the representative survey reveal an expected increasing reliance on mobile access to the Internet (37 per cent from 27 per cent now), and few expect to rely on their home telephone (moving to 10 per cent from 13 per cent). The shift from home access to mobile access is similar in the open survey.
Results from the representative survey show some interesting patterns regarding services most frequently used. For example, among those with home telephones, home Internet, and full mobile service including talk, text and data, 61 per cent say they rely most on their home Internet, but 30 per cent rely on their cell the most. Among those with no cell phone (or at least no mobile Internet access) at least two in three rely on their Internet at home the most. Among those with no home telephone, however, reliance is split more evenly between access to the Internet from home or through a mobile.
Among those who are not very active online from the representative survey, there is moderate reliance on home telephones, but Canadians move steadily away from this reliance as they increase their activities online. In fact, among those who are quite heavily engaged online, there is a split in reliance on access to the Internet from home (66 to 68 per cent) or through a mobile (29 to 30 per cent), but virtually none use their home telephone most frequently.
| Representative Survey (n=1,592) | ||||||
|---|---|---|---|---|---|---|
| Most Used Currently | Expected Most Used (in 5 years) | |||||
| Home Internet Service | Mobile Phone Service | Home Phone Service | Home Internet Service | Mobile Phone Service | Home Phone Service | |
| Overall | 59% | 27% | 13% | 48% | 37% | 10% |
| Telecommunications Services | ||||||
| All services | 61% | 30% | 8% | 50% | 43% | 4% |
| No mobile data | 64% | 7% | 28% | 60% | 18% | 16% |
| No mobile phone | 71% | 0% | 28% | 66% | 6% | 21% |
| No home telephone | 50% | 48% | 0% | 37% | 60% | 1% |
| Internet activities during the past 12 months | ||||||
| Low | 49% | 12% | 34% | 39% | 25% | 26% |
| Somewhat low | 63% | 19% | 16% | 54% | 31% | 9% |
| Somewhat high | 66% | 29% | 4% | 55% | 41% | 2% |
| High | 68% | 30% | 1% | 54% | 44% | 2% |
Reliance on a home telephone is most concentrated among senior citizens (31 per cent) and those reporting household incomes of under $40,000 (22 per cent) in the representative survey. Those most apt to use a cell phone most frequently are under 35 (42 per cent), are in the workforce full-time, and report the highest household income (40 and 36 per cent, respectively).
Residents of Alberta in the representative survey are also the most apt to say they use their cell phone the most (38 per cent), while Ontarians stand out in their reliance on Internet from home (65 per cent).
As already described, eight in ten members of the open survey sample described use of their Internet at home the most frequently, so patterns of reliance on home telephones and even cell phones is less prominent, although one in five of those with only cell phones (and no home telephone) describe use of their mobile the most frequently. The concentration of reliance on cell phones is also higher among younger members of the sample, just still less than one in five.
Sample members who live in Manitoba or Saskatchewan (26 per cent), and perhaps surprisingly, in the Territories (22 per cent) are more likely than others in the open survey to say that they use their cell phone most frequently.
In the representative survey, the same patterns are present for anticipated use as exist for current use, but with a slightly stronger lean to cell phone reliance in the future. Those with a cell phone and no home telephone are most apt to say they will use their cell phone (60 per cent). This is followed by those with a home telephone, home Internet and cell phone with voice, text and data (43 per cent say they will rely mostly on their cell phone). There is also increasing reliance expected on mobile access among those most active online. Anticipated cell phone reliance is greater among the youngest, among the employed and most affluent segments of society, and among men compared with women. This is also more prominent in Alberta where 48 per cent say that they will rely mostly on their cell phone in five years.
Interestingly, in the open survey there is more of a difference in expected reliance on cell phones in the future among urban residents compared with rural residents. Residents of Saskatchewan and Manitoba (35 per cent) as well as Alberta (30 per cent) show the strongest enthusiasm for expected cell phone reliance in five years time. Perhaps surprisingly, residents of the Territories (33 per cent) are also more prominent than many others across the country in their belief that they will rely mostly on their cell phone service in the future.
Most of the other demographic patterns (gender, age, socio-economic status) found in the representative survey are also reflected in the open survey.
Online engagement of Canadians has increased dramatically over the last five years. Most activities increased by at least 50 per cent, and some increased 100 per cent or more. In fact, activity has risen four fold in buying and selling online.
Use of government websites, research travel information, research community events, and buy/sell goods and services is more prominent among rural residents.
Downloading software, making telephone and video calls online, researching investments, listening to the radio, employment, participating in discussion groups, and formal education is more concentrated among those with the highest household incomes ($120,000+), compared with those reporting less income.
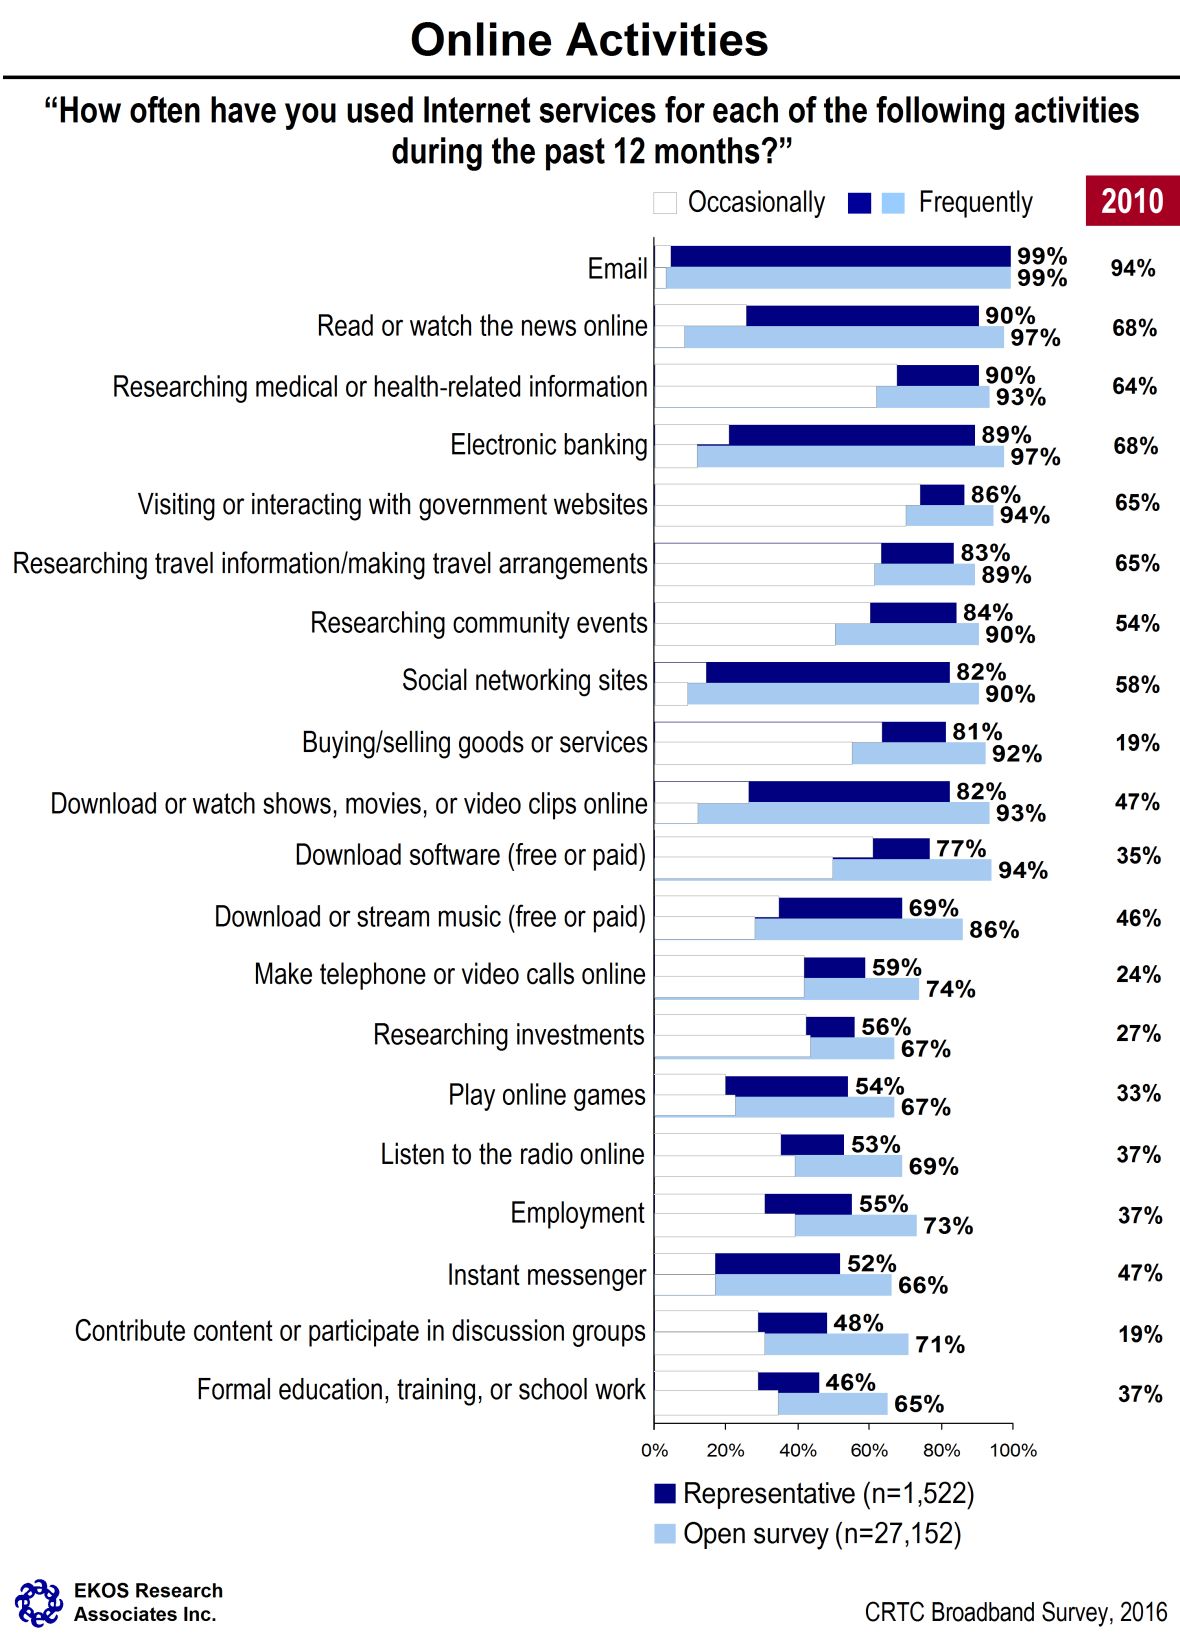
Survey respondents were asked to report whether or not they had engaged in each of 20 activities online in the last 12 months, and if so, whether they engaged in them occasionally (less than once per week) or frequently (once per week or more). In the chart, the percentages at the end of the bars represent the total proportion of respondents indicating some level of engagement in these activities over the last year. The darker section of each bar in the chart indicates the proportion that engage in each activity on a weekly or more frequent basis.
Not surprisingly, results from the open survey paint a significantly more active picture of online activities. Across almost all activities asked about, respondents in the open survey are considerably more likely to be engaged, and more likely to be doing so frequently. The 20 online activities replicated a list used in a 2010 survey conducted by Statistics Canada 5, asking simply whether or not Canadians had engaged in these activities in the last 12 months. The results of the 2010 survey are indicated along the column on the right side of the chart. A comparison highlights the dramatic increase in online engagement over the last five years in all areas with the exception of emailing which was already high in 2010, as well as in instant messaging and formal education or training. In most areas activity has increased by at least 50 per cent. In a few areas it has increased by 100 per cent or more (downloading software, making online video calls, researching investments, and contributing content in discussions). In the case of buying and selling online, the increase is four-fold since 2010.
The most popular activities are email, reading or watching news, and electronic banking, each of which are used by roughly nine in ten Canadians or more, mostly on a frequent basis, according to both the representative and open surveys. Researching health/medical information, travel or community events, as well as visiting government sites are used by 83 to 90 per cent, but much less likely to be engaged in weekly or more frequently. Social networking and downloading videos are activities that eight in ten Canadians do according to the representative survey (nine in ten in the open survey), with most saying that they do these weekly or more frequently. Buying or selling goods and downloading software are also activities reported by about eight in ten in the representative survey (and more in the open survey), but are engaged in less regularly than weekly for the most part. Two in three respondents in the representative survey download or stream music, of which just under half do so weekly or more. The concentration of frequent engagement with music online is much higher in the open survey.
Video calls, researching investments, listening to the radio, and activities related to employment (e.g., working online, looking for work or submitting applications online) are reported by 55 to 59 per cent of Canadians with Internet access, according to the representative survey, with about one-quarter to one-third doing so weekly or more often. Playing games online is equally popular (54 per cent), and engaged in more regularly, with about two in three saying they pay games online frequently. All of these are reported by higher concentrations of respondents in the open survey, who are also more apt to engage in these activities frequently.
Instant messaging, contributing to online discussions, and use of the Internet for education, training, or school work are reported by 45 to 50 per cent of respondents in the representative survey, and much higher proportions of the open survey. Among these three activities, instant messaging is a considerably more regular activity for most.
Following is a table noting key segments most likely to engage in each of the activities frequently (i.e., weekly or more). These key segments are noted in areas related to demographic characteristics (e.g., age, gender, socioeconomic status, as well as geography) and by profile of Internet services (e.g., type of home Internet service, speed of download and data cap).
| Activity | Demographic Information | Telecommunications Profile |
|---|---|---|
|
|
|
| Read or watch news online |
|
|
| Researching Medical or health related information |
|
|
| Electronic banking |
|
|
| Visiting or interacting with government websites |
|
|
| Researching travel information/making travel arrangements |
|
|
| Researching community events |
|
|
| Social networking sites |
|
|
| Buying/selling goods or services |
|
|
| Download or watch shows, movies, or video clips online |
|
|
| Download Software (free or paid) |
|
|
| Download or stream music |
|
|
| Make telephone or video calls online |
|
|
| Researching investments |
|
|
| Play online games |
|
|
| Listen to the radio online |
|
|
| Employment |
|
|
| Instant messenger |
|
|
| Contribute content or participate in discussion groups |
|
|
| Formal education, training, or school work |
|
|
Just over one in five Canadians reported limiting their use of the Internet in the last 12 months, although it was as high as 48 per cent in the Territories, and only 11 per cent in the Atlantic. It was also as high as 49 per cent among those with download speeds of less than 5 Mbps.
There is a dichotomy of response: some limit use due to being active users reaching their monthly cap, others are limited by the quality of service they are able to get.
Limiting use of the Internet is also considerably more common in rural areas compared with urban areas of the country, as well as among those reporting the lowest speeds and data caps.
Residents of the Territories have the highest concentration of limiting their use of the Internet.
The main reasons reported for limiting use overall are cost and capacity, respectively.
Capacity is the main reason reported by rural residents. This is most prominent in the Territories.
Cost plays a more prominent role for households with incomes under $80,000, while more affluent households are more likely to report issues with capacity.
Just over one in five Canadians (22 per cent) in the representative survey said that they have limited their use of Internet services at some point in the last 12 months. Among Canadians in the open survey (i.e., responding from the link online), this skyrockets to over half (56 per cent). Results suggest a dichotomy of limitations, some of which are self-imposed among very active Internet users nearing their monthly data cap, while other more pronounced and acute limitations are experienced by Canadians who are having difficulty with the level of service they are able to obtain.
From the representative survey we see that Canadians most likely to report limiting their use of Internet services are typically those also reporting heavy use of the Internet for a wide range of activities, as well as consumers relying on only their mobile phone for voice communication (i.e., do not have a home telephone).
On the other hand, limiting use is also a more common practice among consumers with lower Internet speeds, particularly those reporting less than 5 Mbps, and those with a monthly data cap of 50 GB or less. This is most often found among Canadians relying on satellite for their Internet service. It is also more often the case among households with four or more family members compared with those with fewer household members.
These same patterns are found, but with higher intensity, among those responding to the open survey. Additionally, those linking to the survey online who rely largely on mobile service are also more likely than others in this sample to report limiting their use of Internet services in the last 12 months.
| % YES | ||
|---|---|---|
|
Representative Survey
(n=1,666) |
Open Survey
(n=28,794) |
|
| Overall | 22% | 56% |
| Telecommunications Services | ||
| All services | 20% | 54% |
| No mobile data | 22% | 54% |
| No mobile phone | 23% | 56% |
| No home telephone | 29% | 58% |
| Type of Home Internet Service | ||
| Phone-DSL | 25% | 54% |
| Cable | 19% | 50% |
| Satellite | 31% | 81% |
| Fibre Optic | 21% | 37% |
| Fixed Wireless | 33% | 73% |
| Speed of Internet service (Mbps) | ||
| Under 5 | 49% | 75% |
| 5-14 | 31% | 60% |
| 15-49 | 23% | 52% |
| 50 or faster | 21% | 44% |
| Monthly data transfer capacity (GB) | ||
| Under 50 | 45% | 78% |
| 50-150 | 25% | 64% |
| 151-251 | 31% | 60% |
| 250 or more | 29% | 55% |
| Unlimited | 16% | 40% |
| Users by Internet enabled devices | ||
| Less than 1 device per person | 24% | 60% |
| Two devices per person | 24% | 57% |
| More than 2 devices per person | 20% | 54% |
| Large household (5+), many devices (5+) | 29% | 62% |
| Internet activities during the past 12 months | ||
| Low | 16% | 52% |
| Moderate | 19% | 50% |
| Moderately high | 24% | 52% |
| High | 30% | 61% |
| Telecommunication services, most frequent | ||
| Home telephone | 25% | 58% |
| Home Internet service | 21% | 55% |
| Mobile Internet Service | 26% | 59% |
In the representative survey, parents with children under the age of five were more likely to report limiting their use of the Internet compared with parents of older children, although this is not a pattern found in the open survey sample, where limitations were reported among parents of children of all ages.
| % YES | ||
|---|---|---|
|
Representative Survey
(n=1,666) |
Open Survey
(n=28,794) |
|
| Household size | ||
| 1 | 21% | 50% |
| 2-3 | 20% | 55% |
| 4 or more | 28% | 60% |
| Children at home and ages (years) | ||
| No children | 20% | 54% |
| Under 5 | 30% | 58% |
| 5-11 | 24% | 59% |
| 12-17 | 25% | 59% |
| 18 years of age or older | 22% | 59% |
Geographically, in the representative survey limited use is most often reported by residents of the Territories, where half say that they have done so in the past 12 months. Limiting use is also reported to a higher than average extent in BC, where more than one-third have limited their use in the last 12 months.
Limiting use of the Internet is also considerably more likely in rural areas compared with urban areas of the country.
These same patterns are found among Canadians responding to the open survey.
| % YES | ||
|---|---|---|
|
Representative Survey
(n=1,666) |
Open Survey
(n=28,794) |
|
| Location | ||
| Urban | 20% | 52% |
| Rural | 34% | 66% |
| Region | ||
| British Columbia | 35% | 57% |
| Alberta | 22% | 56% |
| Saskatchewan/Manitoba | 20% | 50% |
| Ontario | 22% | 57% |
| Quebec | 18% | 54% |
| Atlantic | 11% | 51% |
| Territories | 48% | 90% |
In terms of demographic segments in the representative survey, limiting use of the Internet is more common among Canadians under 35 years of age and the university-educated, both of which are closely tied with higher intensity use of Internet services.
| % YES | ||
|---|---|---|
|
Representative Survey
(n=1,666) |
Open Survey
(n=28,794) |
|
| Age (years) | ||
| Under 35 | 26% | 58% |
| 35-49 | 23% | 57% |
| 50-64 | 20% | 55% |
| 65 or older | 19% | 49% |
| Education | ||
| High school or less | 18% | 53% |
| College | 24% | 56% |
| University | 23% | 57% |
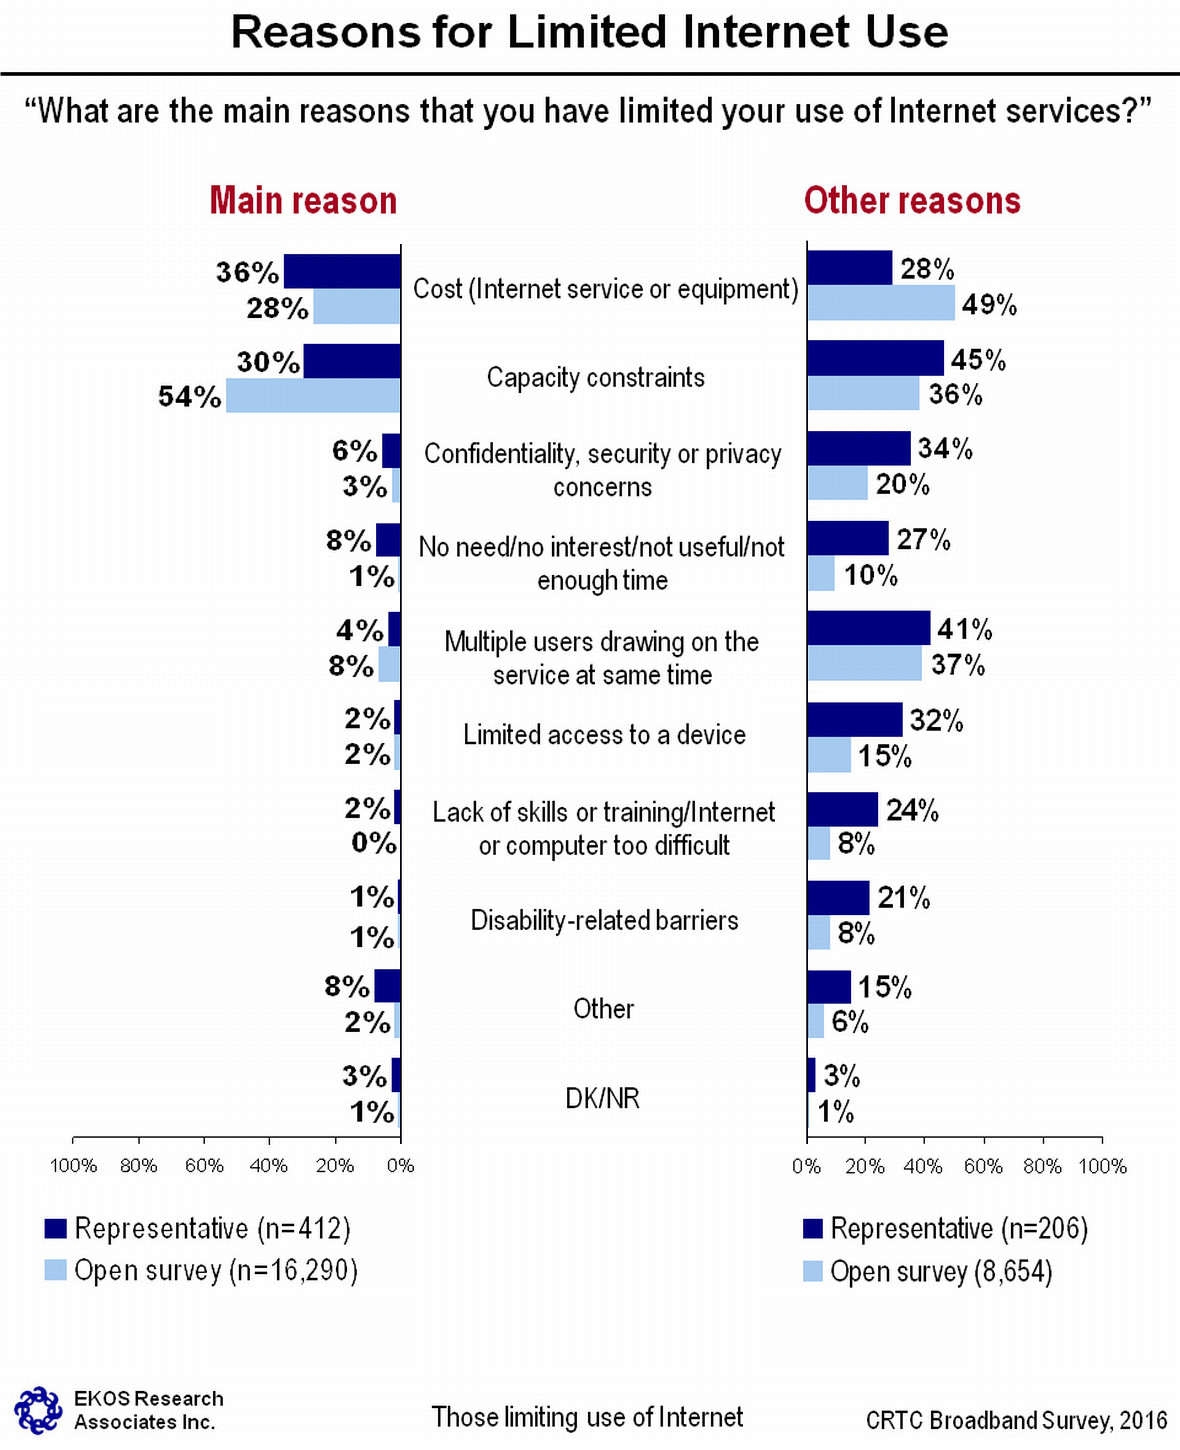
Among those who reported limiting their use of Internet services, cost and capacity constraints were identified as the main reasons in both the representative survey and the open survey, although to varying degrees. Among Canadians in the representative survey limiting use of the Internet, 36 per cent said that this is largely because of cost and 30 per cent pointed primarily to capacity constraints. Four per cent also said there are multiple users in the household drawing on Internet services at the same time resulting in limitations.
In the open survey, just over half of those limiting their use of the Internet said that it is mostly due to capacity constraints (54 per cent). Another 28 per cent pointed to cost as the main factor in the decision to limit their use, and eight per cent talked about multiple users causing limitations.
In the representative survey, another 19 per cent pointed to a variety of reasons, including a lack of interest or need (eight per cent); concerns about privacy, security, or confidentiality (six per cent); issues related to skill (two per cent); or lack of access to a device (two per cent). Disability was also cited by one per cent as a main reason, however, another 21 per cent noted it as a secondary reason 6. These reasons were less prominent in the open survey.
Beyond the main reason cited, additional reasons for limiting use are more varied in both the representative and open survey samples, although, cost, capacity constraints, and multiple users drawing on the service at the same time top the list. These are followed by concerns about confidentiality, privacy, and/or security. Limited access to a device and lack of training or skills form a third tier of reasons, followed by barriers related to disability.
In the representative survey cost is a bigger issue for those relying mostly on mobile Internet service.
In the representative survey, it is those with full-time employment, and parents with teens in the home who are more concerned about cost in their decision to limit Internet use. Families with grade school children and teens are also more apt to say that multiple users at the same time is the central issue.
In the open survey cost is more often reported as the main issue for urban dwellers, as well as residents of BC. In the open survey cost is also more apt to be an issue for those with the lowest household income, and those living alone.
In the representative survey capacity is more apt to be the central reason for heavier users of Internet services, but also among those with lower speeds of Internet service (under 5 Mbps). It is more often reported as the key reason for limiting use in rural areas, and is most prominent in the Territories where half of those limiting use say this is the reason.
These patterns are also reflected in the open survey, although in this sample it is the affluent who are also most likely to point to capacity problems, compared with those reporting household incomes of under $80,000, where cost takes on a more prominent role in the decision. Similarly, it is respondents to the open survey with data caps of 250 GB or more that are the most likely to say that they limit themselves based on capacity.
| Representative Survey (n=412) | Open Survey (n=16,290) | |||
|---|---|---|---|---|
| Cost | Capacity Constraints | Cost | Capacity Constraints | |
| Overall | 36% | 30% | 28% | 54% |
| Home Internet service | ||||
| Phone DSL | 22% | 43% | 22% | 58% |
| Cable | 42% | 24% | 34% | 50% |
| Satellite | 25% | 60% | 13% | 64% |
| Fibre optic | 40% | 23% | 37% | 44% |
| Fixed wireless | 37% | 36% | 14% | 66% |
| Speed of Internet Service (Mbps) | ||||
| Under 5 | 31% | 51% | 16% | 66% |
| 5-14 | 31% | 42% | 26% | 57% |
| 15-49 | 40% | 34% | 32% | 54% |
| 50 or faster | 27% | 33% | 31% | 54% |
| Rural/Urban | ||||
| Urban | 37% | 27% | 31% | 52% |
| Rural | 34% | 40% | 20% | 59% |
| Region | ||||
| British Columbia | 41% | 21% | 33% | 51% |
| Alberta | 27% | 41% | 26% | 55% |
| Saskatchewan & Manitoba | 33% | 21% | 19% | 62% |
| Ontario | 33% | 30% | 29% | 53% |
| Quebec | 43% | 25% | 27% | 55% |
| Atlantic | 51% | 29% | 18% | 58% |
| Territories | 32% | 51% | 29% | 60% |
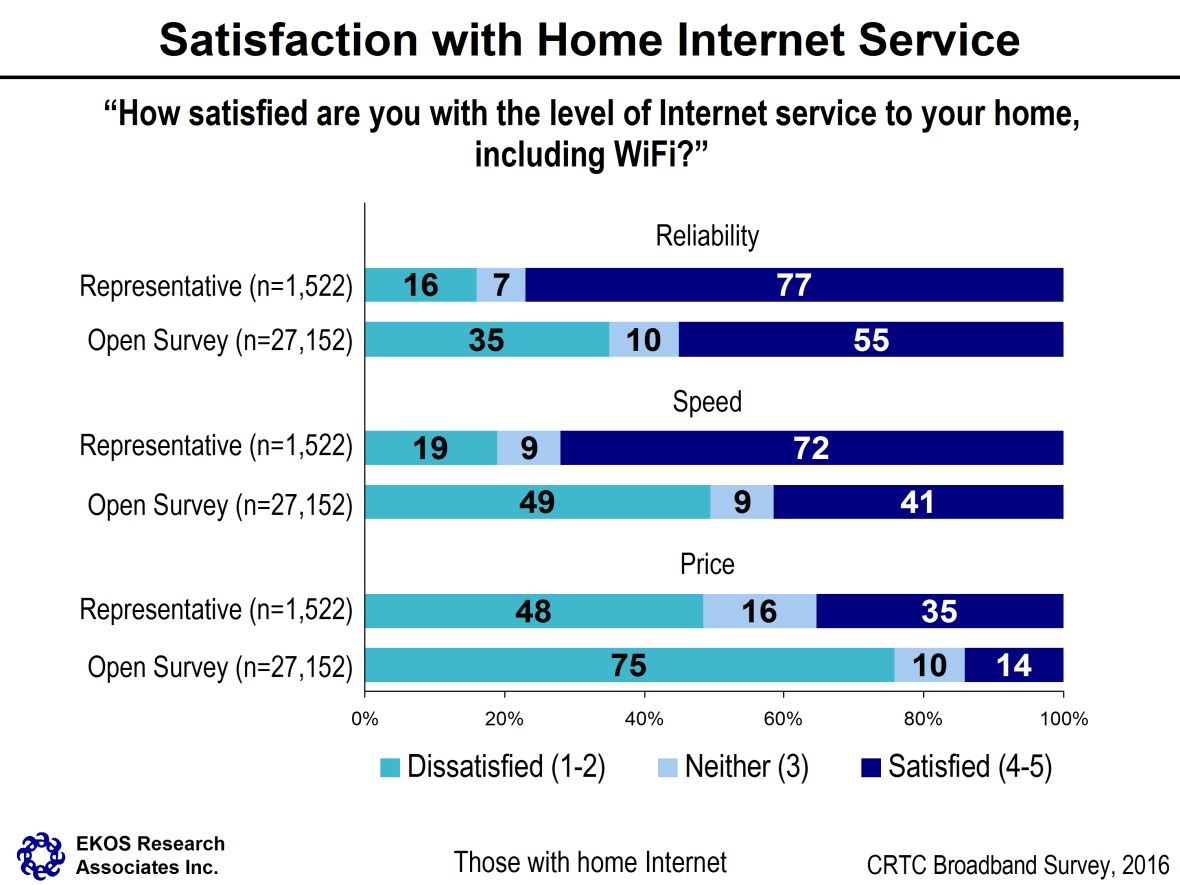
Seven in ten or more Canadians are satisfied with their home Internet speed and reliability, with roughly one in five reporting dissatisfaction.
Fewer Canadians (one in three) report satisfaction with the cost of their home Internet service, with almost half expressing dissatisfaction.
Dissatisfaction with reliability and speed is much more common (i.e., twice as high) among rural residents.
Households with incomes between $80,000 and $120,000 are the most dissatisfied (54 per cent) compared to those reporting lower or higher incomes.
Satisfaction is highest among those under 35 at 41 per cent. 50 to 64 year old respondents are typically the most dissatisfied.
Canadians’ opinions of mobile Internet service are remarkably similar to their opinions of home Internet service.
Based on results from the representative survey, satisfaction with home Internet services is moderately high with regard to reliability and speed with seven in ten (72 per cent) or higher (77 per cent) indicating satisfaction. Roughly one in five, or fewer, reported dissatisfaction with these elements of their home Internet service. Satisfaction with the price of home Internet service, however, is considerably lower with only 35 per cent reporting satisfaction and half (48 per cent) indicating dissatisfaction.
Because of the nature of the consultation, it is not surprising that respondents in the open survey are considerably less positive, as one might typically see in an open consultation process. In this sample, only 55 per cent are satisfied with the reliability and four in ten (41 per cent) are satisfied with the speed of their Internet service. More than one in three (35 per cent) are dissatisfied with the reliability and half (49 per cent) are dissatisfied with the speed. Further still, in the open survey only 14 per cent of respondents rated themselves as satisfied with the price, while the overwhelming majority (75 per cent) said that they are dissatisfied.
In both surveys it is not surprising to see that consumers who have limited their online activity due to cost or capacity (including speed and monthly cap) are the most likely to be dissatisfied on all three dimensions. Those who limit their use because of capacity are just as likely to be dissatisfied with cost as those who limit their activity specifically because of cost.
In the representative survey, dissatisfaction with the reliability of Internet service is most acute among consumers with service delivered by satellite (46 per cent), those with speeds of less than 5 Mbps (44 per cent) and caps of less than 50 GB (30 per cent). It is also more than twice as likely among residents of rural areas (30 per cent) and three times more likely in the Territories (47 per cent).
The patterns are largely the same, although even more acute in the open survey. In addition to consumers receiving their Internet by satellite, those obtaining service through fixed wireless are equally dissatisfied. Those relying more on home Internet services because they do not have a cell phone are also the most likely to be dissatisfied.
Segments in the representative survey most likely to be satisfied with the reliability of their service are those with the best speeds and highest monthly data caps, urban residents, Ontarians in particular, and those living alone.
In the open survey, 52 per cent of rural residents and 70 per cent of residents of the Territories are dissatisfied. Dissatisfaction is also more prominent than average in the Atlantic (45 per cent).
In the representative survey, dissatisfaction with the speed of Internet service is also most likely to be reported by those with satellite service (54 per cent), Internet speeds of less than 5 Mbps (62 per cent) and caps of less than 50 GB (39 per cent). It is also twice as likely among residents of rural areas (39 per cent) and three times more likely in the Territories (58 per cent). Larger households are also more prominent in their dissatisfaction.
These same patterns exist in the open survey. In addition to consumers receiving their Internet by satellite, individuals who obtain service through fixed wireless are also highly likely to be dissatisfied. Those relying more on home Internet services because they do not have a cell phone are also the most likely to be dissatisfied with the speed of their service.
Also in the open survey, 50 to 64 year old respondents are typically the most dissatisfied with the speed of their Internet service at home, while those who are under 50 are the most apt to be satisfied.
In the open survey, 79 per cent of residents of the Territories expressed dissatisfaction. This is followed by 56 to 58 per cent who are dissatisfied among residents of Manitoba, Saskatchewan, and the Atlantic, along with 69 per cent of rural residents more generally. Again, larger households expressed the highest level of dissatisfaction as did households reporting the highest income levels ($120,000 or higher) (51 per cent in each segment).
In the representative survey, dissatisfaction with price is highest among those with the lowest speeds (68 per cent among those with less than 5 Mbps, and 57 per cent among those with 5 to 15 Mbps), as well as those with the lowest monthly data cap (61 per cent among those with less than 50 GB. It is also high among those using DSL/phone line or satellite to receive their service (55 per cent in each segment).
Regionally, respondents in the representative survey are most apt to be dissatisfied in the Territories (68 per cent), and in BC (58 per cent), and in rural areas in general (53 per cent), compared with other residents across the country.
At the same time, it is also somewhat higher among those who are heavy users of the Internet (52 per cent dissatisfied).
From an income perspective, respondents in the representative survey who have household incomes of $80,000 to $120,000 are the most dissatisfied (54 per cent), compared with those reporting lower, or higher incomes.
Satisfaction is highest among those under 35 at 41 per cent.
Generally, patterns are similar in the open survey, however, surprisingly there is no difference in levels of satisfaction (or dissatisfaction) based on speed of the service. Roughly three in four are dissatisfied across the board, among those with low and high speeds of service. Those with a monthly data cap, however (or at least a cap of less than 250 GB) are more apt to be dissatisfied (79 to 84 per cent) with the price they pay.
In the open link, consumers receiving service by satellite or cable also stand out equally in their dissatisfaction (78 and 84 per cent), which is higher than expressed by others in the survey.
| % Dissatisfied (1-2) | ||||||
|---|---|---|---|---|---|---|
| Representative Survey (n=1,522) | Open Survey (n=27,152) | |||||
| Reliability | Speed | Price | Reliability | Speed | Price | |
| Overall | 16% | 19% | 48% | 35% | 49% | 75% |
| Home Internet service | ||||||
| Phone DSL | 20% | 31% | 55% | 36% | 58% | 73% |
| Cable | 12% | 11% | 47% | 26% | 39% | 78% |
| Satellite | 46% | 54% | 55% | 66% | 80% | 80% |
| Fibre optic | 9% | 9% | 44% | 15% | 19% | 68% |
| Fixed wireless | 21% | 26% | 44% | 57% | 74% | 70% |
| Speed of Internet Service (Mbps) | ||||||
| Under 5 | 44% | 62% | 68% | 62% | 84% | 77% |
| 5-14 | 28% | 34% | 57% | 38% | 60% | 75% |
| 15-49 | 12% | 10% | 46% | 23% | 39% | 76% |
| 50 or faster | 8% | 8% | 44% | 21% | 27% | 75% |
| Monthly Data Transfer Capacity (GB) | ||||||
| Under 50 | 30% | 39% | 61% | 56% | 72% | 84% |
| 50-150 | 16% | 19% | 48% | 35% | 51% | 78% |
| 151-250 | 14% | 15% | 56% | 28% | 43% | 81% |
| 251 or higher | 14% | 15% | 43% | 21% | 37% | 75% |
| Unlimited | 15% | 17% | 45% | 29% | 43% | 69% |
| Internet Activities During the Past 12 Months | ||||||
| Low | 13% | 18% | 46% | 40% | 51% | 72% |
| Somewhat low | 15% | 18% | 43% | 35% | 48% | 72% |
| Somewhat high | 18% | 18% | 52% | 34% | 48% | 74% |
| High | 19% | 22% | 52% | 35% | 51% | 78% |
| Rural/Urban | ||||||
| Urban | 13% | 14% | 47% | 28% | 42% | 76% |
| Rural | 30% | 39% | 53% | 52% | 69% | 73% |
| Region | ||||||
| British Columbia | 14% | 21% | 58% | 30% | 50% | 83% |
| Alberta | 23% | 22% | 45% | 34% | 49% | 79% |
| Saskatchewan & Manitoba | 19% | 23% | 48% | 38% | 58% | 74% |
| Ontario | 14% | 16% | 47% | 34% | 47% | 72% |
| Quebec | 12% | 12% | 45% | 10% | 45% | 70% |
| Atlantic | 20% | 22% | 51% | 45% | 56% | 78% |
| Territories | 47% | 58% | 68% | 70% | 79% | 94% |
Consumers’ views regarding the Internet service that they receive on their mobile device (e.g., cell phone) are remarkably similar to their feelings about their home Internet service. Results among Canadians in the representative survey are moderately positive regarding reliability and speed of service to their cell phone, as expressed by the seven in ten saying that they are satisfied. As with home Internet service, results are almost reversed for price, with only one in three (36 per cent) expressing satisfaction and half saying that they are dissatisfied (47 per cent) with the price they pay for mobile data service.
As with home Internet services, and as expected for an open consultation of this nature, results from the open survey are considerably more negative on all three service dimensions. Half expressed satisfaction with reliability and speed, although one in three indicated dissatisfaction in these areas. Very few, however, said that they are satisfied with the price (16 per cent), and the large majority (73 per cent) said that they are dissatisfied.
In the representative survey, Canadians who relied mostly on their mobile Internet service are the most positive with eight in ten expressing satisfaction. On the other hand, those in rural areas, as well as those with slow Internet speeds and low data transfer caps on their home Internet, and those receiving Internet service into their home by satellite are the least satisfied with the reliability of the Internet service their receive on their cell phone, likely because they live in areas where Internet service is generally poor whether it be to the home or mobile service. For example, residents of the Territories are the most likely to express dissatisfaction with the reliability of the service to their cell phones (42 per cent dissatisfied), followed by 22 per cent dissatisfied in Saskatchewan and Manitoba.
Comparatively, it is residents of the Atlantic that are the most positive in the representative survey with eight in ten expressing satisfaction. Similarly, those receiving Internet service into their home through fibre optic cable are also most apt to express satisfaction with the reliability of their mobile service, likely because they live in areas where signals are stronger.
Results are similar in the open survey, with dissatisfaction most acutely felt in the Territories and the Prairies, as well as among those with limited speed and a low monthly data cap of the Internet service in their home, and among those receiving their service by satellite.
Those in the open link survey relying exclusively or mostly on their cell phone, as well as those living in the Atlantic, and those who obtain their home Internet by fibre optic cable are the most satisfied with the reliability of their mobile service.
Essentially the same patterns exist in ratings of the speed of Internet service received by cell phone. In the representative survey, it is those who rely on cell phones more (or only), those particularly active online, and those receiving home Internet services by cable or fibre optic cable (where cellular signals are likely also better) who are the most positive. Those in rural areas, particularly the Territories and to a lesser degree, residents of the Prairies, those who receive their home Internet services by satellite or DSL, as well as those reporting slow home Internet speeds and low monthly data caps are the most likely to be dissatisfied.
Parents of young children in the representative survey are also typically more positive about the speed of their Internet to the cell phone, possibly because those relying on cell phone service mostly or exclusively tend to be younger (i.e., under 35).
In the open survey, the patterns are again very similar to the patterns related to reliability of service and to the patterns found in the representative survey.
There are only limited differences between segments of cell phone users with regard to pricing of service. In the representative survey, those who are the most active online are the most likely to be dissatisfied with pricing (63 per cent).
Residents with the lowest speeds of home Internet service (71 per cent) and the lowest monthly data caps (59 per cent) are also likely to be dissatisfied compared with other cell phone users, likely because their cellular service is also weaker than it is in other areas. Residents of BC also stand out across the country in their level of dissatisfaction regarding pricing (57 per cent).
Those relying most or exclusively on mobile service are, however, somewhat more positive with 43 per cent expressing satisfaction with the price they pay for service. Perhaps surprisingly, those reporting the least household incomes are also the most likely to express satisfaction (45 per cent) compared with those reporting higher incomes.
Interestingly, in the open survey, some of the patterns are completely reversed from what is shown in the representative survey. Respondents who rely exclusively on their cell phone for telecommunications are among the least satisfied. And, those reporting the highest speeds and data caps of home Internet service are the most dissatisfied with the price they pay for cell phone service. Similarly, it is urban residents who are also most apt to be dissatisfied, and dissatisfaction is most prominent in BC and Alberta. It is also more acute among men, those under 35 years of age and the university-educated. Among parents it is those with older dependents (18 or older) who are also more apt to express dissatisfaction with pricing of cell phone services.
| % Dissatisfied (1-2) | ||||||
|---|---|---|---|---|---|---|
| Representative Survey (n=1,100) | Open Survey (n=22,262) | |||||
| Reliability | Speed | Price | Reliability | Speed | Price | |
| Overall | 13% | 14% | 47% | 30% | 32% | 72% |
| Home Internet service | ||||||
| Phone DSL | 15% | 21% | 50% | 30% | 32% | 71% |
| Cable | 13% | 9% | 46% | 28% | 30% | 74% |
| Satellite | 23% | 23% | 45% | 41% | 40% | 65% |
| Fibre optic | 9% | 10% | 46% | 22% | 23% | 72% |
| Fixed wireless | 17% | 14% | 46% | 33% | 34% | 68% |
| Speed of Internet Service (Mbps) | ||||||
| Under 5 | 33% | 32% | 71% | 38% | 39% | 71% |
| 5-14 | 16% | 19% | 51% | 30% | 31% | 69% |
| 15-49 | 14% | 13% | 50% | 27% | 29% | 74% |
| 50 or faster | 13% | 11% | 52% | 26% | 28% | 74% |
| Monthly Data Transfer Capacity (GB) | ||||||
| Under 50 | 26% | 26% | 59% | 40% | 41% | 69% |
| 50-150 | 13% | 13% | 53% | 29% | 30% | 71% |
| 151-250 | 12% | 14% | 48% | 27% | 30% | 77% |
| 251 or higher | 18% | 18% | 56% | 29% | 31% | 77% |
| Unlimited | 13% | 13% | 49% | 26% | 27% | 71% |
| Internet Activities During the Past 12 Months | ||||||
| Low | 12% | 9% | 34% | 28% | 30% | 59% |
| Somewhat low | 11% | 12% | 40% | 27% | 27% | 62% |
| Somewhat high | 14% | 12% | 49% | 27% | 28% | 70% |
| High | 16% | 20% | 63% | 33% | 34% | 77% |
| Rural/Urban | ||||||
| Urban | 11% | 12% | 46% | 27% | 29% | 73% |
| Rural | 22% | 22% | 50% | 39% | 38% | 68% |
| Region | ||||||
| British Columbia | 12% | 11% | 57% | 31% | 32% | 78% |
| Alberta | 13% | 11% | 51% | 28% | 32% | 76% |
| Saskatchewan & Manitoba | 22% | 22% | 47% | 36% | 34% | 67% |
| Ontario | 13% | 14% | 46% | 29% | 31% | 72% |
| Quebec | 9% | 9% | 39% | 30% | 30% | 66% |
| Atlantic | 5% | 12% | 50% | 27% | 28% | 71% |
| Territories | 42% | 38% | 49% | 56% | 59% | 74% |
Canadians are somewhat divided about the assignment of responsibility for ensuring a minimum standard, although four in ten believe it will require a combination of approaches.
Support for a combined approach is stronger among urban residents (41 per cent) than rural residents than it is among rural residents. Rural residents have a slightly stronger lean toward a CRTC fund (26 per cent) than urban residents.
Two in three Canadians believe that pricing should be the same across the country.
Urban Canadians (29 per cent) are more in favour of higher pricing compared to rural Canadians (20 per cent).
They are also less in favour of equal pricing (62 per cent), compared to rural Canadians (74 per cent).
Contrary to expectations, 44 per cent in the Territories said that they believe pricing should be a little bit higher in rural and remote areas (and only 48 per cent believe that pricing should be the same as it is in urban areas)
Survey respondents were presented with the idea that there should be a minimum standard of Internet service available to all Canadians, particularly in rural and remote areas. They were subsequently asked what model should be used to assign responsibility for this. The following optioned were presented to respondents and they were asked which was closest to their own point of view:
Some people say that it is up to the telecommunications service providers to decide when to provide this minimum standard (i.e. market forces will dictate when there is a business case to do so).
Others say that ensuring a minimum standard is a fundamental need and it is up to governments to fund this directly.
Still others say that it is the role of the CRTC to establish a fund (i.e. that telecommunications service providers contribute to) in order to provide this minimum standard.
Some combination of these.
Results of the representative survey indicate that Canadians are somewhat divided in the assignment of responsibility for ensuring a minimum standard of service, although the largest proportion (39 per cent) believe that it should occur through some combination of the Government, the CRTC specifically, and the telecommunications industry working together. Another 22 per cent believe that the CRTC should establish a fund from which the industry can draw in order to provide this minimum service. A further 19 per cent believe that this is a fundamental service and therefore it is up to governments to ensure that the minimum service is available. Fourteen per cent believe that it is up to market forces to dictate when the industry will offer the minimum standard of Internet service. This is somewhat more likely to be made up of consumers who are satisfied with their Internet service, particularly the speed and reliability of their home service and the cost of their mobile service.
Results are similar in the open survey in terms of support for a combined effort and use of a CRTC fund, however, there is stronger support for direct government intervention (28 per cent), and only minimal support for leaving it to market forces (six per cent).
In the representative survey, support for a combination of approaches is supported even more strongly among urban residents (41 per cent) and women (44 per cent) compared with rural residents and men.
Support for establishing a CRTC fund is somewhat more popular among rural residents (26 per cent), and Quebeckers (30 per cent), as well as those receiving Internet service through satellite (32 per cent) compared with other Canadians in the sample.
Direct government intervention is most often supported by men (22 per cent), those under 35 (26 per cent), and Atlantic Canadians (30 per cent) compared with others.
Market forces is supported by the smallest overall proportion at 14 per cent, however, 21 per cent of residents of Saskatchewan and Manitoba believe that this is the right approach. It is also marginally more popular among men than women (18 versus 11 per cent), as well as among consumers with cable (17 per cent) or fibre optic (18 per cent) service.
In the open survey, it is rural residents, particularly in the Territories, Prairies, and Atlantic; those receiving their Internet by satellite; and those with the lowest monthly data cap who are most supportive of a combination of these approaches (45 to 48 per cent depending on the segment).
Women are also more in favour of a combined approach compared with men (49 per cent versus 40 among men, who lean marginally more than women toward direct government intervention at 31 per cent).
Direct government intervention is also more often supported by younger respondents (under 35), men and the university-educated in the open survey than it is by others (33 and 31 per cent, respectively). This approach is also somewhat more popular in BC and Ontario.
| Representative Survey (n=1,666) | Open Survey (n=28,794) | |||||||
|---|---|---|---|---|---|---|---|---|
| Market Forces |
Govern-
ments |
CRTC Fund | Some combination of these | Market Forces |
Govern-
ments |
CRTC Fund | Some combination of these | |
| Overall | 14% | 19% | 22% | 39% | 6% | 28% | 20% | 43% |
| Urban/Rural | ||||||||
| Urban | 14% | 19% | 21% | 41% | 7% | 29% | 21% | 41% |
| Rural | 14% | 19% | 26% | 34% | 4% | 25% | 20% | 47% |
| Region | ||||||||
| British Columbia | 11% | 25% | 23% | 37% | 5% | 30% | 21% | 41% |
| Alberta | 19% | 13% | 19% | 42% | 8% | 29% | 17% | 43% |
| Saskatchewan & Manitoba | 21% | 14% | 17% | 41% | 7% | 27% | 17% | 46% |
| Ontario | 15% | 20% | 19% | 42% | 6% | 30% | 18% | 43% |
| Quebec | 14% | 16% | 30% | 33% | 5% | 23% | 27% | 41% |
| Atlantic | 7% | 30% | 16% | 42% | 5% | 25% | 17 | 48% |
| Territories | 11% | 15% | 28% | 41% | 3% | 27% | 22% | 45% |
| Age | ||||||||
| Under 35 | 13% | 26% | 24% | 34% | 5% | 33% | 20% | 39% |
| 35-49 | 17% | 19% | 20% | 38% | 6% | 26% | 19% | 44% |
| 50-64 | 12% | 16% | 21% | 44% | 6% | 24% | 21% | 46% |
| 65 or older | 16% | 12% | 23% | 42% | 7% | 25% | 22% | 43% |
| Gender | ||||||||
| Male | 18% | 22% | 23% | 34% | 6% | 31% | 20% | 40% |
| Female | 11% | 16% | 21% | 44% | 4% | 21% | 21% | 49% |
By and large, Canadians agree that pricing should be the same for Internet services in rural and remote areas as they are in urban areas of the country. In the representative survey roughly two in three believe that the prices should be the same (65 per cent). Just over one in four (27 per cent) believe that the pricing should be “a little bit higher” in rural and remote areas of the country, although very few believe that the prices should be significantly higher (four per cent). Results of the open survey mirror this point of view.
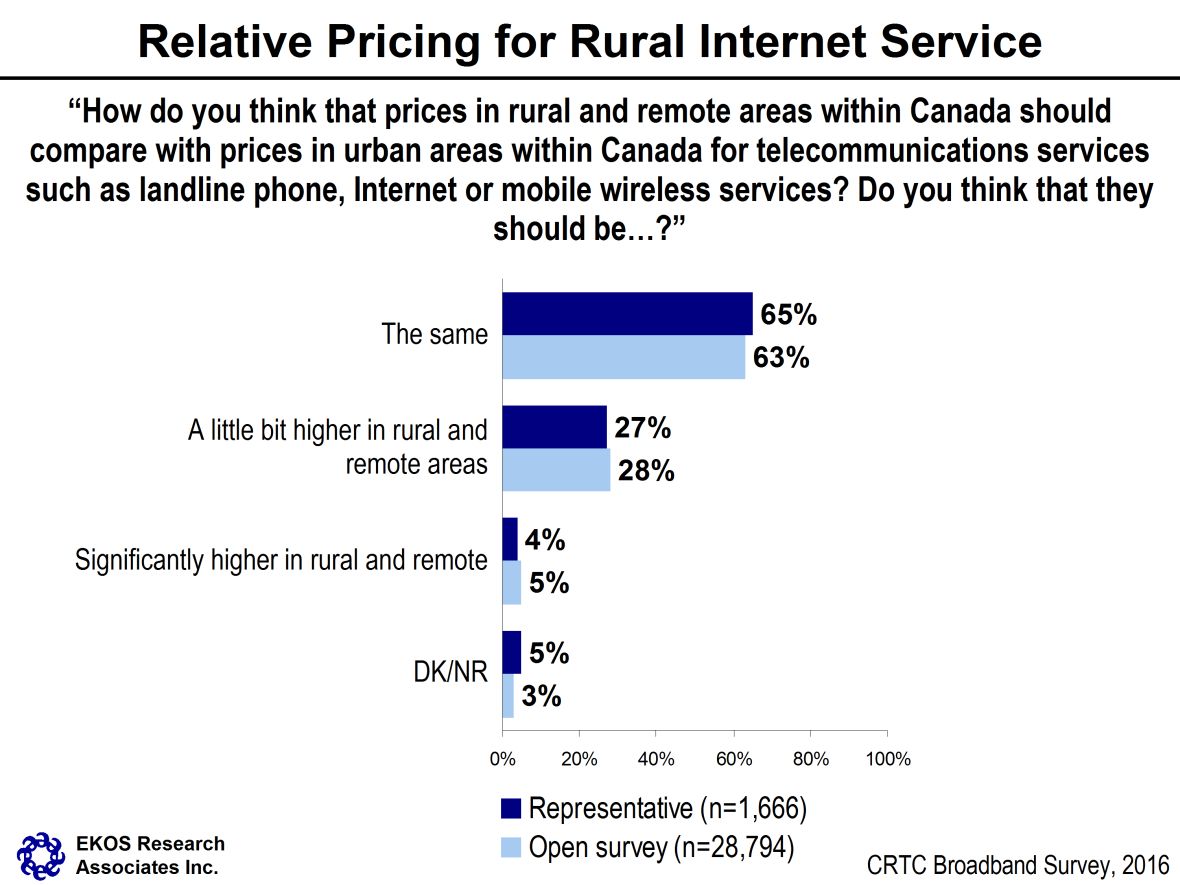
In the representative survey, Canadians living in urban areas are marginally more likely to argue for slightly higher pricing in rural and remote areas (29 per cent versus 20 per cent among rural residents), while rural residents are more apt to argue for equivalent pricing (74 per cent compared with 62 per cent of urban residents).
People relying more on home Internet service and those with faster speeds and higher data caps for their home Internet in the representative survey also each have a slightly stronger lean toward higher pricing in rural and remote areas (35+ per cent).
In terms of demographic patterns, men, older Canadians (64 or older), and those who are university-educated and more affluent in the representative survey are each more apt to lean to somewhat higher pricing in rural and remote areas (30 to 33 per cent depending on the segment).
Regionally, it is residents of Ontario in the representative survey who lean slightly more toward higher pricing in rural and remote areas compared with everyone else in Canada, while Quebeckers are the most likely to argue for pricing that is the same (78 per cent).
Interestingly, it is residents of the Territories who do not fit the pattern of response for rural residents in the representative sample. Perhaps because they recognize their own special case in terms of satellite reception or because they have come to expect higher pricing in the North, 44 per cent said that they believe pricing should be a little bit higher in rural and remote areas (and only 48 per cent believe that pricing should be the same as it is in urban areas).
Patterns are similar in the open survey, although marginally more pronounced in some areas. Again, urban residents are more apt to favour slightly higher pricing compared with their rural counterparts. This also coincides with those receiving home Internet service by cable or fibre optic cable, as well as faster speeds and data caps for home Internet service.
Regionally, it is residents of Alberta (37 per cent), followed by those in the Prairies in the open survey who lean slightly to higher pricing (33 per cent), whereas residents of Quebec argue the most strongly for the same pricing (77 per cent), followed by Atlantic Canadians (71 per cent).
| Representative Survey (n=1,666) | Open Survey (n=28,794) | |||
|---|---|---|---|---|
| The Same | A Little Bit Higher | The Same | A Little Bit Higher | |
| Overall | 65% | 27% | 63% | 29% |
| Rural/Urban | ||||
| Urban | 62% | 29% | 57% | 33% |
| Rural | 74% | 20% | 79% | 17% |
| Region | ||||
| British Columbia | 60% | 29% | 58% | 32% |
| Alberta | 64% | 28% | 52% | 37% |
| Saskatchewan & Manitoba | 63% | 25% | 59% | 33% |
| Ontario | 59% | 31% | 59% | 32% |
| Quebec | 78% | 18% | 77% | 17% |
| Atlantic | 70% | 21% | 71% | 22% |
| Territories | 48% | 44% | 63% | 33% |
| Home Internet Service | ||||
| Phone DSL | 62% | 30% | 63% | 28% |
| Cable | 63% | 29% | 57% | 33% |
| Satellite | 74% | 21% | 79% | 18% |
| Fibre optic | 64% | 24% | 57% | 33% |
| Fixed wireless | 65% | 30% | 72% | 23% |
| Speed of Internet Service (Mbps) | ||||
| Less than 5 | 67% | 30% | 75% | 20% |
| 5-14 | 70% | 23% | 66% | 27% |
| 15-49 | 58% | 35% | 52% | 37% |
| 50 or faster | 64% | 26% | 53% | 36% |
| Monthly Data Transfer Capacity (GB) | ||||
| Less than 50 | 62% | 30% | 74% | 20% |
| 50-150 | 59% | 35% | 62% | 30% |
| 151-250 | 62% | 28% | 55% | 35% |
| 251 or higher | 49% | 41% | 49% | 40% |
| Unlimited | 71% | 23% | 62% | 29% |
| Gender | ||||
| Male | 61% | 30% | 58% | 33% |
| Female | 68% | 24% | 76% | 18% |
| Age | ||||
| Under 35 | 69% | 24% | 56% | 34% |
| 35-49 | 67% | 25% | 63% | 28% |
| 50-64 | 63% | 28% | 70% | 23% |
| 65 or older | 57% | 32% | 69% | 24% |
| Education | ||||
| High school or less | 73% | 22% | 68% | 25% |
| College | 68% | 24% | 67% | 26% |
| University | 58% | 32% | 58% | 33% |
| Income | ||||
| $40,000 or less | 76% | 18% | 73% | 20% |
| $40,000-$80,000 | 68% | 25% | 66% | 26% |
| $80,000-$120,000 | 61% | 31% | 61% | 31% |
| $120,000 or higher | 59% | 33% | 54% | 36% |
The current chapter provides additional detail regarding patterns of telecommunications use and issues experienced among different rural segments based on results of the two surveys. The chapter also describes the results of the focus group and interview discussions held with rural and remote residents in areas that were identified as underserved in terms of broadband availability. In order to make it easier for the reader to distinguish these findings from the survey results, descriptions from the group discussions are presented in grey boxes, often following survey evidence, in relevant areas. A number of profiles were developed to illustrate different individual scenarios of use of the Internet and the implications of limitations in access to the Internet. These can be found in Appendix D. Specific profiles are also referenced throughout the current chapter.
Rural residents in the focus groups and interviews described the friendliness, the feeling of safety, the slower pace, and the variety of outdoor activities as positive aspects of their communities.
Lack of infrastructure and access to goods and services such as books, clothing, food, entertainment, health services, educational institutions and technology were identified as negative aspects of their communities.
Distance from family and friends were also commonly noted among participants.
Participants in the group discussions and interviews described their feelings about the positive elements of small town life. The feeling of a close-knit community was noted by most participants, including the warmth and friendliness of people, and the feeling of security, where everyone knows and looks out for one another. Some articulated their feeling as “It’s a safe place to raise your kids” or “Some don’t even lock their doors”. Some participants talked about the slower pace, positive work/life balance, and feelings of peace and tranquility, such as “There’s no stress” or “It is peaceful here. You’re out of the rat race.” Beautiful landscapes and easy access to nature and outdoors activities, including fishing, swimming, boating, hiking, and skiing are positive elements mentioned by many rural residents.
Most of the drawbacks about living in rural and remote communities relate largely to lack of infrastructure and access to products and services. Often, travel is required to access services and products often cost more for the same or inferior quality compared with what urban residents can expect. One participant responded to what they found most difficult by suggesting, “definitely access to resources, if I want something I can’t necessarily just go out and buy it” (Amanda, Iqaluit, profile in Appendix D). Lack of proper roads, particularly cited by residents of Nunavut, as well as poor or virtually non-existent public transportation, and harsher weather conditions were cited as key challenges. Participants identified challenges with limited retail options (e.g., few large stores) and limited variety and choices. This was described not just in the context of consumer products (e.g., clothing, food, books), but also in terms of services (e.g., getting something fixed, options for banking), and entertainment options (e.g., lack of bars and restaurants, movie theatre, other venues to access culture). One participant said “We are still like the ‘green acres’ here”, referring to the 1960s TV show where a couple moves from the big city to a small farm with no amenities.
Limited access to healthcare was a particularly sore point in most discussions. One participant expressed his frustration at having to go to the hospital for something as minor as his son having a cough because of the limited options; “there is no in between, so we'll find ourselves supplementing our healthcare with online advice.” Some post-secondary students from Nunavut pointed to the need for very time-consuming and expensive medi-vacs needed even for relatively minor issues, costing the government considerable sums of money, because there is very limited access to health care (see Other Nunavut Communities in Appendix D for post-secondary student profiles).
Limitations in choices of education and employment opportunities were also noted by many residents of rural communities, where most young people need to leave to complete training or education and/or find jobs, leaving behind an older population. The “brain drain” phenomenon was mentioned in one Atlantic discussion and one interviewee in Iqaluit described the difficulties in trying to recruit professional talent from outside the region only to have people leave after a short period because of lack of access to products and services and enrichment opportunities in the community, making it very disruptive for the local economy.
Distance from extended family and friends was also described by many as a difficult element of living in more rural and remote communities. A few participants even described occasional frustration and lack of understanding on the part of others about the realities of small town (particularly remote town) living. “People don’t understand that you can’t just go get something/do what others can do”.
As with representative survey respondents, most rural participants in the focus groups and interviews described receiving their home Internet connection through phone line (DSL) or by satellite (very few mentioned fixed wireless).
Speed was rarely talked about in terms of Mbps. It was usually described as the time it takes to finish a task.
As previously described in Chapter 2, more rural residents than urban residents subscribe to a home telephone, home Internet and mobile services combined. This is largely driven by a sizable proportion that still have a home telephone compared with urban residents. This may be because bundling economies are necessary to keep otherwise more expensive telecommunications costs down in rural areas. In the representative sample, 88 per cent of rural respondents have a home telephone, compared with only 73 per cent of urban respondents. In the open survey, 67 per cent of rural residents have a home telephone compared with only 50 per cent of urban residents.
Among rural residents in the representative sample, larger households and those with children are more likely to have cell phone service, as are consumers with home Internet that is delivered by cable or fibre optic cable. Higher proportions of those with wireless service for home Internet are also more likely to own only a cell phone and no home telephone.
As also previously presented, rural consumers are considerably more likely to have home Internet through a phone line, or fixed wireless configuration, and are largely the only consumers to receive Internet by satellite. Relatively few rural residents in the surveys have Internet service delivered through cable or fibre optic cable.
In the representative sample, Atlantic rural residents and those living in the Territories are the most likely to be using a phone line, while rural residents in Ontario and the west are more likely than others across Canada to be using a fixed wireless signal.
Given the method of service delivery it is not surprising to see that rural residents in both the representative and open surveys report considerably slower download speeds of home Internet service and many have fairly low monthly caps on data transfer. This is least acute among rural residents obtaining service through cable and most concentrated among those receive Internet by satellite or wireless. The lowest speeds and data caps are also most concentrated in the Territories.
Most participants in the discussions described home Internet service delivered through their phone line or by satellite. Very few talked about fixed wireless. Bell, XplorNet, and Northwestel (in Nunavut) were frequently cited as service providers. Participants were rarely specific about the download speeds of their home service, however, some talked about speeds of less than 5 Mbps, and even as low as 1.5 Mbps. For example, one participant noted “It’s near non-existent. It’s about 1Mbps top speed, and that’s off peak hours.” Speeds were more often described in terms of the length of delays or what they could or could not do with it (e.g., not being able to stream videos because it would stream for a minute or two and then buffer for a few minutes and then stream again, and so on, or speeds that were too slow to allow for successful online gaming). “I look at YouTube and what ends up happening, it will go for a little bit, then stop and has to catch up. For instance, a 3 minute video may take 5 minutes by the time you’ve finished.”
Related to mobile services, a few described only talk and text ability, but most seem to also have data. Some spoke of difficulties or lack of reliability in getting reception, missing or delayed delivery of text messages and a considerable volume of dropped calls.
Rural participants in the focus groups and interviews described a wide variety of online activities:
Almost all participants took part in online banking (particularly when they are unable to get to a bank);
Many use the Internet to purchase products and services that are not readily available in their communities;
Participants reported using Internet to stay connected to the world (news websites) or to friends and family (Skype, Facetime, social media);
Email was universally important, but especially in terms of employment;
Both parents of young children, and adults taking courses online described the importance of Internet for educational purposes; and
Streaming was important for those taking part in online education, those watching DIY videos on services they do not have in their community, and those looking for entertainment.
In terms of online activities, results from the representative and open surveys largely indicate that rural residents are as active online as urban residents are, with a few exceptions that have particular requirements for faster speeds or higher data caps, which seem to be curtailing use. They are, however, more active online in a few areas that have less of a requirement for speed and data transfer. Rural residents are less apt to say that they are frequently engaged in online gaming, downloading music and/or watching television shows or movies online compared with urban residents. The open survey in particular suggests that rural residents are also less likely to download software, listen to the radio and/or make online telephone calls. The representative survey points to higher engagement of rural residents involved in researching online (e.g. visiting government sites, looking for travel information and looking up community events). They are also more apt to report frequent online banking and shopping. The representative sample also shows rural residents reporting higher use of online calls, which runs contrary to the open survey evidence. In each of these areas where rural residents are more likely or less likely to engage in online activities, it is always those living in the Territories who stand out the most, and typically by a wide margin. A few other patterns of note are:
More frequent use of Internet for social media, education, streaming or downloading music, television shows or movies, or listening to the radio is found among rural households with kids
Rural residents in western Canada are more apt to look up health information online, and download software than other rural Canadians
Social media engagement, online gaming, or streaming of music or shows is more likely among households with faster speeds and unlimited data transfer caps.
Participants in the discussions described a wide variety of activities that they engage in online. Most said that they rely on the Internet for email regularly, as well as connecting to a range of information sites for health, travel, information on services and a host of other issues. Looking for news, sports scores, and weather, for example can be daily activities for many, using a mobile device or their laptop or desktop.
Virtually everyone in the discussions said that they do banking online. Many emphasized the importance of being able to do online banking, particularly when the weather prevents them from being able to get to a bank. More than half also said that they engage in online shopping in order to obtain the services and products that they do not have access to in their community. For a few, particularly in Nunavut, at times, online shopping also enables residents to purchase goods at a more reasonable price relative to the local price for these products.
Many participants talked about use of the Internet to stay connected with friends and family. For example, many use Facebook and other social media platforms to maintain regular contact. Some use this to connect with social circles and plan events, others use it to stay connect with friends and family outside the community, and still others use it to know what is going on in the community, or to organize their children’s schedules and activities. Those using it to connect within the community often talked about using it to “organize their daily lives”. Many participants across several groups talked about the use of Facetime or Skype to stay connected with those who are important to them. They emphasized the importance of being able to maintain relationships, particularly in the lives of young children, and with those who are older. One Nunavut youth talked about the entire family making it a priority to place Internet calls to an elderly family member in another community, “We each make calls to my Grandmother in the hospital, early in the month, before our data allowance runs out” (Stephen, Nunavut, profile in Appendix D).
Some participants stated that reliable Internet service is a critical requirement to be able to conduct work, stay connected with work colleagues or clients, or to submit or coordinate work.
“My husband and I both work online, so we need it all the time”.
“I use the Internet to coordinate my contracts with others”.
“I run a business, almost exclusively from my cell phone” (Ted, Slave Lake, profile in Appendix D).
“I use it for keeping track of inventory and ordering” (Ben, Guysborough, profile in Appendix D).
Virtually everyone using the Internet to work noted the importance of having email. Some use the Internet to look for work and submit applications for employment online. This was described as particularly critical in small communities where job opportunities are relatively rare. Others noted the necessity of being able to email or transfer files – and with poor quality service find this difficult to do.
Many parents and some other participants noted the importance of the Internet for school. Parents described the importance of the Internet for children to be able to do their homework and gain added education and learning online. Some spoke of the enrichment value for young children, having access to educational programming. One young mother uses the Internet to obtain information, textbooks and lesson plans to home-school her children. Several young adults talked about attending online courses and the importance of being able to access education online. This is particularly important for one youth participant with a physical disability using the Internet to complete a degree. Another participant uses the Internet to complete a Masters degree online while working and raising a young family (Alice, Slave Lake, profile in Appendix D). A lawyer in Iqaluit described a requirement to complete a specific number of hours of education, remotely by the Internet, each year in order to maintain professional credentials. Several teachers also illustrated the importance of the Internet in giving them access to further enrichment for their students to supplement the assigned textbooks, as well as giving them additional access to the latest teaching trends.
As previously described, access to health care and medical services is seen as problematic in almost every community, and many have used the Internet to access health/medical information. At least a handful of participants said that they have also used it to access tele-health services, placing online video/voice calls to connect with a health professional.
Streaming and downloading of content for the purposes of entertainment was also described as important particularly in small, rural and remote communities where there can be limited entertainment options and opportunities to take in cultural shows and events. Many talked about streaming movies and television shows online (e.g., Netflix, news), but some also noted that accessing YouTube for Do It Yourself (DIY) video’s that help them to learn and complete tasks for which they could not otherwise obtain services. “I used it to fix a part on my truck, when I couldn’t get the service here in town”. Access to books online was also seen as important, given the limited choices to borrow or purchase books in the community. Similarly, some use the Internet for online streaming or downloading of music, as well as watching music videos, and as a way of accessing music when few opportunities exist for this in the community.
Although some participants described one or a few specific activities they engage in online, most described a plethora of online activities, used to complete a wide array of regular tasks, integral to their daily life. Here is how some of the participants described online activities/the Internet as critical:
“What do I do online? I do everything. You name it and I do it online - on my laptop, my tablet, and my phone. I shop, I bank, I stay connected with others, I email, I go to school - I do everything online - everyday.”
“I use it for everything you can imagine – Skype, Netflix, gaming…” (Alice, Slave Lake, profile in Appendix D)
“It’s my lifeline to my kids,” one mother described.
“I’d be lost without it”
“If I didn’t have the Internet, I’d be out of business”.
“It means my kids can do an enormous amount of research for school; it means that really anything they want to know, we can find out.”
“Family wise I’d be lost, I’d probably very rarely get to hear them or see them, this way I get to see them a lot.”
The majority of rural participants in the focus groups and interviews have experienced issues with at least one aspect of their Internet.
Those with satellite are very susceptible to reliability issues caused by environmental conditions (heavy rain, snow, fog, wind and even solar flares).
According to participants, limitations are also caused by peak times of day, small available capacities, and location in town.
Most participants also described issues with the reliability of their mobile service.
Many have considered switching services. Of those who have, the majority have either found they have no other option or are still unhappy after switching. Very few were able to switch and be satisfied with the result.
The most common strategy to deal with poor Internet service is simply to delay the activity or wait to use Internet in urban areas for large tasks when travelling.
As previously outlined in Chapter 2, rural residents in both the representative and open surveys are more likely to report limiting their use of the Internet than urban residents (34 per cent versus 20 per cent among urban residents in the representative survey and 66 per cent versus 53 per cent of urban residents in the open survey). This is more often the case among larger rural households. It is also most common among households with wireless service to their home, and those reporting speeds of less than 10 Mbps and data caps of 50 GB. It is also more commonly reported in the Territories.
Rural residents with satellite service, those with the slowest speeds and lowest caps are more likely than others to say that they are limiting their use as a result of capacity. Larger households also talk about competing for bandwidth with others in the household more often than small rural households do.
As previously described survey respondents in both surveys expressed considerable dissatisfaction with their home Internet service. Rural residents were two to three times more likely than urban residents to rate themselves as dissatisfied in both survey sources. This was true for reliability as well as for speed. Overall dissatisfaction was even higher in relation to cost, but there was less of a difference between urban and rural respondents on this measure (i.e., at least half of all residents were dissatisfied with cost, but rural residents were only about 10 per cent more likely to be dissatisfied than urban residents). Rural residents with satellite service and residents with the slowest speeds and lowest caps are most likely to have expressed dissatisfaction with reliability and speed, including those in the Territories, who were more apt to be dissatisfied than any other rural residents across the country. Again, this differential is not as acute in the ratings of cost, even though higher proportions across the board are unhappy with prices.
On ratings of the same dimensions of mobile service, rural residents are also twice as likely to be dissatisfied with reliability and speed of service relative to urban residents. Again, it is it those rural residents with the slowest speeds and lowest data caps as well as residents of the Territories who are the most likely to be dissatisfied. Dissatisfaction with prices is similarly high, however, among both urban and rural residents. Those rural residents with lower speeds (under 10 Mbps) are considerably more likely to rate themselves as dissatisfied with prices (71 per cent), as are larger households and those with children.
The majority of rural participants who took part in group discussions and interviews have experienced at least some issues with their Internet connection, with reliability, speed, and capacity all mentioned as points of frustration. In terms of reliability, participants often identified inclement weather as the source of their problems. Participants who get their service through satellite are particularly susceptible to heavy rain, snow, fog, wind and even solar flares causing disruptions to their Internet connections; “because it is satellite we are vulnerable to all kinds of problems.” A few participants in Guysborough and Tofino also mentioned that they can no longer use satellite service because of tall trees on their property blocking the signal.
Using the Internet at peak times of day was also cited a reason for experiencing both reliability and speed issues, especially by those living in Tofino and Nunavut. As a result, many of these rural participants note that they will avoid certain types of Internet usage during peak times. For example, one mother explained that she does not allow her children to attempt streaming content on evenings and weekends when others in her community are home, because she knows her connection is heavily reliant on the time of day; “if my kids want to Netflix a movie or a TV show on the weekend, I have to say no because its just not going to work at all and they’re going to be frustrated”. Another participant stated, “as soon as businesses open in the morning at 9am, service really slows down.” Some participants have also had problems simply loading web pages when they have too many pictures or use flash images. Others have stated that the extent of their issues means they cannot use the Internet for entertainment at all.
Capacity was also described as a major issue by rural participants, especially for residents of Nunavut. Although some did talk about the speed of their home Internet, many in Nunavut focused on the data transfer capacity, and how severely restricting these monthly caps are to online engagement. These same participants described significant throttling occurring after one reaches the monthly cap, making it nearly impossible to complete a task online. Those interviewed in Iqaluit were able to get as much as 30-50 GB per month, but the post-secondary students who came from smaller surrounding communities in Nunavut (Ottawa session), were not able to get more than 15 GB per month. These participants note that sharing this small capacity with multiple people in their household often results in running out of capacity within weeks or days of starting a new month, and once they get close to, or reach this limit, the speed is throttled. As one participant explained, “it’s usually pretty good for the first two weeks, but after that, it’s gone.”
The extent of the issues experienced is largely a function of location. This is both true across groups (e.g. participants in Kirkland Lake seemed to have the fewest issues, while those in Nunavut seemed to experience the most) and within groups (e.g. participants living closer to the downtown core in Mont Tremblant tended to have fewer issues than those living further away). These differences in experience were sometimes a result of living quite a bit further from a main service area, such as over a county line, but differences were also experienced between people living on the same street and sometimes across the road. According to one group, people living as close as 60 feet away receive radically different levels of service.
In addition to home Internet issues, participants also identified reliability issues with cellular data plans and cell phone reception. Particularly, participants in Guysborough, Tofino, and Nunavut explained that they tend to have issues with their cell phones, such as dropped calls, missing texts, and difficulties accessing the Internet. One participant in Guysborough asserted that their cell phone could only be used in certain areas of the house, while another said that cellular service is not accessible on their property at all, and must walk to an area across from her house in order to get service. One participant in Tofino noted that depending on the service provider, one cell phone would work relatively well at his home while another would not function at all. Students from Nunavut expressed that they feel that cell phone coverage is constantly getting worse (see Other Nunavut Communities in Appendix D for student profiles). One student illustrated this opinion by saying, “you could stand on your roof and get nothing.” Because of the lack of reliability, many people retain a home telephone in addition to having a cell phone. Most participants in this situation are unhappy about the added cost of keeping two types of phone services.
Because some participants have been unhappy with the services they receive, several of them have or have inquired about switching services, either to a new provider or to a new package from their current provider. This has been in anticipation of saving on monthly costs, increasing the capacity or speed, or replacing a service that no longer works due to some issue (e.g. tree growth, or provider no longer offering service in area). Sometimes they must accept a trade-off for getting something they want; “I was trying to increase speed and capacity, but the cost is now higher.” Those who have attempted to change services have had one of three outcomes: people find there is no viable alternative, and must retain what they have; people are able to switch to a new service and are satisfied with the result; people are able to switch to a new service and are dissatisfied with the result.
Many of the participants who mentioned trying to change services found that they had no other option either because there was no other provider offering service in their area, or because there were no packages offered by their or other providers that would be better than their current plan. As one participant explained, “I have not changed because there are no other services that I know of [such as unlimited Internet] and there is only one provider to buy from.”
A few participants have been able to change Internet service providers and have been relatively happy with the results. For example, one participant in Guysborough switched providers from Seaside to Bell and was able to increase the speed and reliability of their service. Another participant stated, “I changed Internet service recently from Qiniq because it was really slow. Currently use Northwestel. This Internet is faster and more reliable.” Although a few people claimed to be satisfied with the changes they have made, this was not the norm for the majority.
Most participants who have changed their service are still dissatisfied to some extent. For example, a participant who could no longer use satellite due to the trees on their property has switched to a DSL provider; however they are now unable to upload or download files. Another participant decided to change Internet packages to accommodate an additional member of the household, however they still fear going over capacity, and claim the slow speed means online tasks take significantly longer (Amanda, Iqaluit, profile in Appendix D). Similarly, another participant switched to the best package available, but remains disappointed with the speed and download capacity available. When this participant was asked to provide additional comments he responded, “I just want to make it known that I'm very dissatisfied with my current service...” This type of reaction was common across all locations.
Participants have found many strategies to deal with the inconvenience of poor Internet service. A common strategy is to wait for trips to more urban areas to complete large tasks such as updating software, streaming video content, or downloading large files. One participant also asks family in southern Ontario to send flash drives containing large files in the mail. Some participants also wait until non-peak hours, reschedule activities, and prioritize tasks to make sure important things are done when the Internet is working. Other strategies include occupying time with hobbies, using a phone instead of Skype, or calling the service provider. Those with low capacities also tend to closely monitor what they download during the month, “we monitor our bandwidth closely so we don’t go over. If we really need to download something then we do it, but we’re really careful about what else we do online that month” (Amanda, Iqaluit, profile in Appendix D). A few other participants talked about scheduling lots of time to complete tasks on the assumption that a few attempts might be needed. Many participants have also given up on certain activities altogether. Common examples include downloading large files, streaming video, and online gaming.
Rural participants in the focus groups and interviews identified financial impacts in the form of higher monthly costs, overage fees, and getting double charged for online transactions.
Many also identified impacts related to loss of time and opportunities such as tasks taking longer due to slow speeds, lost time on school and work projects, lost time communicating with family and friends, lost scholarships, and lost employment.
Those taking part in online education described issues with uploading and downloading assignments, an inability to take part in online forums, or lost educational opportunities due to poor Internet speed.
A small number of rural participants have accepted their poor service as a consequence of small town living. Most, however, expressed frustration at their inability to keep pace with urban Canadians in terms of online activity.
Participants identified a number of things that they believe would change in their lives with better access to the Internet including, more freedom online to take part in entertainment, increased employment options, and less frustration completing tasks online.
Rural residents described a variety of ways that poor Internet service has impacted their daily lives. One of the most common complaints, which was identified in every discussion and interview, is that the price paid in rural areas tends to be more than urban areas (and for what is viewed as inferior service). Because of this, some participants have to weigh Internet service against other expenses. One participant explained, “Well obviously when you’re paying extra money toward your telecommunications that’s taking away from other things like savings, investments, education, vacations, possibly even food.” Another financial consideration that participants identified was overage fees incurred when available capacity is less than what is needed to function online. This means that they either have to stop using the Internet completely for the remainder of the month, or pay for the additional usage at a rate of approximately $20 per GB. Fees ranging from $50-$200 were mentioned as being additional costs paid in a single month.
Because of these issues, many of the rural participants are limited in what they can do online. Some communicated challenges with trying to complete daily tasks like banking and shopping. For a few participants, financial stress went beyond monthly Internet fees and overage charges. Many have either experienced or worried about bill payments and transactions failing when they encounter Internet disruptions. When they are unsure if the transactions have gone through, they must decide whether to try processing it again and risk getting double charged; “it can take days to get your money back.” One participant even indicated that the fear of her internet disconnecting during a purchase has stopped her from making online purchases altogether (Meaghan, Mont Tremblant, profile in Appendix D).
In addition to losing money, some people have lost time and opportunities. Some participants described this as time lost on school or work projects, or spare time lost due to tasks taking longer than need be, or time lost communicating with family and friends. This last point was particularly common with almost everyone mentioning missing out on talking to loved ones when disruptions occur. Some described lost opportunities for employment/scholarships or current employment as the result of insufficient Internet access. For some, this was because they were unable to get onto job listing websites, for others this was due to the inability to send or receive documents in a timely manner; “I tried to submit a scholarship application, but the Internet went down” (Oliver, Nunavut, profile in Appendix D). One participant claimed that as a criminal lawyer, time lost due to unreliable Internet connection is very important. He stated that paperwork on an initial arrest must be processed within 24 hours, but when this is done electronically, the poor service in his community can result in time lags, and as he puts it, “Individual’s rights are being violated due to telecommunication problems with transferring files” (Dwayne, Iqaluit, profile in Appendix D). Another participant noted that an employment contract was not renewed, primarily because she had ongoing difficulties sending files and other documents and was unable to find a solution to the problem during the period of the contract.
Many rural residents also experienced complications with online education. Some participants mentioned not being able to take part in certain aspects of their course such as online forums or watching video content. Some also identified incidences of not being able to download or submit assignments. A few participants said they were missing out on these learning opportunities altogether because they know their Internet does not satisfy the requirements. One participant who had to remain indoors for personal reasons decided to take an online course despite the poor connection. This participant ended up failing the course because the Internet would cut out almost immediately when he tried to connect. When asked if he would try again given access to better Internet he responded, “I would be sitting in my room doing online courses” (Stephen, Nunavut, profile in Appendix D).
Although the majority of participants expressed some impact in their life from poor Internet, some participants said that it does not bother them because it is what they have come to expect living in their area. “We live with it [the Internet service]. We come to expect it, living in Nunavut.” A few people made the point that, “we live in a big country, and we cannot have a high level of service everywhere.”
Rural participants talked about the many things that would change in their lives if they were given better access to Internet. The most common changes identified were more freedom online (with less bandwidth restrictions), meaning that people could download more, stream video, and use their Internet connection for entertainment; there would be more employment options, including the ability to work from home; there would be less frustration and more efficiency when completing tasks online; and there would likely be cost savings. One participant made a strong statement about what it would mean for his community, “On a broader level, the change for Nunavut would be impactful. Every service, such as telehealth, education, banking, justice in the North would improve. It’s not the silver bullet that solves all problems, but an improvement in telecommunication infrastructure is needed” (Dwayne, Iqaluit, profile in Appendix D).
Nearly all rural participants in the focus groups and interviews agreed that a minimum level of service is necessary.
Most argued that their lack of service in the areas of emergencies, health, education, economic participation, staying informed, and social needs, make access to Internet even more important to supplement these needs.
Some argue this is an issue of quality of life, and basic, reliable access to the Internet has become an essential service.
Nearly all rural Canadians consulted in the discussions and interviews agreed that a minimum level of service is a basic necessity. Only a few rural residents feel that Internet connectivity is something that cannot be expected when living in a rural or remote area. In each discussion the sentiment expressed was that those in isolated communities have an even greater need for Internet service. Participants noted that there is an increasing expectation of online connectivity. Without basic access to the Internet, there is further isolation, a lack of economic growth and participation, and a lack of access to essential services.
Areas cited by participants where residents’ necessities are compromised by a lack of minimum service include:
Emergencies – Residents in most groups noted feeling vulnerable in the events of emergencies. For example: traffic accidents cannot be reported due to limited or no cell phone service, Internet outages can result in isolation when residents are “thousands of miles” from emergency services.
Health and Essential Services – Many rural residents recognize access to health resources as a basic online need. These individuals identified that those in rural areas have a need for health services such as Tele-health which can link patients with their health care team. A few also noted the desire to research health issues in addition to, or in advance of seeking medical help.
Education – A lack of minimum service can affect access to education, not only for basic access to the Internet, but also for resources that require additional bandwidth to access. Residents of Tofino noted that while students are learning coding as part of a provincial program, they are not able to access the Internet to use coding resources provided by the Ministry of Education. A few note that access to online courses can help residents to stay in their community to complete basic education or obtain higher education.
Economic Participation – With on-line banking becoming a norm, some rural residents point to the need to pay bills and conduct other banking activities using the Internet. Similarly, some rural residents, particularly those in more Northern communities, indicate that online shopping is becoming a necessity to order products that are not available or more expensive in their community. Others noted the wholesale move, within their field or industry to conduct business online and many complained that poor access makes this a significant problem for business owners, as well as for the community in attracting new businesses to these remote communities.
Staying informed of current events – Many rural residents also use the Internet to access the news, either through online articles or videos. A few subsequently mention that they either do not have a television, or would prefer to use the Internet in place of a television to select news articles of personal interest and relevance.
Social needs – While not cited as a critical or “basic” need, many rural residents would like to access the Internet for social or entertainment purposes. Some use social media or communication tools such as Skype to stay connected with friends and family in other communities. Some want to download music or use streaming services for entertainment such as Netflix or YouTube. However, with limited bandwidth available, rural residents offer that these types of activities are limited in lieu of the more important uses of the limited data usage available.
Some rural participants argue that these areas of compromised service can also mean a compromised quality of life. For example, a senior citizen from a small northern Ontario community who believed the quality of life would be compromised was initially not looking forward to returning to small town life. However, on her return, she found that the Internet meant that she was now able to enjoy the up side of rural life without having to deal with nearly as many drawbacks. “We were isolated, and we did not know what was going on in the rest of the world and I think the Internet has broadened those horizons and has made living in these small communities a wonderful thing” (Grace, Kirkland Lake, profile in Appendix D). With online banking, online shopping, and social media, she was now able to access more of what she needs and feel less isolated. She was fortunate to move to an area where the issues with Internet are relatively minor, not all rural areas have this experience.
Most rural participants in the focus groups and interviews believe it is the government’s responsibility to ensure a minimum level of access (create a ‘fund’ to build infrastructure).
Some also believe it is the responsibility of all levels of government or the telecommunications companies (that are making the money).
Many feel they did not know enough about the CRTC to attribute responsibility.
Most rural participants believe that the cost of basic, reliable access to the Internet should be equal across the country or at most, only modestly more expensive in rural and remote areas than it is for urban consumers.
As previously described in Chapter 2, more than four in ten respondents in each survey see the responsibility and best model for paying for a minimum standard of access to the Internet as a combination of market forces, direct government intervention, and a CRTC fund. Roughly one in five in the representative survey see this as best dealt with through the establishment of a fund by the CRTC, and just slightly fewer see direct government intervention as the best approach, although the latter has higher support in the open survey. In the representative survey, the CRTC fund has stronger support among rural residents than it does among urban residents (26 versus 21 per cent).
Those rural residents in the representative survey who are more likely to support a CRTC fund as the best approach to ensuring minimum access to the Internet for all Canadians are in Quebec and have smaller households.
Some sentiments expressed regarding the need for Internet as an essential service that enables Canadians to participate in today’s digital environment are:
“I wish that it (the Internet) didn’t exist, but now that we have it, everything is online. We (rural residents) (have to stay connected). We can’t be left behind”.
“Modern life is all online now. That’s just the way it is”.
“There is an ever increasing expectation that everyone is online. This means that many services can only be accessed if you are online, and some government and business services are being reduced offline in favour of online, so if you aren’t online, you simply miss out.”
Rural Canadians articulated many reasons for why they believe that everyone, including those living in rural or remote communities, should have minimum level of access to the Internet. A selection of these include:
“If everyone has Internet, you can put down the price overall.” (Iqaluit)
“We need to be equal, even though we live in the North. Everywhere should be the same. It’s not like that right now.” (Iqaluit)
“Canada thinks of itself as a Northern country. The North is not an empty place. We are as Canadian as someone from Toronto or Vancouver. We also play a role in sovereignty in the north. We expect and demand the same level [of telecommunications connectivity] as other citizens in Canada.” (Iqaluit)
“If the Internet service was better, less young people would leave for the city.” (Guysborough)
“I would liken [expanding Internet connectivity] to the … railroads of the 19th century that built Canada.” (Tofino)
“If you live in the North you are providing services to those who live in the cities – they should in turn be made more hospitable by ensuring the daily amenities are open to all who live there. If you like gas in your car, or pulp and paper then you need to consider the needs of those who provide these goods to you.” (Slave Lake)
“It should be like health care or basic education: available to everyone, as a basic requirement for all Canadians”. (Kirkland Lake)
“The Internet could give people in the North a voice.” (Oliver, Nunavut, profile in Appendix D)
This basic Internet service, at a minimum, would allow for consistent and reliable connection to the Internet for accessing e-mail and websites. In addition to a consistent and reliable connection, many residents articulate a need for increased downloading limits as these residents feel constrained by these limits on a monthly basis and must prioritize their activities. Others spoke of the need for reliable streaming of content from websites and two-way video for calls as a basic necessity.
Most rural Canadians participating in the discussions feel that it is the federal government’s responsibility to ensure that there is a minimum level of access to home-based Internet everywhere in Canada. Some also say it is “everyone’s” responsibility, which includes all levels of government (local, provincial/territorial and federal), aboriginal groups, and the telecommunications companies. Some feel that it is primarily the responsibility of the telecommunications companies as these companies typically operate in more than one jurisdiction and have the infrastructure and financial motivation expand their customer base and improve service for existing customers (as stated, “better service and prices come from competition and not government regulation”). Still, some respondents have a general distrust of either the involvement of the government or the telecommunication companies in terms of additional government intervention or the lack of will to ensure better service, respectively.
Many respondents said that they are not knowledgeable of the role of the CRTC and how the agency could be involved in ensuring access to Internet services. Of those who feel there should be federal government involvement, most feel that the CRTC should serve as the lead in representing federal interests by bringing together the relevant governments, agencies, and telecommunications companies. Even some who feel that the responsibility falls to the telecommunications companies to expand Internet service supported the need for the CRTC to establish requirements for minimum access and conditions for pricing.
The assignment of responsibility for paying for the additional infrastructure needed to ensure minimum or greater levels of access to the Internet is varied. Many residents of rural and remote communities felt that a government subsidy or “fund” should help in the cost of establishing the infrastructure to ensure a minimum level of access to the Internet. Congruently, those who feel that the telecommunication companies should be responsible for providing the minimum level of access also feel they should be responsible for paying to establish that access. Some point to a “user pay” model which essentially supports the telecommunications companies paying for the infrastructure and then benefit through consumers paying for the service.
As previously described, and expected, rural residents in both surveys are more apt to support pricing for telecommunications services in rural areas that is the same as it is for urban residents. Surprisingly, it is rural residents with unlimited capacity that are most supportive of equal pricing (84 per cent). Rural residents in Quebec and Ontario are also most apt to support equal pricing. Also, surprisingly residents of the Territories (44 per cent), as well as those with the lowest data caps (35 per cent) are the most likely to see the need for a little bit higher pricing in rural areas.
Most rural Canadians feel that the cost to consumers for Internet access should be similar across Canada; more specifically, that those in rural areas should not pay more than those in more urban areas. Some residents of more Northern communities indicate that the cost might be modestly more expensive, particularly given the remoteness for enhancing infrastructure and associated higher cost of living generally. Further, many individuals distinguish between users paying for a basic level of Internet service and the option to pay for a higher level of service which allow for download/upload capabilities similar to those found in more urban settings.
The vast majority of Canadians, both urban and rural, use the Internet for a variety of purposes.
Many rural participants in focus groups and interviews described Internet service as an essential element of modern life.
Canadians receive their Internet service through a variety of delivery systems, and although some are more common (cable), there are clear geographic patterns associated with which is used.
There is a dichotomy among the one in five Canadians who have limited use of the Internet in the last 12 months; some heavy users limit use when reaching capacity, while others are limited by the quality of Internet services available.
While satisfaction for home Internet service is high overall, Canadians in rural areas are considerably more likely to express dissatisfaction.
Focus group participants in rural areas described a host of problems with home Internet service that resulted in losing money, time, and opportunities.
Discussion groups wholeheartedly agreed that a minimum level of service should be established by the government and coordinated by the CRTC. They also believe this process should result in equal (or only slightly higher for rural) pricing across the country.
Whether it be to conduct business or otherwise participate in the digital economy, or enjoy the conveniences of the digital age, the evidence paints a compelling picture of the near universal engagement that Canadians have online in a wide range of daily activities. In focus groups and interviews, many rural Canadians described Internet service as an essential element of modern, everyday life. One resident in Quebec compared it to the necessity for electricity in a post-industrial world.
Survey results highlight that all but a very small segment of Canadian society use the Internet, in urban and rural areas alike. The Internet is used daily to communicate and engage with others, obtain information, access or purchase services or products, and consume culture or other entertainment. Canadians use the Internet to e-mail, access current events, research health information, conduct online banking, access government websites, research travel, community events, social network sites, buy and sell goods, and seek out entertainment. More Canadians now have Internet services at home than have a home telephone (89 per cent compared with 76 per cent overall, according to the representative survey). Two in three Canadians now also have access to the Internet on their cell phone, which is beginning to rival home telephones in terms of the percentage of Canadians who subscribe to each. So, it is not surprising to hear rural Canadians in the focus groups and interviews talk about their heavy, daily reliance on the Internet, at home and on the go. A comparison of the representative survey results with the 2010 Statistics Canada figures show a 50 per cent or larger increase across the board in almost all online activities. Online buying and selling of goods and services sit at the top of the list with a nearly four-fold increase in participation since 2010, followed closely by the downloading of software and music, online calls, contributing content to online discussions, gaming, and use of the Internet for (or to find) employment, which have more than doubled in five short years.
Canadians receive Internet service into their homes through a variety of delivery mechanisms. While some, such as cable, are more popular than others, there are clear geographic patterns of the type of services available in different parts of the country. These different services are also clearly associated with varying levels of service quality, including the reliability of the service, maximum download speed, and monthly data transfer allowance. Although not covered by the survey, focus group participants consistently lamented the paucity of adequate Internet services, and also spoke of the considerable cost associated with purchasing the inferior services available to them in many rural and remote areas.
Country wide, more than one in five Canadians with Internet service said that they limit their use (or at least have done so in the last 12 months). Most of the time this is related to the capacity of the service (i.e., reliability, speed, monthly data cap), or to the cost. The extent of limitations, however, is fifty per cent greater among rural consumers than it is among urban consumers, with one in three saying that they limit themselves to at least some extent, largely because of capacity or cost of their home Internet service. This is particularly acute in areas of the country served exclusively by DSL, fixed wireless and/or satellite, where reliability, download speeds, and monthly data allowances are vastly inferior to those reported by urban residents.
The differences in satisfaction levels that survey respondents provided for the reliability, speed, and cost of their home and mobile Internet service speak volumes about the differences in service offerings, and resulting limitations for rural residents. While overall satisfaction levels related to reliability and speed are fairly good (70 per cent or higher), they mask a significant digital divide that is both limiting and frustrating for many residents of rural and remote communities. A full one in three rural Canadians in the representative survey expressed dissatisfaction with the quality of their home Internet service. In the open survey, these numbers rise to half of rural respondents or more. Nearly one in four in the representative survey also rated themselves as dissatisfied with their mobile service.
Focus group participants and interviewees in rural and remote areas described at length, and with considerable passion, the limitations that they face on a daily basis in trying to communicate with others, in accessing goods and services, obtaining news, and enjoying the basic comfort and enjoyment that the Internet affords. In each of the discussions, rural residents emphasized the importance of being able to access the Internet, more so in these small communities than anywhere else, where services and products can be limited, prices can be high, and distances to friends and family can be vast. The barriers they often face prevent them from operating businesses or working effectively, interfering with their ability to participate in the digital world and reducing their sense of equal access to what has become one of Canada’s most basic services: the Internet. They described financial losses, as well as losses in time and opportunity that have implications for basic quality of life. Many expressed their frustrations about these barriers in terms of the differences in service compared with the quality available to urban residents, seeing this as a fundamental inequality against residents in communities that sometimes provide many essential services to other Canadians (e.g. in agriculture, oil and gas, and other natural resource rich communities).
All participants in the discussions in rural communities wholeheartedly agreed that Canadians should be able to expect a minimum standard of access to the Internet that allows everyone to participate in a world that is increasingly taking place online. This is rationalized, in part, by an ever increasing, underlying assumption that in today’s world everyone has reliable and effective Internet access. As a consequence, there are more and more services that can no longer be accessed without good Internet access. As such, rural Canadians see themselves as being at a considerable disadvantage by remaining in a rural area. Without reliable and adequate access to the Internet, rural residents express feelings of vulnerability due to a lack of access to health and essential services, education, economic participation, knowledge of current events, and social needs to mitigate isolation. Some note the ‘brain drain’ in their communities – or the problems of attracting new residents and businesses - and their own contemplation of moving to urban areas in order to better access these required services.
Results of the surveys and discussions with rural Canadians argue for urgent attention to fill gaps in infrastructure and service offerings to ensure a minimum standard level of access to the Internet. This is seen as sufficiently important and urgent to require the combined efforts of direct government intervention and funding, market forces exerting pressure on the telecommunications industry and the involvement of the CRTC in coordinating efforts and potentially establishing a fund to address the gaps. This is not surprising in the face of stories from rural participants who describe inability to lease rental properties with inferior Internet service; inability to effectively operate businesses without extreme adaptive measures; inability to attend school or obtain available scholarships; missing opportunities to apply for jobs; and inability to stay connected with friends and family around the world. All of this because of the inferior Internet access in their communities. Involvement of government and the CRTC in particular are also seen by most as fundamentally necessary to fix the problem, suggesting a lack of faith in the telecommunications industry, and basic market demand to resolve this issue. This may be particularly true because most Canadians see reliable access to the Internet as a universally necessary service that should come with universal pricing for urban and rural residents alike.
Modern telecommunications services, in particular broadband Internet, play an important role in the lives of Canadians. By completing this short survey, you are helping the Canadian Radio-television and Telecommunications Commission (CRTC) examine which telecommunications services Canadians consider necessary to participate in the digital economy. The CRTC is an independent agency of the Government of Canada responsible for regulating Canada's communication system.
We are asking Canadians to respond to this survey in terms of their own personal use of telecommunications services at home. It should take approximately 10 to 15 minutes to complete. Your participation in the study is voluntary and completely confidential and your responses will remain anonymous.
The completed survey must be received by the CRTC no later than February 29, 2016. If you prefer, you may complete the survey over the phone with an agent by calling 1-877-249-2782 from Monday to Friday from 8:30 a.m. to 4:30 p.m.
This study is being conducted by EKOS Research Associates Inc. on behalf of the CRTC. If you have any questions about the administration of the survey, please email jblanc@ekos.com or call 1-800-388-2873. The survey is registered with the Research Registration System.
We appreciate you taking the time to participate.
| What are the first 3 digits of your postal code? (Format: A1A) | |
|---|---|
| __ __ __ | Don't know / No response ▢ |
| 1.a Which of these telecommunications services do you subscribe to? (Select as many as apply) | ||
|---|---|---|
| Home (i.e. landline) phone service ▢ | Home Internet data service (and associated devices/applications) ▢ | |
| Mobile phone service | ||
| Voice (ability to make and receive phone calls) ▢ | Text (ability to send and receive text messages) ▢ | Data (ability to access the Internet) ▢ |
| Don't know / No response ▢ | ||
| 1.b If you subscribe to home Internet data service, how do you receive this service? | |||
|---|---|---|---|
| Telephone line ▢ | Cable ▢ | Satellite ▢ | Don’t know/No response ▢ |
| Other (specify): _______________________________________________ ▢ | |||
| 2. Which of these telecommunications services do you use most frequently? (Pick one only) |
|---|
| Home (i.e. landline) phone service ▢ |
| Home Internet data service (and associated devices/applications), including Wifi ▢ |
| Mobile phone service (i.e. cellphone for voice, text or data) ▢ |
| Don't know / No response ▢ |
| 3. Which of these telecommunications services do you expect to use most frequently in 5 years from now? (Pick one only) |
|---|
| Home (i.e. landline) phone service ▢ |
| Home Internet data service (and associated devices/applications), including Wifi ▢ |
| Mobile phone service (i.e. cellphone for voice, text or data) ▢ |
| Don't know / No response ▢ |
| 4. If you subscribe to home Internet data service, how often have you used Internet services for each of the following activities during the past 12 months? | ||||
|---|---|---|---|---|
| Never | Occasionally (less than once a week) | Frequently (Once a week or more) | Don't know / No response | |
| ▢ | ▢ | ▢ | ▢ | |
| Instant messenger (e.g. Windows Live Messenger, Yahoo Messenger) | ▢ | ▢ | ▢ | ▢ |
| Visiting or interacting with government websites | ▢ | ▢ | ▢ | ▢ |
| Researching medical or health-related information | ▢ | ▢ | ▢ | ▢ |
| Formal education, training or school work | ▢ | ▢ | ▢ | ▢ |
| Researching travel information or making travel arrangements | ▢ | ▢ | ▢ | ▢ |
| Employment (e.g. job search, telework) | ▢ | ▢ | ▢ | ▢ |
| Electronic banking (e.g. paying bills, viewing statements, transferring funds between accounts) | ▢ | ▢ | ▢ | ▢ |
| Researching investments | ▢ | ▢ | ▢ | ▢ |
| Read or watch the news online | ▢ | ▢ | ▢ | ▢ |
| Researching community events | ▢ | ▢ | ▢ | ▢ |
| Buying/selling goods or services | ▢ | ▢ | ▢ | ▢ |
| Social networking sites (e.g. Facebook, Twitter) | ▢ | ▢ | ▢ | ▢ |
| Contribute content or participate in discussion groups (e.g. blogging, message boards, posting images or videos) outside of social networking sites | ▢ | ▢ | ▢ | ▢ |
| Play online games | ▢ | ▢ | ▢ | ▢ |
| Download or stream music (free or paid) | ▢ | ▢ | ▢ | ▢ |
| Download software (free or paid) | ▢ | ▢ | ▢ | ▢ |
| Listen to the radio online | ▢ | ▢ | ▢ | ▢ |
| Download or watch shows, movies or video clips online (e.g. CBC.ca, Netflix, YouTube) | ▢ | ▢ | ▢ | ▢ |
| Make telephone or video calls online (e.g. Skype) | ▢ | ▢ | ▢ | ▢ |
| 5. Have you limited your use of Internet services for any reason in the last 12 months? | ||
|---|---|---|
| Yes ▢ | No ▢ Skip to question 6 | Don’t know / No response ▢ |
| 5b. If you limited your use of Internet services, what are the MAIN reasons? (Select as many as apply) |
|---|
| Internet Service-Related |
| Cost (of Internet service or equipment) ▢ |
| Capacity constraints (i.e. speed, bandwidth/data cap) or quality of service ▢ |
| Personal/Household-Related |
| Limited access to a device (e.g. computer, smartphone, tablet) ▢ |
| Multiple users drawing on the service at the same time ▢ |
| No need / no interest / not useful / not enough time ▢ |
| Lack of skills or training / Internet or computer too difficult to use ▢ |
| Confidentiality, security or privacy concerns ▢ |
| Disability-related barriers ▢ |
| Other, specify: _______________________________________________________________________________________ ▢ |
| Don't know / No response ▢ |
6. There is discussion today about whose responsibility it should be to ensure that a minimum standard of Internet service is available to all Canadians, particularly in rural and remote areas.
Some people say that it is up to the telecommunications service providers to decide when to provide this minimum standard (i.e. market forces will dictate when there is a business case to do so).
Others say that ensuring a minimum standard is a fundamental need and it is up to governments to fund this directly.
Still others say that it is the role of the CRTC* to establish a fund (i.e. that telecommunications service providers contribute to) in order to provide this minimum standard.
*The CRTC is an independent agency of the Government of Canada responsible for regulating Canada's communication system.
| Which of these is closer to your own point of view? | ||
|---|---|---|
| 1- Market forces ▢ | 2- Governments ▢ | 3- CRTC Fund ▢ |
| 4 - Some combination of these ▢ | Don't know / No response ▢ | |
| 7. If you subscribe to home Internet data service, how satisfied are you with the level of Internet service to your home, including Wifi? | ||||||
|---|---|---|---|---|---|---|
|
Very Dissatisfied
1 |
Somewhat Dissatisfied
2 |
Neither Satisfied Nor Dissatisfied
3 |
Somewhat Satisfied
4 |
Very Satisfied
5 |
Don't Know/ No response
9 |
|
| Reliability | ▢ | ▢ | ▢ | ▢ | ▢ | ▢ |
| Speed | ▢ | ▢ | ▢ | ▢ | ▢ | ▢ |
| Price | ▢ | ▢ | ▢ | ▢ | ▢ | ▢ |
| 8. If you subscribe to mobile phone service, how satisfied are you with the level of Internet service you receive on your cellphone, excluding Wifi service? | ||||||
|---|---|---|---|---|---|---|
|
Very Dissatisfied
1 |
Somewhat Dissatisfied
2 |
Neither Satisfied Nor Dissatisfied
3 |
Somewhat Satisfied
4 |
Very Satisfied
5 |
Don't Know/ No response
9 |
|
| Reliability | ▢ | ▢ | ▢ | ▢ | ▢ | ▢ |
| Speed | ▢ | ▢ | ▢ | ▢ | ▢ | ▢ |
| Price | ▢ | ▢ | ▢ | ▢ | ▢ | ▢ |
| 9. How do you think that prices in rural and remote areas within Canada should compare with prices in urban areas within Canada for telecommunications services such as landline phone, Internet or mobile wireless services? Do you think that they should be…? | |||
|---|---|---|---|
| The same ▢ | A little bit higher in rural and remote areas ▢ | Significantly higher in rural and remote areas ▢ | Don't know / No response ▢ |
| 10. If you subscribe to home Internet data service, as far as you know, what is the speed of Internet service that you subscribe to in your home (i.e. what is indicated by your Internet service provider)? This is sometimes referred to as the download or downstream speed of your connection (frequently measured in Megabits per second [Mbps]). | ||||
|---|---|---|---|---|
| Less than 1.5 Mbps ▢ | 1.5 to 4 Mbps ▢ | 5 to 9 Mbps ▢ | 10 to 14 Mbps ▢ | 15 to 24 Mbps ▢ |
| 25 to 49 Mbps ▢ | 50 to 99 Mbps ▢ | 100 to 150 Mbps ▢ | More than 150 Mbps ▢ |
Don't know /
No response ▢ |
| 11. If you subscribe to home Internet data service, as far as you know, what is the monthly data transfer capacity that you receive in your home (i.e. what is indicated by your Internet service provider)? This is sometimes referred to as a data cap, and it measures the maximum amount of data that you can send and receive over the Internet before you incur overage charges (frequently measured in gigabytes [GB]). | ||
|---|---|---|
| Less than 50 GB ▢ | 51 GB to 150 GB ▢ | 151 GB to 250 GB ▢ |
| 251 GB to higher preset amount ▢ | Unlimited ▢ | Don't know / No response ▢ |
These last few questions are for statistical purposes.
| 12. How many people live in your household? | |
|---|---|
| Number in household ___ | Prefer not to answer ▢ |
| 13. Are any of these household members under the age of 25? | ||
|---|---|---|
| Yes ▢ | No ▢ | Prefer not to answer ▢ |
| 14. If you have members under 25 in your household, in which of the following age categories do they fall? (Select as many as apply) | ||||
|---|---|---|---|---|
| Under 5 ▢ | 5 to 11 ▢ | 12 to 17 ▢ | 18 to 24 ▢ | Prefer not to answer ▢ |
| 15. How many of the following Internet-enabled devices do you have in your household? | ||
|---|---|---|
| Number | Prefer not to answer | |
| Computers/laptops | ________ | ▢ |
| Cellphones | ________ | ▢ |
| Tablets | ________ | ▢ |
| Smart TVs | ________ | ▢ |
| Gaming consoles | ________ | ▢ |
| Other (e.g. Apple TV, Roku, Blu-ray) | ________ | ▢ |
| 16. Are you…? | ||
|---|---|---|
| Male ▢ | Female ▢ | Prefer not to answer ▢ |
| 17. In what year were you born? | |
|---|---|
| Year of birth _______ | Prefer not to answer ▢ |
| 18. Would you be willing to indicate the age category in which you belong? | ||
|---|---|---|
| 18-34 years ▢ | 35 to 49 years ▢ | 50 to 54 years ▢ |
| 55 to 64 years ▢ | 65 or older ▢ | Prefer not to answer ▢ |
| 19. What is the highest level of formal education that you have completed? | ||
|---|---|---|
| Grade 8 or less ▢ | Some high school ▢ | High School diploma or equivalent ▢ |
| Registered Apprenticeship or other trades certificate or diploma ▢ | College, CEGEP or other non-university certificate or diploma ▢ | University certificate or diploma below bachelor's level ▢ |
| Bachelor's degree ▢ | Post graduate degree above bachelor's level ▢ | Prefer not to answer ▢ |
| 20. Which of the following categories best describes your total household income? This is the total income of all persons in your household before taxes. | ||
|---|---|---|
| Under $20,000 ▢ | $20,000 to just under $40,000 ▢ | $40,000 to just under $60,000 ▢ |
| $60,000 to just under $80,000 ▢ | $80,000 to just under $100,000 ▢ | $100,000 to just under $120,000 ▢ |
| $120,000 to just under $150,000 ▢ | $150,000 and above ▢ | Prefer not to answer ▢ |
| 21. What language do you speak most often at home? | |||
|---|---|---|---|
| English ▢ | French ▢ | Other ▢ | Prefer not to answer ▢ |
| 22. Which of the following categories best describes your current employment status? |
|---|
| Working full-time (35 or more hours per week) ▢ |
| Working part-time (less than 35 hours per week) ▢ |
| Self-employed ▢ |
| Student attending full time school (not working) ▢ |
| Unemployed, but looking for work ▢ |
| Not in the workforce (e.g. unemployed, but not looking for work, a full-time homemaker or parent) ▢ |
| Retired ▢ |
| Other ▢ |
| Prefer not to answer ▢ |
Thank you for completing the survey. If you would like further information on the consultation, you may visit www.crtc.gc.ca/talkbroadband or call 1-877-249-CRTC (2782) from Monday to Friday from 8:30 a.m. to 4:30 p.m.
In the representative survey sample, 76 per cent completed the interview as a self-administered form online. The remaining 24 per cent of the sample completed the survey over the telephone with a trained interviewer. The sample was drawn from all provinces and territories in a strategic fashion designed to include a higher than representative portion in the smaller provinces of the country (Saskatchewan, Manitoba, the Atlantic Provinces, and the three territories) in order to maximize the opportunity to detect regional differences in results. The sample source was members of the EKOS Probit panel; a pool of pre-screened respondents. This panel was specifically designed for surveys that could be completed online, by telephone or through a mix of both approaches. Our panel offers good coverage of the Canadian population (i.e., Internet, phone, cell phone), random recruitment (in other words, participants do not opt themselves into our panel), and equal probability sampling (that is, equal opportunity to be selected in the sample). All respondents to our panel are recruited by telephone using random digit dialling (i.e., random draw of listed telephone numbers, changing the last digits in order to create opportunities for unlisted numbers to also be included). Identity and information provided by these pre-screened respondents is then confirmed by live interviewers. The composition of the panel is a good reflection of the actual population in Canada (as defined by Statistics Canada). As such, our panel can be considered representative of the overall Canadian general public. The panel survey sample size yields a level of precision of +/-2.4 per cent, 19 times out of 20, for the sample overall and +/- 7 to 11 per cent for most sub-groups that could be isolated in the analysis (including age and gender segments, etc.).
The survey took an average of 13 minutes to administer on the telephone, by a pool of bilingual, trained interviewers. EKOS Research was responsible for questionnaire development, programming, translation, and testing of each questionnaire.
This nationally representative survey was monitored for sample efficiency (e.g., making multiple call attempts to reach households not initially reached, calling at various times of the day and weeks) and gender, age, regional and rural/urban quotas, as well as for general data quality. The survey was collected over two weeks from January 19 to February 2, 2016. Each telephone number in the initial sample was attempted up to eight times before retiring the number, and attempts were spread over the data collection period. The participation rate for the survey was 21 per cent.
The second sample source used in the analysis was an open consultation using the same survey questionnaire, completed by 28,794 individuals who accessed the link online or filled out paper copies (mail/fax). The open link survey was placed on the CRTC website on January 14th, as well as circulated on Facebook and Twitter. The open survey provided an opportunity for Canadians to express their views and have their voices heard regarding their use of the Internet and any service quality issues they may experience. It also provided another opportunity to engage with the CRTC on these issues. The open survey was closed on February 29th at midnight. Given that the respondents were self-selected and therefore do not comprise a random sample, the survey is not considered to be representative of the Canadian population and no margin of error can be applied to the results. Although no statistical testing can be applied, the results are nonetheless illustrative of the behaviours and views of a large number of Canadians, and results have been included in the report as a secondary survey source, in addition to the main, representative sample. As with any open consultation, this second survey was expected to include an over-representation of invested consumers of the Internet, including those who are more heavily engaged in online activities and those with higher levels of dissatisfaction with Internet services.
I am representing EKOS Research and these groups are being conducted for the Canadian Radio-Television and Telecommunications Commission (CRTC) to explore the importance of telecommunications services to Canadians and the impact of service quality on everyday lives.
IF ASKED: The CRTC is an independent agency of the Government of Canada responsible for regulating Canada’s communication system.
This research gives the CRTC a chance to hear real stories from Canadians living in smaller and more remote communities about what is working or not working with the telecommunications services they receive and how it affects their ability to what they need to do on a regular basis.
The session will last about an hour and 45 minutes. Explanation of format and “ground rules”:
Discussion is being audio taped so that I can listen closely to what you are saying and not be distracted by having to write things down.
All comments are confidential.
Please try to speak one at a time and be respectful of one another’s opinions.
No one is expected to be an expert on telecommunications. There aren’t any right or wrong answers to the things we’ll be talking about — we’re just looking for your honest opinions, as well as your own experiences in your daily lives.
It’s okay to disagree. Please speak up even if you think you’re the only one who feels a certain way about an issue. Everyone may have different experiences and different points of view.
Moderator’s role: raise issues for discussion, watch for time and make sure everyone has a chance to participate. Do not work for the Government of Canada nor in the telecommunications industry.
Please make sure that your cell phones, blackberries, etc are turned off.
Questions?
Let’s start by asking everyone to tell us their name and how long they have lived in <community name>, and add in 1 or 2 of things that they like best about living in this community?
And what are some of the more challenging issues of living in the community?
You each completed the survey when you were invited to participate and I’ve looked at those results. It looks like there is quite a range of use of home-based Internet services and mobile service. In this first part I will go around the table to briefly go back over some of the things you told us in the survey so we can get a better sense of who is using what telecommunications services.
So, first I want to ask each of you to tell me the type of home-based service you have, and whether you have changed the type of service that they receive in the last year or so?
What did you change and what were you trying to achieve by doing that?
Who has mobile service coverage that includes access to the web?
Has anyone changed the type of service that they receive in the last year or so?
What did you change and what were you trying to achieve by doing that?
What types of activities do you do online the most (e.g. daily or at least a few times a week), and how do you do them (mobile, home-based Internet, on a computer or tablet or smart phone)?
What online activities are the most important to you and/or your family? These might be the ones you do most often or the ones that keep you connected with others or the ones most important to your school or work.
What is it that makes these activities important?
What does it mean to you and your family to be able to do this/these online?
Would you be able to live in this community if you did not have at least basic Internet service in your home?
Let’s talk about the reliability of the Internet service you receive in your home. How would you describe it and what makes you say that? Can you provide some examples?
Is this constant or does it change according to the time of day or week?
How about the speed of the download speed that you get in your home? How would you describe that? Again, is this constant or do you find it fluctuates?
Are any of the issues that you have described worse for some activities, and not as bad for others? (For example, when watching YouTube versus sending emails)
Which are the activities that are harder for you to do?
Are there things that your Internet services have stopped you from doing entirely?
How do you usually deal with it? Is there anything that you do to get around it? (Live with it / do it anyway, wait and try again, use the Internet somewhere else?)
What is the impact for you or your family when you are having trouble doing these activities?
Is there anything that you do to reduce the impact? Anything you do to compensate for not being able to do these activities online how or when you want to?
Is there anything that you simply miss out on or lose as a result?
Is there an actual cost? What is it ($$$, lost opportunity, reduced quality of life or health)
How would you say that this makes you feel about the level of Internet service you have into your home? Would you describe it as a nuisance or minor frustration? Is it something that you would say causes you significant problems or hardship? Can you describe why this is?
What would change for you if you had better Internet service at home?
Do you think that there should be a guaranteed minimum level of service/access to the Internet that all Canadians should be able to expect or count on, no matter where they live in the country?
What do you consider necessary for all Canadians to be able to participate in today’s digital environment? In other words, what do you think that minimum level of service should be? What should all Canadians all be able to do online?
Whose responsibility do you think that it should be to ensure that there is a minimum level of access to home-based Internet everywhere in Canada (That everyone has what they need to be able to participate in today’s digital world)?
How do you think that this should be paid for?
Should it to be up to the telecommunications service providers to decide when to provide this minimum standard (i.e. market forces should dictate when there is a business case to do so)?
Or, do you think that ensuring a minimum standard a fundamental need, so it should be up to governments to fund this directly?
Or, do you think that it should be the role of the CRTC to establish a fund (i.e. that telecommunications service providers contribute to) in order to provide this minimum standard?
Or, should it be some combination of these?
For anyone who did not see this as something that the CRTC should be doing, what role, if any, do you think that the CRTC should play in ensuring sufficient access to broadband Internet services that allow Canadians to participate in today’s digital environment?
If you were talking to someone living in a major city, what would you say to them to convince them or make them understand your point of view about everyone’s need for a minimum level of access to the Internet?
How do you think that prices in rural and remote areas within Canada should compare with prices in urban areas within Canada for telecommunications services? What makes you say that?
Is there anything that we haven’t talked about that you want to talk about before we go?
Income: $40,000-79,000
Education: College/ CEGEP
Age: 50+
Number of people in household: 8
Number of devices: 29
Capacity of service: Don’t know
Speed of service: Don’t know
Ted's home Internet service is satellite based. He lives outside of town in the country and experiences sporadic Internet service at best as a result. He also does not have the option of subscribing to fibre optic service. Ted has a limited number of devices with two computers and one cell phone. He also has a home telephone.
Ted runs a plumbing business in town, and does it entirely on his cell phone. He does this because he claims it is not worth getting cable Internet service: “I can't even get a security system because it is run on the web, and I can’t get good enough service to make it worthwhile.”
He is unhappy (although understanding) that he is increasingly forced to shop online for parts he requires for his plumbing business. He would prefer to continue using the old printed catalogues that he used to use. He thinks many people are being forced onto the Internet (and others in the group agree with him). Because of this, he doesn't feel comfortable using the Internet, but also feels like it's necessary to compete with firms that offer everything on the web. However, he can't fully compete given the service available to him in Slave Lake. Ted went as far as to suggest that he wouldn't be able to operate his business without web access.
Even at his church, where Wi-Fi is installed, his connection will cut out for a second then come back, and with constant interruption in service. He also agreed with other participants, saying that simple weather conditions can affect Internet services; his cell can’t even work under some weather conditions although he has found that some cell companies are better than others.
Income: 125,000+
Education: Graduate Degree
Age: 35-49
Number of people in household: 5
Number of devices: 9
Capacity of service: Less than 50GB
Speed of service: 1.5-4Mbps
Alice owns a home in Slave Lake and rents another in Kanuso for work. This means that she has to pay for double of everything (home telephone, Internet, cable TV). Between her two locations, she has a variety of phones, tablets and computers in each. Both she and her husband have cell phones, but the service she experiences is so poor that she rarely uses hers.
Alice uses the Internet for her own education (she is completing an online MA program). While the Internet service is usually good, it doesn't allow everything that she needs for the successful completion of her program. For example, she can't take part in online class discussions in times of inclement weather such as a bad snowstorm. She also has trouble uploading larger files, which she needs to do as a regular part of her studies. When asked if she can’t try using WI-FI at a local café, she says the same problems exist there as she has with her home service. In her working life as a teacher, it makes a huge difference in her quality of life to be able to do lesson planning online: “If I can do it at all at home it is better for time with kids and family.”
As far as cell phone service is concerned, she understands it primarily as a tool for the safety of her kids; she often has to juggle work, school, and kids, and with the poor service she receives, she cannot be sure that she will be able to reach her husband: “I don't feel safe relying on it since we have had so many dropped calls.”
Alice uses Internet for “everything you can imagine – Skype, Netflix, gaming, but it is hard if we can’t be online for work, for studies.” She says that large files for her curriculum that need to be uploaded can never be guaranteed to work which makes it difficult to the point of being impossible. Indeed she had a research contract that wasn’t renewed because of this.
Alice was particularly strident in her demand that the North needs equal access, characterizing it as “equal rights for us.” she claimed that they need professionals up there as well and that if they are only accessing knowledge that only people in the far north or small communities would have, then they aren't enriching their societies as much as they can. When pressed, she argued in a more instrumental way, asking those in the south: “Do you want gas for your cars, do you want paper and wood? Then you have to allow us to live up here with similar services that you have down there.”
Income: Under $40,000
Education: High school diploma or below
Age: 50+
Number of people in household: 5
Number of devices: 17
Capacity of service: Unlimited capacity
Speed of service: 5-9Mbps
Grace receives Internet service into her home through a telephone line. She also has a mobile data plan. Between the five people in her household, there are six computers, five smart phones, four tablets, one gaming console, and one other Internet enabled device.
Grace is in her 60’s and grew up in Kirkland Lake. She moved away for several decades, however, and was not looking forward to coming back to Kirkland Lake. As she described it, she likes the small town environment and connects with others, but does not like the lack of access to variety and services that she can get in a southern Ontario community. Having access to the world through the Internet “made coming back to Kirkland Lake more tolerable”. Unlike in her previous years in Kirkland Lake, she was now about to get access to communications, information, the ability to connect with others, and shop online in a way that had not previously been available to her.
She uses the Internet for email, messaging and social media, as well as online banking and purchasing. She also visits some websites for information (government, education, health, music). Having Internet allows her to have access to the world and broadens her horizons; “…We were isolated, and we did not know what was going on in the rest of the world and I think the Internet has broadened those horizons and has made living in these small communities a wonderful thing.” Living in a small community like Kirkland Lake is possible because of the access she can gain to the world through the Internet.
She expressed dissatisfaction with her ability to get the type of Internet service that she wants. There have been reliability issues and service that suddenly goes down or freezes in the middle of activities/transactions. She says that she has spoken with the service provider on many occasions and is not able to get fibre optic service in her area. She reports some limitations with her online activities as a result. She says that her service includes a speed of 5-9 Mbps, and unlimited capacity. She is also unhappy about the cost of what she considers inferior service. It is often slower than she would like and a source of frustration. She has often wondered when her Internet service freezes in the middle of a financial transaction (e.g., purchase) if she has actually made the purchase or not and whether she would be charged twice if she goes back online to check.
Income: $80,000-125,000
Education: College
Age: 35-49
Number of people in household: 3
Number of devices: 12
Capacity of service: Unlimited capacity
Speed of service: 15-24Mbps
Fred is a teacher in Kirkland Lake and has lived in the community all of his life. He lives in a household with his wife and son. Between the three of them they own five comps, three smartphones, three tablets, and one game console.
Fred is a big gamer and so is his son, so they sometimes compete for bandwidth. Fred also has a sideline business helping others with computer problems including addressing security issues such as removal of viruses and malware.
Fred says he downloads everything (e.g., software, movies) and streams a lot of content (movies, DIY videos, TV), and is on a lot of online gaming sites. He uses email and messaging. He reads news, purchases and does his banking online. Fred does not spend a lot of time on information sites (e.g., government sites, health, education, travel, and investment) or on social media, although he reports that his wife is more heavily involved in social media communications.
Fred used to have problems with speed, but has switched in the last few years to East Link and no longer experiences any problems with capacity. His service is very reliable and meets his high demand for bandwidth. He reports the speed of his Internet service into his home as 15-24 Mbps, with unlimited capacity. He rated himself to be very satisfied with his home Internet reliability and speed, and is neutral about the cost he pays. He also says that he does not experience any limitations (although did note some competition with his son from time to time).
Fred, like others, said that he uses the Internet heavily to obtain access to the services that are not otherwise available to residents of Kirkland Lake. For example, he described some downloading of movies currently in theatres, which he sees as reasonable because there is no movie theatre in Kirkland Lake, so his only options are to download them over the Internet, travel several hours to go to a theatre in North Bay, or wait until the movie is released.
As Fred listened to other participants describe some capacity limitations in some areas/neighbouring towns, he said that he is currently thinking about moving to one of those neighbouring communities, but would be doing extensive advance research about the availability of Internet service, particularly into his home. If he is not able to get the service that he needs to be able to continue his currently activities online, he would simply not move there. Having to go backward in Internet service would be a deal breaker for him.
Income: Under $40,000
Education: High school diploma or below
Age: 18-34
Number of people in household: 2
Number of devices: 10
Capacity of service: 80GB
Speed of service: Don’t know
Helen is a home owner who wants to be able to rent out her home and have Internet be part of that package. She used to be happy with the Internet provider she used, although she described the service as rocky. Once the trees around her home grew to a certain size, she was no longer able to use the same provider. Her only option now is to use Xplornet which she describes as much more expensive and limited. Despite these drawbacks, she is happy with the level of service she is receiving from this provider. She believes that the expensive Internet service she has is preventing her from being able to rent out her home. The limited capacity she has also means that she cannot do everything she and her son want to do online. Her son, who she describes as a big gamer, now spends a large portion of his free time at his grandfather’s house where there is no bandwidth limit. He has had to bring all of his games, computer, and even his Christmas gifts over to his grandfather’s house so he can actually use them.
Helen does a variety of activities online and mostly uses her phone to complete these tasks. She frequently accesses her email, government websites, gets medical information, travel information, education information, performs online banking, reads and watches the news, makes online purchases, uses social networking, plays games, streams music and movies, and uses Skype. Helen is a high user for Internet, and the difficulties she has experienced trying to get reliable service into her home has caused her to be very dissatisfied with the process overall.
Income: Under $40,000
Education: High school diploma or below
Age: 50+
Number of people in household: 2
Number of devices: 3
Capacity of service: Don’t know
Speed of service: Don’t know
Ben is a local business owner who relies on the Internet for the successful operation of his business. Although he has few problems with the Internet service he receives in his business, he recognizes the importance of the service remaining up. He also recognizes how beneficial having an Internet connection is to his customers and how this aids in the operation of his business. His customers who have access are able to come to his store well informed of their options and can bring pictures or have someone at home send them in. He and his wife have fairly limited needs (connecting with family, some basic gaming), however, he describes his home Internet service as spotty and unreliable, as well as slow.
When talking about whether Internet should be considered an essential service, Ben asked where Canada would be if we hadn’t decided that things like healthcare and education should be universally available. When commenting on price, he compared it to sending a letter. Whether he is sending a letter to the next town over or across the country, the price is the same. He suggested it should be the same with Internet, once it is considered a necessary service people should not be penalized with higher prices depending on where they live.
Income: $80,000-125,000
Education: College diploma
Age: 50+
Number of people in household: 2
Number of devices: 5
Capacity of service: Less than 50 GB
Speed of service: 1.5-4 Mbps
Thomas lives with his wife approximately 6km from the town of Tofino. Together they have one desktop, two tablets, three laptops, and have one cell phone. They try to use the Internet but find it nearly impossible for the most important things – using Seaview cable (which is very unpopular among all group members that use it or have used it in the past). Cell phone barely functions in the house, and friends using Rogers can’t get service at all.
Worse still his wife is a graphic designer and she can’t function because she can’t send files on 3mbps speed so has to constantly look for solutions. Sometimes she uses Dropbox to upload files but leaves it on all night to upload what should take five minutes or less. But even this sometimes drops out for a few seconds and she has to start over again. Or she goes into town to look for a better signal. But there is never an easy reliable method for her to send work to clients.
He is a contractor and while it doesn’t affect him quite as directly as his wife he can’t use Skype for remote video discussion, and therefore can’t show clients project material etc. Thomas also knows that poor service has meant that people that have considered moving here to set up businesses (or just to have a second home that they could work from if needed) cannot do so. Thomas was on the town council a dozen years ago and this was an issue even then; how to link economic growth with better or extended cell and Internet service. He agrees that service is better than before to be sure – there used to be a single line that would get cut by the weed eater and then no one had service.
Income: Under $40,000
Education: High School or less
Age: 18-34
Number of people in household: 1
Number of devices: 5
Capacity of service: 51-150 GB
Speed of service: 1.5-4 Mbps
Eric is younger man who manages a hotel in town and has managed to secure an arrangement whereby he lives on the hotel grounds year round (which is to say that it might be expected to get better access – but they get 10Mbps for all users at the hotel). He has a laptop and cell phone for both work and his own use. He moved to Tofino about eight years ago, at the time planning to stay for one summer but now has no intention of leaving. He uses the Internet for work (and notes that he has to sell the lack of functional Wi-Fi to hotel guests as a positive in that it forces kids to put down their electronics and actually go outside to play). He uses the web for Netflix and gaming and tries to use Skype to call family in Australia and Ontario, but it so rarely works that he has all but stopped using it. He also notes that he has all of his online services - for example Netflix – set to the lowest definition playback.
He pays a little extra for a ‘premium home office package’ and with this is supposed to get 3mbps download, but in reality the speeds are measured in kbps. This is because he lives about 6km out of Tofino proper and so doesn’t expect equal speeds, but finds that for many uses, his access to the web is very limited. Indeed at the end of the session, after hearing the varying quality of service, he said he was actually quite angry and would try to get a better or different service. His cell phone service is generally good but he finds there are dead zones, and that more generally service just disappears for no reason and with no particular timing. This, Eric suggests, is common to pretty much anyone living on the island.
Income: $80,000-125,000
Education: High school diploma or below
Age: 35-49
Number of people in household: 3
Number of devices: 5
Capacity of service: Less than 50GB
Speed of service: 1.5Mbps to 4Mbps
Veronica receives her home Internet through cable service, and also has a TV and cell phone. She has chosen Cogeco for her cable, telephone, and Internet. For a time, she went with Bell, but found that their service was unreliable. Now that she is back with Cogeco, she believes that the service is reliable and the speed is good.
Her daughter uses the Internet to do searches for school, watches YouTube, purchases items from Kijiji, participates in social networks, and conducts pre-purchase research. Veronica on the other hand finds using her tablet on Wi-Fi is very slow. She spends about $140 per month for Internet, telephone, and TV. She claims that she has to use her Internet access at work to do everything. She pays her bills online at home. She considers it frustrating, but since it is private, would rather do it at home.
She says that Netflix works well via her Wii. Her reason for going with Netflix is the limited number and high price of English stations in her community.
She also stated that she has very limited use of her cell phone. Veronica believes her community is behind in terms of access to the new world.
Income: $40,000-79,000
Education: Undergraduate degree
Age: 50+
Number of people in household: 2
Number of devices: 9
Capacity of service: Don’t know
Speed of service: 1.5-4 Mbps
Meaghan gets her home Internet through satellite service and also gets TV, home phone, and cell phone. She is with Bell for her cell phone, which does not work everywhere in her home, but is still faster than trying to use Internet. She purchases her Internet from Xplornet and considers it unreliable. The service goes down if there are local storms or storms in New Brunswick, and speed tests have revealed that her service is much slower than promised. There is plenty of capacity in her package, but she can’t use it because it is too slow for streaming. At an approximate rate of 10 hours to download a movie, streaming is out of the question. She used to have a Bell turbo key, but found it too costly, hence switching to satellite service, but she could go back to Bell. She has also considered using Filau, but she is 3km away from the village and they have decided not to implant a tower close to her home. Meaghan works for a school board that has faster Internet than her home, but several websites are blocked.
She tries to use her Internet connection for banking, and would like to use it for downloading music and making online purchases, but her connection is too slow. She is afraid to make a purchase online because if there is a sudden disconnection, she cannot be certain of the validity of the transaction. In total she spends almost $300 per month on telecoms between TV, home telephone phone, cellular, and Internet.
Income: $125,000+
Education: Graduate degree
Age: 35-49
Number of people in household: 3
Number of devices: 8
Capacity of service: Less than 50 GB
Speed of service: 1.5-4 Mbps
Dwayne is a lawyer who enjoys the lifestyle and the balance between work and family life that come with living in a small community, but practicing criminal law means that he is also familiar with the social issues that are also part of his community. He also feels that the products available to him are expensive.
Dwayne used to receive the lowest Internet package available from his provider, but has increased to the mid-range package in an attempt to improve his speed and his download capabilities. Dwayne goes online mostly to read the news, watch news videos, check his emails, and buy products that are not readily available to him. Because he doesn’t own a TV, his Internet connection is his main tool to stay informed about what is going on in the world around him and to stay connected. He believes that he can ‘live’ without the Internet, but definitely appreciates the connection to the outside world. To this point, he has refused to buy a smart phone because he feels that a flip phone works better with the lifestyle he has chosen and because he just prefers to use it.
Although Dwayne does not seem find the Internet extremely important for his home, his job has given him a unique perspective about what it means for the community at large. First are matters of health and safety. Dwayne notes that the Internet can go down for days at a time and recalls a situation a few years back where there was a blackout on telecommunications which he argues can be very dangerous when your community is thousands of miles away from support. Another issue he has experienced is the inability to get files from police for his clients pertaining to the arrest. These documents need to be processed within 24 hours, and according to Dwayne, “Individuals’ rights are being violated due to telecommunication problems with transferring files.”
When asked what would change for him if there was better access to the Internet, he explained it would mean the freedom to access what wants/needs to online, but importantly he explained what the greater impact would be on his community, “On a broader level, the change for Nunavut would be impactful. Every service, such as telehealth, education, banking, justice in the North would improve. It’s not the silver bullet that solves all problems, but an improvement in telecommunication infrastructure is needed.”
Income: $80,000-125,000
Education: University degree
Age: 18-34
Number of people in household: 2
Number of devices: 3
Capacity of service: Less than 50 GB
Speed of service: Don’t know
Amanda is a young, dedicated teacher who moved to Iqaluit about five years ago from a larger Southern Ontario city. She loves the weather in Iqaluit, despite the fact that it is often cold, and she loves the increased communication with her neighbours living in a small community. Her biggest issues with living in a small place are not having access to resources that she needs and the poor technology available.
Amanda spends a lot of her time preparing for school and thinking of ways to improve her teaching method, so it is no surprise that she spends most of her online time looking for things that will help her kids get the most out of their educational experience. Amanda mostly follows teaching blogs, finds ideas for school on Pinterest, and goes on Google in search of new lesson plans. She also uses Facebook and a few other social media sites to keep in contact with her friends and family in Southern Ontario.
Amanda does not consider herself an intense Internet user, and explained that she was able to get by with 10GB per month when she was living alone. Now she lives with her boyfriend who recently decided to join her up North. Once he moved in, they decided to increase their Internet package to the biggest one available (30GB per month), but despite this increase, they still find that it does not fit their needs. She finds that trying to get the information she needs for her job arduous. Although she claims her service is relatively reliable, she says that speed is a major issue for her, and makes everything she does take a great deal longer. “For me it eats into my spare time. I work all day and I try to plan for my job at night. The longer it takes for me to do things online, the longer my planning time takes and then I’m eating into my down time and my time relaxing spending time with my boyfriend and my dog.” She also feels that she doesn’t have an option to complete this work anywhere else. She depicts the Internet at her school as largely having the same speed problems as her home connection, and with the additional hurdle of many of the websites she relies on being blocked. Many people have asked her why she doesn’t try using the local library. She explained that not only does the library have similar issues with speed, but it also means she runs the risk of running into her students while she is there, and this often means increasing her time there significantly.
Amanda is a strong believer in equal opportunity, and these beliefs have been strongly shaped by the kids that she teaches. She argues that the high prices for Internet in the North means that if teachers ask their students to connect to educational material online, the more wealthy members of the class may have an easier time completing this task than those whose families cannot afford Internet. She also believes this same issue applies between access in the North versus the South. Kids in urban areas have the benefit of so much information that cannot easily reached by those in the North. She also makes the point that people are being forced online more and more, “Every government office that you deal with will always say there are forms online, you can do this online. If for some reason you don’t have home Internet you would be forced to go to a library or a public place, but then we’re told you shouldn’t be doing personal things in a public place, so where do people fill out these confidential documents for different government agencies or for their jobs if they can’t afford Internet at home?” For these reasons, she believes there should be a minimum standard for service, and that pricing should be regulated so that people in the North and South are paying comparable fees.
Income: under $40,000
Education: completing post-secondary course
Age: 18-34
Number of people in household: 5
Number of devices: unknown
Capacity of service: Less than 50 GB
Speed of service: unknown
Stephen is a young student from Nunavut currently completing a program in arctic studies in Ottawa Ontario. In Nunavut, Stephen lives in Cambridge Bay with four family members. He has two modems connected to the Internet, and each one has a capacity of 15GB per month ($145). He notes that at the beginning of the month this is fine, but after about a week there is nothing left.
When asked about what activities were important to him, Stephen explained that when his grandmother was sick in the hospital (in another province) Facetime became an important activity for his entire family. They would be able to schedule this once a month, but would lose Internet before too long and have to wait until the Internet resets at the beginning of the new month to be able to talk to her again.
Completing online courses was cited as an interest of many of the students, including Stephen. When he was recovering from his own stay in the hospital, he decided to take an online course. Because his Internet connection is so slow and unreliable, he was not able to keep up with course requirements and ended up failing completely. “The Internet would cut out right away, so I ended up failing the online course.” When the researcher asked him if he would try again if he had better access he replied: “I would be sitting in my room doing online courses.”
Income: under $40,000
Education: completing post-secondary course
Age: 18-34
Number of people in household: unknown
Number of devices: unknown
Capacity of service: Less than 50 GB
Speed of service: unknown
Oliver is a young student from Nunavut currently completing a program in arctic studies in Ottawa Ontario. In Nunavut, Oliver lives in Clyde River. Like many of the other students, Oliver has a capacity of 15GB per month ($136), but states that he often ends up using about 25GB per month or more, meaning that he is incurring overage fees (at a rate of $20 per GB).
According to Oliver, some of the more important activities he does online include paying bills and shopping for things he cannot get in his community. He says that since he has been in Ottawa, he has not purchased anything online. Oliver explains that companies who try to modernize their website with flashy images can be an issue when he is trying to buy things online. He claims it makes the process take longer and uses more of the capacity.
Oliver feels that the speed he is getting is a lot slower than what his provider is claiming he gets. He also finds that his Internet connection is throttled down long before he reaches his monthly limit. He once tried getting a scholarship for school and missed the deadline due to losing his Internet connection. Because he missed the deadline, he was not able to get an extension despite his reasons.
He believes that there should be a minimum access that includes video streaming because. “Nowadays, it’s all video.” He also believes the minimum standard needs to take into account that multiple people will be living in the same house and illustrates this argument by describing how much more difficult things are when everyone in his household tries to use the Internet at once.
Although he believes there should be minimum access to the Internet, he fears that the increase in connection may keep people from spending time with one another and creating a social connection. On the positive side, he believes that having better access to the Internet would mean that he and others would be able to take part in hobbies and find things they are interested in (which is especially helpful during blizzards).
He is passionate about learning and uses his time online to research topics he is interested in. He claims this is the only way he can figure out the things he wants to know. He generally finds online articles with information and avoids videos because they often will not play and take up too much bandwidth. A specific area of interest for Oliver is computers and he hopes to learn a lot more about them.
Interviews collected online do not require the same level of resources as surveys administered by a live interviewing team.
For more information on Nunavut Sivuniksavut see: http://www.nstraining.ca/.
This refers to the maximum download speed indicated by service providers and not the actual download speed that consumers see in practice.
The results on Table 2.4 do not match the chart on the previous page, as the results in the table are presented from among only the respondents who were able to provide their download speed, exclusive of the 50% of respondents in the representative survey and 18% in the open survey who do not know their download speed.
http://www5.statcan.gc.ca/cansim/pick-choisir?lang=eng&id=03580153
Readers should note that the representative sample also likely under represents Canadians with a disability, so this figure is potentially underestimated.