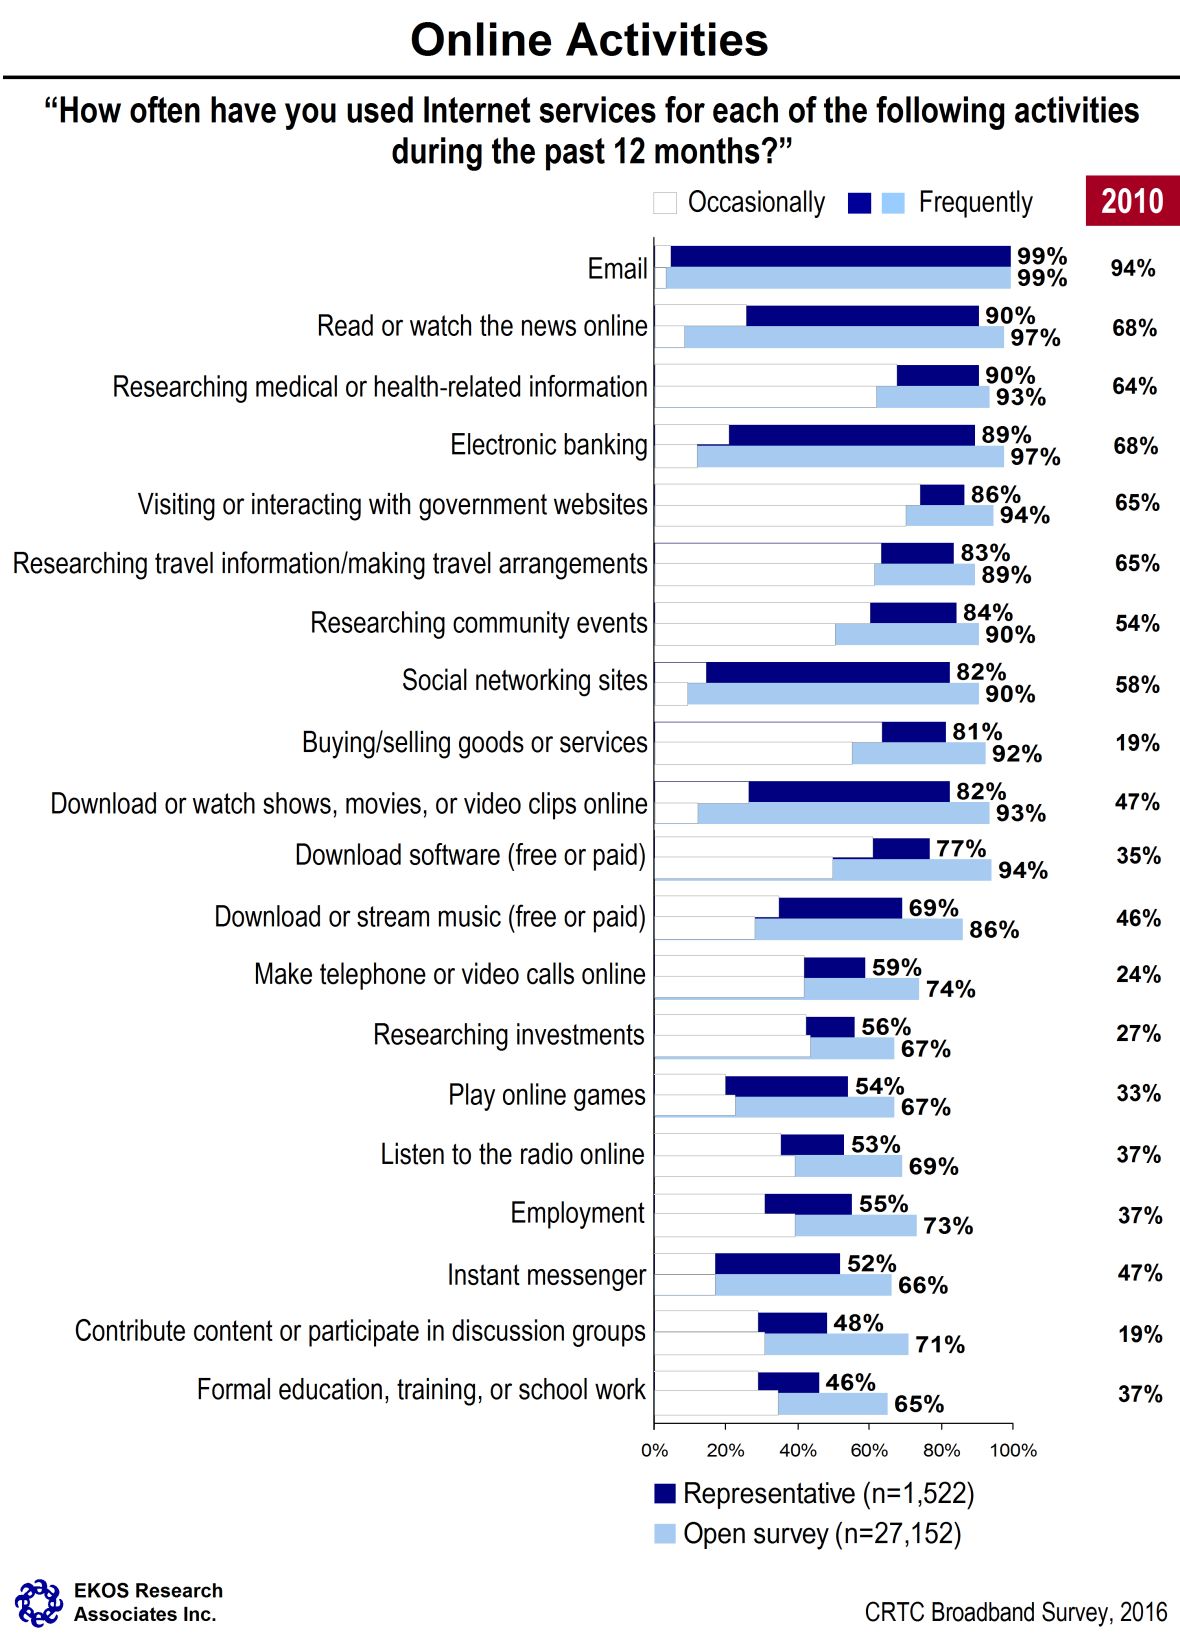
This horizontal bar graph is titled “Online Activities.” For both the representative and open surveys, it shows the breakdown of answers to the question, “How often have you used Internet services for each of the following activities during the past 12 months?” The bars on the graph are shaded to show the rough proportion of people responding that frequently do the activity and the numbers correspond to the total percentage of respondents who take part in the activity. These results are compared to the results of a 2010 Statistics Canada survey. The 1,522 respondents in the representative survey who have home Internet answered as follows:
-
Email, 99%, with almost all indicating that they do this frequently
-
Read or watch news online, 90%, with over two thirds indicating they do this frequently
-
Researching medical or health related information, 90%, with less than third indicating that they do this frequently
-
Electronic banking, 89%, with three quarters indicating that they do this frequently
-
Visiting or interacting with government websites, 86%, with less than a quarter indicating that they do this frequently
-
Researching travel information/ making travel arrangements, 83%, with one quarter indicating that they do this frequently
-
Researching community events, 84%, with over one quarter indicating that they do this frequently
-
Social networking sites, 82%, with more than three quarters indicating that they do this frequently
-
Buying and selling goods or services, 81%, with less than a quarter indicating that they do this frequently
-
Download or watch shows, movies, or video clips online, 82%, with about two thirds indicating that they do this frequently
-
Download software (free or paid), 77%, with less than a quarter indicating that they do this frequently
-
Download or stream music (free or paid), 69%, with under half indicating that they do this frequently
-
Make telephone or video calls online, 59%, with under a third indicating that they do this frequently
-
Researching investments, 56%, with a quarter indicating that they do this frequently
-
Play online games, 54%, with just over half indicating that they do this frequently
-
Listen to the radio online, 53%, with just under a third indicating that they do this frequently
-
Employment, 55%, with just under half indicating that they do this frequently
-
Instant messenger, 52%, with just over half indicating that they do this frequently
-
Contribute content or participate in discussion groups, 48%, with over a third indicating that they do this frequently
-
Formal education, training, or school work, 46%, with one third indicating that they do this frequently
The 27,152 respondents in the open survey who have home Internet responded as follows:
-
Email, 99%, with almost all saying they do this frequently
-
Read or watch news online, 97%, with almost all indicating they do this frequently
-
Researching medical or health related information, 93%, with about a third indicating that they do this frequently
-
Electronic banking, 97%, with almost all indicating that they do this frequently
-
Visiting or interacting with government websites, 94%, with a quarter indicating that they do this frequently
-
Researching travel information/ making travel arrangements, 89%, with a third that they do this frequently
-
Researching community events, 90%, with almost half indicating that they do this frequently
-
Social networking sites, 90%, with almost all indicating that they do this frequently
-
Buying and selling goods or services, 92%, with less than half indicating that they do this frequently
-
Download or watch shows, movies, or video clips online, 93%, with most indicating that they do this frequently
-
Download software (free or paid), 94%, with under half indicating that they do this frequently
-
Download or stream music (free or paid), 86%, with about two thirds indicating that they do this frequently
-
Make telephone or video calls online, 74%, with less than half indicating that they do this frequently
-
Researching investments, 67%, with about a third indicating that they do this frequently
-
Play online games, 67%, with about two thirds indicating that they do this frequently
-
Listen to the radio online, 69%, with less than half indicating that they do this frequently
-
Employment, 73%, with half indicating that they do this frequently
-
Instant messenger, 66%, with about two thirds indicating that they do this frequently
-
Contribute content or participate in discussion groups, 71%, with over half indicating that they do this frequently
-
Formal education, training, or school work, 65%, with just under half indicating that they do this frequently
Source: CRTC Broadband Survey, 2016
Participants from the 2010 Statistics Canada Survey answered as follows:
-
Email, 94%
-
Read or watch news online, 68%
-
Researching medical or health related information, 64%
-
Electronic banking, 68%
-
Visiting or interacting with government websites, 65%
-
Researching travel information/ making travel arrangements, 65%
-
Researching community events, 54%
-
Social networking sites, 58%
-
Buying and selling goods or services, 19%
-
Download or watch shows, movies, or video clips online, 47%
-
Download software (free or paid), 35%
-
Download or stream music (free or paid), 46%
-
Make telephone or video calls online, 24%
-
Researching investments, 27%
-
Play online games, 33%
-
Listen to the radio online, 37%
-
Employment, 37%
-
Instant messenger, 47%
-
Contribute content or participate in discussion groups, 19%
-
Formal education, training, or school work, 37%