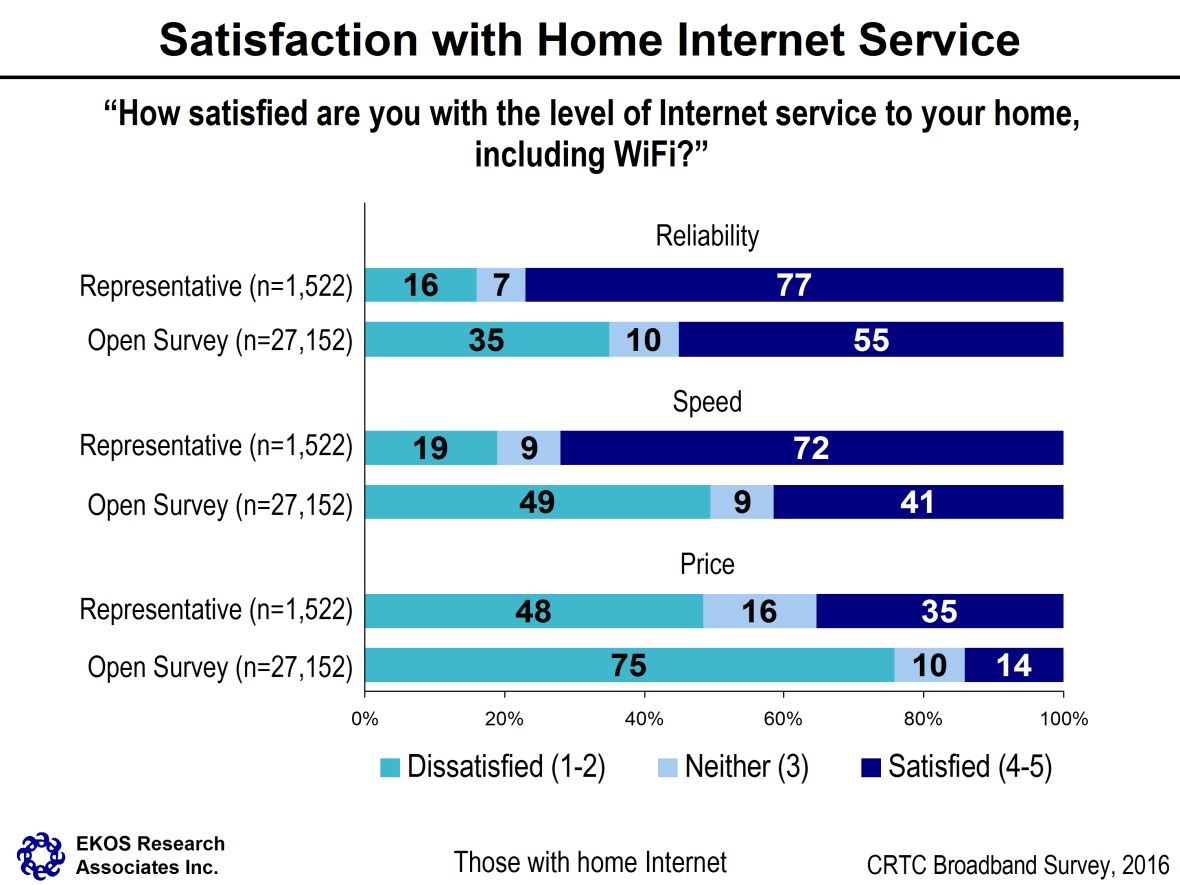
This figure is titled “Satisfaction with Home Internet Service.” It shows three horizontal stacked bar graphs. Each graph show the breakdown of the answers to the question, “How satisfied are you with the level of Internet service to your home, including WiFi?”
The first stacked bar graph deals with respondents’ satisfaction in relation to the “Reliability” of their home Internet for both the representative and open surveys. The 1,522 respondents in the representative survey who have home Internet answered as follows:
The 27,152 respondents in the open survey who have home internet answered as follows:
The second stacked bar graph deals with respondents’ satisfaction in relation to the “Speed” of their home Internet for both the representative and open surveys. The 1,522 respondents in the representative survey who have home internet answered as follows:
The 27,152 respondents in the open survey who have home internet answered as follows:
The third stacked bar graph deals with respondents’ satisfaction in relation to the “Price” of their home Internet for both the representative and open surveys. The 1,522 respondents in the representative survey who have home internet answered as follows:
The 27,152 respondents in the open survey who have home internet answered as follows:
Source: CRTC Broadband Survey, 2016