Figure 1: Interest in politics

This section of the report presents findings related to electors' pre-election views on politics and voting along with their past voting behaviour.
Among respondents to the pre-election survey, a substantial majority (80%) said they are at least somewhat interested in politics, with just over one-third (35%) saying they are very interested. Conversely, 15% said they are not very interested in politics, and 5% said they are not at all interested.
The following were less likely to be very interested in politics:
In addition, the likelihood of being very interested in politics decreased as the severity of a disability increased, from 37% of those with no disability to 28% of those with a severe or very severe disability.
Asked if they personally think voting is first and foremost a duty or choice, nearly three-quarters (73%) of respondents said they view voting as more of a duty, while one-quarter (25%) said they view it as more of a choice. Two percent did not know or chose not to provide a response.
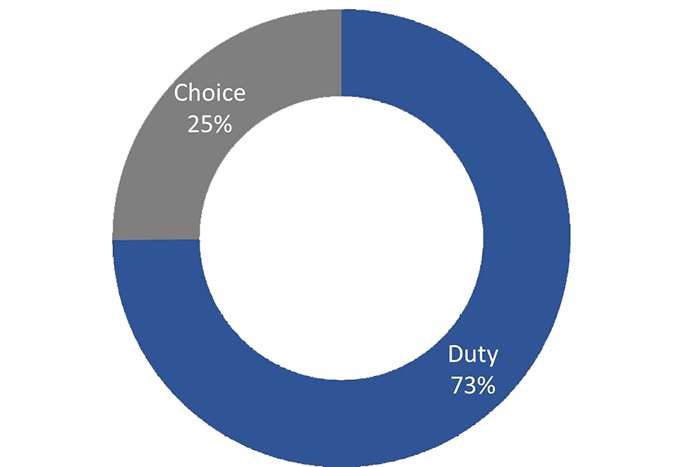
Text version of graph "Figure 2: Is voting a duty or choice?"
The following were less likely to view voting as a duty compared to a choice:
In addition, the likelihood of viewing voting as a duty more than a choice:
Just over half of electors (52%) reported voting in all elections since they have been eligible to vote. Close to one-third (30%) said they voted in most elections they have been eligible to vote in, and 12% said they voted in some elections. Few (6%) said they did not vote in any elections.
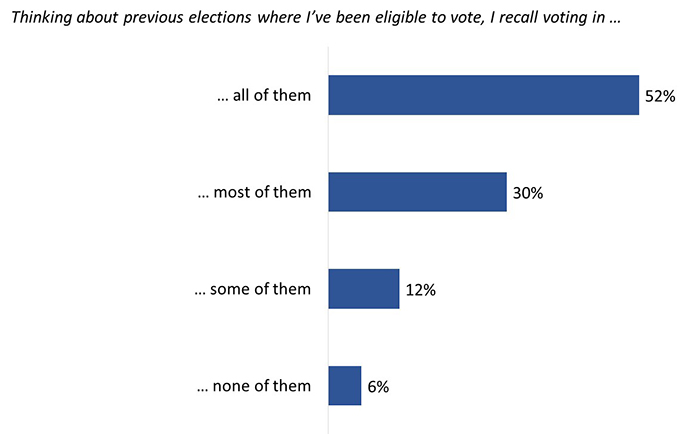
Text version of graph "Figure 3: Participation in previous elections"
Members of the following subgroups were less likely to say they had voted in all elections:
Just over eight in 10 (83%) respondents said they voted in the previous federal election held on October 19, 2015; nearly one in 10 (8%) were new electors in 2019, having been ineligible to vote in 2015.
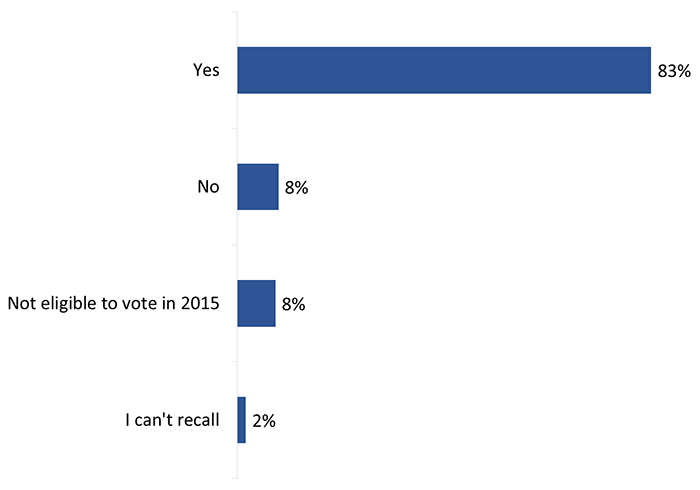
Text version of graph "Figure 4: Voting in the 2015 federal general election"
The following were less likely to say they voted in the 2015 federal general election:
This section of the report details electors' experience with voter registration prior to and during the 2019 federal election.
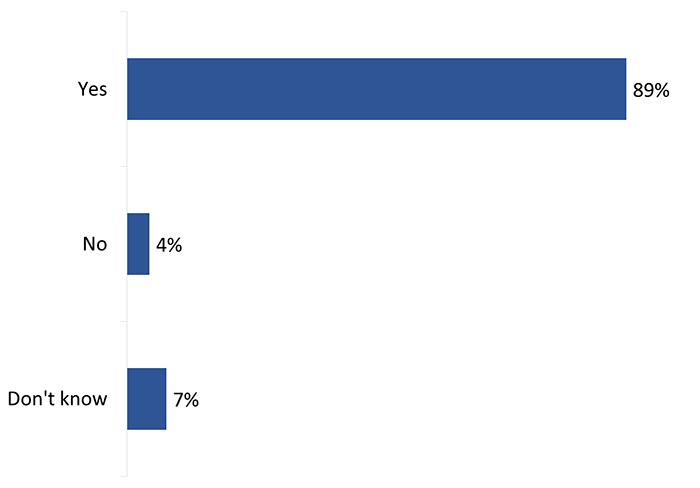
Nine in 10 (89%) electors in the pre-election survey said they were already registered to vote in a Canadian federal election. Four percent said they were not registered, and 7% said they did not know.
The following were less likely to say they were registered:
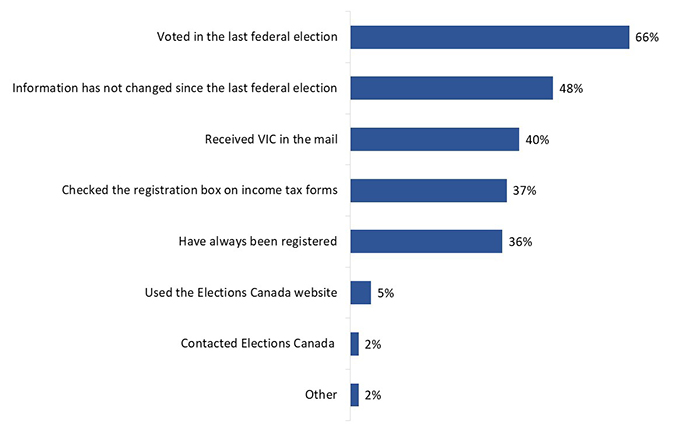
Most often, registered electors in the pre-election survey said they knew they were registered based on their experience in the 42nd GE: Two-thirds (66%) said they knew they were registered from voting in the last federal election; nearly half (48%) said their information had not changed since the last election; four in 10 (40%) said they knew because they had received a voter information card (VIC).
Just over a third (36%) said they knew they had always been registered, suggesting their knowledge of being registered pre-dated the 42nd GE. Another third (37%) said they had checked the registration box on their income tax forms, which is notable considering the pre-election survey took place in June, shortly after income tax season. Few mentioned having used the Elections Canada website (5%) or contacted Elections Canada (2%).
Text version of graph "Figure 6: Source of information on registration status"
Post-election, approximately nine in 10 (93%) of those aware of the federal election said they received a voter information card (VIC) in the mail addressed to them personally, which serves to notify electors of their registration. This represents a slight increase from the 2015 Survey of Electors, when 90% recalled receiving a VIC.
The following groups were less likely to recall receiving a VIC:
Virtually everyone who recalled receiving a VIC said their name (98%) and address (98%) on the card were correct. Electors with a severe/very severe disability were less likely than those with a mild/moderate disability or no disability to have reported that their name (96% compared to 98% of those with a mild/moderate or no disability) and address (97% compared to 98% of those with a mild/moderate or no disability) were correct. Canadians 18 to 24 years of age were less likely than Canadians aged 25 and older to have reported that their name (97% versus 98%) and address (96% versus 98%) were correct.
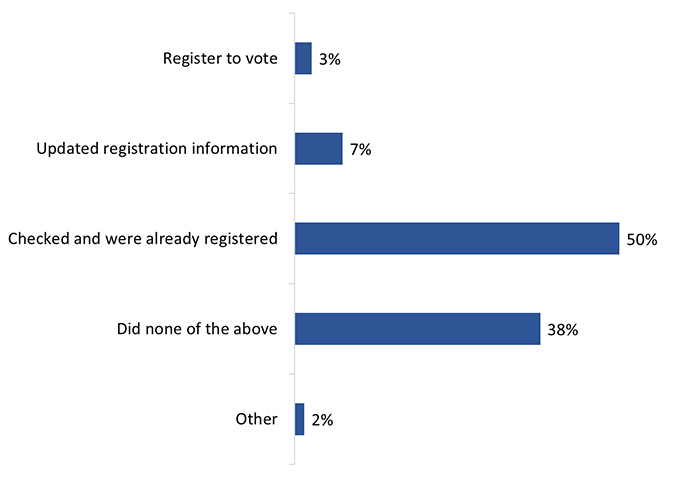
Regardless of whether or not they received a VIC, electors were asked what, if anything, they did during the election period to make sure they were registered to vote in the 43rd GE.
Half (50%) said they checked and made sure that they were already registered to vote with the correct information. Other actions were identified infrequently: 7% said they updated their registration information; 3% said they registered to vote. In all, 38% reported taking none of these actions.
Text version of graph "Figure 7: Registered or updated information during the election"
The following groups were more likely to have updated their registration information:
The following were more likely to have registered to vote:
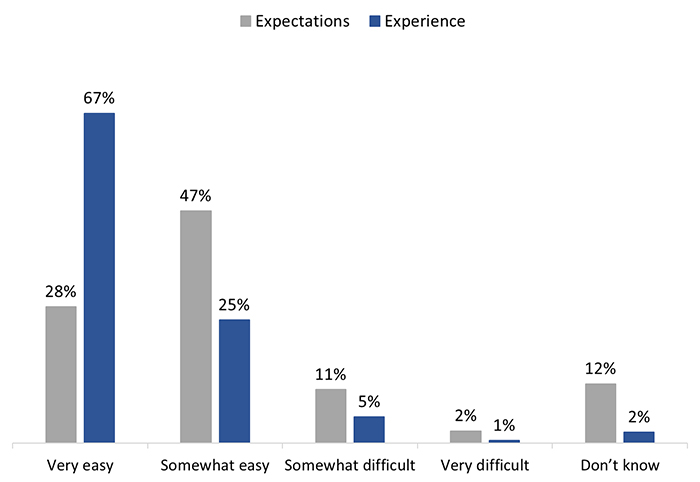
Among those who were not registered as of the pre-election survey, three-quarters (75%) expected that it would be easy for them to register, although only about a quarter (28%) expected it would be very easy.
In actual experience, electors found it easier than expected to register: In the post-election survey, 92% of those who registered to vote during the election said they found the experience to be easy, with two-thirds (67%) saying it was very easy.
Q. If you wanted to vote, how easy or difficult do you think it would be to register to vote? Base: n=5,434; respondents who were not registered to vote. [Wave 1]
Q. How easy or difficult was it to make sure you are registered? Base: n=459; respondents who registered. [Wave 2 + Wave 3]
Text version of graph "Figure 8: Ease of registering to vote – expectations versus experience"
The vast majority (96%) of electors who made sure they were registered to vote said it was easy to do so, with three-quarters (77%) saying it was very easy.
How easy electors found this to be varied depending on the action electors had to take: electors who had to register (67%) or update their registration information (64%) were less likely to say it was very easy to make sure they were registered to vote in the GE compared to those who only had to check that they were already registered with the correct information (79%).
| Ease of making sure elector was registered by action taken | Registered | Updated registration | Checked registration | Overall |
|---|---|---|---|---|
| Very easy | 67% | 64% | 79% | 77% |
| Somewhat easy | 25% | 29% | 18% | 19% |
| Somewhat difficult | 5% | 5% | 1% | 2% |
| Very difficult | 1% | 1% | <0.5% | <0.5% |
Q. How easy or difficult was it to make sure you are registered? Base: n=12,232; respondents who made sure they were registered. [DK/NR: 2%] [Wave 2 + Wave 3]
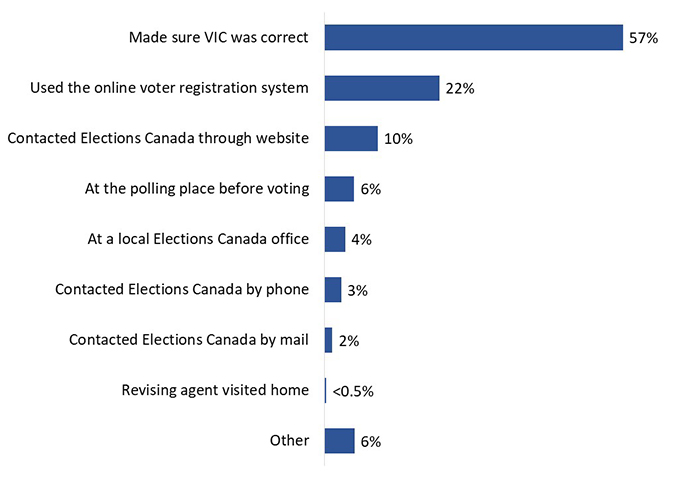
A majority (57%) of respondents who made sure they were registered to vote in the 43rd GE said they did this by checking that the information on their VIC was correct. Just over one in five (22%) used the online voter registration system, while one in 10 (10%) said they contacted Elections Canada through the agency's website.
Other actions were taken by smaller proportions of electors and included checking at the polling station before voting (6%), checking at the local Elections Canada office (4%), and contacting Elections Canada by phone (3%) or mail (2%).
Text version of graph "Figure 10: Method used to check or update voter registration"
The following subgroup variations were notable:
This section reports on electors' interaction with Elections Canada and its website during the election period, including their level of satisfaction with the service received during these interactions.
Just over one in 10 (12%) electors said they contacted Elections Canada during the election period, an increase from the 7% who said this in the 2015 Survey of Electors following the 42nd GE.
The likelihood of contacting Elections Canada was higher among Indigenous electors (18% versus 12% of non-Indigenous electors), new Canadians (20% versus 12% of other Canadians), and youth attending school (16% compared to 10% of youth working full-time and 8% of NEET youth). The likelihood of contacting Elections Canada also increased with the severity of a disability, from 11% of those with no disability to 18% of those with a severe or very severe disability.
Electors who contacted Elections Canada were most likely to do so through a form on the agency's website (39%) or by phone (36%). Approximately one in five (21%) visited a local Elections Canada office, while just over one in 10 (11%) used email. Smaller numbers used social media (5%) and mail (4%).
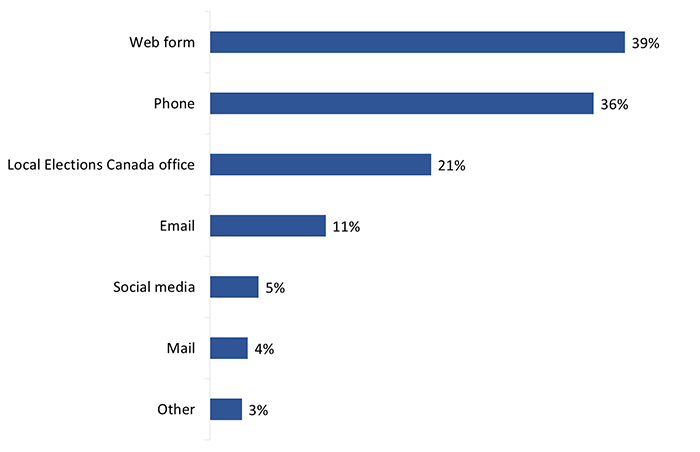
Text version of graph "Figure 11: Method of contact with EC during the election period"
The vast majority (89%) of those who contacted Elections Canada during the election period said they were at least somewhat satisfied with the service they received, and two-thirds (66%) said they were very satisfied. One in 10 expressed some degree of dissatisfaction (5% said they were somewhat dissatisfied and 5% said they were very dissatisfied).
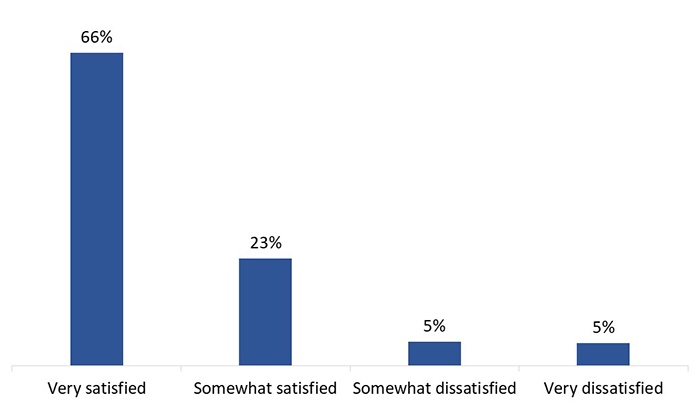
Text version of graph "Figure 12: Satisfaction with service received from contacting EC"
Those less likely to be very satisfied with the service they received from Elections Canada included Indigenous electors (59% versus 67% of non-Indigenous electors) and electors 18 to 24 years of age (54% versus 68% of electors aged 25 and older). In addition, the likelihood of being very satisfied decreased as the severity of a disability increased, from 69% of those with no disability to 57% of those with a severe or very severe disability.
Just over one-third (35%) of electors said they visited Elections Canada's website during the election period, up from 23% in the 2015 Survey of Electors. The likelihood of visiting the website was higher among Indigenous electors (40% versus 35% of non-Indigenous electors), new Canadians (56% versus 35% of other Canadians), 18- to 24-year-olds (64% versus 32% of those 25 and older), and youth attending school (67% versus 50% of youth working full-time and 46% of youth not attending school, not working, and not taking training).
Most of those who visited Elections Canada's website said they were somewhat (40%) or very (52%) satisfied with their experience using it. There were no noteworthy differences in satisfaction levels by subgroup.
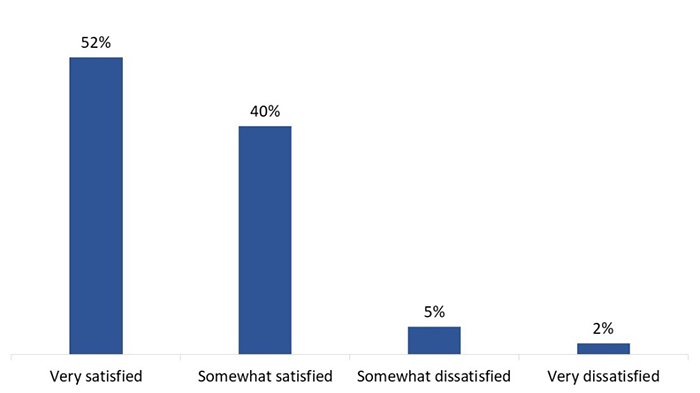
Text version of graph "Figure 13: Satisfaction with EC's website"
This section reports on issues related to voter participation.
In the post-election survey, nine in 10 (90%) electors aware of the 43rd GE said they voted in the election. As is often the case, self-reported voter turnout was overstated compared to Elections Canada's official turnout figure, which was 67% of registered electors.4 This was also the case in 2015 following the 42nd general election, when self-reported turnout was 90%, while the actual turnout rate among all eligible voters was 68% as reported by Elections Canada in the official voting results.5
Q. Are you certain to vote, likely to vote, unlikely to vote, or certain not to vote in the 2019 federal election? [DK/NR: <2%] [Wave 1, Wave 2]
Q. Many people don't or can't vote for a variety of reasons. Which of the following statements describes you? [DK/NR: <2%] [Wave 2 + Wave 3]
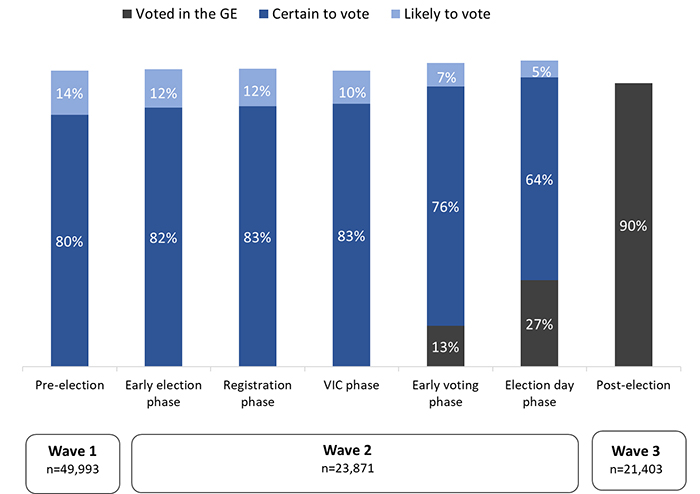
Text version of graph "Figure 14: Voting intention and participation for the GE"
Electors less likely to report having voted include:
In addition, the likelihood of reporting having voted decreased as the severity of a disability increased, from 92% of those with no disability to 80% of those with a severe or very severe disability.
Across the pre-election and election period surveys, electors were asked how likely it was that they would vote in the GE. Throughout the study, at least eight in 10 (80%) electors said they were certain to vote or that they had already voted using an early voting method. By the final week of the election period leading up to election day,6 92% of electors indicated they were either certain to vote (64%) or had voted early (27%); another 5% said they were likely to vote. This indicates a gap between stated vote intention and actual participation despite high self-reported turnout among respondents.
In the pre-election survey, electors from Alberta and Quebec were more likely to say they would be likely or certain to vote in the 2019 federal election (95% each).
The following groups were less likely to say in the pre-election survey that they would be likely or certain to vote:
In addition, the likelihood of respondents saying they would be likely or certain to vote in the 2019 federal election:
Electors aware of the election who said they did not vote (n=1,751) most often pointed to political reasons to explain why (43%), followed at a distance by everyday life or health reasons (29%) and reasons related to the electoral process (12%). Included in the “other” category are forgetting to vote, not voting due to religious or other beliefs, work conflicts and last-minute commitments, and poor weather, among other reasons.
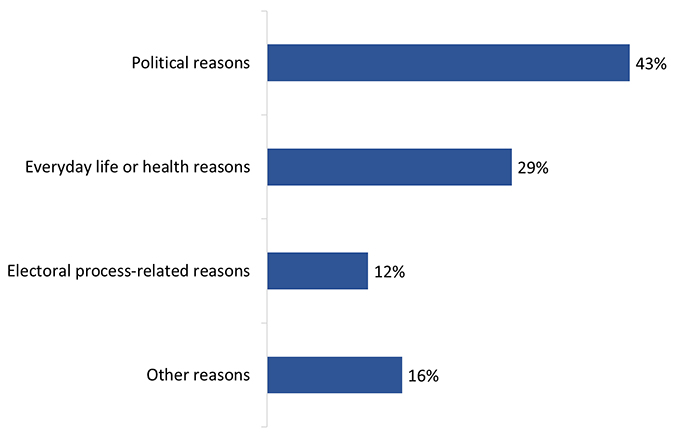
Text version of graph "Figure 15: Reason for not voting – themes"
For the 43rd GE, the following subgroup differences were noteworthy:
The table below provides a detailed breakdown of the reasons why respondents did not vote during the 43rd GE in 2019, alongside reasons given for the 42nd GE in the 2015 Survey of Electors.7 Those who gave political reasons for not voting increased to 43% in 2019 up from 37% in 2015, with observable differences in the proportions who said they did not like the candidates, parties, or campaign (14%) and those who did not know who to vote for (7%). In 2015, these two reasons combined accounted for 10% of non-voters. In contrast, those who gave everyday life or health reasons decreased to 29% down from 45%, with the most visible decrease being those who said they were too busy (down to 11% from 25%).
| Reasons for not voting (%) | 2019 (n=1,751) |
2015 (n=283) |
|---|---|---|
| Political reasons | 43 | 37 |
| Did not like candidates/parties/campaign | 14 | 108 |
| Felt voting would not make a difference | 10 | 9 |
| Not interested in politics | 9 | 9 |
| Did not know who to vote for | 7 | –8 |
| Lack of information about campaign issues and parties' positions | 4 | 7 |
| Reasons for not voting (%) | 2019 (n=1,751) |
2015 (n=283) |
|---|---|---|
| Everyday life or health reasons | 29 | 45 |
| Too busy (details provided below) | 11 | 25 |
| Out of town (details provided below) | 10 | 15 |
| Illness or disability | 8 | 5 |
| Reasons for not voting (%) | 2019 (n=1,751) |
2015 (n=283) |
|---|---|---|
| Electoral process–related reasons | 12 | 11 |
| Transportation problem/polling station too far | 3 | 2 |
| Not on voters list | 2 | 3 |
| Polling station was not accessible | 2 | <1 |
| Issues with VIC | 1 | 1 |
| Could not prove identity or address | 1 | 2 |
| Lack of information about voting process (e.g. when/where to vote) | 1 | 1 |
| Lineups were too long | 1 | 2 |
| Voting process was not accessible | 1 | – |
| Reasons for not voting (%) | 2019 (n=1,751) |
2015 (n=283) |
|---|---|---|
| Other reasons | 16 | 5 |
| Religious or other beliefs | 2 | –9 |
| Forgot to vote | 2 | 110 |
| Other reasons | 10 | – |
| Don't know | 2 | 1 |
Reasons given by respondents who said they were too busy to vote (n=177) included having other priorities that day (40%), unexpected plans that deterred them from voting (36%), and not having time in their daily schedule to vote (20%).
Among those who did not vote because they were out of town (n=187), more than half (58%) said their travel was for personal reasons, while approximately one-third (34%) said they were away due to work commitments. Of those who were out of town for personal reasons (n=112), two-thirds (67%) said they had previously planned their trip.
The majority (57%) of electors who said they voted in the federal election held on October 21, 2019, reported doing so at a polling station on election day, while more than one-third (37%) reported going to an advance polling station to vote. This represents a considerable decrease in election-day voting and increase in advance voting compared to the 2015 Survey of Electors, where 73% reported voting on election day compared to 25% who voted at an advance poll.
It must be said that self-reported voting at advance polls in 2019 is over-reported considering the official voting results for the 43rd GE, where 26% of valid votes were cast at an advance polling station. Still, the increase in self-reported advance voting is consistent with the trend, if not the degree, of increasing advance voting that has been observed across previous surveys and official results through multiple past elections.
As the accompanying graph shows, few electors used other methods to vote, although the percent of those who reported voting at a local EC office increased to 4% up from 1% in the 2015 Survey of Electors.
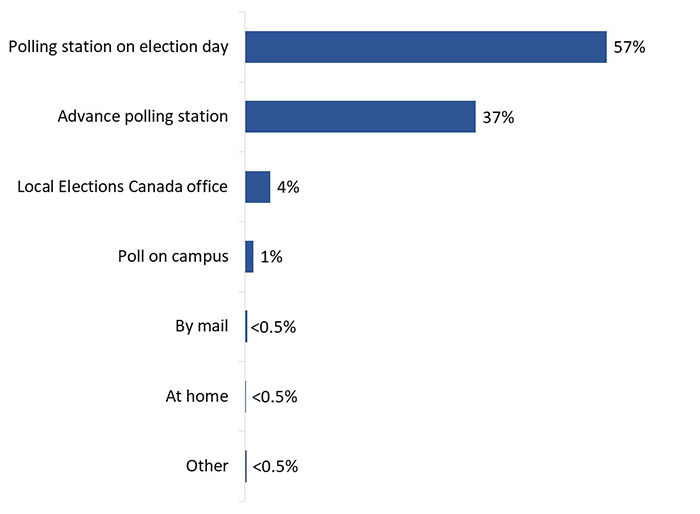
Text version of graph "Figure 17: Method used to vote in the GE"
The following groups of voters were more likely to say they voted at a polling station on election day:
Voting at an advance polling station was more likely to be identified by the following:
This section reports on issues related to the experience of voters in getting to and accessing the polling place.
Of those who voted in person (n=19,270), just over three-quarters (77%) said they went to the voting place from home. Most (16%) of the rest said they went to vote from work, while 3% said they went from school, and 4% from some other location.
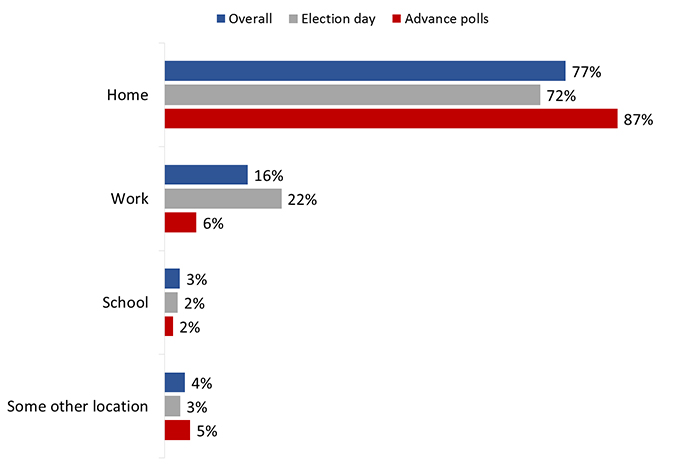
Text version of graph "Figure 18: Went to vote from home, work, or another location"
Electors who voted at an advance poll were more likely to have gone to the polling station from home (87% versus 72% of those who voted on election day and 74% who voted at a local EC office), and less likely to have gone to vote from work (6% versus 22% of those who voted on election day and 15% who voted at a local EC office).
Half (50%) of in-person voters went to vote on their own. The other half went to vote with someone else, nearly all of whom (47%) went with at least one other person who also voted.
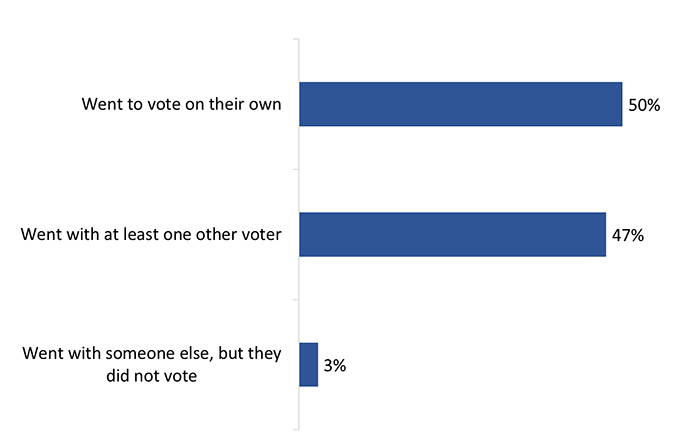
Text version of graph "Figure 19: Voting with others"
The following were more likely to have gone to vote on their own:
The following were more likely to have gone to vote with another voter:
Polls on election day were open for 12 hours across the country. The opening hours varied based on time zones.11
Electors who went to vote on election day (n=11,127) did so throughout the day, with the plurality (42%) going in the evening period between 4:00 p.m. and the closing of the polls. Three in 10 (30%) said they went to vote at some point in the morning, i.e. between the opening of the polls and noon. A quarter (26%) went between noon and 4:00 p.m.
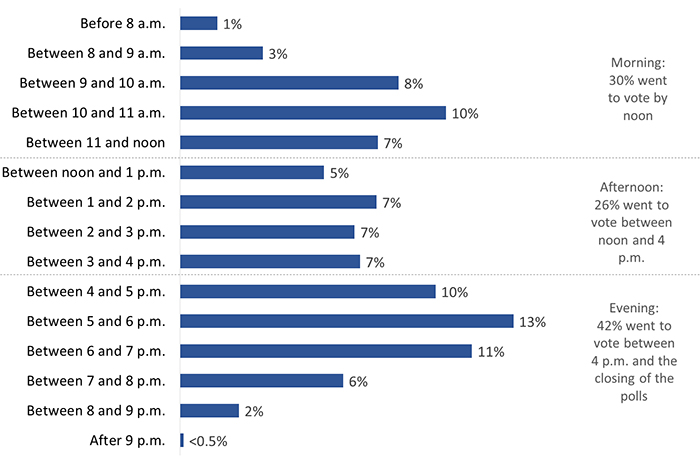
Text version of graph "Figure 20: Time of the day electors voted – election day"
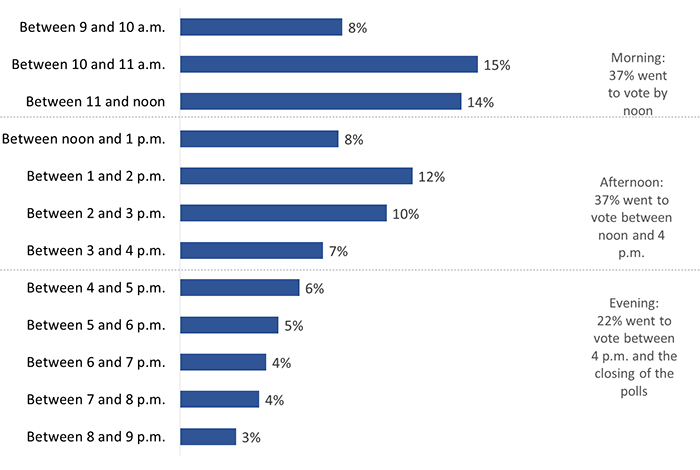
For the 43rd GE, advance voting hours across the country were expanded to 9:00 a.m. to 9:00 p.m. (local time), compared to the hours of noon to 8:00 p.m. that were offered in previous elections.
Among those who voted at an advance poll (n=7,165), over one-third (37%) took advantage of the extended voting hours and reported that they went to vote in the morning before noon. The same proportion (37%) went to vote between noon and 4:00 p.m. In contrast to election day voters, just over one in five (22%) went to vote between 4:00 p.m. and the closing of the polls.
Text version of graph "Figure 21: Time of the day electors voted – advance poll"
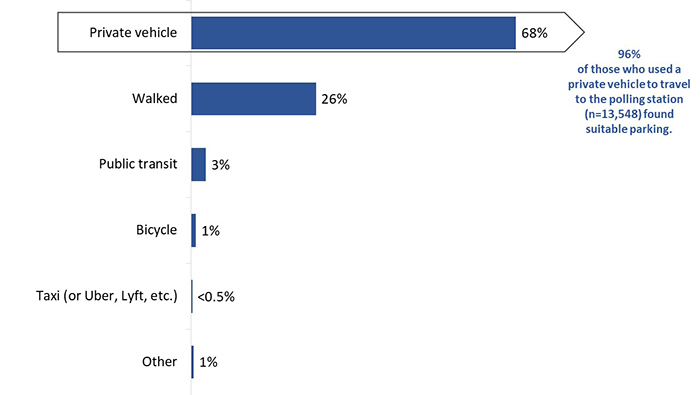
Just over two-thirds (68%) of those who voted in person said they used a private vehicle to get to the polling place. One-quarter (26%) said they walked to the voting place.
The vast majority (96%) of those who used a private vehicle to travel to the polling place reported finding suitable parking, although voters with a severe/very severe disability were more likely to say they did not find suitable parking (5%) compared to voters with no disability (3%).
Text version of graph "Figure 22: Means of transportation used when going to vote"
The following were more likely to say they walked to the polling place:
The likelihood of walking to the polling place also decreased as the severity of a disability increased (from 27% of those with no disability to 23% of those with a severe/very severe disability).
Use of public transportation was more likely among 18- to 24-year-olds (10% versus 2% of those 25 and older), and among youth attending school (12% versus 5% of youth working full-time and not attending school and 2% of youth not attending school, not working, and not taking training).
Use of a private vehicle was more likely among the following:
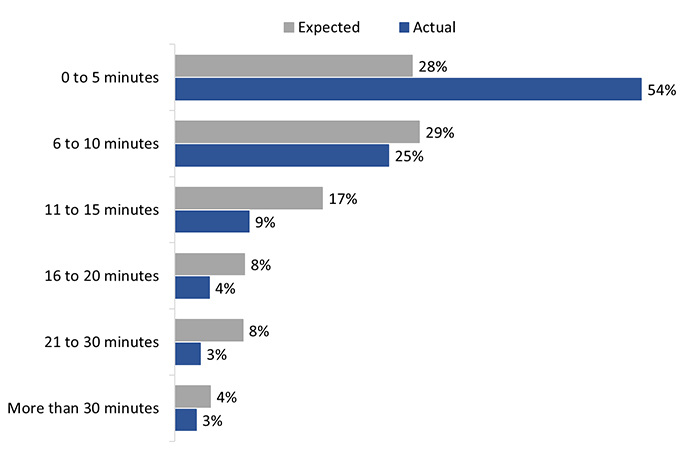
In the post-election survey, over half (54%) of in-person voters said it took them only five minutes or less to get to the polling station, better than electors expected: Only 28% of electors expected it would take this long when asked in the pre-election survey. One-quarter (25%) of voters said their actual travel time was six to 10 minutes, and almost one in five (19%) said it took them more than 10 minutes.
For both election day and advance polls, the average amount of time voters spent travelling to the polling place was nine minutes, and the median time was five minutes. Those who voted at a local EC office reported taking longer to get there, with an average travel time of 14 minutes and a median time of 10 minutes.
Q. How much time do you think it would take you to go to the polling station? Base: n=49,993; W1 respondents. [DK/NR: 6%]
Q. To the best of your knowledge, how long did it take you to travel to the [polling station/advance polling station/local Elections Canada office/poll on campus]? Base: n=19,271: voters. [DK/NR: 2%] [Wave 3]
Text version of graph "Figure 23: Time it took to get to the polling place: expected versus actual"
The following were less likely to report that actual travel to their voting location took 5 minutes or less:
Nearly everyone (98%) said the voting place was located a reasonable distance from their home, with 88% saying the distance was very reasonable. This is similar to 2015 results, when 97% said the polling place was a convenient distance from their home.
Nearly all (93%) of those who voted in-person said the polling place was in a location that was at least somewhat familiar to them, with three-quarters (73%) saying the location was very familiar to them.
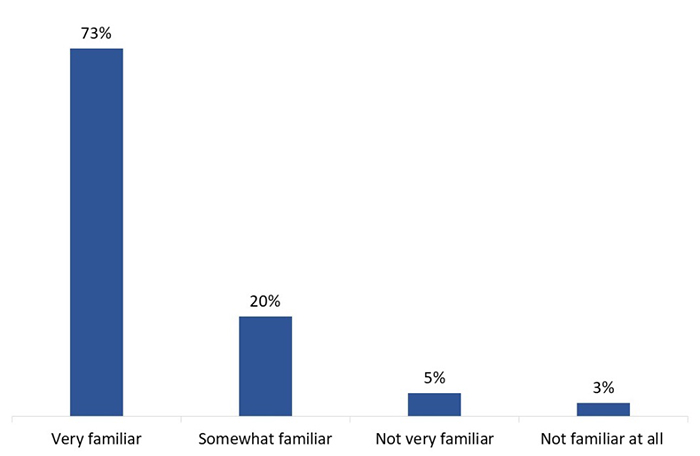
Text version of graph "Figure 24: Familiarity of the polling place location"
The following were less likely to say the polling place was in a very familiar location:
In-person voters who have at least some difficulty seeing, using stairs and/or experience recurring pain (n=7,583) were asked if they needed level access to enter the polling place. One in 10 (12%) overall said they did require level access.
Need for level access was higher among those who reported having a lot of difficulty or higher in a single disability category12 as follows:
Among all respondents, need for level access:
In the beginning phases of the election period, two-thirds (67%) of electors with a disability said they expected it would be very easy for them to enter and access the polling place. The perception that accessing the polling place would be easy increased measurably over the election period: By the final phase marking the week leading up to election day, three-quarters (77%) of electors with a disability expected it would be very easy.
In the post-election survey, the actual experience of voters with a disability exceeded their expectations: 85% of those who voted in person found it very easy to access the polling place. An additional 12% said it was somewhat easy.
Q. If you do vote, how easy or difficult do you think it will be to access the polling station? Base: electors who have difficulty seeing or using stairs or experience chronic pain. [DK/NR: 2%] [Wave 2]
Q. How easy or difficult was it for you to enter and access the [polling station/advance polling station/local Elections Canada office/poll on campus]? Base: voters with a disability who voted in person. [DK/NR: <0.5%] [Wave 3]
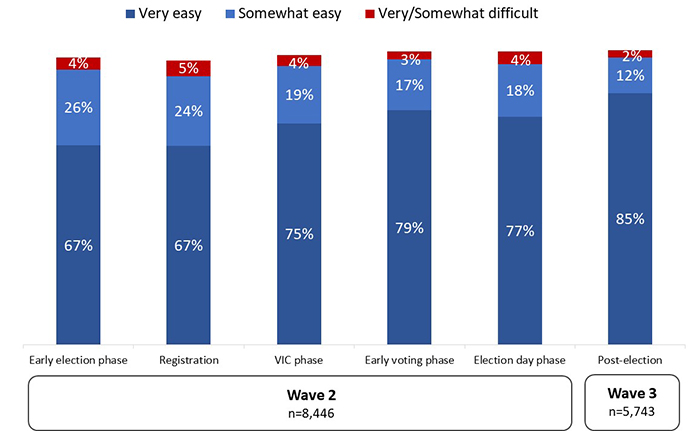
Text version of graph "Figure 25: Ease of entering and accessing the polling place"
Voters with a severe/very severe disability (79%) were less likely than those with a mild/moderate disability (87%) to say they found it very easy to enter and access the polling place. In addition, those who indicated they needed level access were less likely to say it was very easy to enter the polling place (71%) compared to those who said they did not need level access (88%).
Virtually all voters (98%) said the building where they voted was at least somewhat suitable for holding an election,14 with a substantial majority (83%) describing it as very suitable. This represents no change from 2015, when 97% said the building was suitable and 82% said it was very suitable. Among the few who said the building was not suitable for holding an election,15 lack of parking and accessibility issues were mentioned with the greatest frequency.
Those who voted at an advance poll (84%) or an ordinary poll on election day (83%) were more likely to say the building was very suitable compared to those who voted at a local EC office (72%) or at a poll held on campus (74%).
New Canadians (77%) were less likely than other Canadians (83%) to say the building was very suitable for an election. In addition, the likelihood of describing it as very suitable decreased as the severity of a disability increased (from 84% of those with no disability to 77% of those with a severe/very severe disability).
This section reports on voters' experience at the polling place.
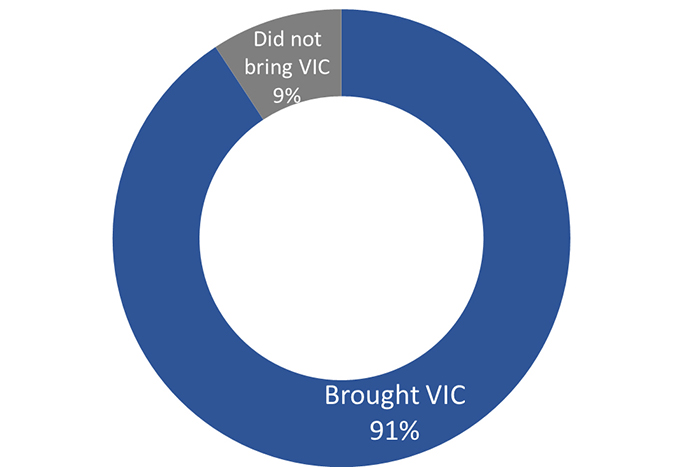
Nine in 10 (91%) electors who received a VIC and voted in person said they brought their VIC with them to the polling place, which could allow them to bypass the registration desk and proceed directly to the polling station in a streamlined voting process for the 43rd GE. A similar proportion (89%) of voters brought their VIC to the polls in 2015.
Nine percent did not bring their VIC to the polling place. Voters 18 to 24 years of age (21%) were more likely to say they did not bring their VIC than those aged 25 and older (8%).
Voters said it took less time to cast their ballot than they had expected: During the pre-election survey, only about a third (35%) of electors said they expected it would take only five minutes or less to vote. Another one-third (32%) expected voting would take more than 10 minutes.
In the post-election survey, nearly two-thirds (63%) of voters said it took them no more than five minutes to vote once they arrived at the polling place. Another one in five (21%) said it took six to 10 minutes to vote. Only 14% said it took longer than 10 minutes.
Q. How much time do you think it would take you to vote once you arrive at the polling station? Base: n= 49,993. [DK/NR: 6%] [Wave 1]
Q. To the best of your knowledge, how long did it take you to vote once you arrived at the [polling station/advance polling station/local Elections Canada office/poll on campus]? Base: n=19,271; respondents who voted in-person. [DK/NR: 2%] [Wave 2+ Wave 3]
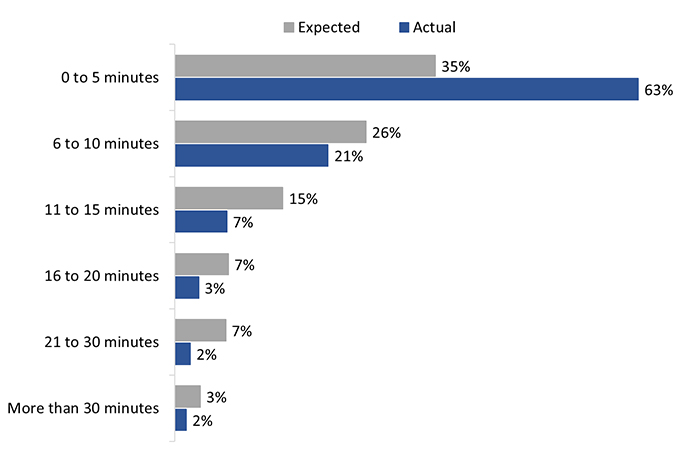
Text version of graph "Figure 27: Time it took to vote – expected versus actual"
Voters in the 2019 election reported taking an overall average of eight minutes to cast their ballot, a four-minute improvement from the 12-minute average reported for the 2015 election. In the 2019 pre-election survey, respondents estimated that it would take an average of 13 minutes to vote once they arrived at the polling station, suggesting their expectations may have been based on the experiences of the 2015 election.
Differences in the time it took to vote across voting methods narrowed considerably in 2019 compared to those reported in 2015:
Across all in-person voting methods, electors with a VIC reported spending less time than those who did not: Those who brought their VIC to the polling place took seven minutes to vote on average, compared to eight minutes for those who received a VIC but did not bring it. Those who did not receive a VIC reported an above-average voting time of 11 minutes.
Ultimately, 95% of voters said the time it took for them to vote was reasonable, up slightly from 2015 when 92% said the wait time before voting was reasonable. Voting at advance polls improved the most in this regard: 93% of advance voters in 2019 said the time it took to vote was reasonable, up from 80% of advance voters in 2015.
This section reports on issues related to voter identification.
Nearly all voters (94%) reported using one piece of government-issued photo ID to prove their identity and address when they voted: 89% used their driver's licence, while 5% used a general provincial or territorial photo identification card.16 Another 4% of voters used two authorized pieces of ID that together could establish identity and address for the purposes of voting. Less than 1% had to declare their identity and address in writing and have another elector from their polling station vouch for them in order to vote.17 Overall, the distribution of voters who used each option for meeting the identification requirements was similar to 2015 (93% used one piece, 3% used two pieces, and less than 1% had someone attest to their address).
Those more likely to have used two pieces of ID include:
In addition, the likelihood of using two pieces of ID increased as the severity of a disability increased (from 4% of those with no disability to 9% of those with a severe/very severe disability).
Among voters who presented two pieces of ID to meet the identification requirements for voting (n=756), the most mentioned pieces were:
The health card therefore, was the most common piece of ID used that could satisfy the proof of identity requirement.18 The VIC was the most common piece used to satisfy proof of address, which is notable considering this was the first general election in which the VIC was authorized as an acceptable proof of address for the purposes of voting.19
Among all voters, use of the VIC as proof of address was higher among:
In addition, use of the VIC increased as the severity of a disability increased (from 2% of voters with no disability to 4% of those with a severe/very severe disability).
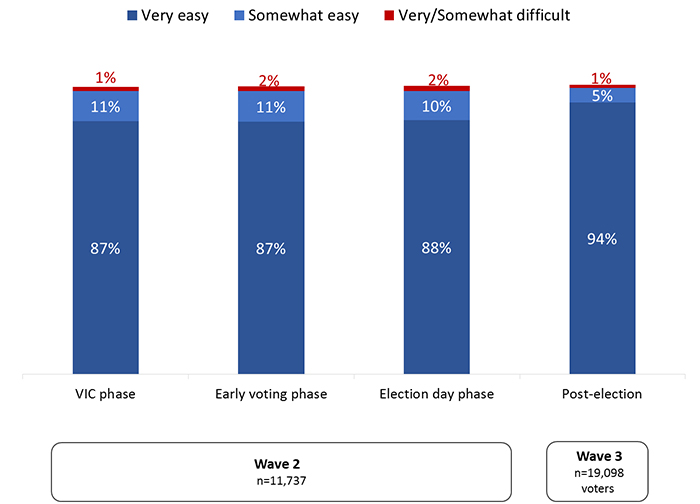
During the election period survey, nearly nine in 10 (87%) expected it would be very easy for them to prove their identity and address if they were to vote; 10% expected it would be somewhat easy.
In the post-election survey, an even greater proportion (94%) of voters reported that they found it actually very easy to prove their identity and address when they voted, and another 5% said it was somewhat easy. These proportions are similar to 2015, when 92% said meeting the voter identification requirements was very easy and another 7% said it was somewhat easy.
Q. If you wanted to vote, how easy or difficult do you think it would be to prove your identity and address? [DK/NR: <1%] [Wave 2]
Q. Overall, how easy was it to meet the identification requirements? [DK/NR: <0.5%] [Wave 2 + Wave 3]
Text version of graph "Figure 28: Ease of meeting ID requirements: expectations versus experience"
The likelihood of voters finding it very easy to meet the ID requirements decreased as the severity of one's disability increased, from 95% of those with no disability to 89% of those with a severe/very severe disability.
The likelihood of finding it very easy was lower among Indigenous voters (91% versus 94% of non-Indigenous voters), new Canadians (89% versus 94% of other Canadians), and 18- to 24-year-olds (90% versus 94% of electors aged 25 and older).
Voters who used one piece of ID (94%) were more likely than those who used two pieces of ID (83%) to have said it was very easy to meet the ID requirements.
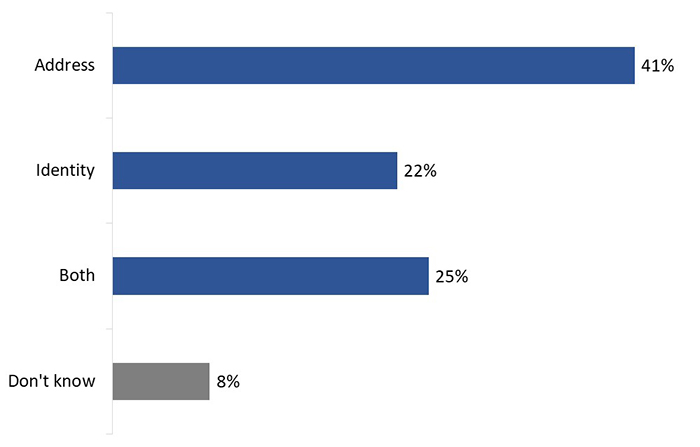
Respondents who said they had difficulty meeting the identification requirements (n=93) were more likely to say they had trouble proving their address (41%) than their identity (22%), though one-quarter (25%) said they had difficulty proving both.
Text version of graph "Figure 29: Nature of difficulty encountered proving identity or address"
This section reports on awareness and use of Elections Canada's accessible voting services among electors with a disability.
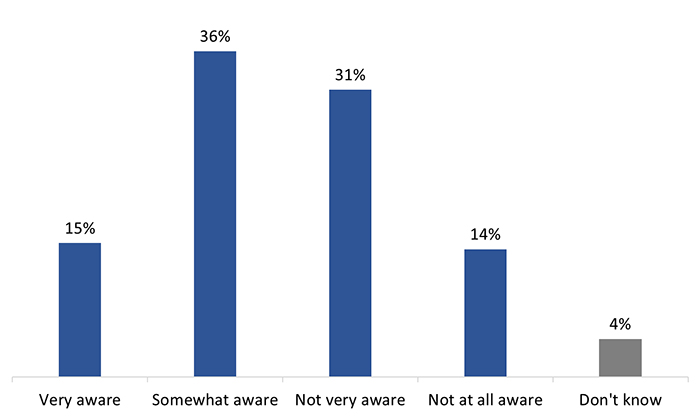
Half (50%) of electors with a disability said they are at least somewhat aware of the voting tools and services Elections Canada offers to make voting more accessible. This represents an increase in awareness from 2015, when 43% said they were aware of the available tools and services. Those with a severe/very severe disability (55%) were more likely to be aware of the tools and services available than those with a mild/moderate disability (49%).
Text version of graph "Figure 30: Awareness of accessible tools and services"
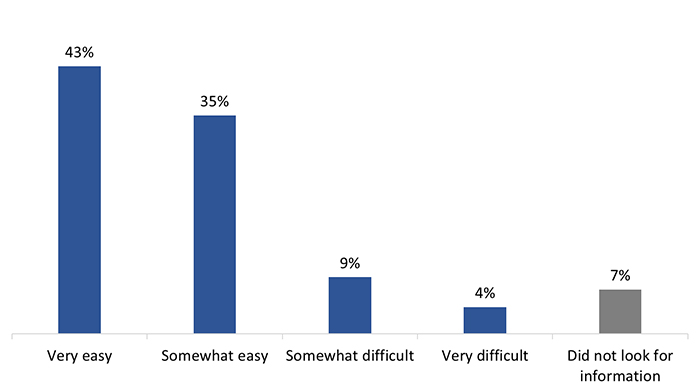
Relatively few electors with a disability said they needed information on the accessibility of the voting place (15%) or accessible voting tools and services (12%) for this election.20 Those with a severe/very severe disability were more likely than those with a mild/moderate disability to need information on the accessibility of the polling place (23% versus 13%) and on accessible voting tools and services (20% versus 10%).
More than three-quarters (78%) of those who needed information on accessibility said it was very (43%) or somewhat (35%) easy to find this information. Seven percent of those who said they needed information also said they did not look for information.
Text version of graph "Figure 31: Ease of finding information on accessibility"
Consistent with the finding that one in 10 (12%) electors with a disability said they needed information on accessible voting tools and services, use of these tools and services to assist with voting was relatively limited:21
Seven percent of electors with a disability who voted in person said someone assisted them in marking their ballot.22 Those with a severe/very severe disability were more likely to need assistance (10% compared to 7% of those with a mild/moderate disability).
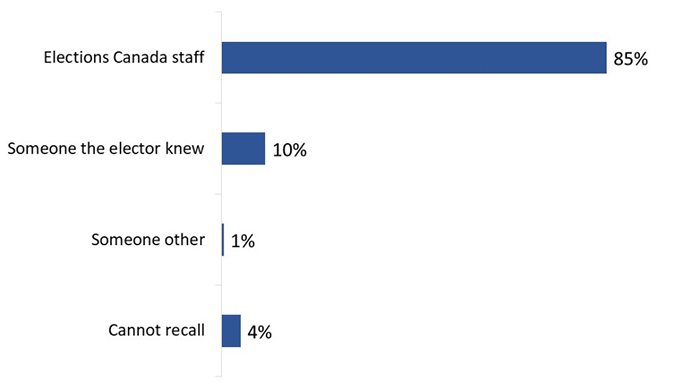
Among respondents who received assistance marking their ballot, more than eight in 10 (85%) indicated that Elections Canada staff assisted them, while one in 10 (10%) said they were assisted by someone they knew, such as a family member, friend, or personal support worker. A few (4%) could not recall who assisted them.
Text version of graph "Figure 32: Assistance marking ballot"
Voters with a severe/very severe disability (18%) were more likely than those with a mild/moderate disability (7%) to have received help from someone they knew.
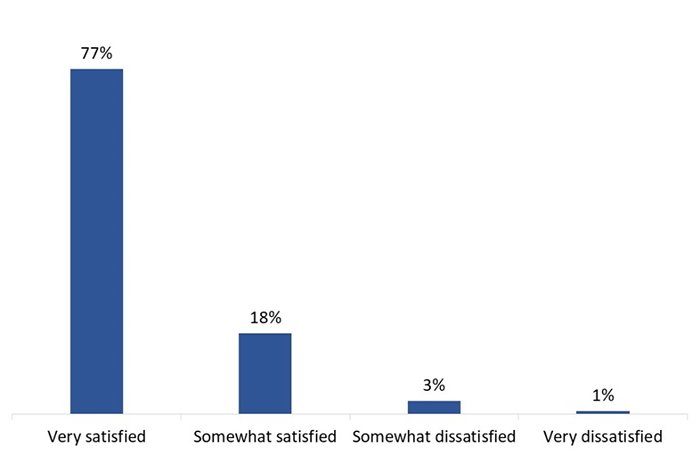
Among respondents with a disability who received assistance when voting, most (95%) said they were at least somewhat satisfied with the assistance, including just over three-quarters (77%) who were very satisfied with it.
Text version of graph "Figure 33: Satisfaction with assistance received when voting"
The likelihood of being very satisfied with the assistance received was higher among those aged 55 or over (88%) compared to 18- to 54-year-olds (73%).
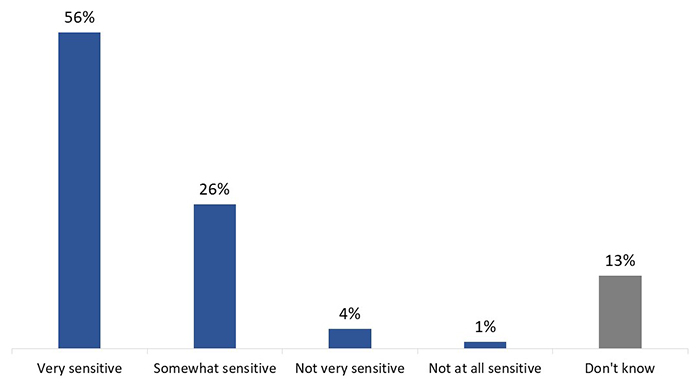
Approximately eight in 10 (82%) voters with a disability indicated that Elections Canada staff were at least somewhat sensitive to their needs when voting, with a majority (56%) indicating that staff were very sensitive to such needs. Those who did not indicate that Elections Canada staff were sensitive to their needs were more likely to offer no response to this question (13%) than to indicate that staff were insensitive to their needs (5%).
Text version of graph "Figure 34: Sensitivity of EC staff in regard to elector’s disability"
The likelihood of saying that Elections Canada staff were very sensitive to their voting needs increased with age, from 50% of voters with a disability aged 18–24 to 70% of those aged 75 and older, and was higher among women (58% versus 55% of men).
This section reports on satisfaction with the voting process.
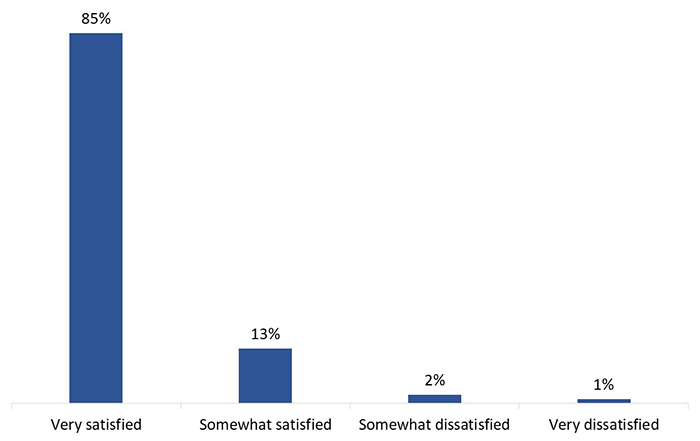
Of those who voted in person, nearly everyone (98%) said they were at least somewhat satisfied with the services provided by Elections Canada staff, and a substantial majority (85%) said they were very satisfied. These proportions are similar to 2015, when 97% were satisfied and 86% were very satisfied.
Text version of graph "Figure 35: Satisfaction with services provided by EC staff when voting"
The likelihood of being very satisfied decreased as the severity of a disability increased (from 86% of those with no disability to 79% of those with a severe/very severe disability).
Over three-quarters of respondents who voted in person (76%) said they were served in English, one in five (20%) said they were served in French, and 3% said they were served in both of Canada's official languages.23 As was the case in 2015, virtually all (99%) voters in the 2019 GE were satisfied with the official language in which they were served.24
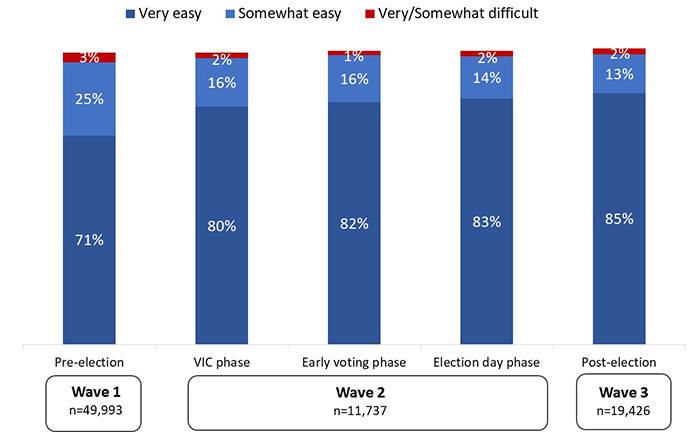
In the pre-election survey, seven in 10 (71%) electors said they expected it would be very easy for them to vote at the polling place if they wanted to vote. The perception that it would be easy to vote increased measurably over the election period: During the period when VICs were being delivered to electors, 80% of electors expected it would very easy to vote; by the final week of the election period leading up to election day, 83% of electors expected it would be very easy to vote.
In the post-election survey, the actual experience of voters matched their final expectations: 85% of voters found it very easy to vote, while another 13% found voting to be somewhat easy.
Q. If you wanted to vote, how easy or difficult do you think it would be to vote once you arrive at the polling station? [DK/NR: 1%] [Wave 1, Wave 2]
Q. Overall, how easy was it to vote? Would you say it was…? [DK/NR: <0.5%] [Wave 3]
Text version of graph "Figure 36: Ease of voting – expectations versus experience"
The following subgroups were less likely to have said it was very easy to vote:
In addition, the likelihood of finding it very easy to vote decreased as the severity of a disability increased (from 87% of those with no disability to 78% of those with a severe/very severe disability).
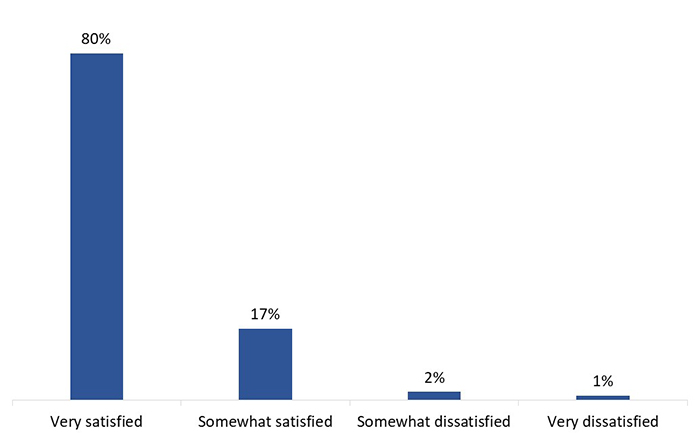
Most voters (97%) said they were at least somewhat satisfied with their voting experience, with a substantial majority (80%) expressing strong satisfaction with the experience. These proportions are similar to 2015, when 96% were satisfied and 81% very satisfied.
Text version of graph "Figure 37: Satisfaction with overall voting experience"
The following subgroups were less likely to have been very satisfied with their voting experience:
In addition, the likelihood of being very satisfied decreased as the severity of a disability increased (from 82% of those with no disability to 72% of those with a severe/very severe disability).
This section reports on issues related to satisfaction with the administration of the democratic process in Canada.
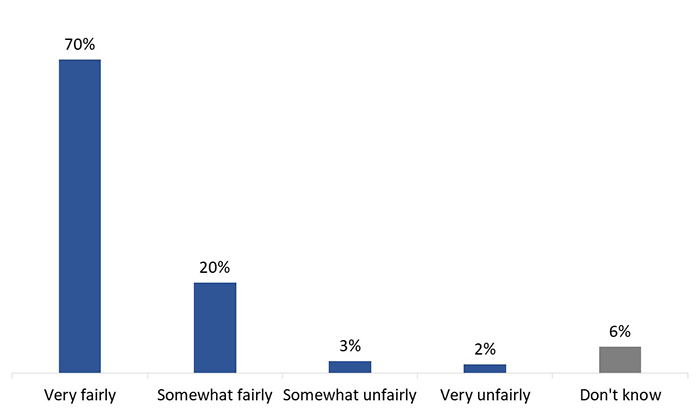
Nine in 10 respondents (90%) felt that Elections Canada ran the election at least somewhat fairly, with 70% indicating that they believe Elections Canada ran the election very fairly. These proportions are effectively the same as results from 2015, when 92% said EC ran the election fairly and 67% said very fairly. Other respondents in 2019 were almost equally divided between those who believe the election was run somewhat or very unfairly (5%), and those who do not know (6%).
Text version of graph "Figure 38: Perception that EC ran the election fairly"
The following were less likely to say that the election was run very fairly:
In addition, the likelihood of saying that the election was run very fairly:
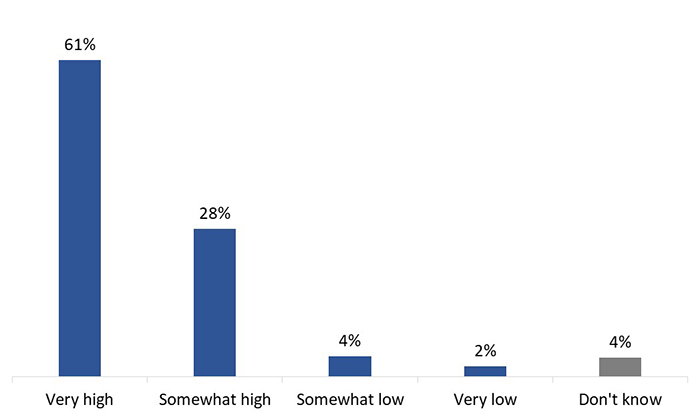
There was widespread trust in the accuracy of the election results in respondents' respective ridings—89% had at least some level of trust in the accuracy of the results, with 61% saying their trust was very high. This represents a slight decrease from the 2015 Survey of Electors, when 92% had at least some trust and 65% had a very high level of trust in the accuracy of the results.
Text version of graph "Figure 39: Trust in the accuracy of the election results in the riding"
A very high level of trust in the accuracy of results was more likely among the following:
In addition, the likelihood of expressing very high trust in the accuracy of results:
Low trust in the accuracy of results was notably more likely among non-voters (19% versus 5% of voters) and Indigenous electors (14% versus 6% of non-Indigenous electors), and increased with the severity of a disability (from 5% of those with no disability to 14% of those with a severe/very severe disability).
In the pre-election survey, respondents were asked about their base level of confidence in various institutions in Canada, including Elections Canada. As the graph below indicates, electors reported having a comparatively high level of confidence in Elections Canada. Specifically, more than eight in 10 (85%) electors said they had a great deal or fair amount of confidence in EC, followed by the police (80%), civil service (66%), federal government (56%), and big business or corporations (41%).
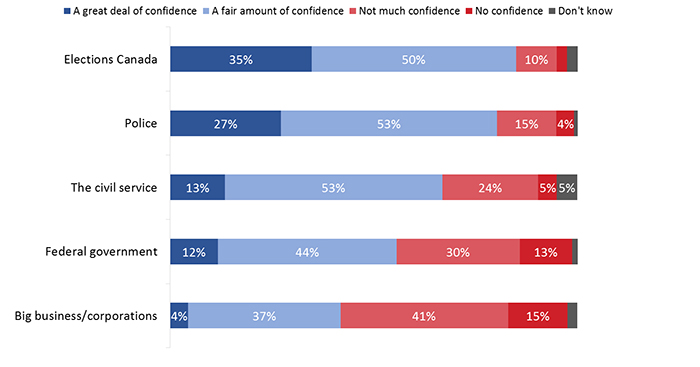
Text version of graph "Figure 40: Confidence in Canadian institutions"
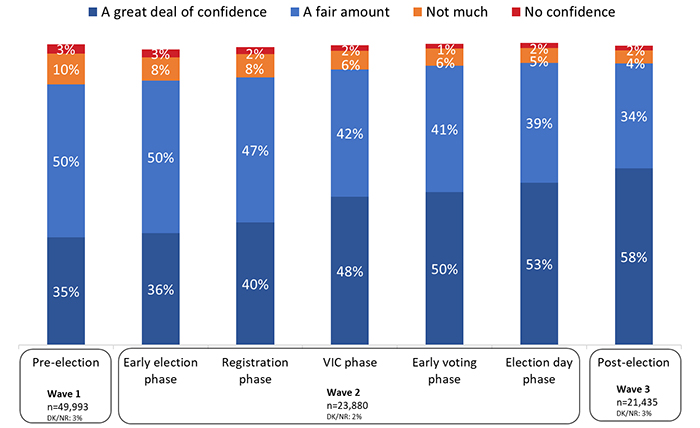
Over the course of the election, the proportion of electors who had confidence in Elections Canada increased measurably from the pre-election baseline of 85% up to 92% in the post-election survey. Most notably, the proportion who said they have a great deal of confidence increased from a third (35%) of electors to more than half (58%) following the 43rd general election.
Text version of graph "Figure 41: Confidence in Elections Canada"
Post-election, the likelihood of saying they have a great deal of confidence in Elections Canada was lower among:
Having a great deal of confidence in Elections Canada was higher among:
Satisfaction with the way democracy works in Canada increased among electors from the election period survey to the post-election survey: Just over three-quarters (78%) of post-election respondents indicated that they are at least somewhat satisfied with the way democracy works in Canada, including one-third (33%) who are very satisfied (up from 71% and 23% of election period respondents, respectively). By contrast, one in five (20%) expressed some degree of dissatisfaction with this (down from 27% in the election period survey).
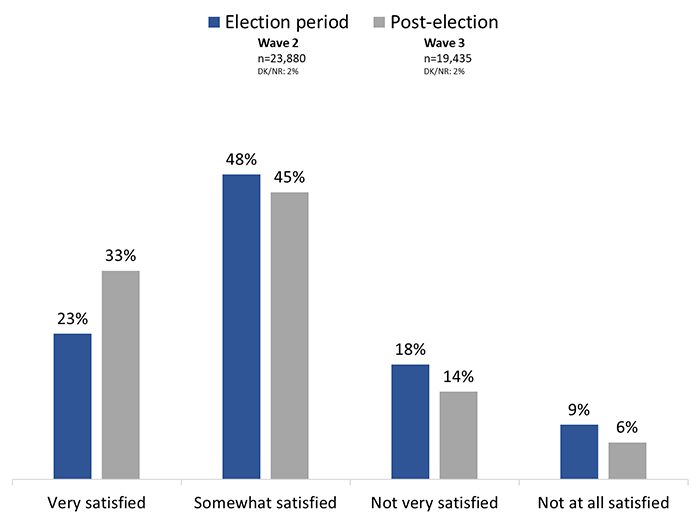
Text version of graph "Figure 42: Satisfaction with the way democracy works in Canada"
Among post-election respondents, satisfaction with the way democracy works in Canada was more likely among the following:
Those less likely to express satisfaction with the way democracy works in Canada include:
In addition, the likelihood of expressing satisfaction with how democracy works in Canada decreased as the severity of a disability increased (from 81% of electors with no disability to 66% of those with a severe/very severe disability).
Dissatisfaction with how democracy works in Canada was more likely among non-voters (31% compared to 19% of voters), along with electors in Alberta (33%) and the Prairies (29%) compared to those elsewhere in Canada. In addition, the likelihood of expressing dissatisfaction with how democracy works in Canada increased with the severity of a disability (from 18% of electors with no disability to 30% of those with a severe/very severe disability).
Return to source of Footnote 4 Official voting results for the 43rd general election: https://www.elections.ca/res/rep/off/ovr2019app/51/table4E.html.
Return to source of Footnote 5 See the Notes to Readers for a discussion on historical over-reporting of voter turnout in public opinion surveys.
Return to source of Footnote 6 The election day phase of the Wave 2 survey corresponds to the final week of the election period, beginning after the close of advance polls.
Return to source of Footnote 7 The 2019 categories of reasons for not voting were lightly modified from the 2015 survey. To the extent possible, 2015 survey results have been adjusted to correspond to the 2019 categories and therefore are slightly different from those published in the 2015 survey report. In addition, proportions may not add up due to rounding or categories being excluded from the table.
Return to source of Footnote 8 In 2015, a single category was used to report reasons of “did not like candidates/parties/campaign” combined with “did not know who to vote for.”
Return to source of Footnote 9 In 2015, reasons related to religious beliefs were included in the broader “other reasons” category.
Return to source of Footnote 10 In 2015, “forgot to vote” was categorized under “everyday life reasons.”
Return to source of Footnote 11 Poll hours across the time zones were as follows: Newfoundland (8:30 a.m. to 8:30 p.m.), Atlantic (8:30 a.m. to 8:30 p.m.), Eastern (9:30 a.m. to 9:30 p.m.), Central (8:30 a.m. to 8:30 p.m.), Mountain (7:30 a.m. to 7:30 p.m.), and Pacific (7:00 a.m. to 7:00 p.m.).
Return to source of Footnote 12 Having a lot of difficulty or higher in a single disability category corresponds to an elector with a moderate to severe disability from just that disability category alone.
Return to source of Footnote 13 Respondents could indicate they had some difficulty performing an activity such as using stairs but were not determined to have a functional disability overall unless they had at least some other difficulty in another area.
Return to source of Footnote 14 Q: Overall, would you say that the building where you voted was…? Base: n=19,270; those who voted in person. [Wave 3]
Return to source of Footnote 15 The sample size for this follow-up question is n=52 phone respondents.
Return to source of Footnote 16 For simplicity, this proportion includes use of the BC Services card, which also includes phone, name, and address.
Return to source of Footnote 17 To establish the method and pieces of ID voters used to meet the identification requirements, the survey asked a series of questions designed to accept the fewest possible pieces of ID needed to satisfy both proof of address and identity requirements, and minimize the over-reporting of pieces that provide only proof of identity that occurred in the 2015 Survey of Electors. The results of the 2019 and 2015 approaches are considered comparable when comparing the proportions that used each of the three ID options; proportions of the use of individual documents are not considered comparable between 2019 and 2015. Across all voter ID questions, base: n=19,417; respondents who voted in the 43rd GE. [DK/NR: 1%] [Wave 2+ Wave 3]
Return to source of Footnote 18 Manitoba and Yukon health cards can also satisfy the proof of address requirement, but use of the health card by voters from these areas was negligible.
Return to source of Footnote 19 To minimize potential over-reporting of use of the VIC as proof of address, mentions of the VIC could only be accepted as an answer if the respondent was already ruled out of using one piece of ID, and then only if they reported receiving and bringing their VIC to the polls.
Return to source of Footnote 20 Q. For this election, did you need information on ... the accessibility of your polling place? … accessible voting tools and services to assist you with voting? Base: n=6,679; electors with a disability. [Wave 3]
Return to source of Footnote 21 Q. Did you use any of the following tools or services to help you vote? Base: voters with disabilities. [DK/NR: <2%] [Wave 3]
Return to source of Footnote 22 Q. When you voted, did someone assist you with marking your ballot? Base: 5,743; voters with a disability. [DK: 1%] [Wave 3]
Return to source of Footnote 23 Q. Voters can choose to be served in either official language, English or French. In which language were you served? Base: n=19,300; voters. [DK/NR: <0.5%] [Wave 3]
Return to source of Footnote 24 Q. Were you satisfied with the official language in which you were served? Base: n=19,250; voters. [DK/NR: <0.5%] [Wave 3]
Return to source of Footnote 25 Some part of this difference can be attributed to a higher proportion of “don’t know” responses to this question among non-voters – 20% of non-voters said they did not know how fairly EC ran the election, compared to 4% of voters.