Report on the Survey of Registered Third Parties for the 43rd General Election: Wave 1 Final Report - Election Issues
Advocacy Activities
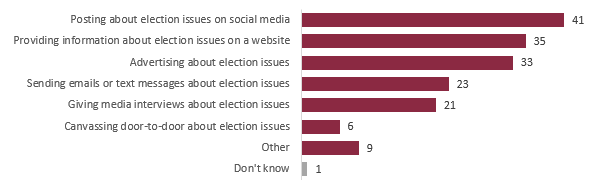
Financial agents were asked which advocacy activities their third party undertook during the election period, selecting all answers that apply in their situation. There was a total of 169 advocacy activities selected by financial agents. The most common activity was posting about election issues on social media (41 out of 55), followed by providing information about election issues on a website (35 out of 55) and advertising about election issues (33 out of 55) (see Figure 43). The least common advocacy activity third parties undertook was canvassing door to door about election issues (6 out of 55).
Figure 43: Advocacy activities undertaken during election period
Q46. Which of the following advocacy activities did your third party undertake during the election period? Please select all that apply. Base: All respondents (n=55)
Text version of "Figure 43: Advocacy activities undertaken during election period"
The horizontal bar chart above displays the number of respondents who undertook various advocacy activities during the election period. The breakdown is as follows:
Posting about election issues on social media: 41
Providing information about election issues on a website: 35
Advertising about election issues: 33
Sending emails or text messages about election issues: 23
Giving media interviews about election issues: 21
Canvassing door-to-door about election issues: 6
Other: 9
Don't know: 1
Election Issues and Advertising
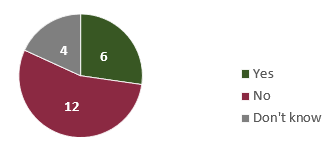
Financial agents whose third party did not advertise about election issues were asked if their third party considered doing so. Over half (12 out of 22) said they did not consider advertising about election issues, about a quarter (6 out of 22) did consider it and almost a fifth (4 out of 22) did not know (see Figure 44).
Figure 44: Consideration of advertising about election issues
Q47. Did your third party consider advertising about election issues? Base: Respondents who did not undertake "Advertising about election issues" during the election period (n=22)
Text version of "Figure 44: Consideration of advertising about election issues"
The pie chart above displays the number of respondents who considered or did not consider advertising about election issues. The breakdown is as follows:
Yes: 6
No: 12
Don't know: 4
The six financial agents who said their third party did consider advertising about election issues, but ultimately decided not to, were further asked what made their third party decide not to advertise. All six financial agents said they did not know.footnote 1
Q48. What made your third party decide not to advertise about election issues? (Open-ended) Base: Respondents who said they considered advertising about election issues (n=6).
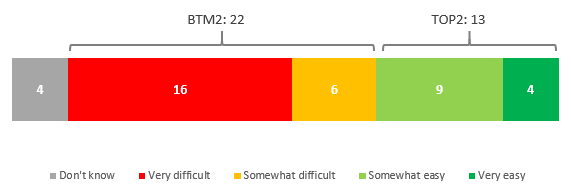
Those who did advertise about election issues or considered doing so were asked about the ease of figuring out whether the issues they wanted to advertise about were election issues. Over half (22 out of 39) said it was difficult to figure out if they were election issues (see Figure 45). About four in ten (16 out of 39) said it was very difficult, and about one in seven (6 out of 39) said it was somewhat difficult. In contrast, a third (13 out of 39) said it was easy to figure out if the issues they wanted to advertise about were election issues. About a quarter (9 out of 39) said it was somewhat easy, and one in ten (4 out of 39) said it was very easy.
Figure 45: Ease of figuring out if issues wanted to advertise about were election issues
Q49. How easy or difficult was it to figure out whether the issues you wanted to advertise about were election issues; that is, associated with a party or candidate, even if they are not mentioned? Base: Respondents who undertook "Advertising about election issues" during the election period or considered advertising about election issues (n=39)
Text version of "Figure 45: Ease of figuring out if issues wanted to advertise about were election issues"
The stacked horizontal bar chart above displays the respondents' reported level of ease of figuring whether the issues they wanted to advertise about were election issues. The breakdown is as follows:
Don't know: 4
Very difficult: 16
Somewhat difficult: 6
Somewhat easy: 9
Very easy: 4
BTM2: 22
TOP2: 13
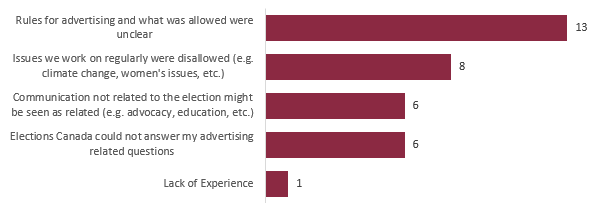
Of the 22 financial agents who said it was difficult to figure out whether the issues they wanted to advertise about were election issues, there were a total of 34 mentions for what made it difficult. The most common response was that the rules for advertising and what was allowed were not clear (13 out of 22), followed by the perception that the issues they worked on regularly were disallowed (e.g. climate change, women's issues) (8 out of 22) (see Figure 46).
Figure 46: Reasons why it was difficult to figure out whether the issues wanted to advertise about were election issues
Q50. What made it difficult to figure out whether the issues you wanted to advertise about were election issues? (Open-ended) Base: Respondents who said it was "very difficult" or "somewhat difficult" to figure out whether the issues wanted to advertise about were election issues (n=22)
Text version of "Figure 46: Reasons why it was difficult to figure out whether the issues wanted to advertise about were election issues"
The horizontal bar chart above displays the number of respondents who named reasons for what made it difficult to figure out whether the issues they wanted to advertise about were election issues. The breakdown is as follows:
Rules for advertising and what was allowed were unclear: 13
Issues we work on regularly were disallowed (e.g. climate change, women's issues, etc.): 8
Communication not related to the election might be seen as related (e.g. advocacy, education, etc.): 6
Elections Canada could not answer my advertising related questions: 6
Lack of experience: 1
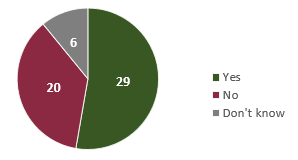
When asked if they contacted Elections Canada to seek any clarification regarding advertising about election issues, most financial agents said they did (29 out of 55), about a third (20 out of 55) said they did not, and about one in ten (6 out of 55) said they did not know (see Figure 47).
Figure 47: Elections Canada contact to seek clarification regarding advertising about election issues
Q51. Did you contact Elections Canada to seek any clarification regarding advertising about election issues? Base: All respondents (n=55)
Text version of "Figure 47: Elections Canada contact to seek clarification regarding advertising about election issues"
The pie chart above displays the number of respondents who did and did not contact Elections Canada to seek clarification regarding advertising about election issues. The breakdown is as follows:
Yes: 29
No: 20
Don't know: 6
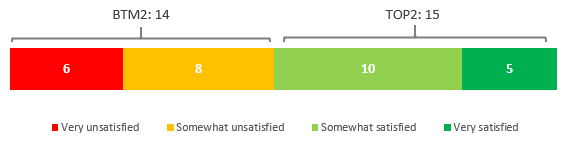
For those who did contact Elections Canada to seek clarification, financial agents were quite split about whether they were satisfied with the help they received (see Figure 48). A little over half (15 out of 29) said they were satisfied with the help. Over a third (10 out of 29) said they were somewhat satisfied, and one in six (5 out of 29) said they were very satisfied. However, a little less than half (14 out of 29) said they were unsatisfied with the help they received. About three in ten (8 out of 29) said they were somewhat unsatisfied with the help, and about a fifth (6 out of 29) said they were very unsatisfied.
Figure 48: Satisfaction with help received from Elections Canada regarding advertising about elections issues
Q52. How satisfied were you with the help you received from Elections Canada regarding advertising about election issues?
Base: Respondents who sought clarification from Elections Canada regarding advertising about election issues (n=29)
Text version of "Figure 48: Satisfaction with help received from Elections Canada regarding advertising about elections issues"
The stacked horizontal bar chart above displays the respondents' reported level of satisfaction with the help they received from Elections Canada regarding advertising about election issues. The breakdown is as follows:
Very unsatisfied: 6
Somewhat unsatisfied: 8
Somewhat satisfied: 10
Very satisfied: 5
BTM2: 14
TOP2: 15
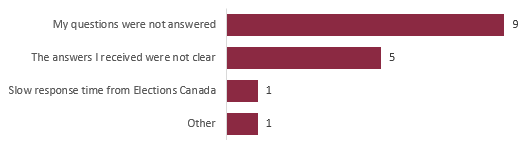
Financial agents who said they were unsatisfied with the help mostly said it was because their questions were not answered (e.g. they got transferred, had to decide themselves) (9 out of 16) (see Figure 49). Another common reason they mentioned was that the answers they received were unclear (e.g. ambiguous, inconsistent, general and/or vague) (5 out of 16). This question was asked to 14 financial agents; there were a total of 16 mentions provided by the respondents.footnote 2
Figure 49: Reasons unsatisfied with advertising-related help
Q53. What caused you to be unsatisfied? (Open-ended) Base: Respondents who said they were "very unsatisfied" or "somewhat satisfied" with the help received from Elections Canada regarding advertising about election issues (n=14)
Text version of "Figure 49: Reasons unsatisfied with advertising-related help"
The horizontal bar chart above displays the number of respondents who named reasons that caused them to be unsatisfied with help related to advertising. The breakdown is as follows: